Delhi Hills, OH Map & Demographics
Delhi Hills Map
Delhi Hills Overview
$43,220
PER CAPITA INCOME
$106,797
AVG FAMILY INCOME
$94,023
AVG HOUSEHOLD INCOME
23.6%
WAGE / INCOME GAP [ % ]
76.4¢/ $1
WAGE / INCOME GAP [ $ ]
$7,747
FAMILY INCOME DEFICIT
0.41
INEQUALITY / GINI INDEX
5,098
TOTAL POPULATION
2,521
MALE POPULATION
2,577
FEMALE POPULATION
97.83
MALES / 100 FEMALES
102.22
FEMALES / 100 MALES
40.1
MEDIAN AGE
3.0
AVG FAMILY SIZE
2.7
AVG HOUSEHOLD SIZE
2,872
LABOR FORCE [ PEOPLE ]
70.4%
PERCENT IN LABOR FORCE
2.4%
UNEMPLOYMENT RATE
Income in Delhi Hills
Income Overview in Delhi Hills
Per Capita Income in Delhi Hills is $43,220, while median incomes of families and households are $106,797 and $94,023 respectively.
| Characteristic | Number | Measure |
| Per Capita Income | 5,098 | $43,220 |
| Median Family Income | 1,523 | $106,797 |
| Mean Family Income | 1,523 | $135,027 |
| Median Household Income | 1,863 | $94,023 |
| Mean Household Income | 1,863 | $123,287 |
| Income Deficit | 1,523 | $7,747 |
| Wage / Income Gap (%) | 5,098 | 23.64% |
| Wage / Income Gap ($) | 5,098 | 76.36¢ per $1 |
| Gini / Inequality Index | 5,098 | 0.41 |
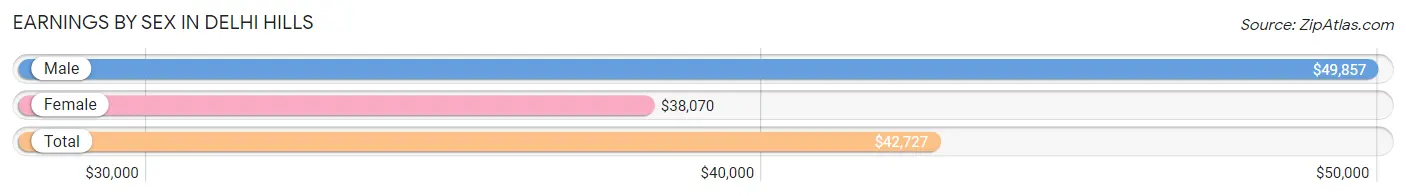
Earnings by Sex in Delhi Hills
Average Earnings in Delhi Hills are $42,727, $49,857 for men and $38,070 for women, a difference of 23.6%.
| Sex | Number | Average Earnings |
| Male | 1,618 (53.9%) | $49,857 |
| Female | 1,382 (46.1%) | $38,070 |
| Total | 3,000 (100.0%) | $42,727 |
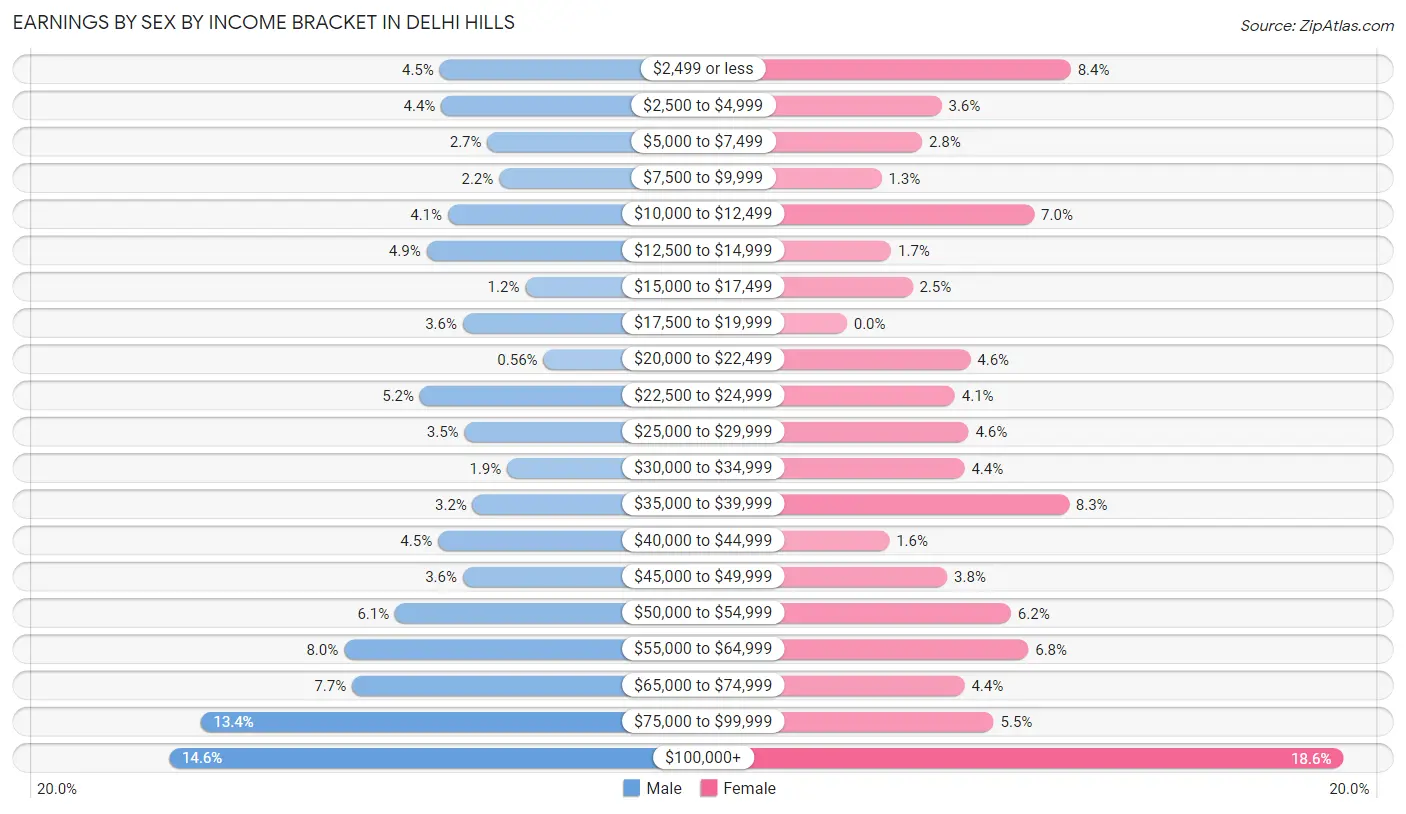
Earnings by Sex by Income Bracket in Delhi Hills
The most common earnings brackets in Delhi Hills are $100,000+ for men (236 | 14.6%) and $100,000+ for women (257 | 18.6%).
| Income | Male | Female |
| $2,499 or less | 72 (4.4%) | 116 (8.4%) |
| $2,500 to $4,999 | 71 (4.4%) | 49 (3.5%) |
| $5,000 to $7,499 | 43 (2.7%) | 39 (2.8%) |
| $7,500 to $9,999 | 36 (2.2%) | 18 (1.3%) |
| $10,000 to $12,499 | 67 (4.1%) | 97 (7.0%) |
| $12,500 to $14,999 | 80 (4.9%) | 23 (1.7%) |
| $15,000 to $17,499 | 20 (1.2%) | 34 (2.5%) |
| $17,500 to $19,999 | 58 (3.6%) | 0 (0.0%) |
| $20,000 to $22,499 | 9 (0.6%) | 64 (4.6%) |
| $22,500 to $24,999 | 84 (5.2%) | 56 (4.1%) |
| $25,000 to $29,999 | 57 (3.5%) | 63 (4.6%) |
| $30,000 to $34,999 | 31 (1.9%) | 61 (4.4%) |
| $35,000 to $39,999 | 52 (3.2%) | 115 (8.3%) |
| $40,000 to $44,999 | 73 (4.5%) | 22 (1.6%) |
| $45,000 to $49,999 | 58 (3.6%) | 52 (3.8%) |
| $50,000 to $54,999 | 99 (6.1%) | 85 (6.1%) |
| $55,000 to $64,999 | 130 (8.0%) | 94 (6.8%) |
| $65,000 to $74,999 | 125 (7.7%) | 61 (4.4%) |
| $75,000 to $99,999 | 217 (13.4%) | 76 (5.5%) |
| $100,000+ | 236 (14.6%) | 257 (18.6%) |
| Total | 1,618 (100.0%) | 1,382 (100.0%) |
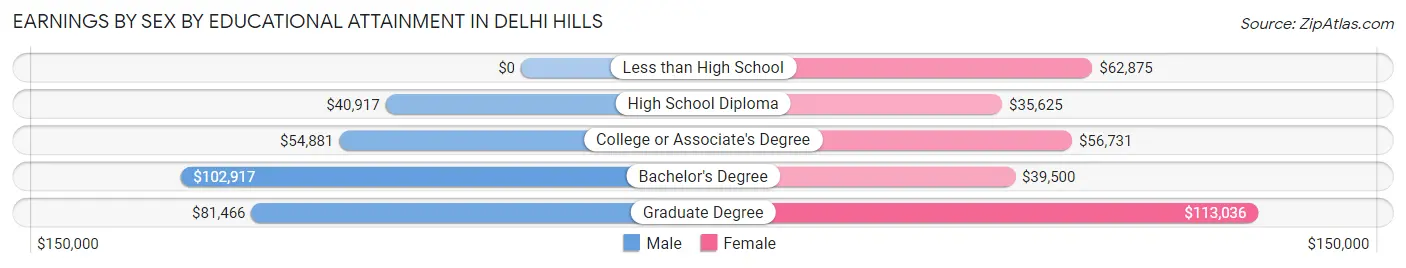
Earnings by Sex by Educational Attainment in Delhi Hills
Average earnings in Delhi Hills are $56,875 for men and $52,855 for women, a difference of 7.1%. Men with an educational attainment of bachelor's degree enjoy the highest average annual earnings of $102,917, while those with high school diploma education earn the least with $40,917. Women with an educational attainment of graduate degree earn the most with the average annual earnings of $113,036, while those with high school diploma education have the smallest earnings of $35,625.
| Educational Attainment | Male Income | Female Income |
| Less than High School | - | - |
| High School Diploma | $40,917 | $35,625 |
| College or Associate's Degree | $54,881 | $56,731 |
| Bachelor's Degree | $102,917 | $39,500 |
| Graduate Degree | $81,466 | $113,036 |
| Total | $56,875 | $52,855 |
Family Income in Delhi Hills
Family Income Brackets in Delhi Hills
According to the Delhi Hills family income data, there are 442 families falling into the $100,000 to $149,999 income range, which is the most common income bracket and makes up 29.0% of all families. Conversely, the $10,000 to $14,999 income bracket is the least frequent group with only 9 families (0.6%) belonging to this category.
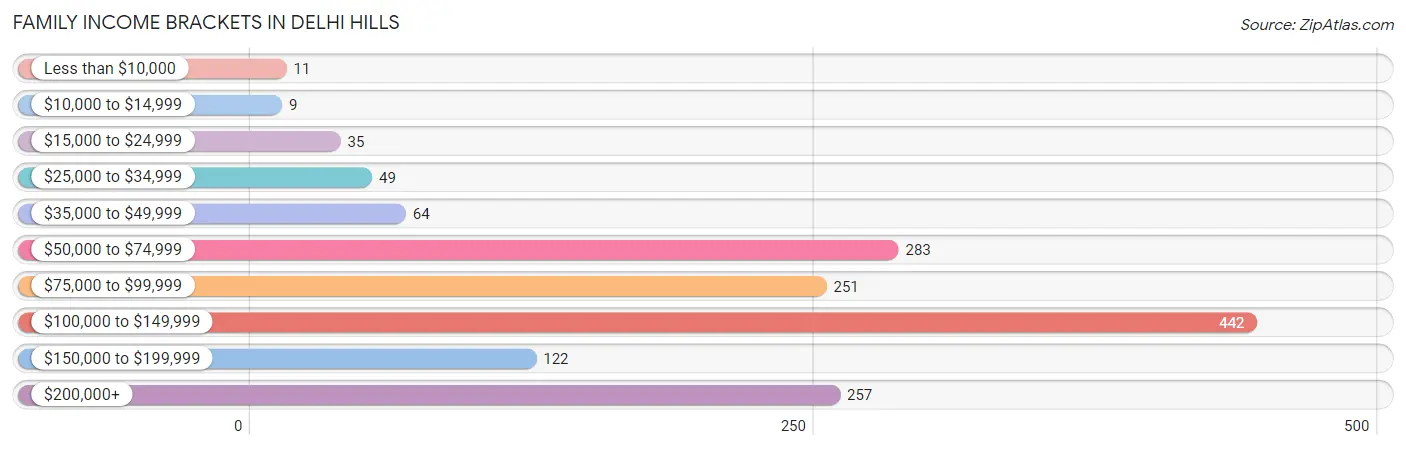
| Income Bracket | # Families | % Families |
| Less than $10,000 | 11 | 0.7% |
| $10,000 to $14,999 | 9 | 0.6% |
| $15,000 to $24,999 | 35 | 2.3% |
| $25,000 to $34,999 | 49 | 3.2% |
| $35,000 to $49,999 | 64 | 4.2% |
| $50,000 to $74,999 | 283 | 18.6% |
| $75,000 to $99,999 | 251 | 16.5% |
| $100,000 to $149,999 | 442 | 29.0% |
| $150,000 to $199,999 | 122 | 8.0% |
| $200,000+ | 257 | 16.9% |
Family Income by Famaliy Size in Delhi Hills
5-person families (180 | 11.8%) account for the highest median family income in Delhi Hills with $142,500 per family, while 2-person families (677 | 44.5%) have the highest median income of $39,375 per family member.
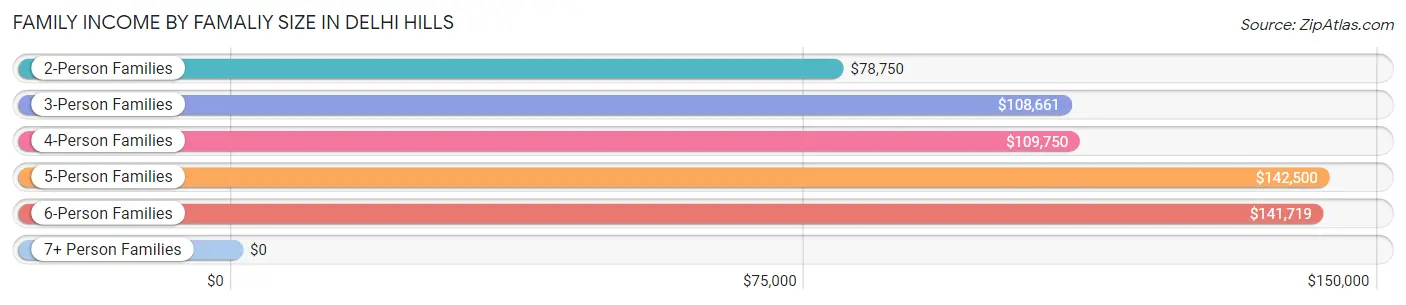
| Income Bracket | # Families | Median Income |
| 2-Person Families | 677 (44.5%) | $78,750 |
| 3-Person Families | 307 (20.2%) | $108,661 |
| 4-Person Families | 326 (21.4%) | $109,750 |
| 5-Person Families | 180 (11.8%) | $142,500 |
| 6-Person Families | 33 (2.2%) | $141,719 |
| 7+ Person Families | 0 (0.0%) | $0 |
| Total | 1,523 (100.0%) | $106,797 |
Family Income by Number of Earners in Delhi Hills
The median family income in Delhi Hills is $106,797, with families comprising 3+ earners (311) having the highest median family income of $147,813, while families with no earners (128) have the lowest median family income of $59,762, accounting for 20.4% and 8.4% of families, respectively.
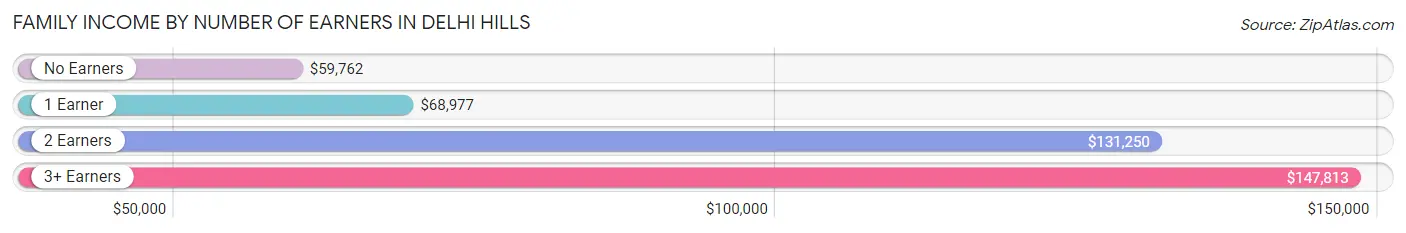
| Number of Earners | # Families | Median Income |
| No Earners | 128 (8.4%) | $59,762 |
| 1 Earner | 494 (32.4%) | $68,977 |
| 2 Earners | 590 (38.7%) | $131,250 |
| 3+ Earners | 311 (20.4%) | $147,813 |
| Total | 1,523 (100.0%) | $106,797 |
Household Income in Delhi Hills
Household Income Brackets in Delhi Hills
With 464 households falling in the category, the $100,000 to $149,999 income range is the most frequent in Delhi Hills, accounting for 24.9% of all households. In contrast, only 9 households (0.5%) fall into the $10,000 to $14,999 income bracket, making it the least populous group.
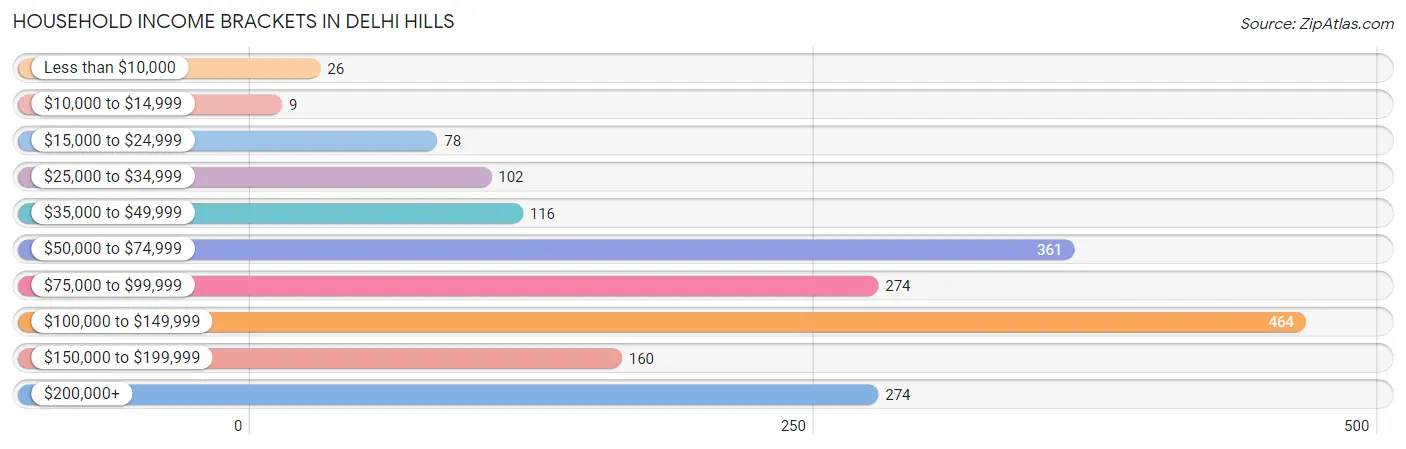
| Income Bracket | # Households | % Households |
| Less than $10,000 | 26 | 1.4% |
| $10,000 to $14,999 | 9 | 0.5% |
| $15,000 to $24,999 | 78 | 4.2% |
| $25,000 to $34,999 | 102 | 5.5% |
| $35,000 to $49,999 | 116 | 6.2% |
| $50,000 to $74,999 | 361 | 19.4% |
| $75,000 to $99,999 | 274 | 14.7% |
| $100,000 to $149,999 | 464 | 24.9% |
| $150,000 to $199,999 | 160 | 8.6% |
| $200,000+ | 274 | 14.7% |
Household Income by Householder Age in Delhi Hills
The median household income in Delhi Hills is $94,023, with the highest median household income of $116,641 found in the 25 to 44 years age bracket for the primary householder. A total of 475 households (25.5%) fall into this category. Meanwhile, the 15 to 24 years age bracket for the primary householder has the lowest median household income of $0, with 24 households (1.3%) in this group.
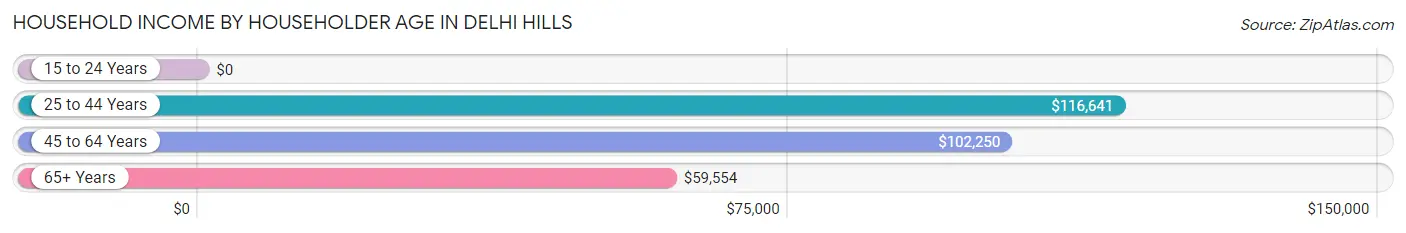
| Income Bracket | # Households | Median Income |
| 15 to 24 Years | 24 (1.3%) | $0 |
| 25 to 44 Years | 475 (25.5%) | $116,641 |
| 45 to 64 Years | 919 (49.3%) | $102,250 |
| 65+ Years | 445 (23.9%) | $59,554 |
| Total | 1,863 (100.0%) | $94,023 |
Poverty in Delhi Hills
Income Below Poverty by Sex and Age in Delhi Hills
With 2.6% poverty level for males and 3.3% for females among the residents of Delhi Hills, 75 year old and over males and 18 to 24 year old females are the most vulnerable to poverty, with 10 males (10.3%) and 38 females (22.2%) in their respective age groups living below the poverty level.
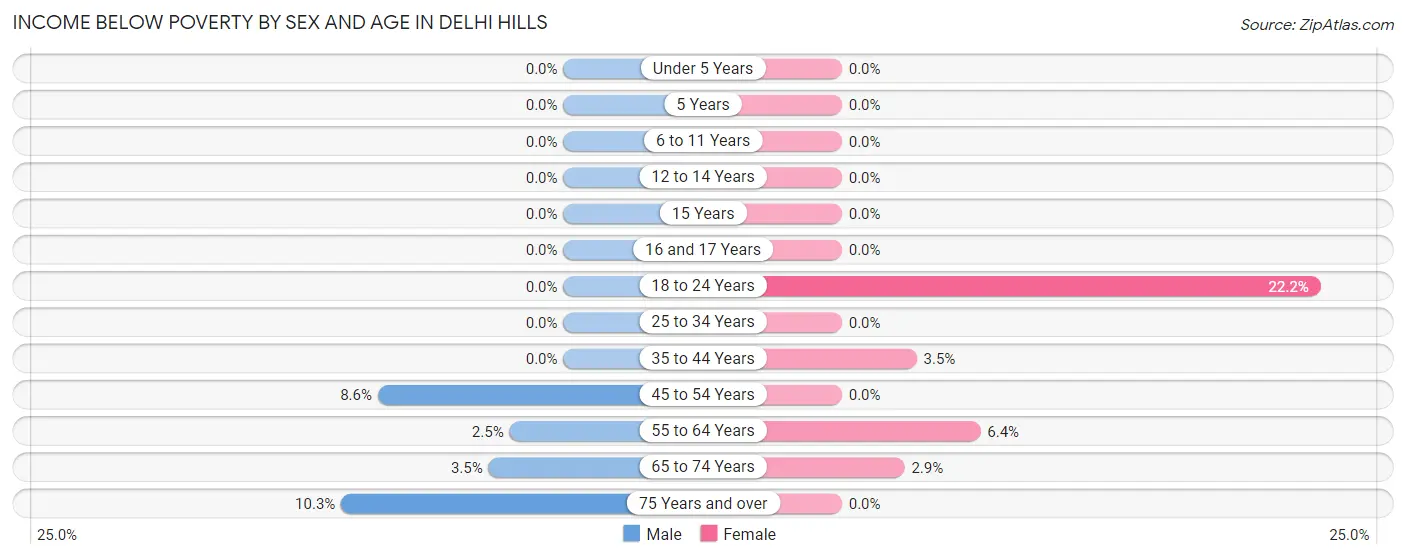
| Age Bracket | Male | Female |
| Under 5 Years | 0 (0.0%) | 0 (0.0%) |
| 5 Years | 0 (0.0%) | 0 (0.0%) |
| 6 to 11 Years | 0 (0.0%) | 0 (0.0%) |
| 12 to 14 Years | 0 (0.0%) | 0 (0.0%) |
| 15 Years | 0 (0.0%) | 0 (0.0%) |
| 16 and 17 Years | 0 (0.0%) | 0 (0.0%) |
| 18 to 24 Years | 0 (0.0%) | 38 (22.2%) |
| 25 to 34 Years | 0 (0.0%) | 0 (0.0%) |
| 35 to 44 Years | 0 (0.0%) | 13 (3.5%) |
| 45 to 54 Years | 36 (8.6%) | 0 (0.0%) |
| 55 to 64 Years | 9 (2.5%) | 25 (6.4%) |
| 65 to 74 Years | 10 (3.5%) | 8 (2.9%) |
| 75 Years and over | 10 (10.3%) | 0 (0.0%) |
| Total | 65 (2.6%) | 84 (3.3%) |
Income Above Poverty by Sex and Age in Delhi Hills
According to the poverty statistics in Delhi Hills, males aged under 5 years and females aged under 5 years are the age groups that are most secure financially, with 100.0% of males and 100.0% of females in these age groups living above the poverty line.
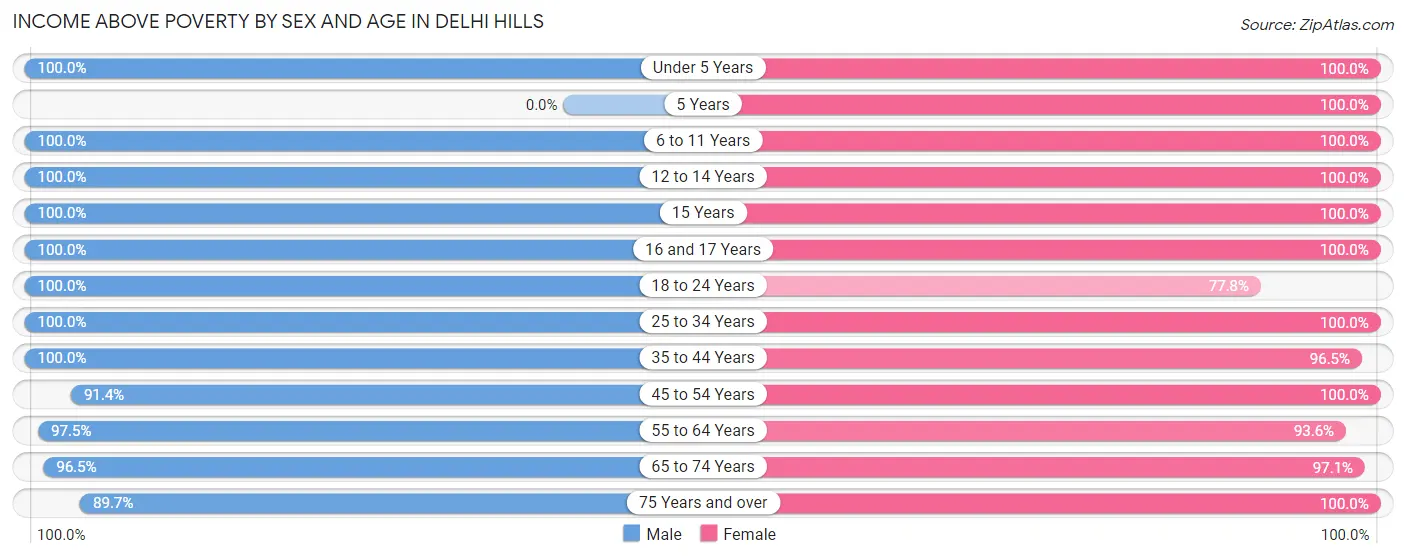
| Age Bracket | Male | Female |
| Under 5 Years | 191 (100.0%) | 115 (100.0%) |
| 5 Years | 0 (0.0%) | 47 (100.0%) |
| 6 to 11 Years | 193 (100.0%) | 192 (100.0%) |
| 12 to 14 Years | 83 (100.0%) | 130 (100.0%) |
| 15 Years | 18 (100.0%) | 50 (100.0%) |
| 16 and 17 Years | 60 (100.0%) | 137 (100.0%) |
| 18 to 24 Years | 282 (100.0%) | 133 (77.8%) |
| 25 to 34 Years | 222 (100.0%) | 221 (100.0%) |
| 35 to 44 Years | 309 (100.0%) | 362 (96.5%) |
| 45 to 54 Years | 382 (91.4%) | 383 (100.0%) |
| 55 to 64 Years | 351 (97.5%) | 364 (93.6%) |
| 65 to 74 Years | 278 (96.5%) | 267 (97.1%) |
| 75 Years and over | 87 (89.7%) | 92 (100.0%) |
| Total | 2,456 (97.4%) | 2,493 (96.7%) |
Income Below Poverty Among Married-Couple Families in Delhi Hills
The poverty statistics for married-couple families in Delhi Hills show that 2.7% or 36 of the total 1,312 families live below the poverty line. Families with no children have the highest poverty rate of 4.8%, comprising of 36 families. On the other hand, families with 1 or 2 children have the lowest poverty rate of 0.0%, which includes 0 families.
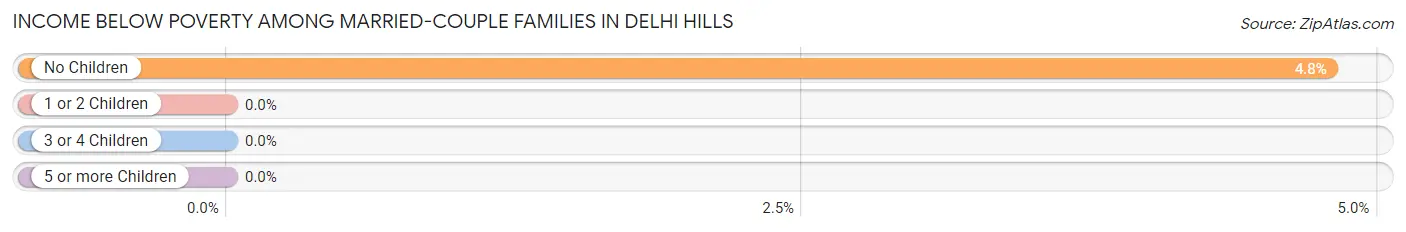
| Children | Above Poverty | Below Poverty |
| No Children | 716 (95.2%) | 36 (4.8%) |
| 1 or 2 Children | 486 (100.0%) | 0 (0.0%) |
| 3 or 4 Children | 74 (100.0%) | 0 (0.0%) |
| 5 or more Children | 0 (0.0%) | 0 (0.0%) |
| Total | 1,276 (97.3%) | 36 (2.7%) |
Income Below Poverty Among Single-Parent Households in Delhi Hills
| Children | Single Father | Single Mother |
| No Children | 0 (0.0%) | 0 (0.0%) |
| 1 or 2 Children | 0 (0.0%) | 0 (0.0%) |
| 3 or 4 Children | 0 (0.0%) | 0 (0.0%) |
| 5 or more Children | 0 (0.0%) | 0 (0.0%) |
| Total | 0 (0.0%) | 0 (0.0%) |
Income Below Poverty Among Married-Couple vs Single-Parent Households in Delhi Hills
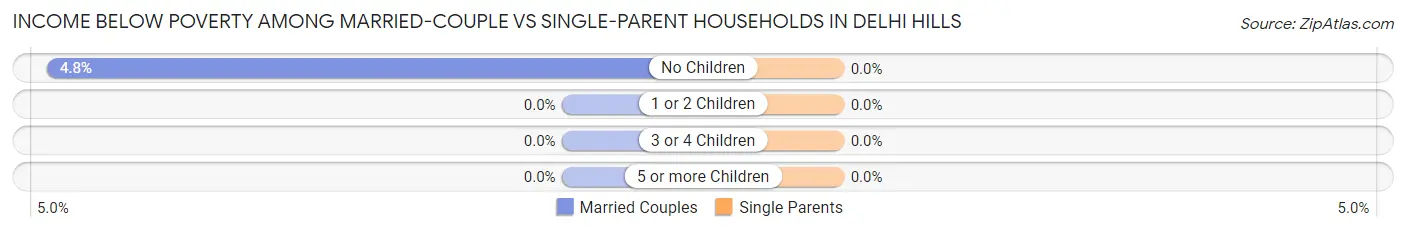
| Children | Married-Couple Families | Single-Parent Households |
| No Children | 36 (4.8%) | 0 (0.0%) |
| 1 or 2 Children | 0 (0.0%) | 0 (0.0%) |
| 3 or 4 Children | 0 (0.0%) | 0 (0.0%) |
| 5 or more Children | 0 (0.0%) | 0 (0.0%) |
| Total | 36 (2.7%) | 0 (0.0%) |
Race in Delhi Hills
The most populous races in Delhi Hills are White / Caucasian (4,775 | 93.7%), Two or more Races (147 | 2.9%), and Asian (90 | 1.8%).
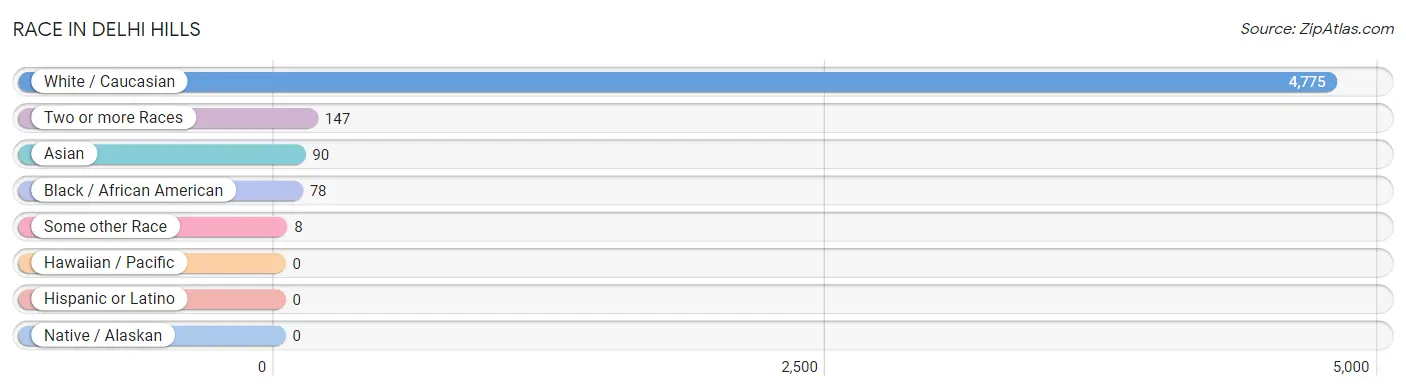
| Race | # Population | % Population |
| Asian | 90 | 1.8% |
| Black / African American | 78 | 1.5% |
| Hawaiian / Pacific | 0 | 0.0% |
| Hispanic or Latino | 0 | 0.0% |
| Native / Alaskan | 0 | 0.0% |
| White / Caucasian | 4,775 | 93.7% |
| Two or more Races | 147 | 2.9% |
| Some other Race | 8 | 0.2% |
| Total | 5,098 | 100.0% |
Ancestry in Delhi Hills
The most populous ancestries reported in Delhi Hills are German (2,414 | 47.3%), Irish (1,060 | 20.8%), Italian (338 | 6.6%), American (314 | 6.2%), and English (273 | 5.4%), together accounting for 86.3% of all Delhi Hills residents.
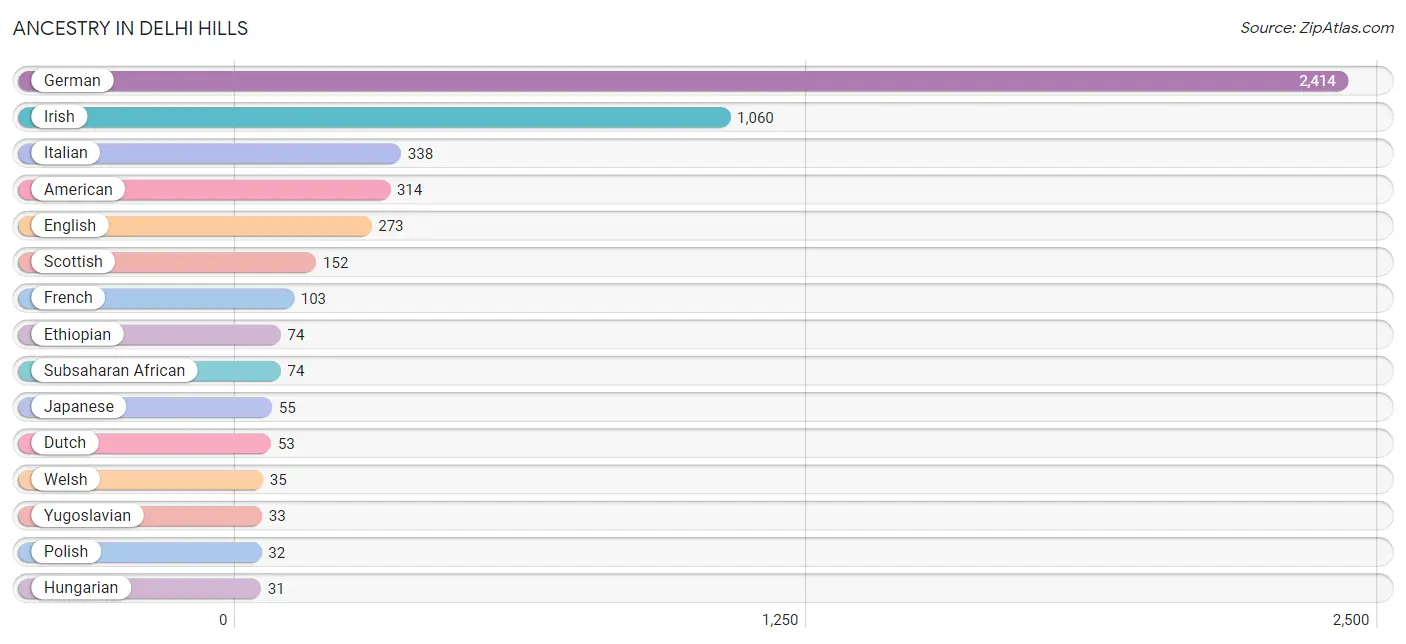
| Ancestry | # Population | % Population |
| American | 314 | 6.2% |
| Arab | 28 | 0.5% |
| Belgian | 7 | 0.1% |
| British | 12 | 0.2% |
| Burmese | 10 | 0.2% |
| Cherokee | 6 | 0.1% |
| Dutch | 53 | 1.0% |
| English | 273 | 5.4% |
| Ethiopian | 74 | 1.5% |
| Finnish | 18 | 0.4% |
| French | 103 | 2.0% |
| German | 2,414 | 47.3% |
| Hungarian | 31 | 0.6% |
| Indian (Asian) | 12 | 0.2% |
| Irish | 1,060 | 20.8% |
| Italian | 338 | 6.6% |
| Japanese | 55 | 1.1% |
| Lebanese | 19 | 0.4% |
| Malaysian | 25 | 0.5% |
| Moroccan | 9 | 0.2% |
| Norwegian | 13 | 0.3% |
| Polish | 32 | 0.6% |
| Scotch-Irish | 29 | 0.6% |
| Scottish | 152 | 3.0% |
| Subsaharan African | 74 | 1.5% |
| Swedish | 11 | 0.2% |
| Welsh | 35 | 0.7% |
| Yugoslavian | 33 | 0.6% | View All 28 Rows |
Immigrants in Delhi Hills
The most numerous immigrant groups reported in Delhi Hills came from Asia (70 | 1.4%), South Eastern Asia (61 | 1.2%), Europe (40 | 0.8%), Cambodia (36 | 0.7%), and Bosnia and Herzegovina (33 | 0.6%), together accounting for 4.7% of all Delhi Hills residents.
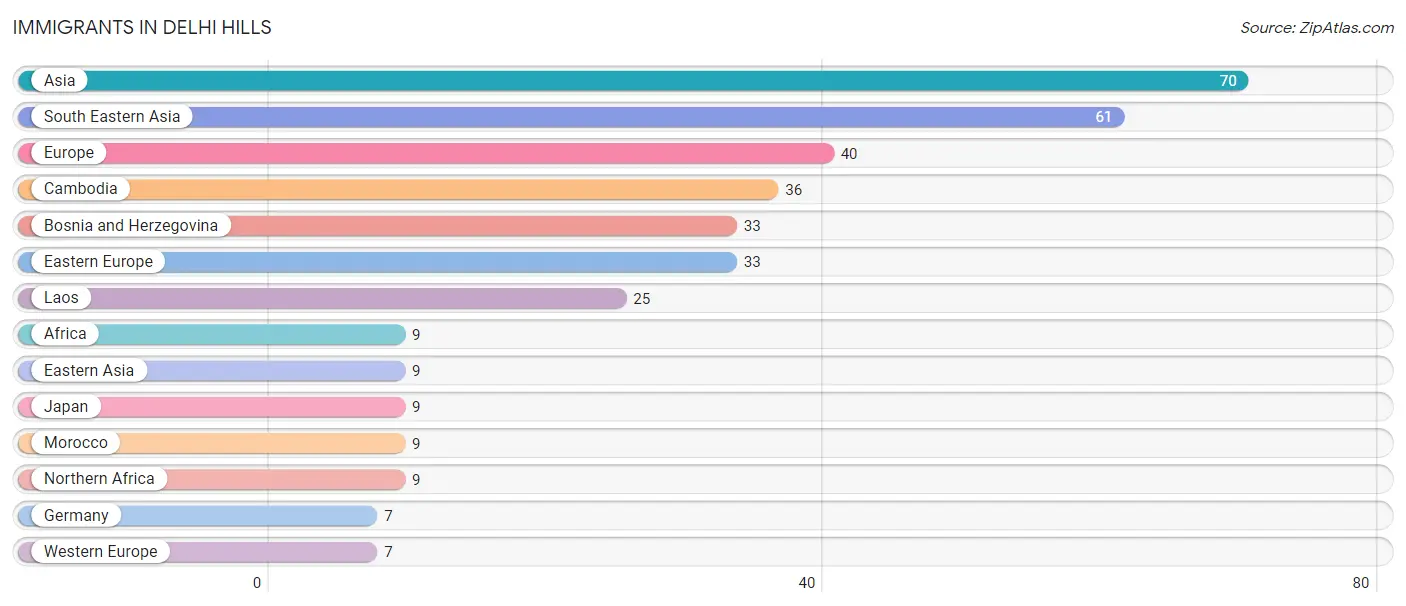
| Immigration Origin | # Population | % Population |
| Africa | 9 | 0.2% |
| Asia | 70 | 1.4% |
| Bosnia and Herzegovina | 33 | 0.6% |
| Cambodia | 36 | 0.7% |
| Eastern Asia | 9 | 0.2% |
| Eastern Europe | 33 | 0.6% |
| Europe | 40 | 0.8% |
| Germany | 7 | 0.1% |
| Japan | 9 | 0.2% |
| Laos | 25 | 0.5% |
| Morocco | 9 | 0.2% |
| Northern Africa | 9 | 0.2% |
| South Eastern Asia | 61 | 1.2% |
| Western Europe | 7 | 0.1% | View All 14 Rows |
Sex and Age in Delhi Hills
Sex and Age in Delhi Hills
The most populous age groups in Delhi Hills are 20 to 24 Years (232 | 9.2%) for men and 50 to 54 Years (293 | 11.4%) for women.
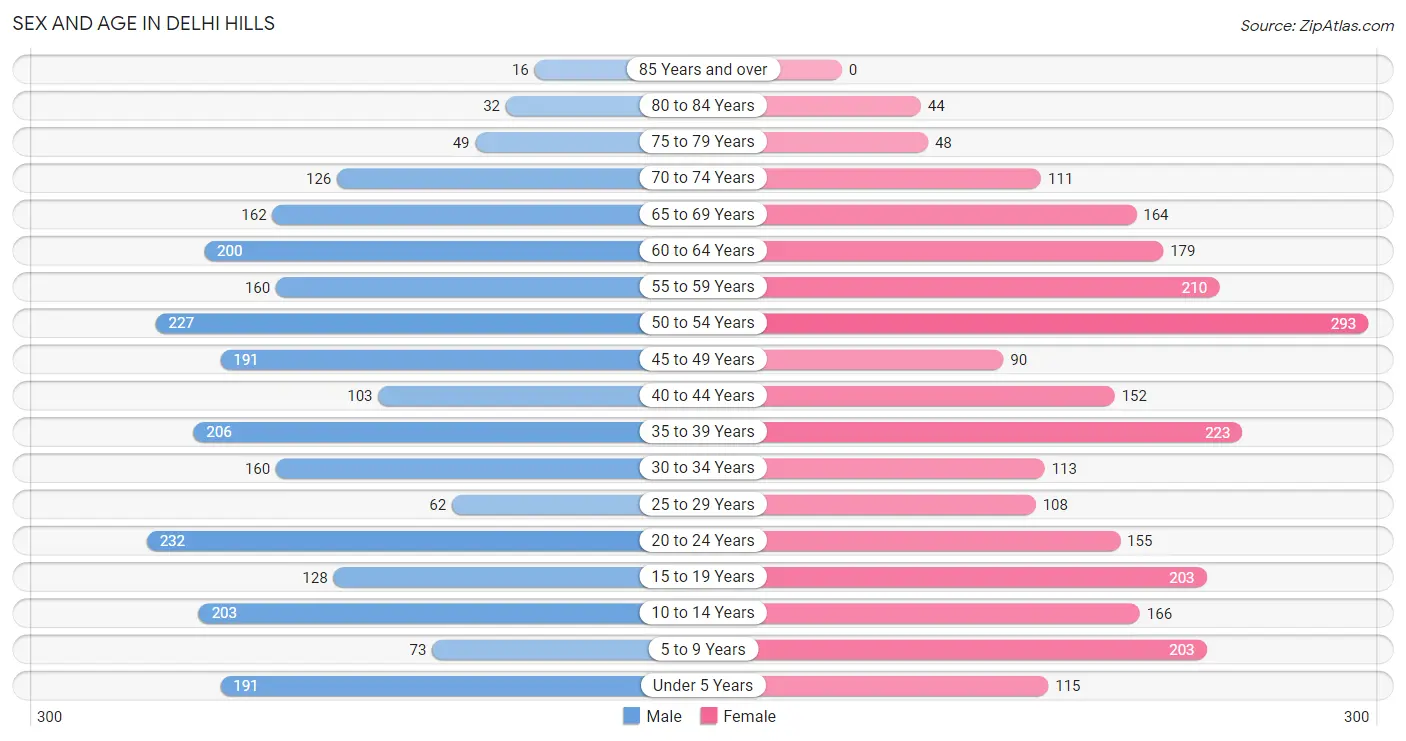
| Age Bracket | Male | Female |
| Under 5 Years | 191 (7.6%) | 115 (4.5%) |
| 5 to 9 Years | 73 (2.9%) | 203 (7.9%) |
| 10 to 14 Years | 203 (8.1%) | 166 (6.4%) |
| 15 to 19 Years | 128 (5.1%) | 203 (7.9%) |
| 20 to 24 Years | 232 (9.2%) | 155 (6.0%) |
| 25 to 29 Years | 62 (2.5%) | 108 (4.2%) |
| 30 to 34 Years | 160 (6.4%) | 113 (4.4%) |
| 35 to 39 Years | 206 (8.2%) | 223 (8.6%) |
| 40 to 44 Years | 103 (4.1%) | 152 (5.9%) |
| 45 to 49 Years | 191 (7.6%) | 90 (3.5%) |
| 50 to 54 Years | 227 (9.0%) | 293 (11.4%) |
| 55 to 59 Years | 160 (6.4%) | 210 (8.2%) |
| 60 to 64 Years | 200 (7.9%) | 179 (7.0%) |
| 65 to 69 Years | 162 (6.4%) | 164 (6.4%) |
| 70 to 74 Years | 126 (5.0%) | 111 (4.3%) |
| 75 to 79 Years | 49 (1.9%) | 48 (1.9%) |
| 80 to 84 Years | 32 (1.3%) | 44 (1.7%) |
| 85 Years and over | 16 (0.6%) | 0 (0.0%) |
| Total | 2,521 (100.0%) | 2,577 (100.0%) |
Families and Households in Delhi Hills
Median Family Size in Delhi Hills
The median family size in Delhi Hills is 3.05 persons per family, with married-couple families (1,312 | 86.2%) accounting for the largest median family size of 3.05 persons per family. On the other hand, single male/father families (119 | 7.8%) represent the smallest median family size with 3.03 persons per family.
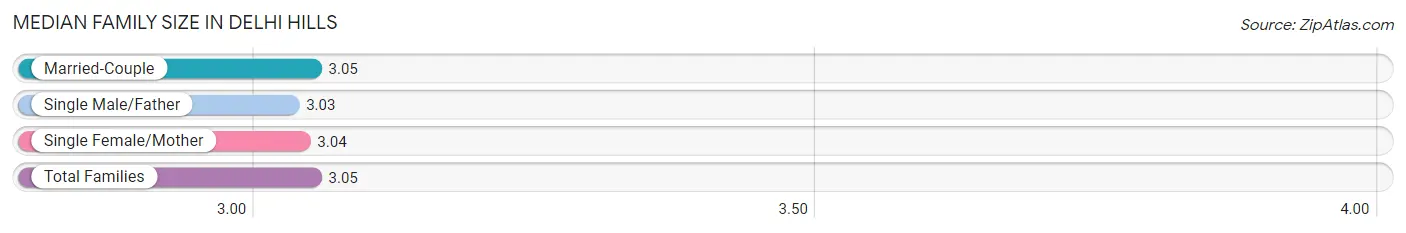
| Family Type | # Families | Family Size |
| Married-Couple | 1,312 (86.2%) | 3.05 |
| Single Male/Father | 119 (7.8%) | 3.03 |
| Single Female/Mother | 92 (6.0%) | 3.04 |
| Total Families | 1,523 (100.0%) | 3.05 |
Median Household Size in Delhi Hills
The median household size in Delhi Hills is 2.74 persons per household, with single male/father households (119 | 6.4%) accounting for the largest median household size of 3.45 persons per household. non-family households (340 | 18.2%) represent the smallest median household size with 1.14 persons per household.
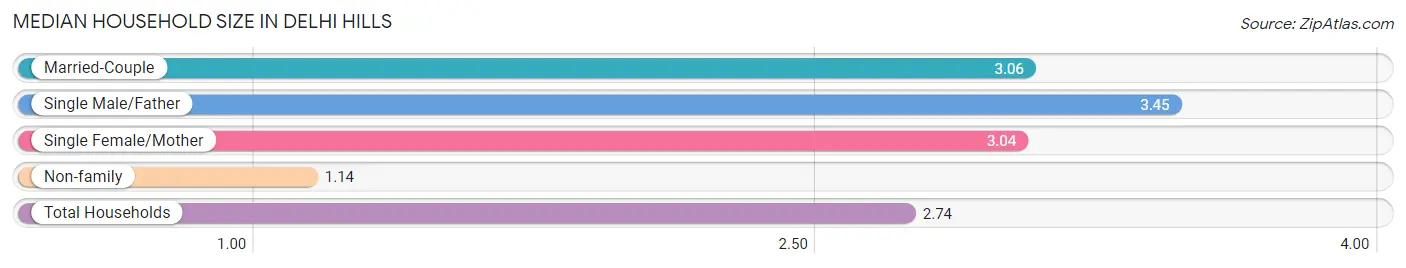
| Household Type | # Households | Household Size |
| Married-Couple | 1,312 (70.4%) | 3.06 |
| Single Male/Father | 119 (6.4%) | 3.45 |
| Single Female/Mother | 92 (4.9%) | 3.04 |
| Non-family | 340 (18.2%) | 1.14 |
| Total Households | 1,863 (100.0%) | 2.74 |
Household Size by Marriage Status in Delhi Hills
Out of a total of 1,863 households in Delhi Hills, 1,523 (81.8%) are family households, while 340 (18.2%) are nonfamily households. The most numerous type of family households are 2-person households, comprising 645, and the most common type of nonfamily households are 1-person households, comprising 291.
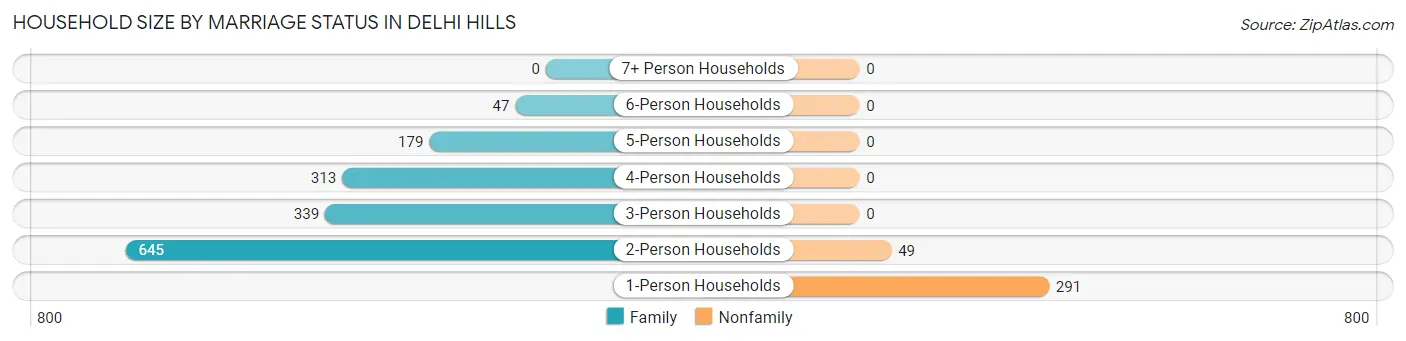
| Household Size | Family Households | Nonfamily Households |
| 1-Person Households | - | 291 (15.6%) |
| 2-Person Households | 645 (34.6%) | 49 (2.6%) |
| 3-Person Households | 339 (18.2%) | 0 (0.0%) |
| 4-Person Households | 313 (16.8%) | 0 (0.0%) |
| 5-Person Households | 179 (9.6%) | 0 (0.0%) |
| 6-Person Households | 47 (2.5%) | 0 (0.0%) |
| 7+ Person Households | 0 (0.0%) | 0 (0.0%) |
| Total | 1,523 (81.8%) | 340 (18.2%) |
Female Fertility in Delhi Hills
Fertility by Age in Delhi Hills
Average fertility rate in Delhi Hills is 95.0 births per 1,000 women. Women in the age bracket of 20 to 34 years have the highest fertility rate with 229.0 births per 1,000 women. Women in the age bracket of 20 to 34 years acount for 86.0% of all women with births.
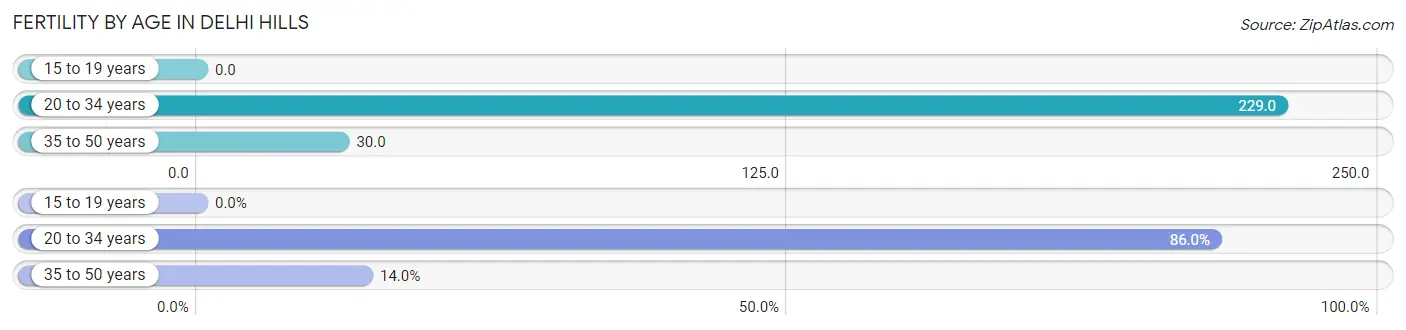
| Age Bracket | Women with Births | Births / 1,000 Women |
| 15 to 19 years | 0 (0.0%) | 0.0 |
| 20 to 34 years | 86 (86.0%) | 229.0 |
| 35 to 50 years | 14 (14.0%) | 30.0 |
| Total | 100 (100.0%) | 95.0 |
Fertility by Age by Marriage Status in Delhi Hills
23.0% of women with births (100) in Delhi Hills are married. The highest percentage of unmarried women with births falls into 20 to 34 years age bracket with 89.5% of them unmarried at the time of birth, while the lowest percentage of unmarried women with births belong to 35 to 50 years age bracket with 0.0% of them unmarried.
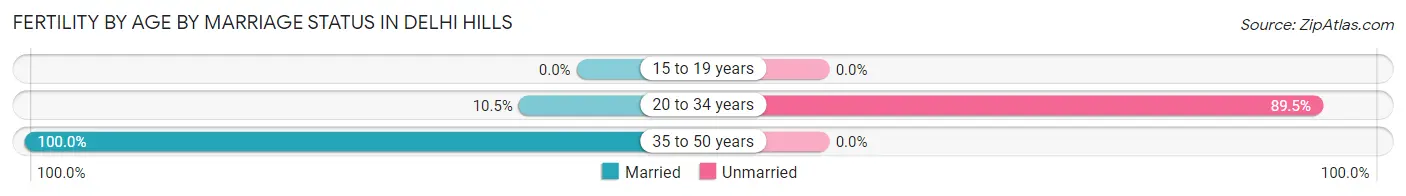
| Age Bracket | Married | Unmarried |
| 15 to 19 years | 0 (0.0%) | 0 (0.0%) |
| 20 to 34 years | 9 (10.5%) | 77 (89.5%) |
| 35 to 50 years | 14 (100.0%) | 0 (0.0%) |
| Total | 23 (23.0%) | 77 (77.0%) |
Fertility by Education in Delhi Hills
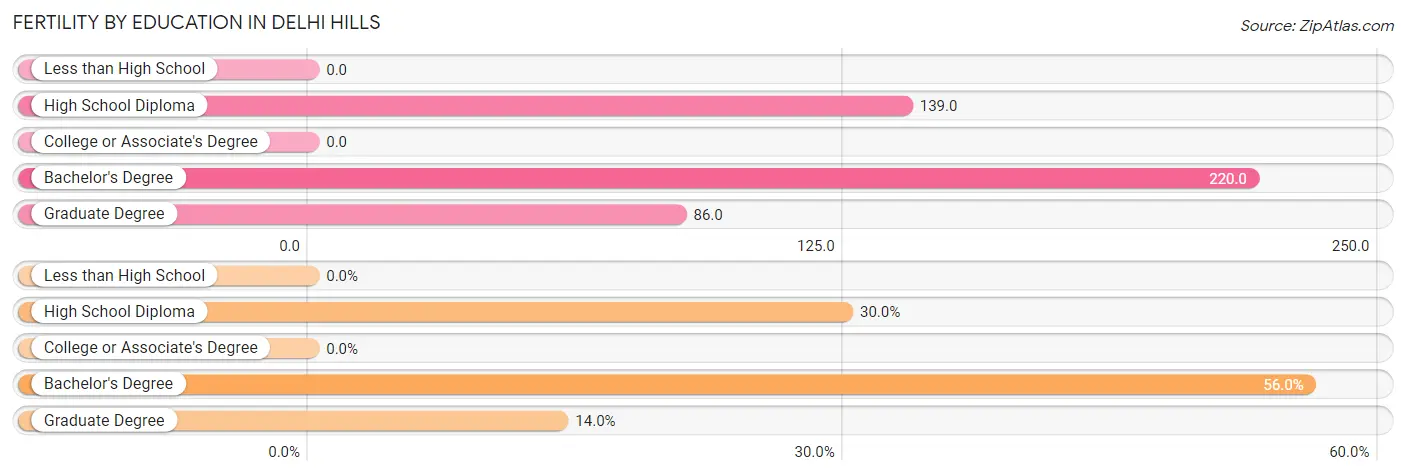
| Educational Attainment | Women with Births | Births / 1,000 Women |
| Less than High School | 0 (0.0%) | 0.0 |
| High School Diploma | 30 (30.0%) | 139.0 |
| College or Associate's Degree | 0 (0.0%) | 0.0 |
| Bachelor's Degree | 56 (56.0%) | 220.0 |
| Graduate Degree | 14 (14.0%) | 86.0 |
| Total | 100 (100.0%) | 95.0 |
Fertility by Education by Marriage Status in Delhi Hills
77.0% of women with births in Delhi Hills are unmarried. Women with the educational attainment of graduate degree are most likely to be married with 100.0% of them married at childbirth, while women with the educational attainment of bachelor's degree are least likely to be married with 100.0% of them unmarried at childbirth.
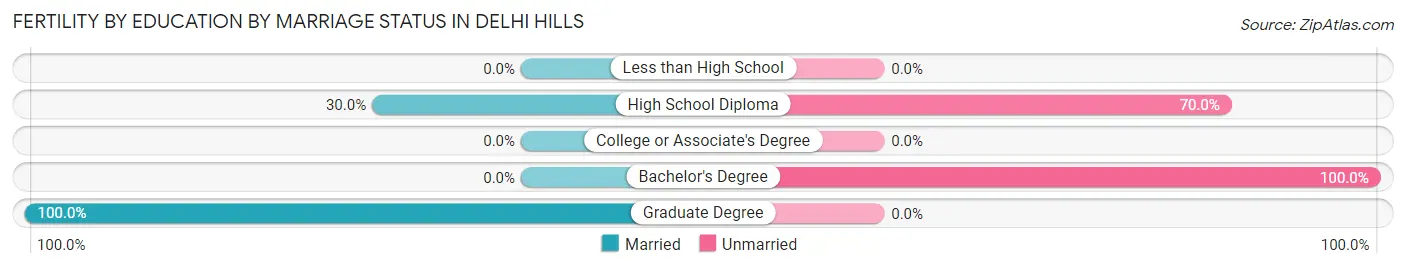
| Educational Attainment | Married | Unmarried |
| Less than High School | 0 (0.0%) | 0 (0.0%) |
| High School Diploma | 9 (30.0%) | 21 (70.0%) |
| College or Associate's Degree | 0 (0.0%) | 0 (0.0%) |
| Bachelor's Degree | 0 (0.0%) | 56 (100.0%) |
| Graduate Degree | 14 (100.0%) | 0 (0.0%) |
| Total | 23 (23.0%) | 77 (77.0%) |
Employment Characteristics in Delhi Hills
Employment by Class of Employer in Delhi Hills
Among the 2,783 employed individuals in Delhi Hills, private company employees (1,850 | 66.5%), not-for-profit organizations (302 | 10.8%), and local government employees (288 | 10.3%) make up the most common classes of employment.
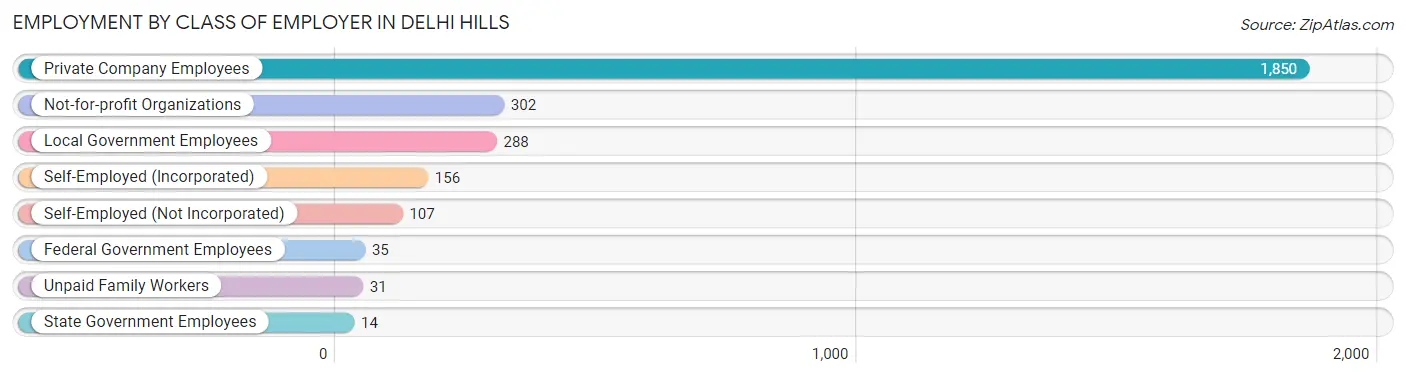
| Employer Class | # Employees | % Employees |
| Private Company Employees | 1,850 | 66.5% |
| Self-Employed (Incorporated) | 156 | 5.6% |
| Self-Employed (Not Incorporated) | 107 | 3.8% |
| Not-for-profit Organizations | 302 | 10.8% |
| Local Government Employees | 288 | 10.3% |
| State Government Employees | 14 | 0.5% |
| Federal Government Employees | 35 | 1.3% |
| Unpaid Family Workers | 31 | 1.1% |
| Total | 2,783 | 100.0% |
Employment Status by Age in Delhi Hills
According to the labor force statistics for Delhi Hills, out of the total population over 16 years of age (4,079), 70.4% or 2,872 individuals are in the labor force, with 2.4% or 69 of them unemployed. The age group with the highest labor force participation rate is 45 to 54 years, with 94.5% or 757 individuals in the labor force. Within the labor force, the 30 to 34 years age range has the highest percentage of unemployed individuals, with 10.4% or 26 of them being unemployed.
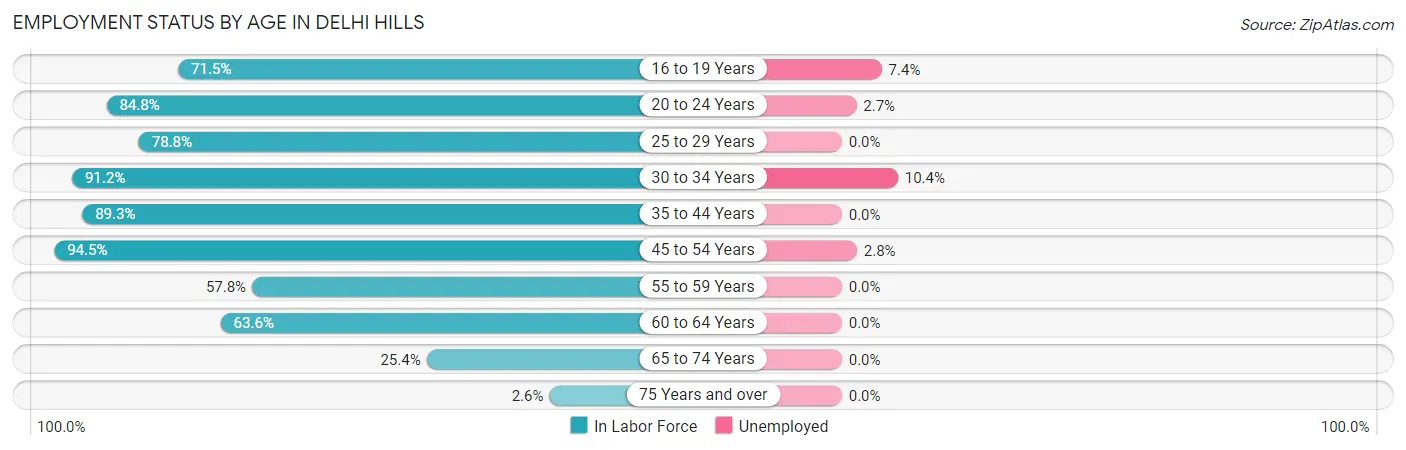
| Age Bracket | In Labor Force | Unemployed |
| 16 to 19 Years | 188 (71.5%) | 14 (7.4%) |
| 20 to 24 Years | 328 (84.8%) | 9 (2.7%) |
| 25 to 29 Years | 134 (78.8%) | 0 (0.0%) |
| 30 to 34 Years | 249 (91.2%) | 26 (10.4%) |
| 35 to 44 Years | 611 (89.3%) | 0 (0.0%) |
| 45 to 54 Years | 757 (94.5%) | 21 (2.8%) |
| 55 to 59 Years | 214 (57.8%) | 0 (0.0%) |
| 60 to 64 Years | 241 (63.6%) | 0 (0.0%) |
| 65 to 74 Years | 143 (25.4%) | 0 (0.0%) |
| 75 Years and over | 5 (2.6%) | 0 (0.0%) |
| Total | 2,872 (70.4%) | 69 (2.4%) |
Employment Status by Educational Attainment in Delhi Hills
According to labor force statistics for Delhi Hills, 82.4% of individuals (2,206) out of the total population between 25 and 64 years of age (2,677) are in the labor force, with 2.1% or 46 of them being unemployed. The group with the highest labor force participation rate are those with the educational attainment of bachelor's degree or higher, with 88.9% or 738 individuals in the labor force. Within the labor force, individuals with college / associate degree education have the highest percentage of unemployment, with 5.1% or 35 of them being unemployed.
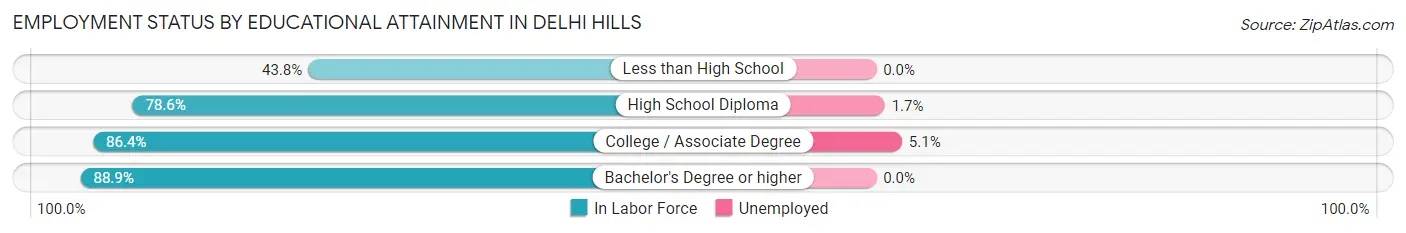
| Educational Attainment | In Labor Force | Unemployed |
| Less than High School | 57 (43.8%) | 0 (0.0%) |
| High School Diploma | 727 (78.6%) | 16 (1.7%) |
| College / Associate Degree | 684 (86.4%) | 40 (5.1%) |
| Bachelor's Degree or higher | 738 (88.9%) | 0 (0.0%) |
| Total | 2,206 (82.4%) | 56 (2.1%) |
Employment Occupations by Sex in Delhi Hills
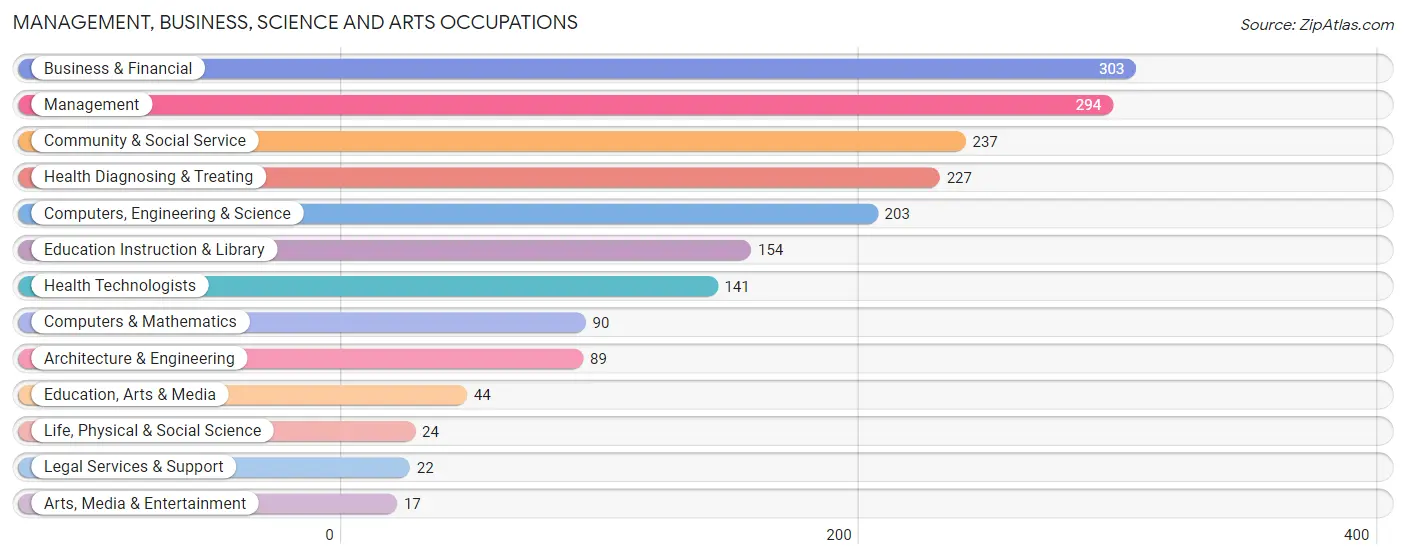
Management, Business, Science and Arts Occupations
The most common Management, Business, Science and Arts occupations in Delhi Hills are Business & Financial (303 | 10.8%), Management (294 | 10.5%), Community & Social Service (237 | 8.5%), Health Diagnosing & Treating (227 | 8.1%), and Computers, Engineering & Science (203 | 7.2%).
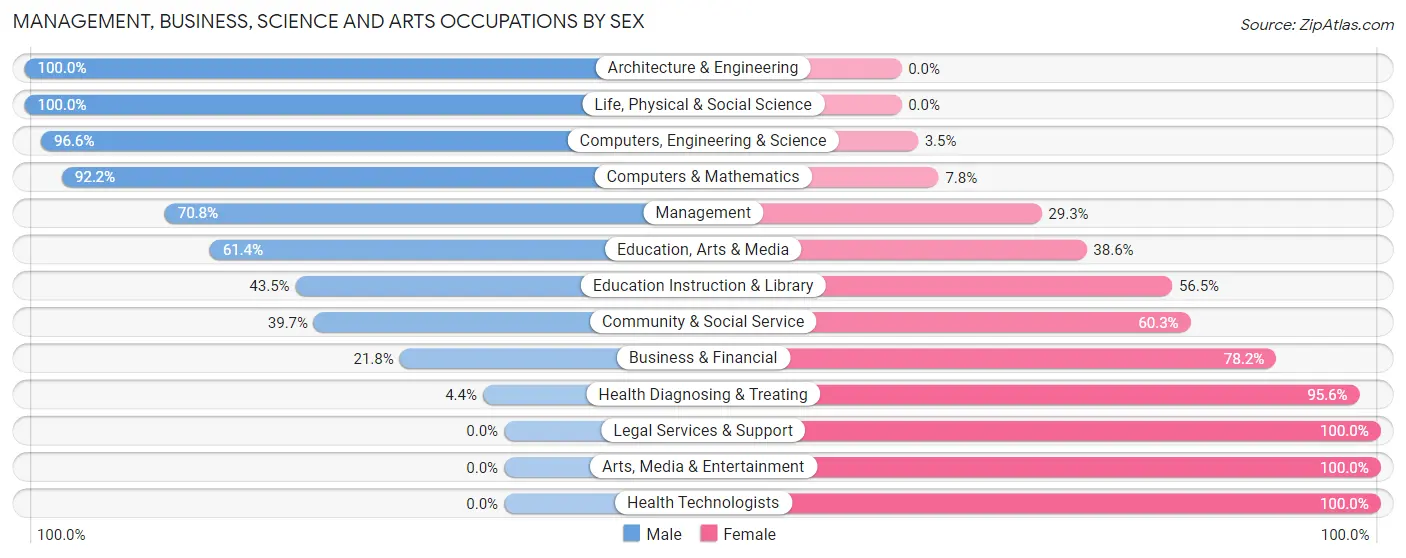
Management, Business, Science and Arts Occupations by Sex
Within the Management, Business, Science and Arts occupations in Delhi Hills, the most male-oriented occupations are Architecture & Engineering (100.0%), Life, Physical & Social Science (100.0%), and Computers, Engineering & Science (96.6%), while the most female-oriented occupations are Legal Services & Support (100.0%), Arts, Media & Entertainment (100.0%), and Health Technologists (100.0%).
| Occupation | Male | Female |
| Management | 208 (70.8%) | 86 (29.2%) |
| Business & Financial | 66 (21.8%) | 237 (78.2%) |
| Computers, Engineering & Science | 196 (96.6%) | 7 (3.5%) |
| Computers & Mathematics | 83 (92.2%) | 7 (7.8%) |
| Architecture & Engineering | 89 (100.0%) | 0 (0.0%) |
| Life, Physical & Social Science | 24 (100.0%) | 0 (0.0%) |
| Community & Social Service | 94 (39.7%) | 143 (60.3%) |
| Education, Arts & Media | 27 (61.4%) | 17 (38.6%) |
| Legal Services & Support | 0 (0.0%) | 22 (100.0%) |
| Education Instruction & Library | 67 (43.5%) | 87 (56.5%) |
| Arts, Media & Entertainment | 0 (0.0%) | 17 (100.0%) |
| Health Diagnosing & Treating | 10 (4.4%) | 217 (95.6%) |
| Health Technologists | 0 (0.0%) | 141 (100.0%) |
| Total (Category) | 574 (45.4%) | 690 (54.6%) |
| Total (Overall) | 1,510 (53.9%) | 1,290 (46.1%) |
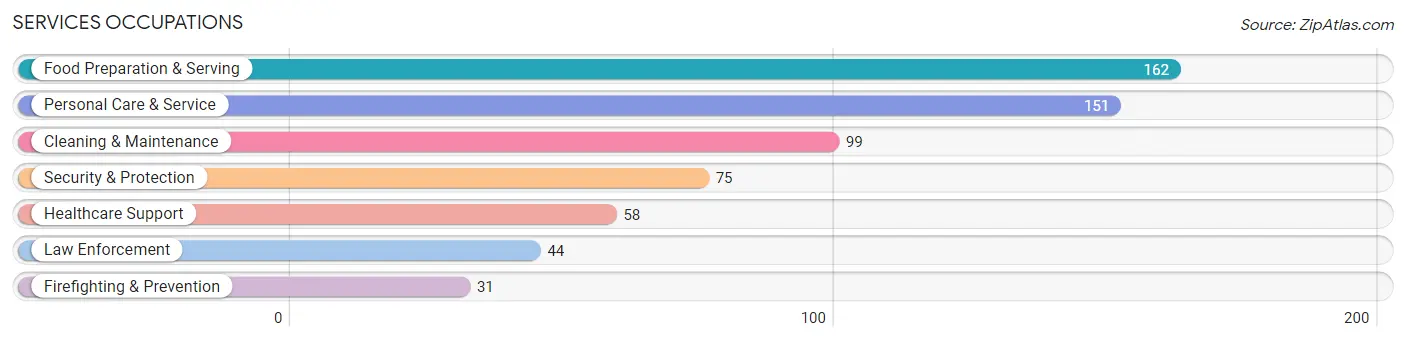
Services Occupations
The most common Services occupations in Delhi Hills are Food Preparation & Serving (162 | 5.8%), Personal Care & Service (151 | 5.4%), Cleaning & Maintenance (99 | 3.5%), Security & Protection (75 | 2.7%), and Healthcare Support (58 | 2.1%).
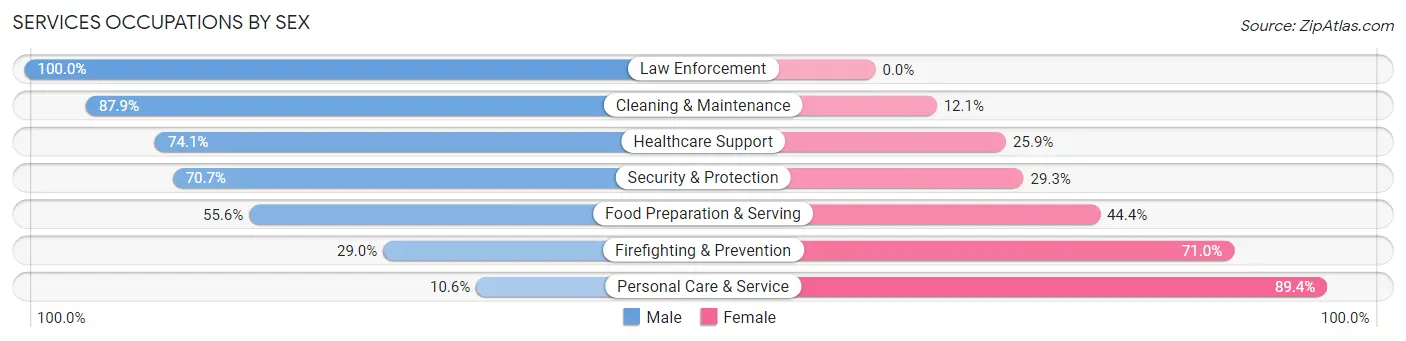
Services Occupations by Sex
Within the Services occupations in Delhi Hills, the most male-oriented occupations are Law Enforcement (100.0%), Cleaning & Maintenance (87.9%), and Healthcare Support (74.1%), while the most female-oriented occupations are Personal Care & Service (89.4%), Firefighting & Prevention (71.0%), and Food Preparation & Serving (44.4%).
| Occupation | Male | Female |
| Healthcare Support | 43 (74.1%) | 15 (25.9%) |
| Security & Protection | 53 (70.7%) | 22 (29.3%) |
| Firefighting & Prevention | 9 (29.0%) | 22 (71.0%) |
| Law Enforcement | 44 (100.0%) | 0 (0.0%) |
| Food Preparation & Serving | 90 (55.6%) | 72 (44.4%) |
| Cleaning & Maintenance | 87 (87.9%) | 12 (12.1%) |
| Personal Care & Service | 16 (10.6%) | 135 (89.4%) |
| Total (Category) | 289 (53.0%) | 256 (47.0%) |
| Total (Overall) | 1,510 (53.9%) | 1,290 (46.1%) |
Sales and Office Occupations
The most common Sales and Office occupations in Delhi Hills are Office & Administration (320 | 11.4%), and Sales & Related (180 | 6.4%).
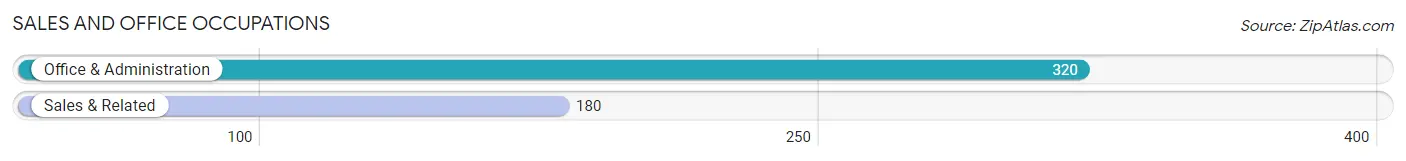
Sales and Office Occupations by Sex
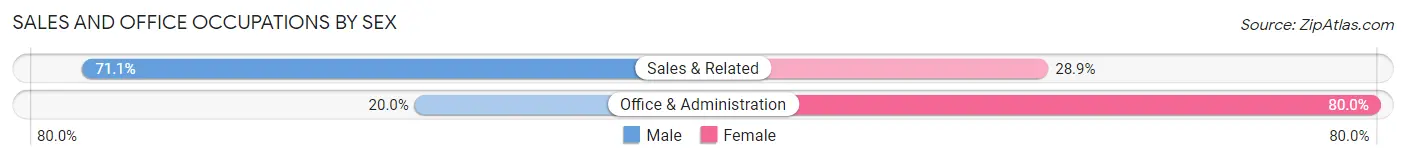
| Occupation | Male | Female |
| Sales & Related | 128 (71.1%) | 52 (28.9%) |
| Office & Administration | 64 (20.0%) | 256 (80.0%) |
| Total (Category) | 192 (38.4%) | 308 (61.6%) |
| Total (Overall) | 1,510 (53.9%) | 1,290 (46.1%) |
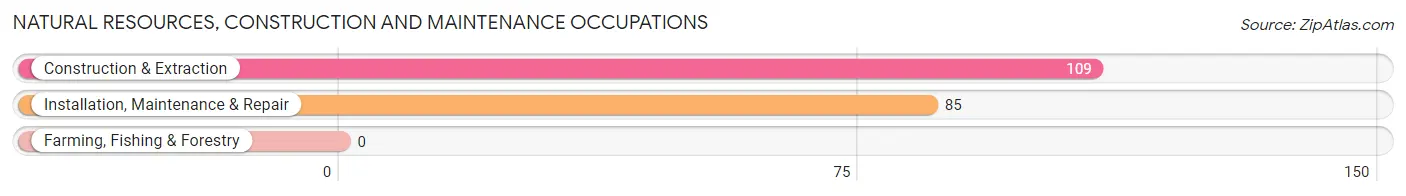
Natural Resources, Construction and Maintenance Occupations
The most common Natural Resources, Construction and Maintenance occupations in Delhi Hills are Construction & Extraction (109 | 3.9%), and Installation, Maintenance & Repair (85 | 3.0%).
Natural Resources, Construction and Maintenance Occupations by Sex
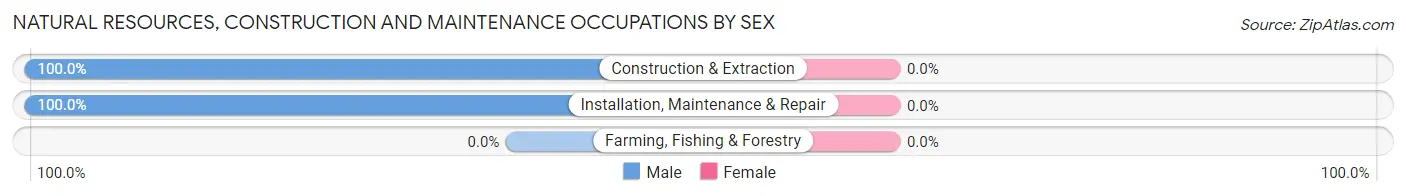
| Occupation | Male | Female |
| Farming, Fishing & Forestry | 0 (0.0%) | 0 (0.0%) |
| Construction & Extraction | 109 (100.0%) | 0 (0.0%) |
| Installation, Maintenance & Repair | 85 (100.0%) | 0 (0.0%) |
| Total (Category) | 194 (100.0%) | 0 (0.0%) |
| Total (Overall) | 1,510 (53.9%) | 1,290 (46.1%) |
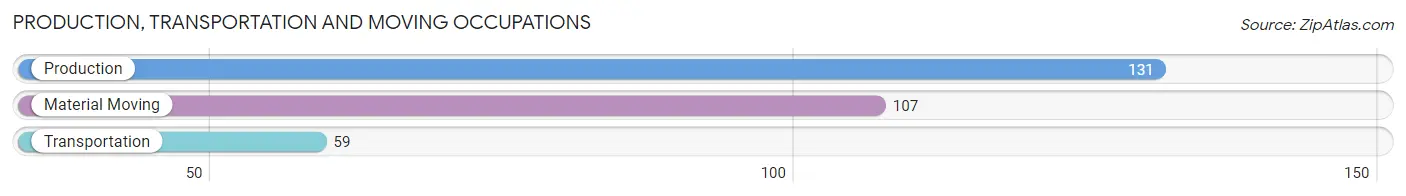
Production, Transportation and Moving Occupations
The most common Production, Transportation and Moving occupations in Delhi Hills are Production (131 | 4.7%), Material Moving (107 | 3.8%), and Transportation (59 | 2.1%).
Production, Transportation and Moving Occupations by Sex
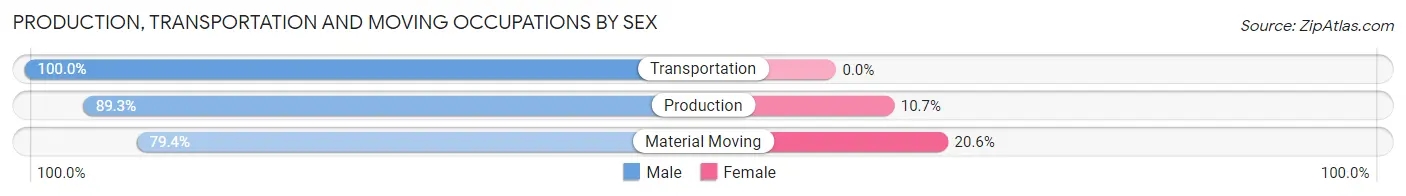
| Occupation | Male | Female |
| Production | 117 (89.3%) | 14 (10.7%) |
| Transportation | 59 (100.0%) | 0 (0.0%) |
| Material Moving | 85 (79.4%) | 22 (20.6%) |
| Total (Category) | 261 (87.9%) | 36 (12.1%) |
| Total (Overall) | 1,510 (53.9%) | 1,290 (46.1%) |
Employment Industries by Sex in Delhi Hills
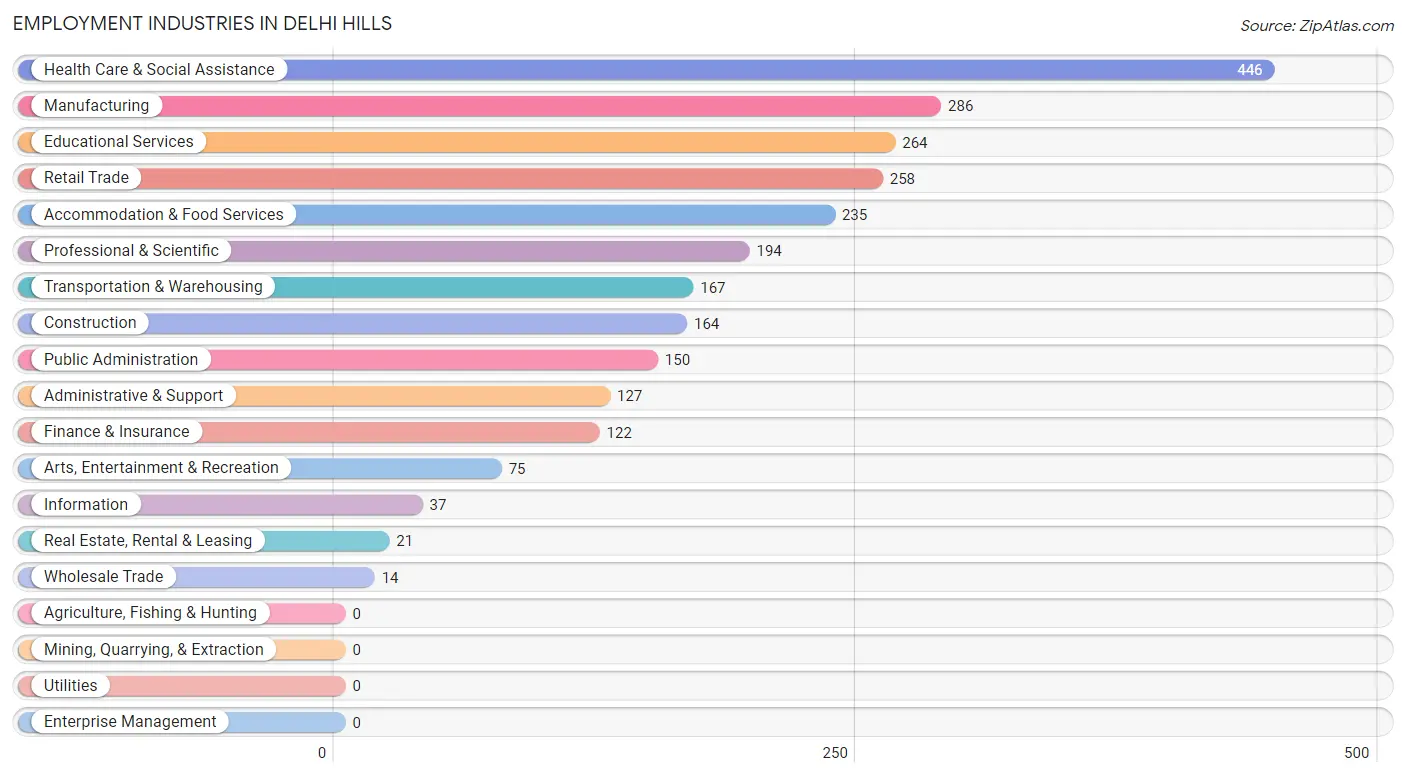
Employment Industries in Delhi Hills
The major employment industries in Delhi Hills include Health Care & Social Assistance (446 | 15.9%), Manufacturing (286 | 10.2%), Educational Services (264 | 9.4%), Retail Trade (258 | 9.2%), and Accommodation & Food Services (235 | 8.4%).
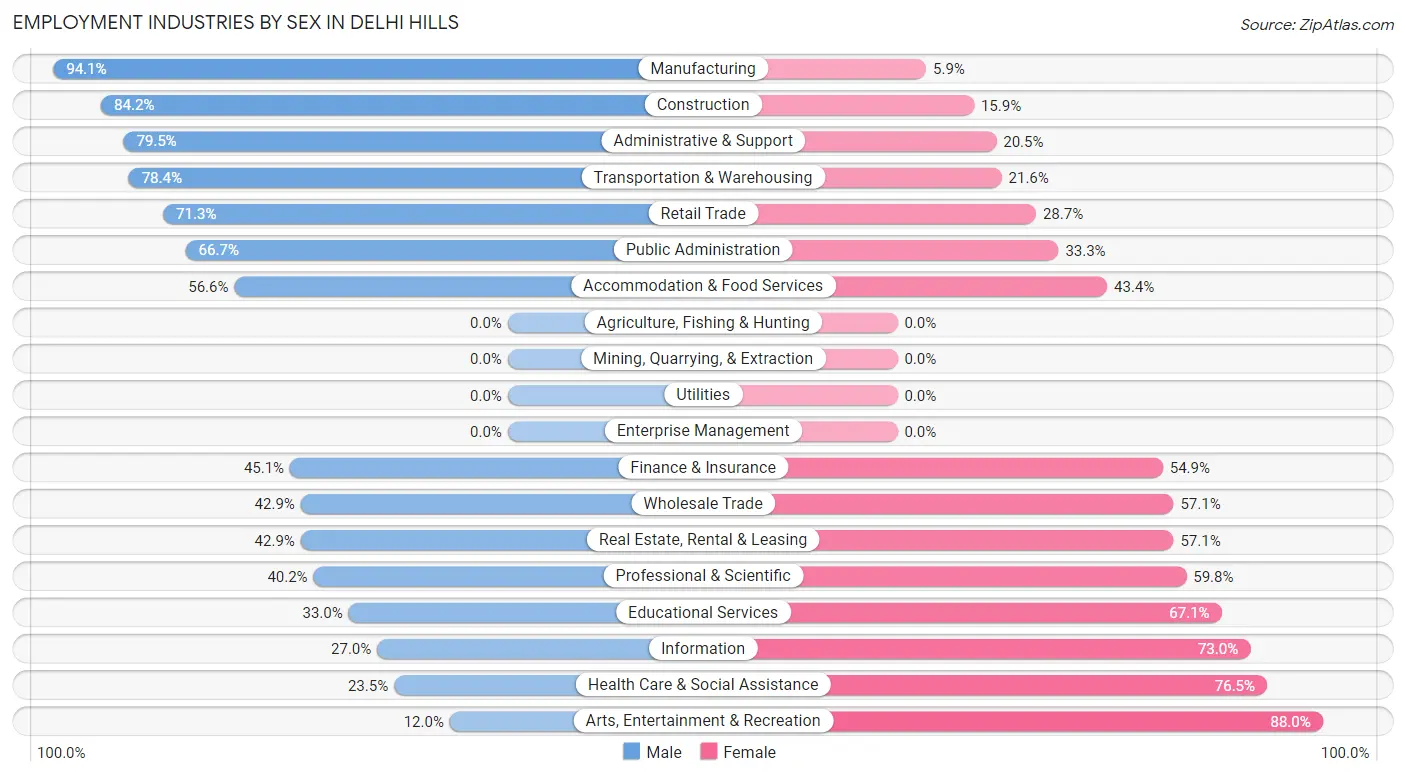
Employment Industries by Sex in Delhi Hills
The Delhi Hills industries that see more men than women are Manufacturing (94.1%), Construction (84.2%), and Administrative & Support (79.5%), whereas the industries that tend to have a higher number of women are Arts, Entertainment & Recreation (88.0%), Health Care & Social Assistance (76.5%), and Information (73.0%).
| Industry | Male | Female |
| Agriculture, Fishing & Hunting | 0 (0.0%) | 0 (0.0%) |
| Mining, Quarrying, & Extraction | 0 (0.0%) | 0 (0.0%) |
| Construction | 138 (84.2%) | 26 (15.9%) |
| Manufacturing | 269 (94.1%) | 17 (5.9%) |
| Wholesale Trade | 6 (42.9%) | 8 (57.1%) |
| Retail Trade | 184 (71.3%) | 74 (28.7%) |
| Transportation & Warehousing | 131 (78.4%) | 36 (21.6%) |
| Utilities | 0 (0.0%) | 0 (0.0%) |
| Information | 10 (27.0%) | 27 (73.0%) |
| Finance & Insurance | 55 (45.1%) | 67 (54.9%) |
| Real Estate, Rental & Leasing | 9 (42.9%) | 12 (57.1%) |
| Professional & Scientific | 78 (40.2%) | 116 (59.8%) |
| Enterprise Management | 0 (0.0%) | 0 (0.0%) |
| Administrative & Support | 101 (79.5%) | 26 (20.5%) |
| Educational Services | 87 (33.0%) | 177 (67.0%) |
| Health Care & Social Assistance | 105 (23.5%) | 341 (76.5%) |
| Arts, Entertainment & Recreation | 9 (12.0%) | 66 (88.0%) |
| Accommodation & Food Services | 133 (56.6%) | 102 (43.4%) |
| Public Administration | 100 (66.7%) | 50 (33.3%) |
| Total | 1,510 (53.9%) | 1,290 (46.1%) |
Education in Delhi Hills
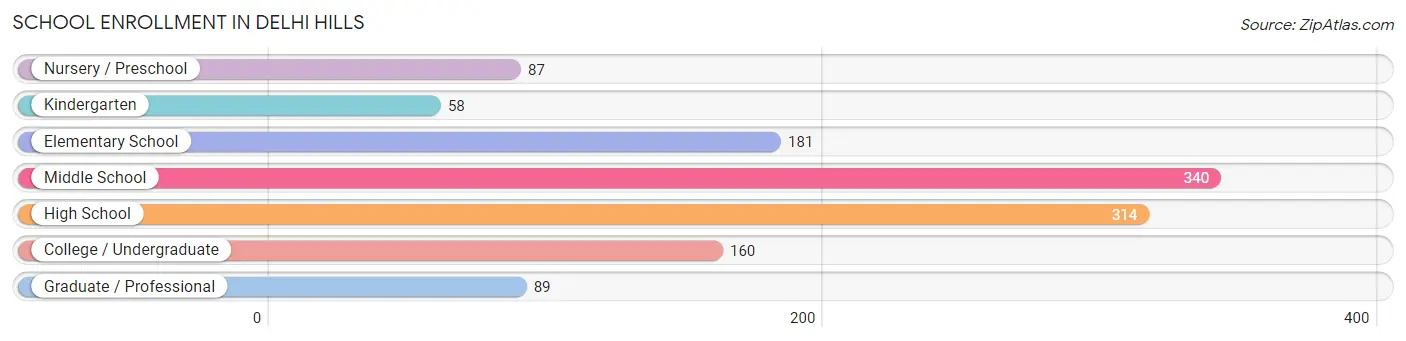
School Enrollment in Delhi Hills
The most common levels of schooling among the 1,229 students in Delhi Hills are middle school (340 | 27.7%), high school (314 | 25.6%), and elementary school (181 | 14.7%).
| School Level | # Students | % Students |
| Nursery / Preschool | 87 | 7.1% |
| Kindergarten | 58 | 4.7% |
| Elementary School | 181 | 14.7% |
| Middle School | 340 | 27.7% |
| High School | 314 | 25.6% |
| College / Undergraduate | 160 | 13.0% |
| Graduate / Professional | 89 | 7.2% |
| Total | 1,229 | 100.0% |
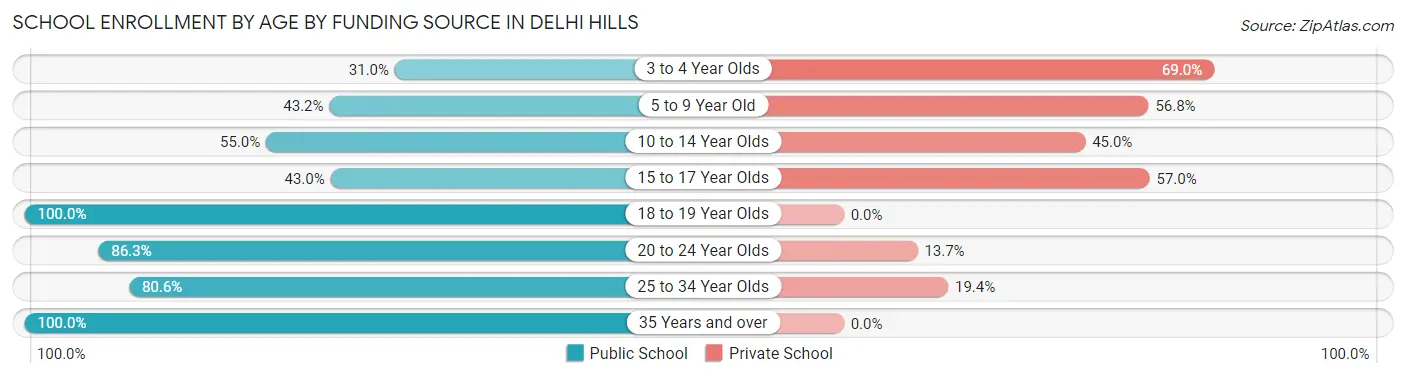
School Enrollment by Age by Funding Source in Delhi Hills
Out of a total of 1,229 students who are enrolled in schools in Delhi Hills, 546 (44.4%) attend a private institution, while the remaining 683 (55.6%) are enrolled in public schools. The age group of 3 to 4 year olds has the highest likelihood of being enrolled in private schools, with 60 (69.0% in the age bracket) enrolled. Conversely, the age group of 18 to 19 year olds has the lowest likelihood of being enrolled in a private school, with 22 (100.0% in the age bracket) attending a public institution.
| Age Bracket | Public School | Private School |
| 3 to 4 Year Olds | 27 (31.0%) | 60 (69.0%) |
| 5 to 9 Year Old | 99 (43.2%) | 130 (56.8%) |
| 10 to 14 Year Olds | 203 (55.0%) | 166 (45.0%) |
| 15 to 17 Year Olds | 114 (43.0%) | 151 (57.0%) |
| 18 to 19 Year Olds | 22 (100.0%) | 0 (0.0%) |
| 20 to 24 Year Olds | 113 (86.3%) | 18 (13.7%) |
| 25 to 34 Year Olds | 87 (80.6%) | 21 (19.4%) |
| 35 Years and over | 18 (100.0%) | 0 (0.0%) |
| Total | 683 (55.6%) | 546 (44.4%) |
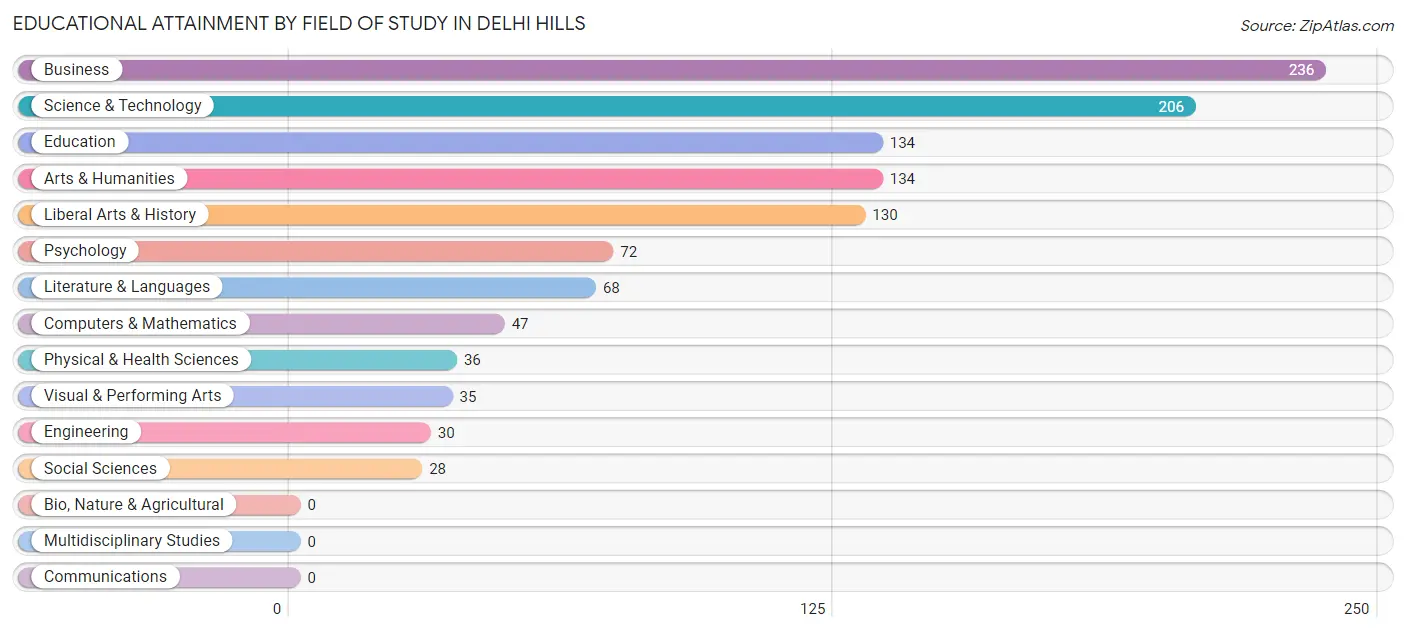
Educational Attainment by Field of Study in Delhi Hills
Business (236 | 20.4%), science & technology (206 | 17.8%), education (134 | 11.6%), arts & humanities (134 | 11.6%), and liberal arts & history (130 | 11.3%) are the most common fields of study among 1,156 individuals in Delhi Hills who have obtained a bachelor's degree or higher.
| Field of Study | # Graduates | % Graduates |
| Computers & Mathematics | 47 | 4.1% |
| Bio, Nature & Agricultural | 0 | 0.0% |
| Physical & Health Sciences | 36 | 3.1% |
| Psychology | 72 | 6.2% |
| Social Sciences | 28 | 2.4% |
| Engineering | 30 | 2.6% |
| Multidisciplinary Studies | 0 | 0.0% |
| Science & Technology | 206 | 17.8% |
| Business | 236 | 20.4% |
| Education | 134 | 11.6% |
| Literature & Languages | 68 | 5.9% |
| Liberal Arts & History | 130 | 11.3% |
| Visual & Performing Arts | 35 | 3.0% |
| Communications | 0 | 0.0% |
| Arts & Humanities | 134 | 11.6% |
| Total | 1,156 | 100.0% |
Transportation & Commute in Delhi Hills
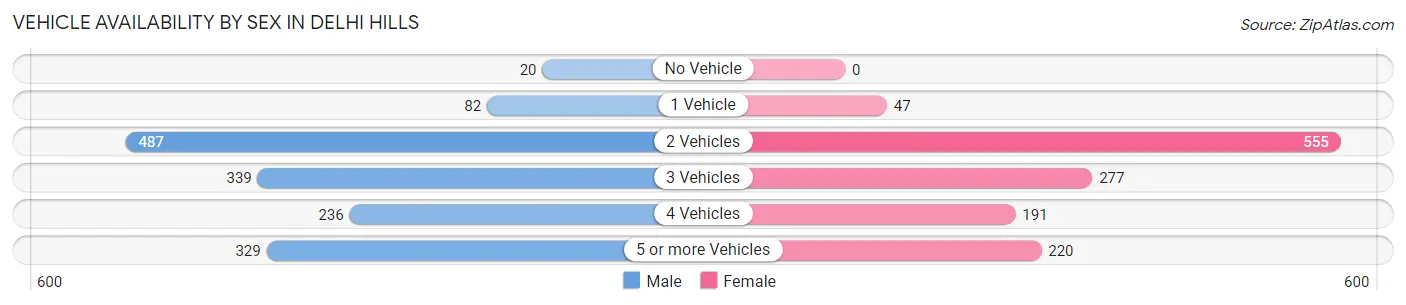
Vehicle Availability by Sex in Delhi Hills
The most prevalent vehicle ownership categories in Delhi Hills are males with 2 vehicles (487, accounting for 32.6%) and females with 2 vehicles (555, making up 37.8%).
| Vehicles Available | Male | Female |
| No Vehicle | 20 (1.3%) | 0 (0.0%) |
| 1 Vehicle | 82 (5.5%) | 47 (3.6%) |
| 2 Vehicles | 487 (32.6%) | 555 (43.0%) |
| 3 Vehicles | 339 (22.7%) | 277 (21.5%) |
| 4 Vehicles | 236 (15.8%) | 191 (14.8%) |
| 5 or more Vehicles | 329 (22.0%) | 220 (17.1%) |
| Total | 1,493 (100.0%) | 1,290 (100.0%) |
Commute Time in Delhi Hills
The most frequently occuring commute durations in Delhi Hills are 20 to 24 minutes (682 commuters, 26.4%), 15 to 19 minutes (353 commuters, 13.6%), and 25 to 29 minutes (321 commuters, 12.4%).
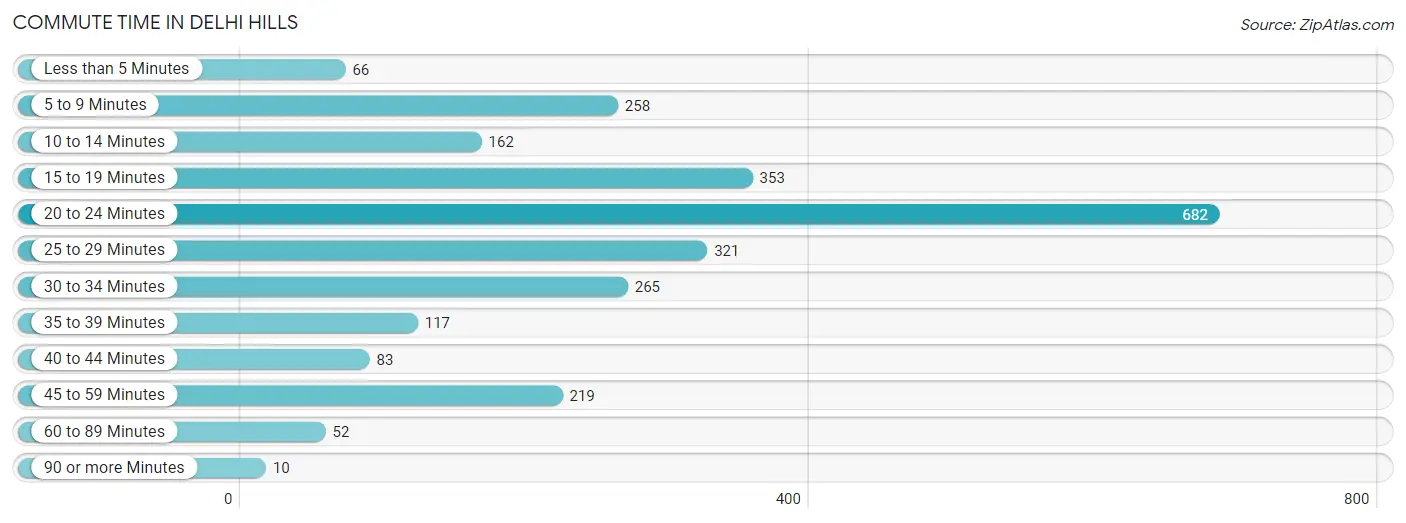
| Commute Time | # Commuters | % Commuters |
| Less than 5 Minutes | 66 | 2.5% |
| 5 to 9 Minutes | 258 | 10.0% |
| 10 to 14 Minutes | 162 | 6.3% |
| 15 to 19 Minutes | 353 | 13.6% |
| 20 to 24 Minutes | 682 | 26.4% |
| 25 to 29 Minutes | 321 | 12.4% |
| 30 to 34 Minutes | 265 | 10.2% |
| 35 to 39 Minutes | 117 | 4.5% |
| 40 to 44 Minutes | 83 | 3.2% |
| 45 to 59 Minutes | 219 | 8.5% |
| 60 to 89 Minutes | 52 | 2.0% |
| 90 or more Minutes | 10 | 0.4% |
Commute Time by Sex in Delhi Hills
The most common commute times in Delhi Hills are 30 to 34 minutes (222 commuters, 15.7%) for males and 20 to 24 minutes (502 commuters, 42.7%) for females.
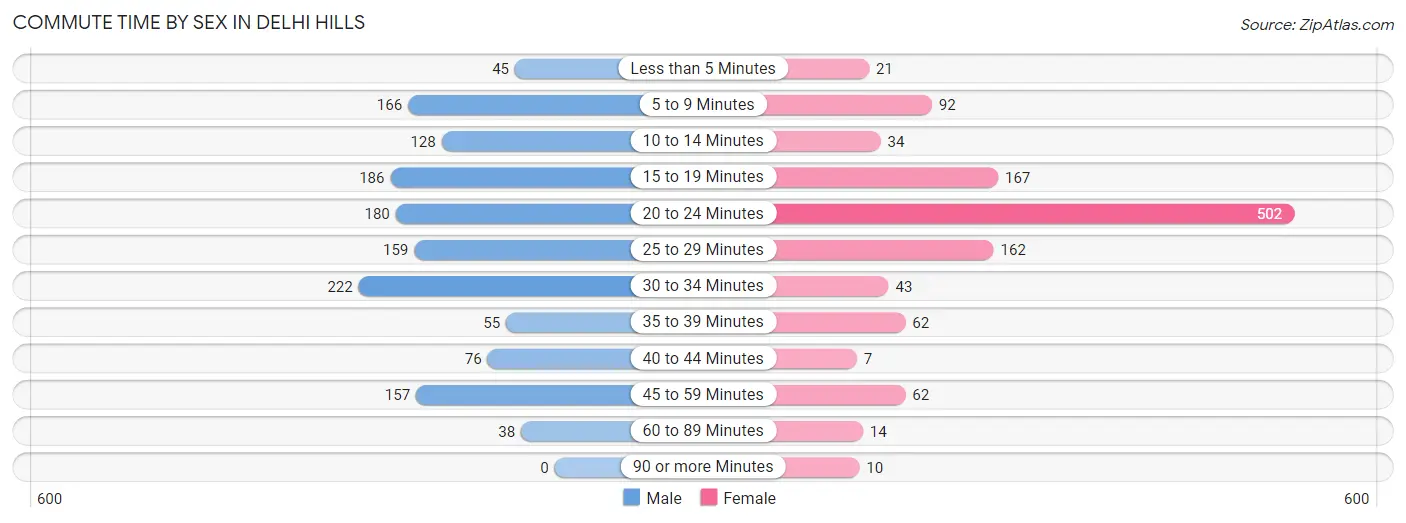
| Commute Time | Male | Female |
| Less than 5 Minutes | 45 (3.2%) | 21 (1.8%) |
| 5 to 9 Minutes | 166 (11.8%) | 92 (7.8%) |
| 10 to 14 Minutes | 128 (9.1%) | 34 (2.9%) |
| 15 to 19 Minutes | 186 (13.2%) | 167 (14.2%) |
| 20 to 24 Minutes | 180 (12.8%) | 502 (42.7%) |
| 25 to 29 Minutes | 159 (11.3%) | 162 (13.8%) |
| 30 to 34 Minutes | 222 (15.7%) | 43 (3.7%) |
| 35 to 39 Minutes | 55 (3.9%) | 62 (5.3%) |
| 40 to 44 Minutes | 76 (5.4%) | 7 (0.6%) |
| 45 to 59 Minutes | 157 (11.1%) | 62 (5.3%) |
| 60 to 89 Minutes | 38 (2.7%) | 14 (1.2%) |
| 90 or more Minutes | 0 (0.0%) | 10 (0.9%) |
Time of Departure to Work by Sex in Delhi Hills
The most frequent times of departure to work in Delhi Hills are 6:30 AM to 6:59 AM (197, 14.0%) for males and 7:30 AM to 7:59 AM (303, 25.8%) for females.
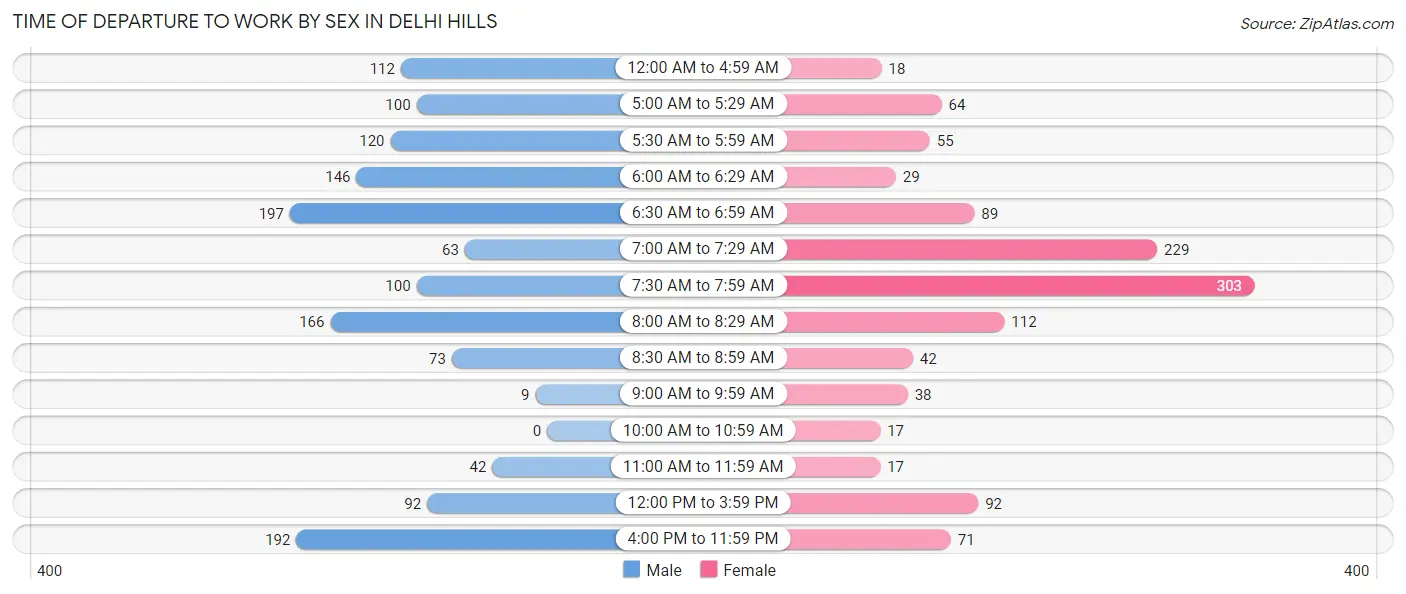
| Time of Departure | Male | Female |
| 12:00 AM to 4:59 AM | 112 (7.9%) | 18 (1.5%) |
| 5:00 AM to 5:29 AM | 100 (7.1%) | 64 (5.4%) |
| 5:30 AM to 5:59 AM | 120 (8.5%) | 55 (4.7%) |
| 6:00 AM to 6:29 AM | 146 (10.3%) | 29 (2.5%) |
| 6:30 AM to 6:59 AM | 197 (14.0%) | 89 (7.6%) |
| 7:00 AM to 7:29 AM | 63 (4.5%) | 229 (19.5%) |
| 7:30 AM to 7:59 AM | 100 (7.1%) | 303 (25.8%) |
| 8:00 AM to 8:29 AM | 166 (11.8%) | 112 (9.5%) |
| 8:30 AM to 8:59 AM | 73 (5.2%) | 42 (3.6%) |
| 9:00 AM to 9:59 AM | 9 (0.6%) | 38 (3.2%) |
| 10:00 AM to 10:59 AM | 0 (0.0%) | 17 (1.5%) |
| 11:00 AM to 11:59 AM | 42 (3.0%) | 17 (1.5%) |
| 12:00 PM to 3:59 PM | 92 (6.5%) | 92 (7.8%) |
| 4:00 PM to 11:59 PM | 192 (13.6%) | 71 (6.0%) |
| Total | 1,412 (100.0%) | 1,176 (100.0%) |
Housing Occupancy in Delhi Hills
Occupancy by Ownership in Delhi Hills
Of the total 1,863 dwellings in Delhi Hills, owner-occupied units account for 1,730 (92.9%), while renter-occupied units make up 133 (7.1%).
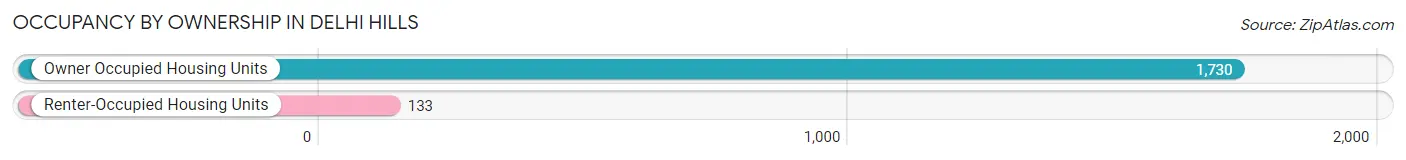
| Occupancy | # Housing Units | % Housing Units |
| Owner Occupied Housing Units | 1,730 | 92.9% |
| Renter-Occupied Housing Units | 133 | 7.1% |
| Total Occupied Housing Units | 1,863 | 100.0% |
Occupancy by Household Size in Delhi Hills
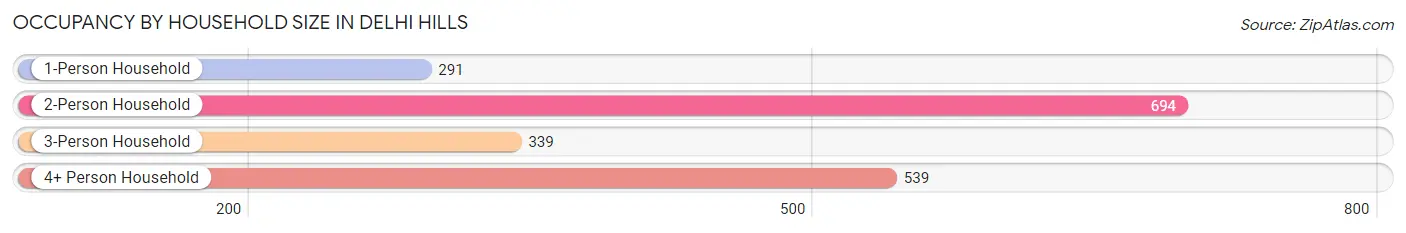
| Household Size | # Housing Units | % Housing Units |
| 1-Person Household | 291 | 15.6% |
| 2-Person Household | 694 | 37.2% |
| 3-Person Household | 339 | 18.2% |
| 4+ Person Household | 539 | 28.9% |
| Total Housing Units | 1,863 | 100.0% |
Occupancy by Ownership by Household Size in Delhi Hills
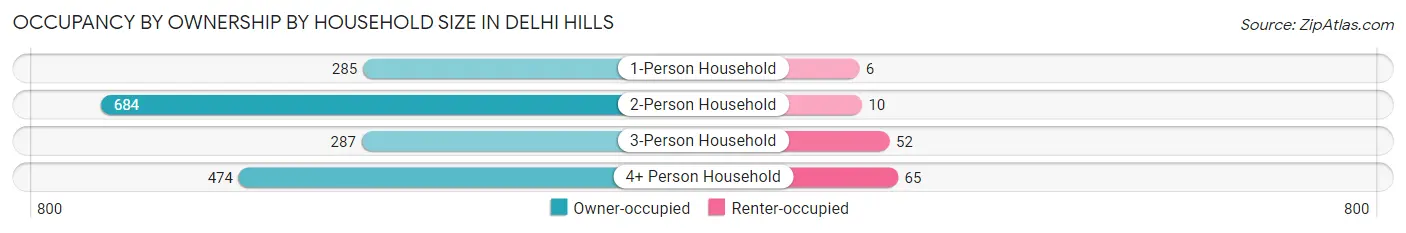
| Household Size | Owner-occupied | Renter-occupied |
| 1-Person Household | 285 (97.9%) | 6 (2.1%) |
| 2-Person Household | 684 (98.6%) | 10 (1.4%) |
| 3-Person Household | 287 (84.7%) | 52 (15.3%) |
| 4+ Person Household | 474 (87.9%) | 65 (12.1%) |
| Total Housing Units | 1,730 (92.9%) | 133 (7.1%) |
Occupancy by Educational Attainment in Delhi Hills
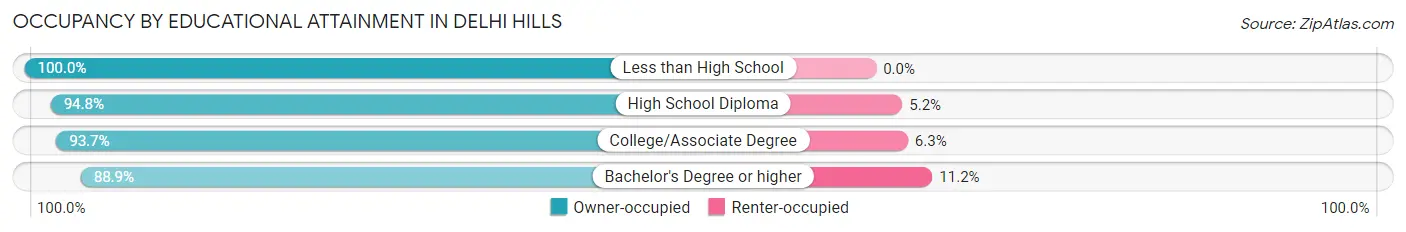
| Household Size | Owner-occupied | Renter-occupied |
| Less than High School | 88 (100.0%) | 0 (0.0%) |
| High School Diploma | 603 (94.8%) | 33 (5.2%) |
| College/Associate Degree | 521 (93.7%) | 35 (6.3%) |
| Bachelor's Degree or higher | 518 (88.8%) | 65 (11.2%) |
Occupancy by Age of Householder in Delhi Hills
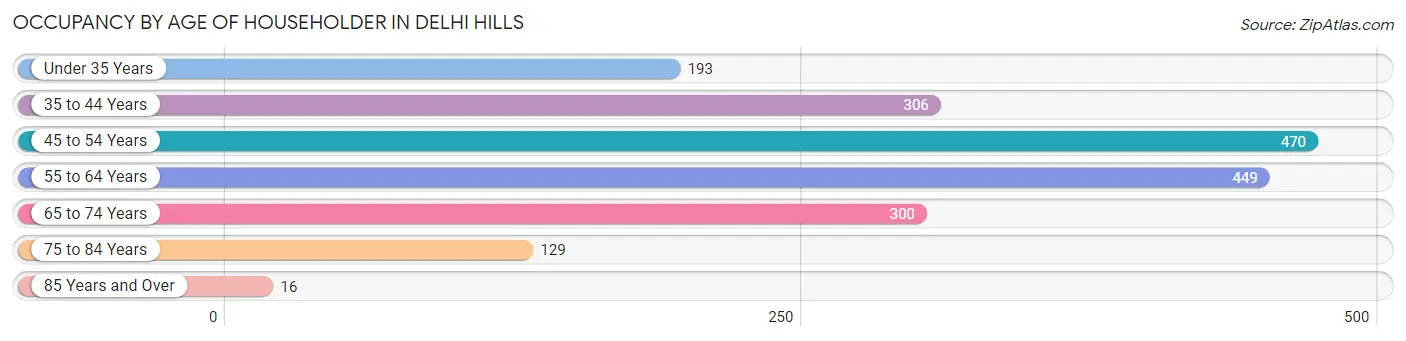
| Age Bracket | # Households | % Households |
| Under 35 Years | 193 | 10.4% |
| 35 to 44 Years | 306 | 16.4% |
| 45 to 54 Years | 470 | 25.2% |
| 55 to 64 Years | 449 | 24.1% |
| 65 to 74 Years | 300 | 16.1% |
| 75 to 84 Years | 129 | 6.9% |
| 85 Years and Over | 16 | 0.9% |
| Total | 1,863 | 100.0% |
Housing Finances in Delhi Hills
Median Income by Occupancy in Delhi Hills
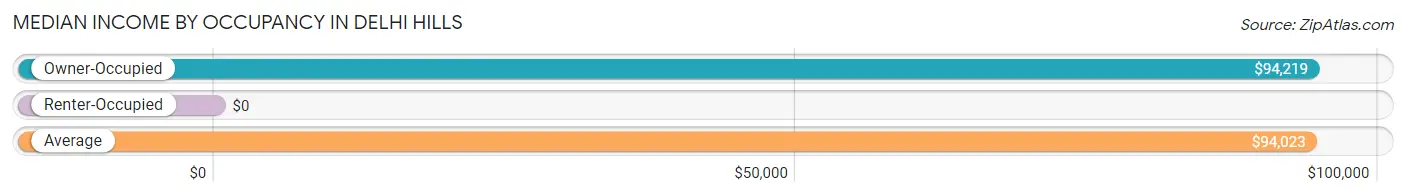
| Occupancy Type | # Households | Median Income |
| Owner-Occupied | 1,730 (92.9%) | $94,219 |
| Renter-Occupied | 133 (7.1%) | $0 |
| Average | 1,863 (100.0%) | $94,023 |
Occupancy by Householder Income Bracket in Delhi Hills
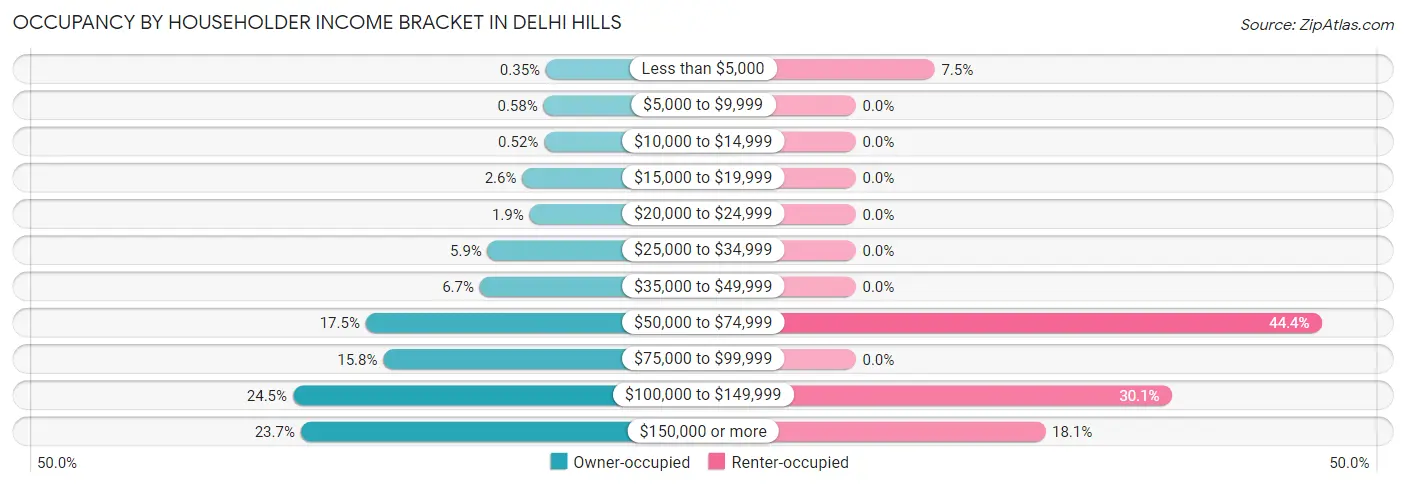
| Income Bracket | Owner-occupied | Renter-occupied |
| Less than $5,000 | 6 (0.4%) | 10 (7.5%) |
| $5,000 to $9,999 | 10 (0.6%) | 0 (0.0%) |
| $10,000 to $14,999 | 9 (0.5%) | 0 (0.0%) |
| $15,000 to $19,999 | 45 (2.6%) | 0 (0.0%) |
| $20,000 to $24,999 | 33 (1.9%) | 0 (0.0%) |
| $25,000 to $34,999 | 102 (5.9%) | 0 (0.0%) |
| $35,000 to $49,999 | 115 (6.7%) | 0 (0.0%) |
| $50,000 to $74,999 | 303 (17.5%) | 59 (44.4%) |
| $75,000 to $99,999 | 274 (15.8%) | 0 (0.0%) |
| $100,000 to $149,999 | 423 (24.4%) | 40 (30.1%) |
| $150,000 or more | 410 (23.7%) | 24 (18.0%) |
| Total | 1,730 (100.0%) | 133 (100.0%) |
Monthly Housing Cost Tiers in Delhi Hills
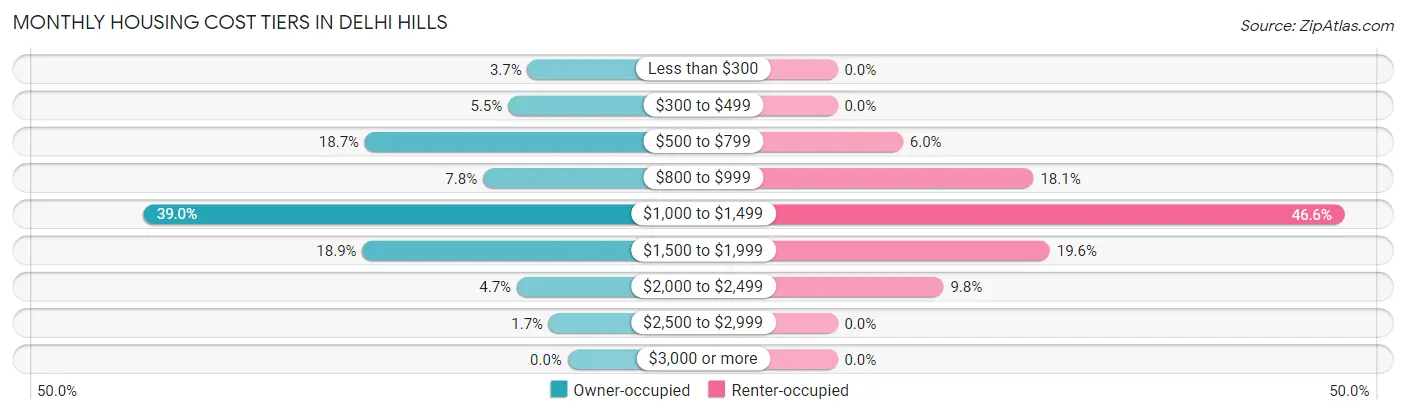
| Monthly Cost | Owner-occupied | Renter-occupied |
| Less than $300 | 64 (3.7%) | 0 (0.0%) |
| $300 to $499 | 95 (5.5%) | 0 (0.0%) |
| $500 to $799 | 323 (18.7%) | 8 (6.0%) |
| $800 to $999 | 135 (7.8%) | 24 (18.0%) |
| $1,000 to $1,499 | 675 (39.0%) | 62 (46.6%) |
| $1,500 to $1,999 | 327 (18.9%) | 26 (19.6%) |
| $2,000 to $2,499 | 81 (4.7%) | 13 (9.8%) |
| $2,500 to $2,999 | 30 (1.7%) | 0 (0.0%) |
| $3,000 or more | 0 (0.0%) | 0 (0.0%) |
| Total | 1,730 (100.0%) | 133 (100.0%) |
Physical Housing Characteristics in Delhi Hills
Housing Structures in Delhi Hills
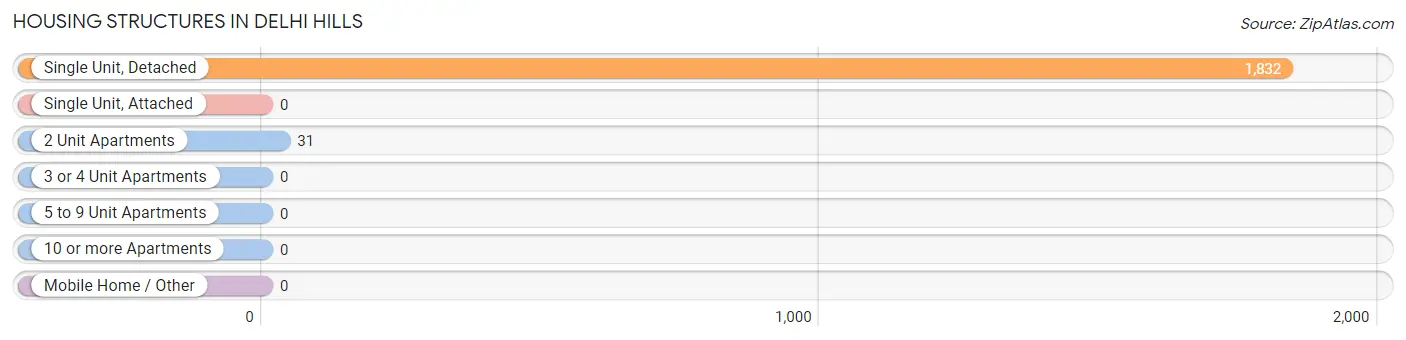
| Structure Type | # Housing Units | % Housing Units |
| Single Unit, Detached | 1,832 | 98.3% |
| Single Unit, Attached | 0 | 0.0% |
| 2 Unit Apartments | 31 | 1.7% |
| 3 or 4 Unit Apartments | 0 | 0.0% |
| 5 to 9 Unit Apartments | 0 | 0.0% |
| 10 or more Apartments | 0 | 0.0% |
| Mobile Home / Other | 0 | 0.0% |
| Total | 1,863 | 100.0% |
Housing Structures by Occupancy in Delhi Hills
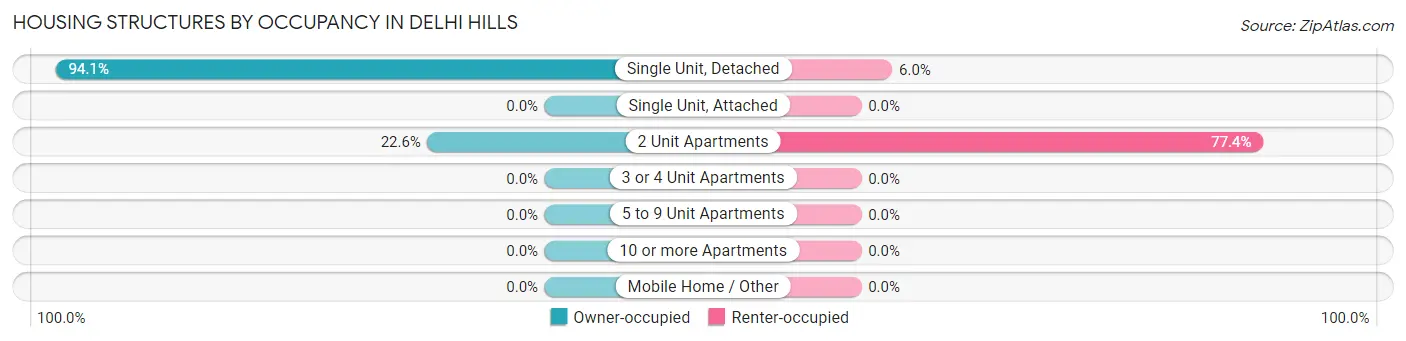
| Structure Type | Owner-occupied | Renter-occupied |
| Single Unit, Detached | 1,723 (94.1%) | 109 (5.9%) |
| Single Unit, Attached | 0 (0.0%) | 0 (0.0%) |
| 2 Unit Apartments | 7 (22.6%) | 24 (77.4%) |
| 3 or 4 Unit Apartments | 0 (0.0%) | 0 (0.0%) |
| 5 to 9 Unit Apartments | 0 (0.0%) | 0 (0.0%) |
| 10 or more Apartments | 0 (0.0%) | 0 (0.0%) |
| Mobile Home / Other | 0 (0.0%) | 0 (0.0%) |
| Total | 1,730 (92.9%) | 133 (7.1%) |
Housing Structures by Number of Rooms in Delhi Hills
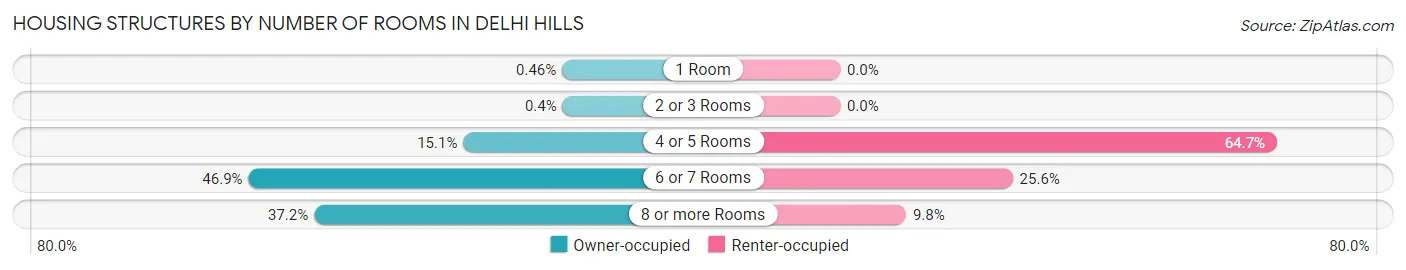
| Number of Rooms | Owner-occupied | Renter-occupied |
| 1 Room | 8 (0.5%) | 0 (0.0%) |
| 2 or 3 Rooms | 7 (0.4%) | 0 (0.0%) |
| 4 or 5 Rooms | 261 (15.1%) | 86 (64.7%) |
| 6 or 7 Rooms | 811 (46.9%) | 34 (25.6%) |
| 8 or more Rooms | 643 (37.2%) | 13 (9.8%) |
| Total | 1,730 (100.0%) | 133 (100.0%) |
Housing Structure by Heating Type in Delhi Hills
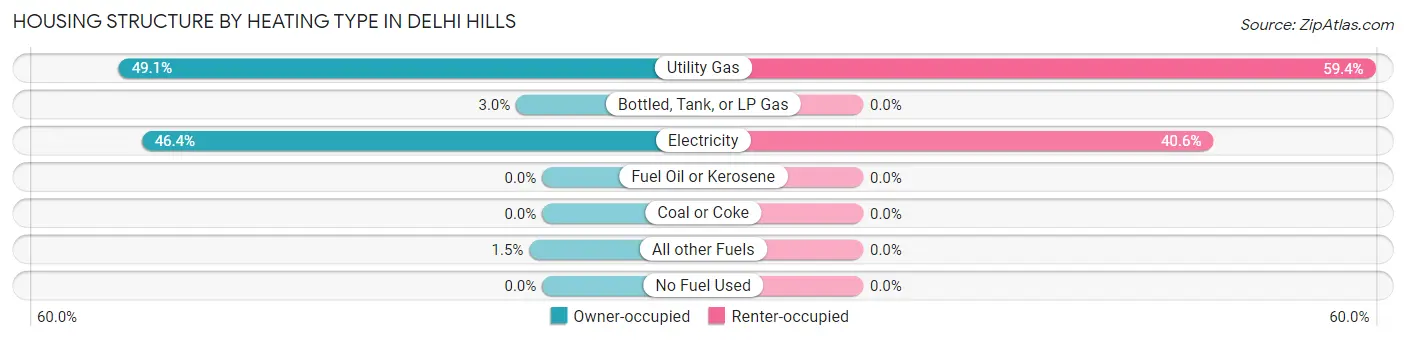
| Heating Type | Owner-occupied | Renter-occupied |
| Utility Gas | 849 (49.1%) | 79 (59.4%) |
| Bottled, Tank, or LP Gas | 52 (3.0%) | 0 (0.0%) |
| Electricity | 803 (46.4%) | 54 (40.6%) |
| Fuel Oil or Kerosene | 0 (0.0%) | 0 (0.0%) |
| Coal or Coke | 0 (0.0%) | 0 (0.0%) |
| All other Fuels | 26 (1.5%) | 0 (0.0%) |
| No Fuel Used | 0 (0.0%) | 0 (0.0%) |
| Total | 1,730 (100.0%) | 133 (100.0%) |
Household Vehicle Usage in Delhi Hills
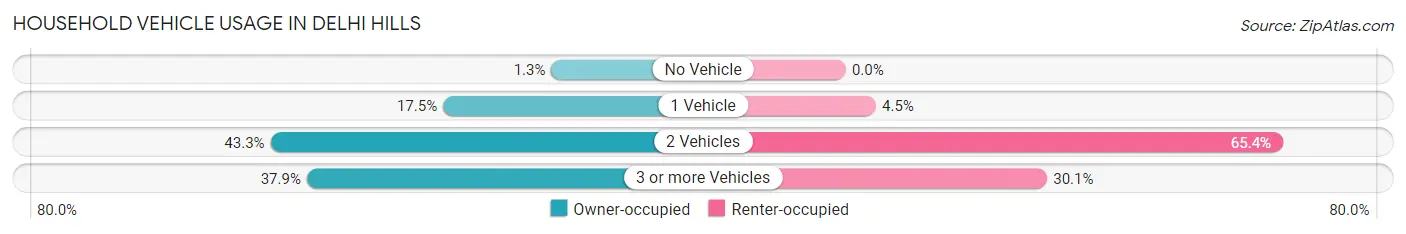
| Vehicles per Household | Owner-occupied | Renter-occupied |
| No Vehicle | 23 (1.3%) | 0 (0.0%) |
| 1 Vehicle | 303 (17.5%) | 6 (4.5%) |
| 2 Vehicles | 749 (43.3%) | 87 (65.4%) |
| 3 or more Vehicles | 655 (37.9%) | 40 (30.1%) |
| Total | 1,730 (100.0%) | 133 (100.0%) |
Real Estate & Mortgages in Delhi Hills
Real Estate and Mortgage Overview in Delhi Hills
| Characteristic | Without Mortgage | With Mortgage |
| Housing Units | 559 | 1,171 |
| Median Property Value | $183,500 | $175,900 |
| Median Household Income | $73,906 | $296 |
| Monthly Housing Costs | $602 | $0 |
| Real Estate Taxes | $3,350 | $41 |
Property Value by Mortgage Status in Delhi Hills
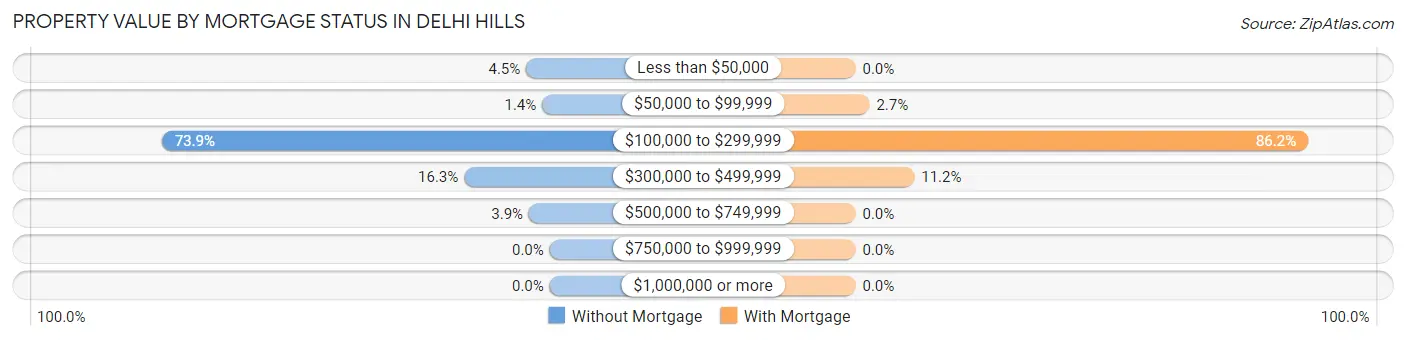
| Property Value | Without Mortgage | With Mortgage |
| Less than $50,000 | 25 (4.5%) | 0 (0.0%) |
| $50,000 to $99,999 | 8 (1.4%) | 31 (2.6%) |
| $100,000 to $299,999 | 413 (73.9%) | 1,009 (86.2%) |
| $300,000 to $499,999 | 91 (16.3%) | 131 (11.2%) |
| $500,000 to $749,999 | 22 (3.9%) | 0 (0.0%) |
| $750,000 to $999,999 | 0 (0.0%) | 0 (0.0%) |
| $1,000,000 or more | 0 (0.0%) | 0 (0.0%) |
| Total | 559 (100.0%) | 1,171 (100.0%) |
Household Income by Mortgage Status in Delhi Hills
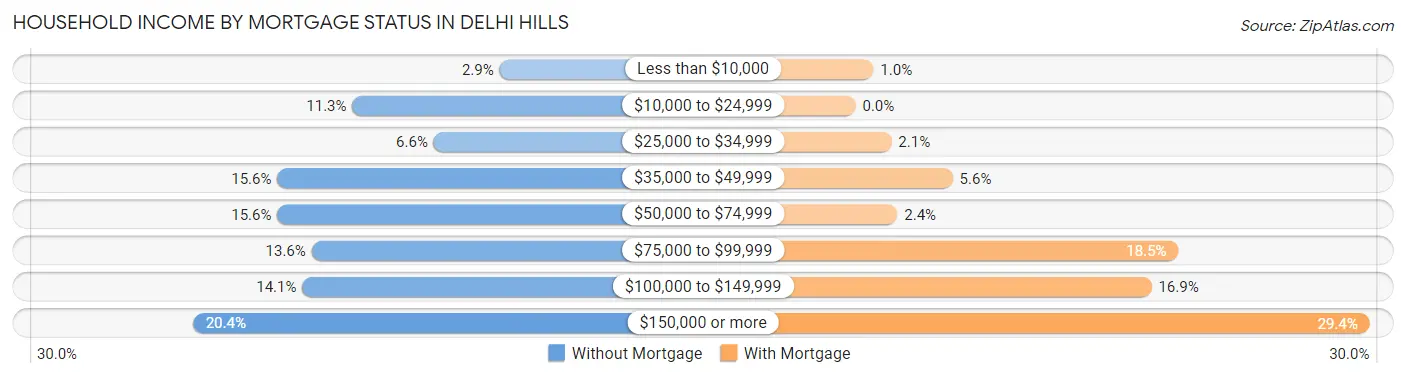
| Household Income | Without Mortgage | With Mortgage |
| Less than $10,000 | 16 (2.9%) | 12 (1.0%) |
| $10,000 to $24,999 | 63 (11.3%) | 0 (0.0%) |
| $25,000 to $34,999 | 37 (6.6%) | 24 (2.1%) |
| $35,000 to $49,999 | 87 (15.6%) | 65 (5.6%) |
| $50,000 to $74,999 | 87 (15.6%) | 28 (2.4%) |
| $75,000 to $99,999 | 76 (13.6%) | 216 (18.4%) |
| $100,000 to $149,999 | 79 (14.1%) | 198 (16.9%) |
| $150,000 or more | 114 (20.4%) | 344 (29.4%) |
| Total | 559 (100.0%) | 1,171 (100.0%) |
Property Value to Household Income Ratio in Delhi Hills
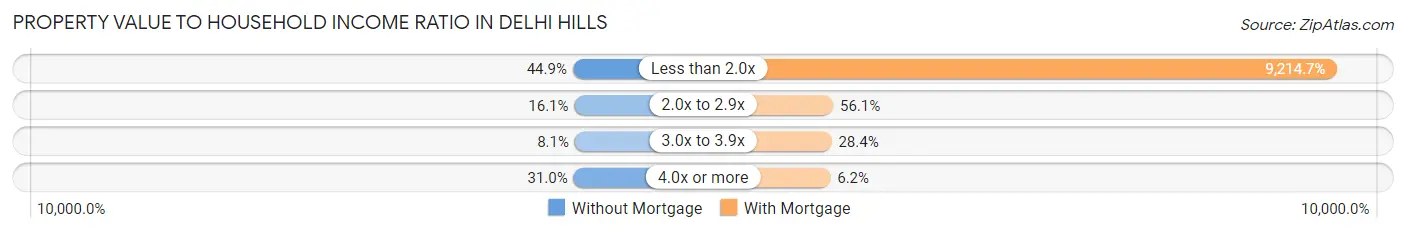
| Value-to-Income Ratio | Without Mortgage | With Mortgage |
| Less than 2.0x | 251 (44.9%) | 107,904 (9,214.7%) |
| 2.0x to 2.9x | 90 (16.1%) | 657 (56.1%) |
| 3.0x to 3.9x | 45 (8.1%) | 332 (28.3%) |
| 4.0x or more | 173 (30.9%) | 72 (6.1%) |
| Total | 559 (100.0%) | 1,171 (100.0%) |
Real Estate Taxes by Mortgage Status in Delhi Hills
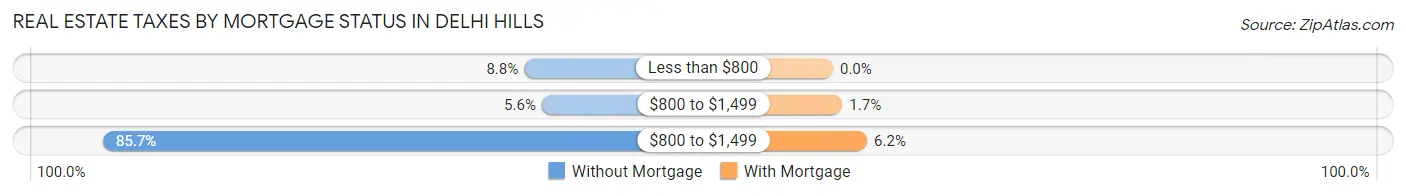
| Property Taxes | Without Mortgage | With Mortgage |
| Less than $800 | 49 (8.8%) | 0 (0.0%) |
| $800 to $1,499 | 31 (5.6%) | 20 (1.7%) |
| $800 to $1,499 | 479 (85.7%) | 73 (6.2%) |
| Total | 559 (100.0%) | 1,171 (100.0%) |
Health & Disability in Delhi Hills
Health Insurance Coverage by Age in Delhi Hills
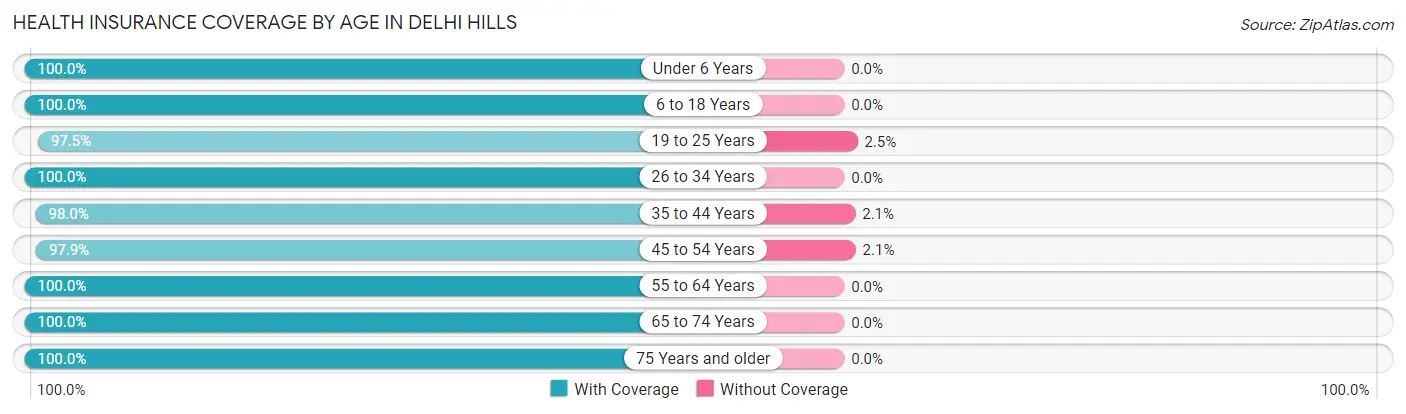
| Age Bracket | With Coverage | Without Coverage |
| Under 6 Years | 353 (100.0%) | 0 (0.0%) |
| 6 to 18 Years | 885 (100.0%) | 0 (0.0%) |
| 19 to 25 Years | 474 (97.5%) | 12 (2.5%) |
| 26 to 34 Years | 388 (100.0%) | 0 (0.0%) |
| 35 to 44 Years | 670 (98.0%) | 14 (2.1%) |
| 45 to 54 Years | 784 (97.9%) | 17 (2.1%) |
| 55 to 64 Years | 749 (100.0%) | 0 (0.0%) |
| 65 to 74 Years | 563 (100.0%) | 0 (0.0%) |
| 75 Years and older | 189 (100.0%) | 0 (0.0%) |
| Total | 5,055 (99.2%) | 43 (0.8%) |
Health Insurance Coverage by Citizenship Status in Delhi Hills
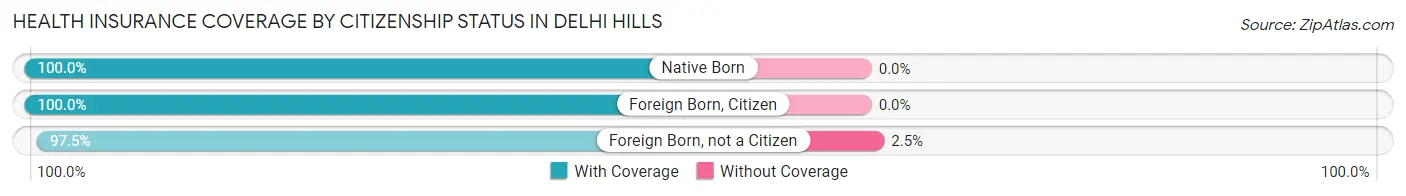
| Citizenship Status | With Coverage | Without Coverage |
| Native Born | 353 (100.0%) | 0 (0.0%) |
| Foreign Born, Citizen | 885 (100.0%) | 0 (0.0%) |
| Foreign Born, not a Citizen | 474 (97.5%) | 12 (2.5%) |
Health Insurance Coverage by Household Income in Delhi Hills
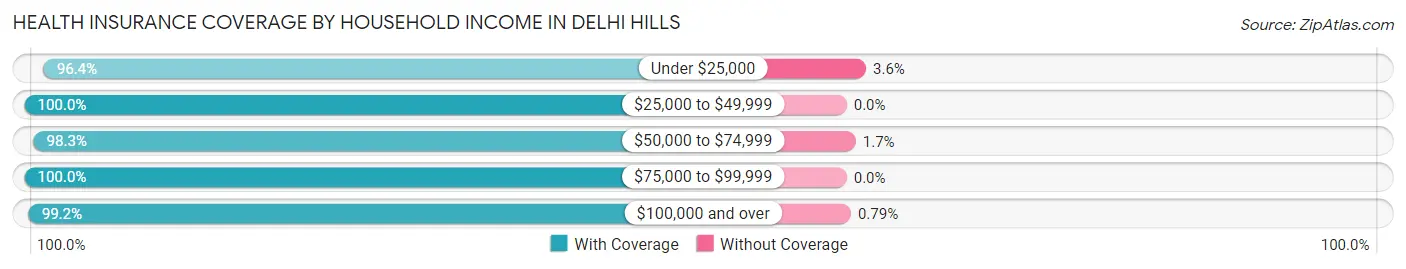
| Household Income | With Coverage | Without Coverage |
| Under $25,000 | 160 (96.4%) | 6 (3.6%) |
| $25,000 to $49,999 | 350 (100.0%) | 0 (0.0%) |
| $50,000 to $74,999 | 809 (98.3%) | 14 (1.7%) |
| $75,000 to $99,999 | 864 (100.0%) | 0 (0.0%) |
| $100,000 and over | 2,872 (99.2%) | 23 (0.8%) |
Public vs Private Health Insurance Coverage by Age in Delhi Hills
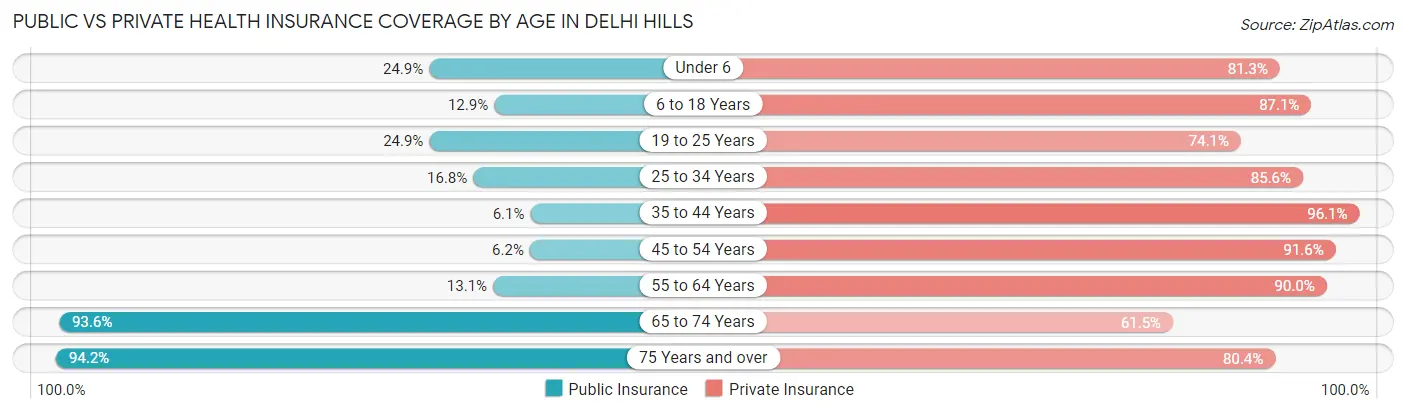
| Age Bracket | Public Insurance | Private Insurance |
| Under 6 | 88 (24.9%) | 287 (81.3%) |
| 6 to 18 Years | 114 (12.9%) | 771 (87.1%) |
| 19 to 25 Years | 121 (24.9%) | 360 (74.1%) |
| 25 to 34 Years | 65 (16.8%) | 332 (85.6%) |
| 35 to 44 Years | 42 (6.1%) | 657 (96.1%) |
| 45 to 54 Years | 50 (6.2%) | 734 (91.6%) |
| 55 to 64 Years | 98 (13.1%) | 674 (90.0%) |
| 65 to 74 Years | 527 (93.6%) | 346 (61.5%) |
| 75 Years and over | 178 (94.2%) | 152 (80.4%) |
| Total | 1,283 (25.2%) | 4,313 (84.6%) |
Disability Status by Sex by Age in Delhi Hills
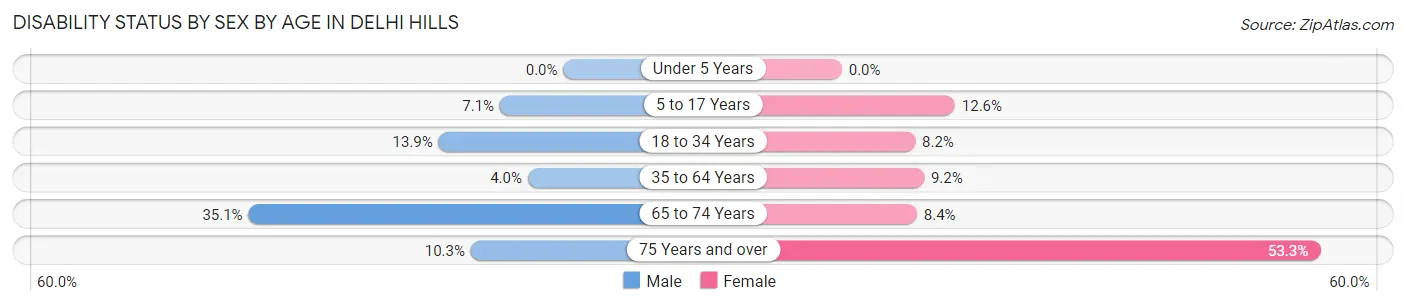
| Age Bracket | Male | Female |
| Under 5 Years | 0 (0.0%) | 0 (0.0%) |
| 5 to 17 Years | 25 (7.1%) | 70 (12.6%) |
| 18 to 34 Years | 70 (13.9%) | 32 (8.2%) |
| 35 to 64 Years | 43 (4.0%) | 105 (9.1%) |
| 65 to 74 Years | 101 (35.1%) | 23 (8.4%) |
| 75 Years and over | 10 (10.3%) | 49 (53.3%) |
Disability Class by Sex by Age in Delhi Hills
Disability Class: Hearing Difficulty
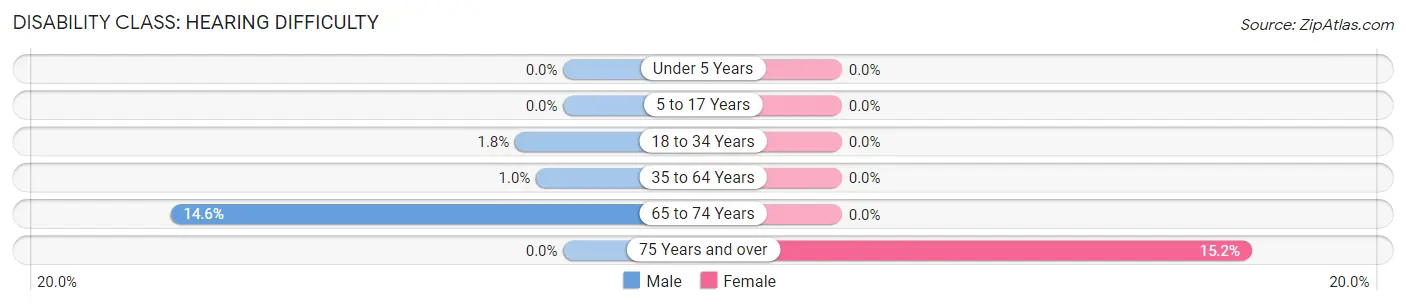
| Age Bracket | Male | Female |
| Under 5 Years | 0 (0.0%) | 0 (0.0%) |
| 5 to 17 Years | 0 (0.0%) | 0 (0.0%) |
| 18 to 34 Years | 9 (1.8%) | 0 (0.0%) |
| 35 to 64 Years | 11 (1.0%) | 0 (0.0%) |
| 65 to 74 Years | 42 (14.6%) | 0 (0.0%) |
| 75 Years and over | 0 (0.0%) | 14 (15.2%) |
Disability Class: Vision Difficulty
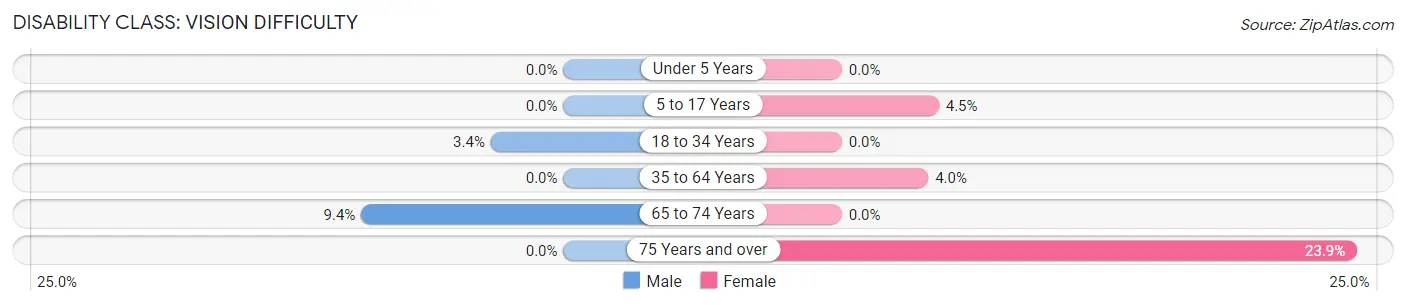
| Age Bracket | Male | Female |
| Under 5 Years | 0 (0.0%) | 0 (0.0%) |
| 5 to 17 Years | 0 (0.0%) | 25 (4.5%) |
| 18 to 34 Years | 17 (3.4%) | 0 (0.0%) |
| 35 to 64 Years | 0 (0.0%) | 46 (4.0%) |
| 65 to 74 Years | 27 (9.4%) | 0 (0.0%) |
| 75 Years and over | 0 (0.0%) | 22 (23.9%) |
Disability Class: Cognitive Difficulty
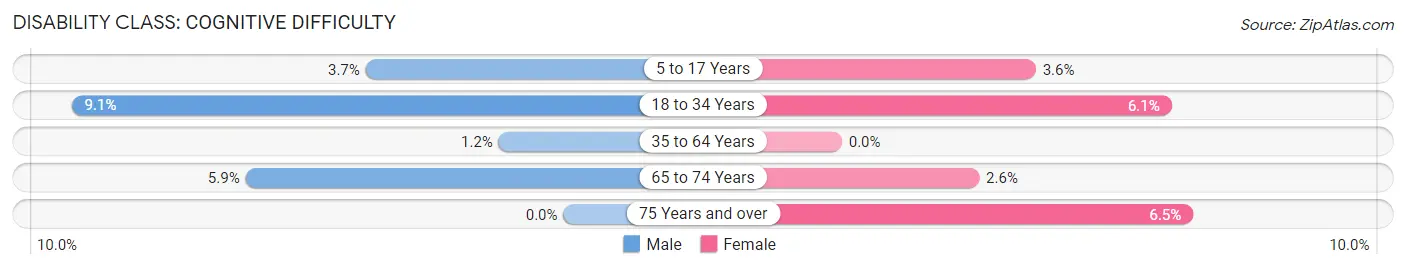
| Age Bracket | Male | Female |
| 5 to 17 Years | 13 (3.7%) | 20 (3.6%) |
| 18 to 34 Years | 46 (9.1%) | 24 (6.1%) |
| 35 to 64 Years | 13 (1.2%) | 0 (0.0%) |
| 65 to 74 Years | 17 (5.9%) | 7 (2.5%) |
| 75 Years and over | 0 (0.0%) | 6 (6.5%) |
Disability Class: Ambulatory Difficulty
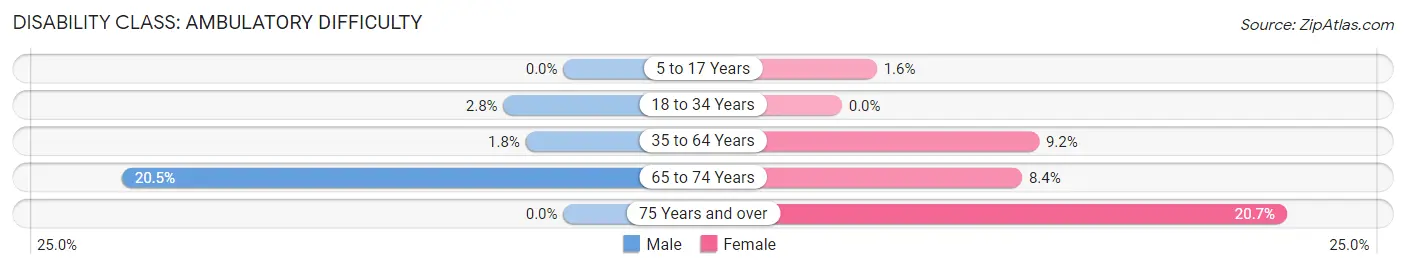
| Age Bracket | Male | Female |
| 5 to 17 Years | 0 (0.0%) | 9 (1.6%) |
| 18 to 34 Years | 14 (2.8%) | 0 (0.0%) |
| 35 to 64 Years | 19 (1.8%) | 105 (9.1%) |
| 65 to 74 Years | 59 (20.5%) | 23 (8.4%) |
| 75 Years and over | 0 (0.0%) | 19 (20.6%) |
Disability Class: Self-Care Difficulty
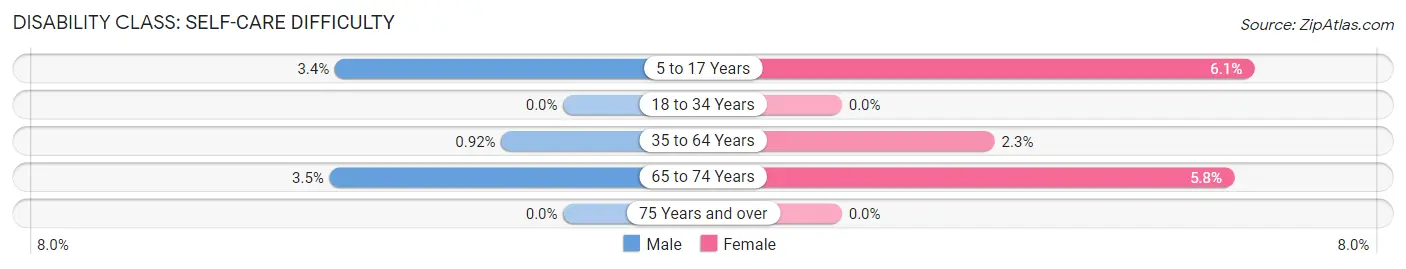
| Age Bracket | Male | Female |
| 5 to 17 Years | 12 (3.4%) | 34 (6.1%) |
| 18 to 34 Years | 0 (0.0%) | 0 (0.0%) |
| 35 to 64 Years | 10 (0.9%) | 26 (2.3%) |
| 65 to 74 Years | 10 (3.5%) | 16 (5.8%) |
| 75 Years and over | 0 (0.0%) | 0 (0.0%) |
Technology Access in Delhi Hills
Computing Device Access in Delhi Hills
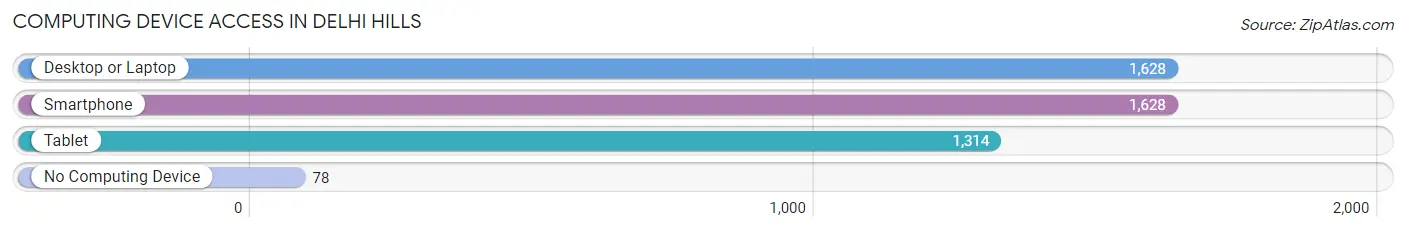
| Device Type | # Households | % Households |
| Desktop or Laptop | 1,628 | 87.4% |
| Smartphone | 1,628 | 87.4% |
| Tablet | 1,314 | 70.5% |
| No Computing Device | 78 | 4.2% |
| Total | 1,863 | 100.0% |
Internet Access in Delhi Hills
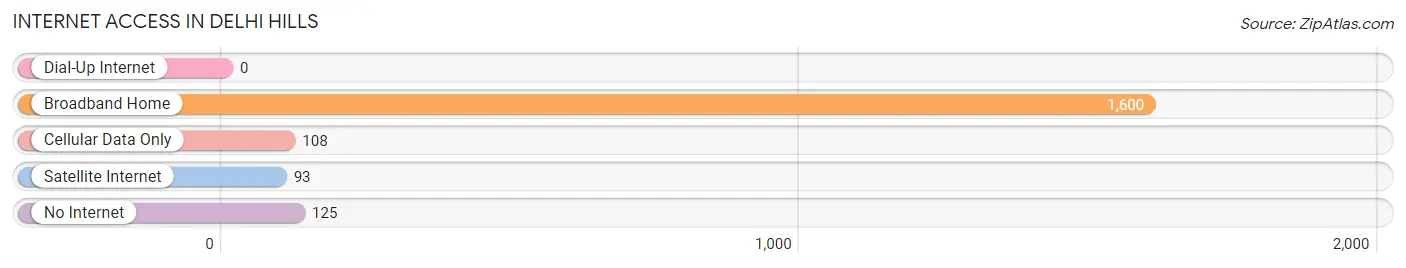
| Internet Type | # Households | % Households |
| Dial-Up Internet | 0 | 0.0% |
| Broadband Home | 1,600 | 85.9% |
| Cellular Data Only | 108 | 5.8% |
| Satellite Internet | 93 | 5.0% |
| No Internet | 125 | 6.7% |
| Total | 1,863 | 100.0% |
Delhi Hills Summary
Delhi Hills is a small, unincorporated community located in the eastern part of Hamilton County, Ohio. It is situated on the western edge of the city of Cincinnati, and is bordered by the communities of White Oak, Greenhills, and Bridgetown. The population of Delhi Hills was estimated to be 4,845 in 2019.
History
Delhi Hills was originally part of the Symmes Purchase, a large tract of land purchased by John Cleves Symmes in 1788. The area was first settled in the early 1800s by German immigrants, who named the area Delhi after the city in India. The area was later renamed Delhi Hills in the late 1800s.
In the early 1900s, the area was largely rural, with small farms and orchards. In the 1950s, the area began to experience rapid growth as the city of Cincinnati expanded outward. The area was annexed by the city of Cincinnati in the 1960s, and the population of Delhi Hills began to grow rapidly.
Geography
Delhi Hills is located in the eastern part of Hamilton County, Ohio. It is situated on the western edge of the city of Cincinnati, and is bordered by the communities of White Oak, Greenhills, and Bridgetown. The area is mostly flat, with some rolling hills. The terrain is mostly wooded, with some open fields.
The climate in Delhi Hills is humid continental, with hot summers and cold winters. The average annual temperature is around 50°F (10°C). The average annual precipitation is around 40 inches (101 cm).
Economy
The economy of Delhi Hills is largely based on retail and services. The area is home to several shopping centers, including Delhi Plaza, Delhi Towne Center, and Delhi Hills Shopping Center. There are also several restaurants, banks, and other businesses in the area.
The area is also home to several industrial and manufacturing businesses, including the Cincinnati Milacron plant, which produces plastic injection molding machines.
Demographics
As of 2019, the population of Delhi Hills was estimated to be 4,845. The racial makeup of the area is 79.3% White, 11.2% African American, 4.2% Asian, and 5.3% other. The median household income is $50,945, and the median home value is $164,000.
The area is served by the Cincinnati Public Schools district. The area is also home to several private schools, including St. Xavier High School, St. Ursula Academy, and Summit Country Day School.
Conclusion
Delhi Hills is a small, unincorporated community located in the eastern part of Hamilton County, Ohio. It is situated on the western edge of the city of Cincinnati, and is bordered by the communities of White Oak, Greenhills, and Bridgetown. The population of Delhi Hills was estimated to be 4,845 in 2019. The economy of Delhi Hills is largely based on retail and services, and the area is also home to several industrial and manufacturing businesses. The racial makeup of the area is 79.3% White, 11.2% African American, 4.2% Asian, and 5.3% other. The median household income is $50,945, and the median home value is $164,000. Delhi Hills is served by the Cincinnati Public Schools district, as well as several private schools.
Common Questions
What is Per Capita Income in Delhi Hills?
Per Capita income in Delhi Hills is $43,220.
What is the Median Family Income in Delhi Hills?
Median Family Income in Delhi Hills is $106,797.
What is the Median Household income in Delhi Hills?
Median Household Income in Delhi Hills is $94,023.
What is Income or Wage Gap in Delhi Hills?
Income or Wage Gap in Delhi Hills is 23.6%.
Women in Delhi Hills earn 76.4 cents for every dollar earned by a man.
What is Family Income Deficit in Delhi Hills?
Family Income Deficit in Delhi Hills is $7,747.
Families that are below poverty line in Delhi Hills earn $7,747 less on average than the poverty threshold level.
What is Inequality or Gini Index in Delhi Hills?
Inequality or Gini Index in Delhi Hills is 0.41.
What is the Total Population of Delhi Hills?
Total Population of Delhi Hills is 5,098.
What is the Total Male Population of Delhi Hills?
Total Male Population of Delhi Hills is 2,521.
What is the Total Female Population of Delhi Hills?
Total Female Population of Delhi Hills is 2,577.
What is the Ratio of Males per 100 Females in Delhi Hills?
There are 97.83 Males per 100 Females in Delhi Hills.
What is the Ratio of Females per 100 Males in Delhi Hills?
There are 102.22 Females per 100 Males in Delhi Hills.
What is the Median Population Age in Delhi Hills?
Median Population Age in Delhi Hills is 40.1 Years.
What is the Average Family Size in Delhi Hills
Average Family Size in Delhi Hills is 3.0 People.
What is the Average Household Size in Delhi Hills
Average Household Size in Delhi Hills is 2.7 People.
How Large is the Labor Force in Delhi Hills?
There are 2,872 People in the Labor Forcein in Delhi Hills.
What is the Percentage of People in the Labor Force in Delhi Hills?
70.4% of People are in the Labor Force in Delhi Hills.
What is the Unemployment Rate in Delhi Hills?
Unemployment Rate in Delhi Hills is 2.4%.