Clark Mills, NY Map & Demographics
Clark Mills Map
Clark Mills Overview
$44,999
PER CAPITA INCOME
$117,607
AVG FAMILY INCOME
$63,980
AVG HOUSEHOLD INCOME
7.7%
WAGE / INCOME GAP [ % ]
92.3¢/ $1
WAGE / INCOME GAP [ $ ]
0.35
INEQUALITY / GINI INDEX
1,749
TOTAL POPULATION
783
MALE POPULATION
966
FEMALE POPULATION
81.06
MALES / 100 FEMALES
123.37
FEMALES / 100 MALES
51.2
MEDIAN AGE
2.8
AVG FAMILY SIZE
1.9
AVG HOUSEHOLD SIZE
922
LABOR FORCE [ PEOPLE ]
63.3%
PERCENT IN LABOR FORCE
1.1%
UNEMPLOYMENT RATE
Clark Mills Zip Codes
Clark Mills Area Codes
Income in Clark Mills
Income Overview in Clark Mills
Per Capita Income in Clark Mills is $44,999, while median incomes of families and households are $117,607 and $63,980 respectively.
| Characteristic | Number | Measure |
| Per Capita Income | 1,749 | $44,999 |
| Median Family Income | 385 | $117,607 |
| Mean Family Income | 385 | $112,769 |
| Median Household Income | 929 | $63,980 |
| Mean Household Income | 929 | $86,219 |
| Income Deficit | 385 | $0 |
| Wage / Income Gap (%) | 1,749 | 7.73% |
| Wage / Income Gap ($) | 1,749 | 92.27¢ per $1 |
| Gini / Inequality Index | 1,749 | 0.35 |
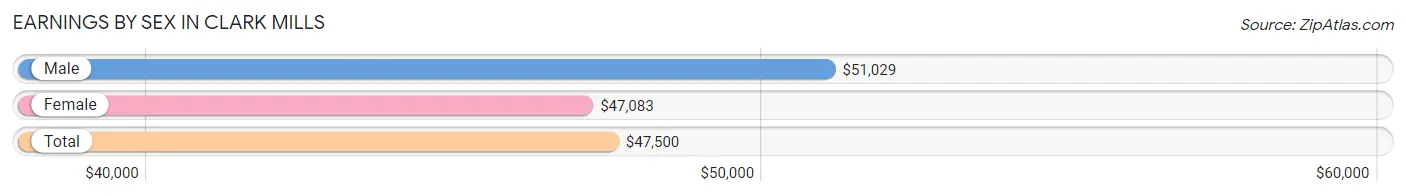
Earnings by Sex in Clark Mills
Average Earnings in Clark Mills are $47,500, $51,029 for men and $47,083 for women, a difference of 7.7%.
| Sex | Number | Average Earnings |
| Male | 480 (47.3%) | $51,029 |
| Female | 534 (52.7%) | $47,083 |
| Total | 1,014 (100.0%) | $47,500 |
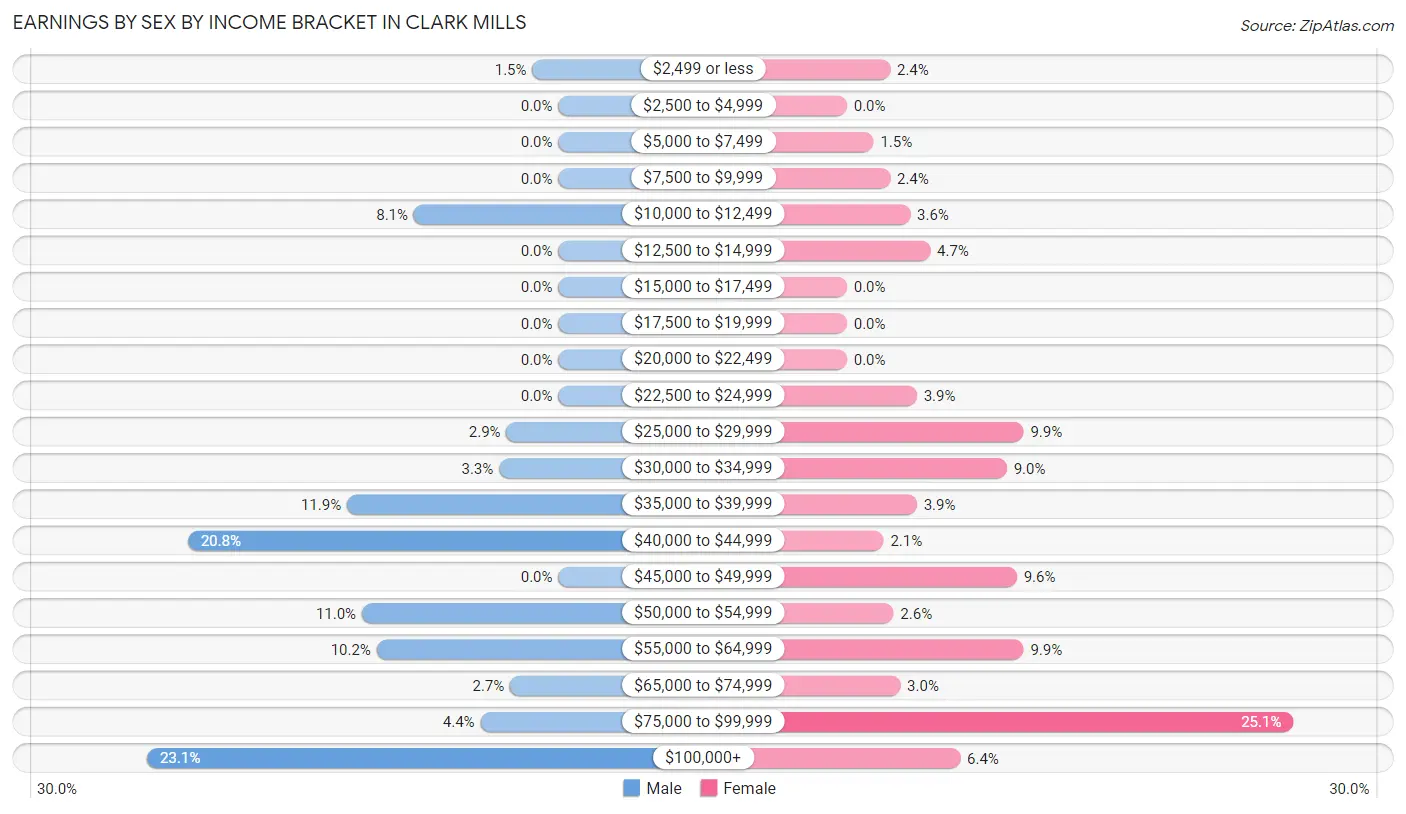
Earnings by Sex by Income Bracket in Clark Mills
The most common earnings brackets in Clark Mills are $100,000+ for men (111 | 23.1%) and $75,000 to $99,999 for women (134 | 25.1%).
| Income | Male | Female |
| $2,499 or less | 7 (1.5%) | 13 (2.4%) |
| $2,500 to $4,999 | 0 (0.0%) | 0 (0.0%) |
| $5,000 to $7,499 | 0 (0.0%) | 8 (1.5%) |
| $7,500 to $9,999 | 0 (0.0%) | 13 (2.4%) |
| $10,000 to $12,499 | 39 (8.1%) | 19 (3.6%) |
| $12,500 to $14,999 | 0 (0.0%) | 25 (4.7%) |
| $15,000 to $17,499 | 0 (0.0%) | 0 (0.0%) |
| $17,500 to $19,999 | 0 (0.0%) | 0 (0.0%) |
| $20,000 to $22,499 | 0 (0.0%) | 0 (0.0%) |
| $22,500 to $24,999 | 0 (0.0%) | 21 (3.9%) |
| $25,000 to $29,999 | 14 (2.9%) | 53 (9.9%) |
| $30,000 to $34,999 | 16 (3.3%) | 48 (9.0%) |
| $35,000 to $39,999 | 57 (11.9%) | 21 (3.9%) |
| $40,000 to $44,999 | 100 (20.8%) | 11 (2.1%) |
| $45,000 to $49,999 | 0 (0.0%) | 51 (9.6%) |
| $50,000 to $54,999 | 53 (11.0%) | 14 (2.6%) |
| $55,000 to $64,999 | 49 (10.2%) | 53 (9.9%) |
| $65,000 to $74,999 | 13 (2.7%) | 16 (3.0%) |
| $75,000 to $99,999 | 21 (4.4%) | 134 (25.1%) |
| $100,000+ | 111 (23.1%) | 34 (6.4%) |
| Total | 480 (100.0%) | 534 (100.0%) |
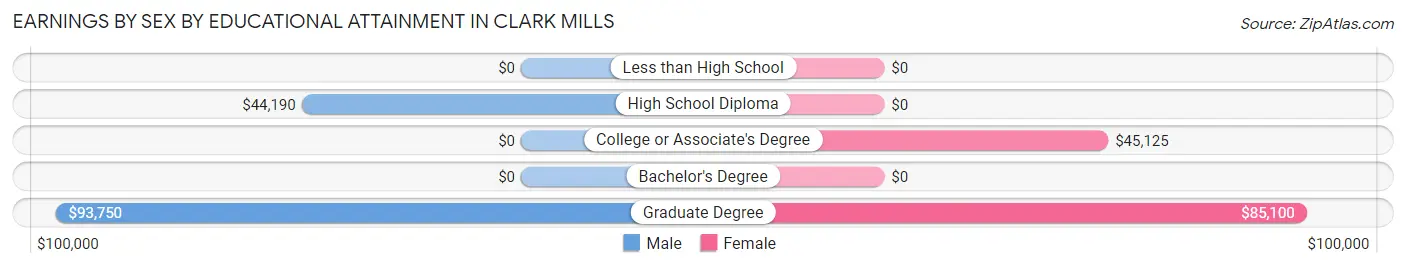
Earnings by Sex by Educational Attainment in Clark Mills
Average earnings in Clark Mills are $52,569 for men and $50,268 for women, a difference of 4.4%. Men with an educational attainment of graduate degree enjoy the highest average annual earnings of $93,750, while those with high school diploma education earn the least with $44,190. Women with an educational attainment of graduate degree earn the most with the average annual earnings of $85,100, while those with college or associate's degree education have the smallest earnings of $45,125.
| Educational Attainment | Male Income | Female Income |
| Less than High School | - | - |
| High School Diploma | $44,190 | $0 |
| College or Associate's Degree | - | - |
| Bachelor's Degree | - | - |
| Graduate Degree | $93,750 | $85,100 |
| Total | $52,569 | $50,268 |
Family Income in Clark Mills
Family Income Brackets in Clark Mills
According to the Clark Mills family income data, there are 145 families falling into the $100,000 to $149,999 income range, which is the most common income bracket and makes up 37.7% of all families.
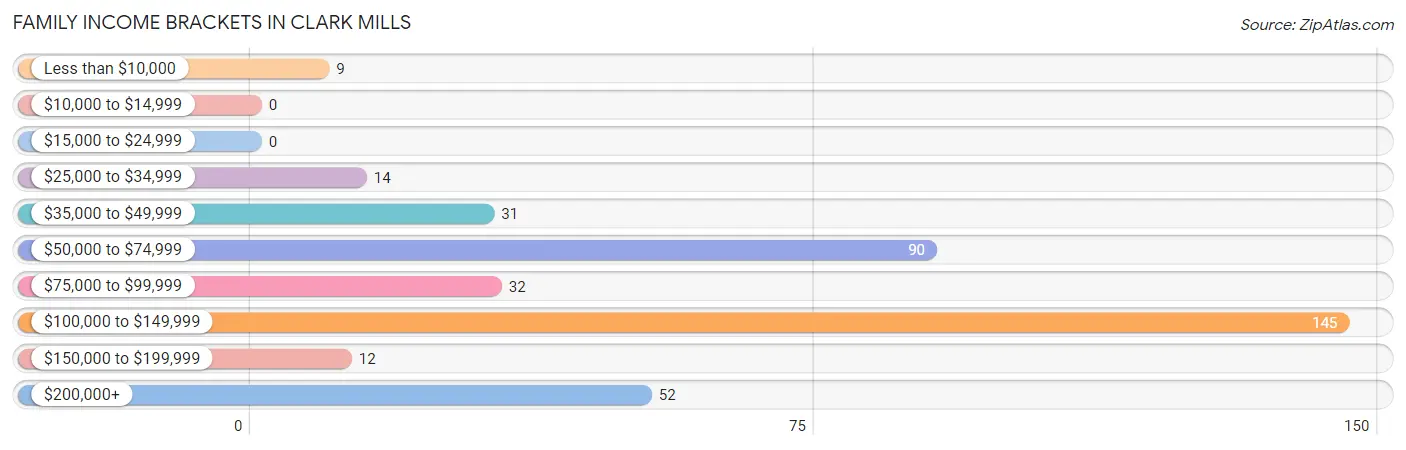
| Income Bracket | # Families | % Families |
| Less than $10,000 | 9 | 2.3% |
| $10,000 to $14,999 | 0 | 0.0% |
| $15,000 to $24,999 | 0 | 0.0% |
| $25,000 to $34,999 | 14 | 3.6% |
| $35,000 to $49,999 | 31 | 8.1% |
| $50,000 to $74,999 | 90 | 23.4% |
| $75,000 to $99,999 | 32 | 8.3% |
| $100,000 to $149,999 | 145 | 37.7% |
| $150,000 to $199,999 | 12 | 3.1% |
| $200,000+ | 52 | 13.5% |
Family Income by Famaliy Size in Clark Mills
3-person families (39 | 10.1%) account for the highest median family income in Clark Mills with $122,656 per family, while 2-person families (232 | 60.3%) have the highest median income of $42,829 per family member.
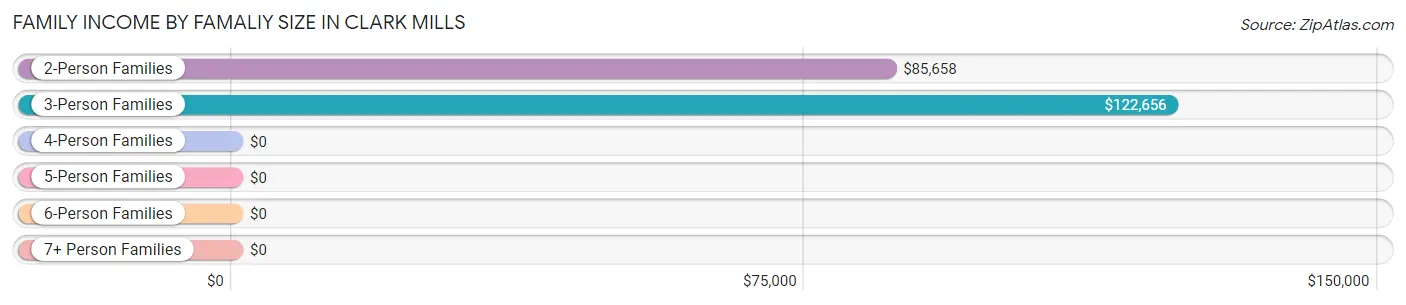
| Income Bracket | # Families | Median Income |
| 2-Person Families | 232 (60.3%) | $85,658 |
| 3-Person Families | 39 (10.1%) | $122,656 |
| 4-Person Families | 80 (20.8%) | $0 |
| 5-Person Families | 34 (8.8%) | $0 |
| 6-Person Families | 0 (0.0%) | $0 |
| 7+ Person Families | 0 (0.0%) | $0 |
| Total | 385 (100.0%) | $117,607 |
Family Income by Number of Earners in Clark Mills
The median family income in Clark Mills is $117,607, with families comprising 3+ earners (44) having the highest median family income of $218,500, while families with no earners (94) have the lowest median family income of $51,750, accounting for 11.4% and 24.4% of families, respectively.
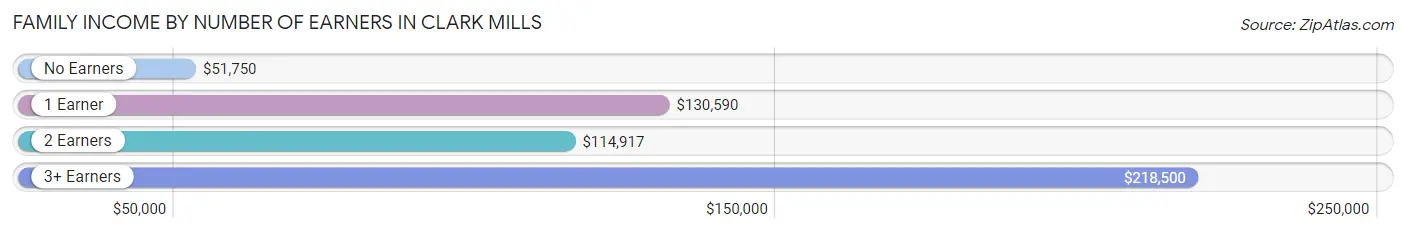
| Number of Earners | # Families | Median Income |
| No Earners | 94 (24.4%) | $51,750 |
| 1 Earner | 110 (28.6%) | $130,590 |
| 2 Earners | 137 (35.6%) | $114,917 |
| 3+ Earners | 44 (11.4%) | $218,500 |
| Total | 385 (100.0%) | $117,607 |
Household Income in Clark Mills
Household Income Brackets in Clark Mills
With 294 households falling in the category, the $50,000 to $74,999 income range is the most frequent in Clark Mills, accounting for 31.7% of all households.
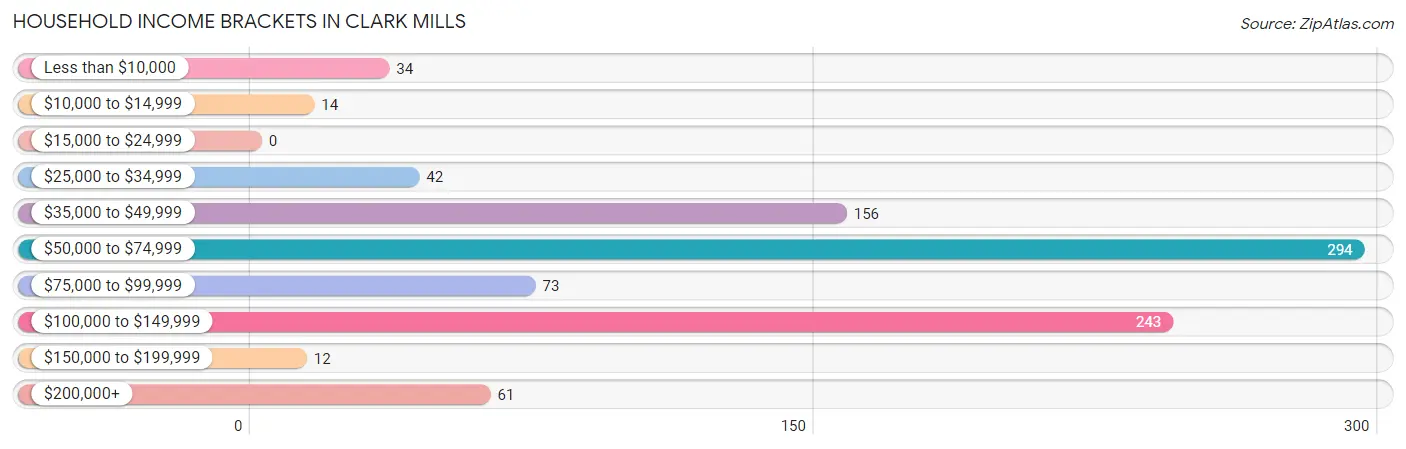
| Income Bracket | # Households | % Households |
| Less than $10,000 | 34 | 3.7% |
| $10,000 to $14,999 | 14 | 1.5% |
| $15,000 to $24,999 | 0 | 0.0% |
| $25,000 to $34,999 | 42 | 4.5% |
| $35,000 to $49,999 | 156 | 16.8% |
| $50,000 to $74,999 | 294 | 31.6% |
| $75,000 to $99,999 | 73 | 7.9% |
| $100,000 to $149,999 | 243 | 26.2% |
| $150,000 to $199,999 | 12 | 1.3% |
| $200,000+ | 61 | 6.6% |
Household Income by Householder Age in Clark Mills
The median household income in Clark Mills is $63,980, with the highest median household income of $117,679 found in the 45 to 64 years age bracket for the primary householder. A total of 457 households (49.2%) fall into this category.
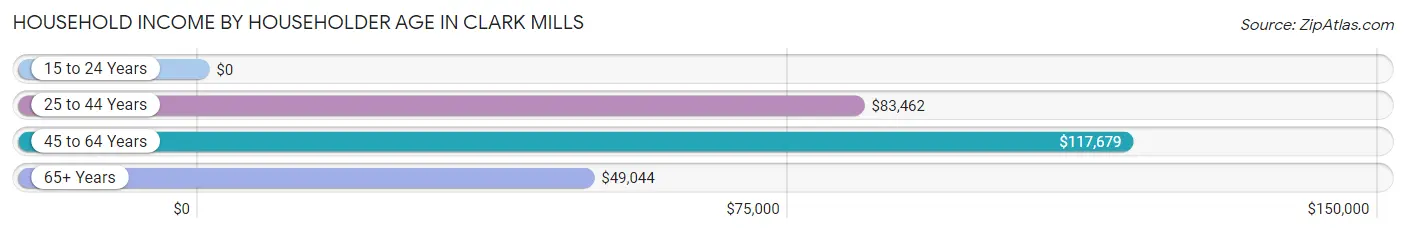
| Income Bracket | # Households | Median Income |
| 15 to 24 Years | 0 (0.0%) | $0 |
| 25 to 44 Years | 204 (22.0%) | $83,462 |
| 45 to 64 Years | 457 (49.2%) | $117,679 |
| 65+ Years | 268 (28.8%) | $49,044 |
| Total | 929 (100.0%) | $63,980 |
Poverty in Clark Mills
Income Below Poverty by Sex and Age in Clark Mills
With 5.1% poverty level for males and 6.3% for females among the residents of Clark Mills, 35 to 44 year old males and 55 to 64 year old females are the most vulnerable to poverty, with 15 males (20.8%) and 44 females (18.1%) in their respective age groups living below the poverty level.
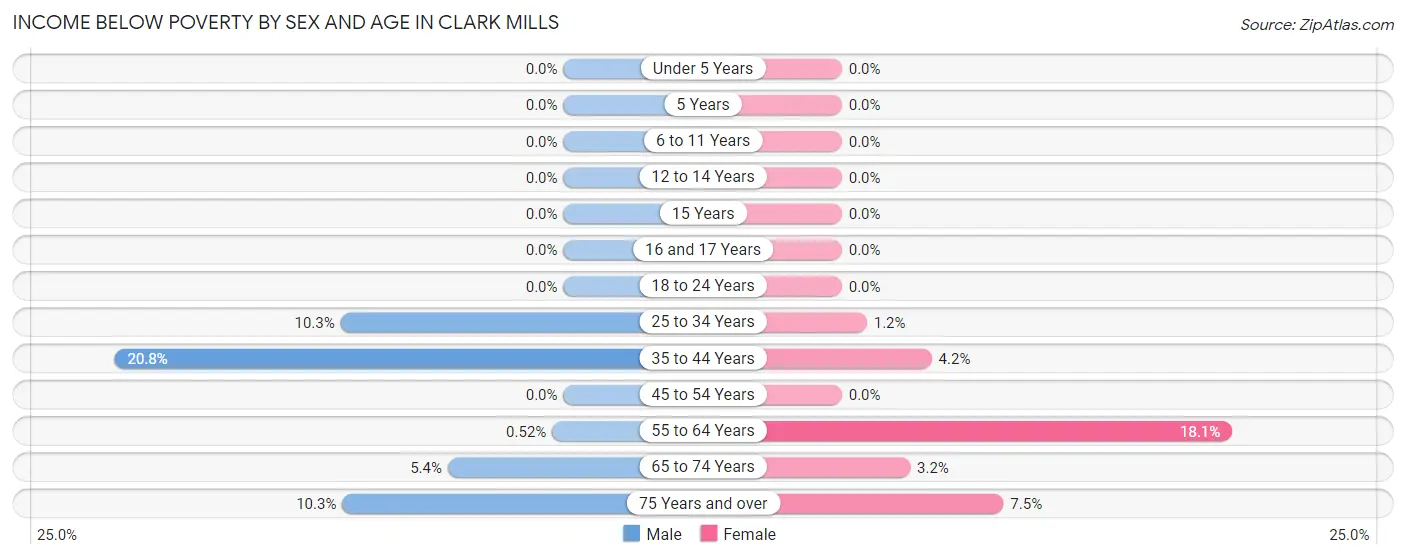
| Age Bracket | Male | Female |
| Under 5 Years | 0 (0.0%) | 0 (0.0%) |
| 5 Years | 0 (0.0%) | 0 (0.0%) |
| 6 to 11 Years | 0 (0.0%) | 0 (0.0%) |
| 12 to 14 Years | 0 (0.0%) | 0 (0.0%) |
| 15 Years | 0 (0.0%) | 0 (0.0%) |
| 16 and 17 Years | 0 (0.0%) | 0 (0.0%) |
| 18 to 24 Years | 0 (0.0%) | 0 (0.0%) |
| 25 to 34 Years | 12 (10.3%) | 2 (1.2%) |
| 35 to 44 Years | 15 (20.8%) | 1 (4.2%) |
| 45 to 54 Years | 0 (0.0%) | 0 (0.0%) |
| 55 to 64 Years | 1 (0.5%) | 44 (18.1%) |
| 65 to 74 Years | 3 (5.4%) | 4 (3.2%) |
| 75 Years and over | 8 (10.3%) | 9 (7.5%) |
| Total | 39 (5.1%) | 60 (6.3%) |
Income Above Poverty by Sex and Age in Clark Mills
According to the poverty statistics in Clark Mills, males aged under 5 years and females aged under 5 years are the age groups that are most secure financially, with 100.0% of males and 100.0% of females in these age groups living above the poverty line.
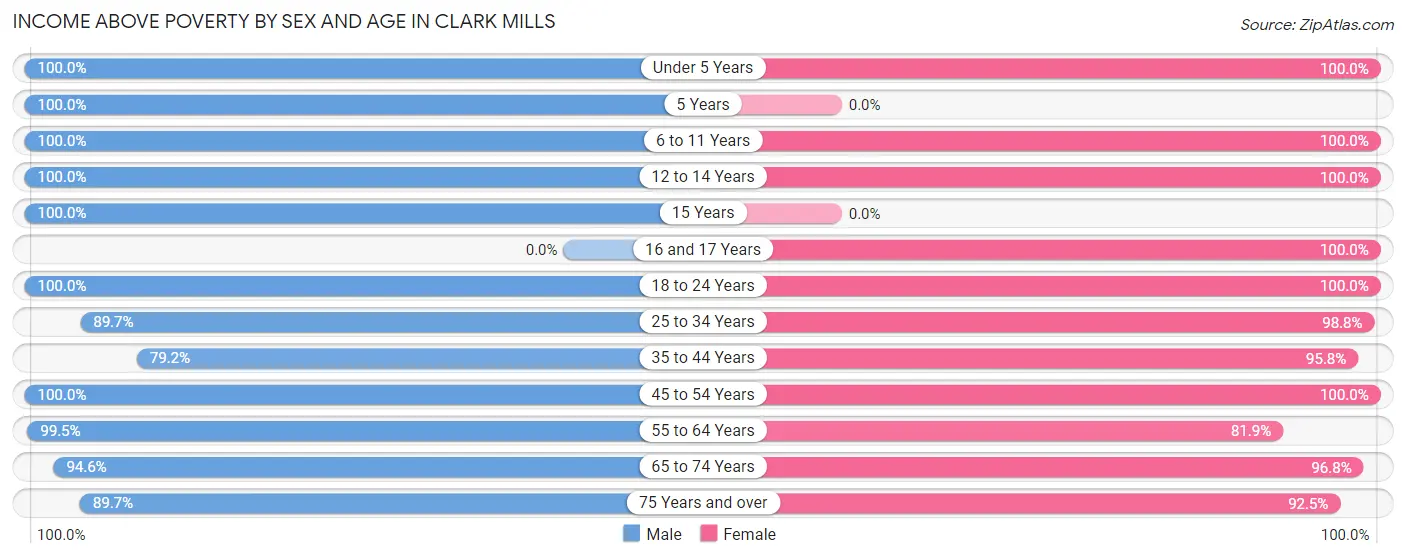
| Age Bracket | Male | Female |
| Under 5 Years | 31 (100.0%) | 49 (100.0%) |
| 5 Years | 27 (100.0%) | 0 (0.0%) |
| 6 to 11 Years | 25 (100.0%) | 63 (100.0%) |
| 12 to 14 Years | 38 (100.0%) | 29 (100.0%) |
| 15 Years | 4 (100.0%) | 0 (0.0%) |
| 16 and 17 Years | 0 (0.0%) | 13 (100.0%) |
| 18 to 24 Years | 22 (100.0%) | 22 (100.0%) |
| 25 to 34 Years | 104 (89.7%) | 171 (98.8%) |
| 35 to 44 Years | 57 (79.2%) | 23 (95.8%) |
| 45 to 54 Years | 106 (100.0%) | 91 (100.0%) |
| 55 to 64 Years | 193 (99.5%) | 199 (81.9%) |
| 65 to 74 Years | 53 (94.6%) | 122 (96.8%) |
| 75 Years and over | 70 (89.7%) | 111 (92.5%) |
| Total | 730 (94.9%) | 893 (93.7%) |
Income Below Poverty Among Married-Couple Families in Clark Mills
The poverty statistics for married-couple families in Clark Mills show that 2.8% or 9 of the total 323 families live below the poverty line. Families with no children have the highest poverty rate of 4.0%, comprising of 9 families. On the other hand, families with 1 or 2 children have the lowest poverty rate of 0.0%, which includes 0 families.
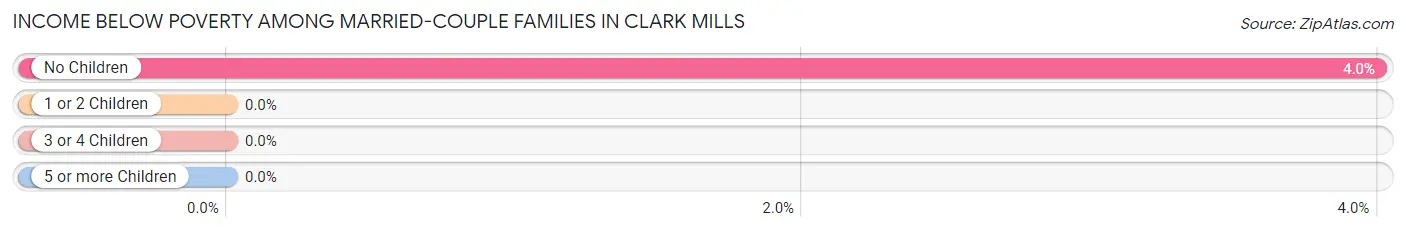
| Children | Above Poverty | Below Poverty |
| No Children | 216 (96.0%) | 9 (4.0%) |
| 1 or 2 Children | 64 (100.0%) | 0 (0.0%) |
| 3 or 4 Children | 34 (100.0%) | 0 (0.0%) |
| 5 or more Children | 0 (0.0%) | 0 (0.0%) |
| Total | 314 (97.2%) | 9 (2.8%) |
Income Below Poverty Among Single-Parent Households in Clark Mills
| Children | Single Father | Single Mother |
| No Children | 0 (0.0%) | 0 (0.0%) |
| 1 or 2 Children | 0 (0.0%) | 0 (0.0%) |
| 3 or 4 Children | 0 (0.0%) | 0 (0.0%) |
| 5 or more Children | 0 (0.0%) | 0 (0.0%) |
| Total | 0 (0.0%) | 0 (0.0%) |
Income Below Poverty Among Married-Couple vs Single-Parent Households in Clark Mills
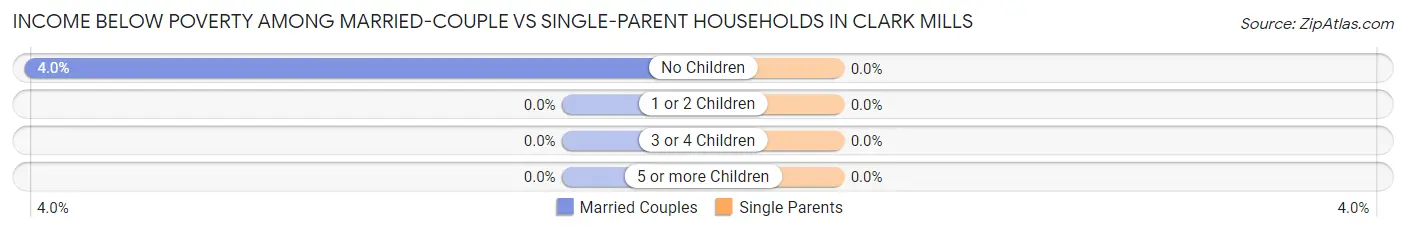
| Children | Married-Couple Families | Single-Parent Households |
| No Children | 9 (4.0%) | 0 (0.0%) |
| 1 or 2 Children | 0 (0.0%) | 0 (0.0%) |
| 3 or 4 Children | 0 (0.0%) | 0 (0.0%) |
| 5 or more Children | 0 (0.0%) | 0 (0.0%) |
| Total | 9 (2.8%) | 0 (0.0%) |
Race in Clark Mills
The most populous races in Clark Mills are White / Caucasian (1,688 | 96.5%), Hispanic or Latino (46 | 2.6%), and Two or more Races (45 | 2.6%).
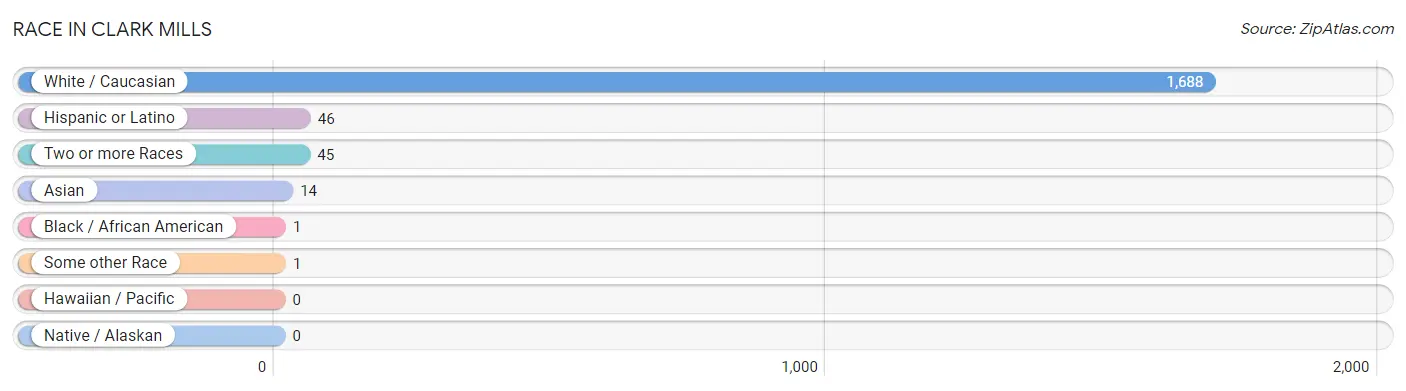
| Race | # Population | % Population |
| Asian | 14 | 0.8% |
| Black / African American | 1 | 0.1% |
| Hawaiian / Pacific | 0 | 0.0% |
| Hispanic or Latino | 46 | 2.6% |
| Native / Alaskan | 0 | 0.0% |
| White / Caucasian | 1,688 | 96.5% |
| Two or more Races | 45 | 2.6% |
| Some other Race | 1 | 0.1% |
| Total | 1,749 | 100.0% |
Ancestry in Clark Mills
The most populous ancestries reported in Clark Mills are Irish (432 | 24.7%), Italian (392 | 22.4%), German (365 | 20.9%), Polish (341 | 19.5%), and English (275 | 15.7%), together accounting for 103.2% of all Clark Mills residents.
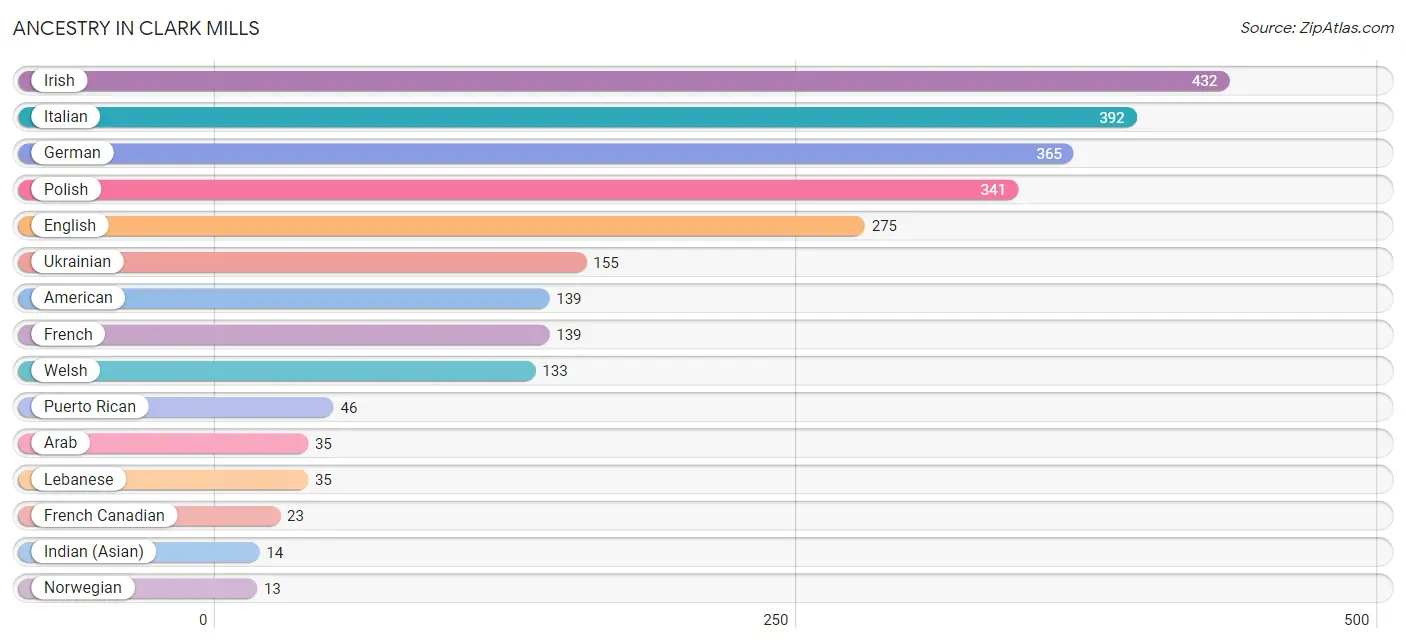
| Ancestry | # Population | % Population |
| American | 139 | 8.0% |
| Arab | 35 | 2.0% |
| Czech | 10 | 0.6% |
| English | 275 | 15.7% |
| European | 8 | 0.5% |
| French | 139 | 8.0% |
| French Canadian | 23 | 1.3% |
| German | 365 | 20.9% |
| Indian (Asian) | 14 | 0.8% |
| Irish | 432 | 24.7% |
| Italian | 392 | 22.4% |
| Lebanese | 35 | 2.0% |
| Norwegian | 13 | 0.7% |
| Polish | 341 | 19.5% |
| Puerto Rican | 46 | 2.6% |
| Scottish | 11 | 0.6% |
| Ukrainian | 155 | 8.9% |
| Welsh | 133 | 7.6% | View All 18 Rows |
Immigrants in Clark Mills
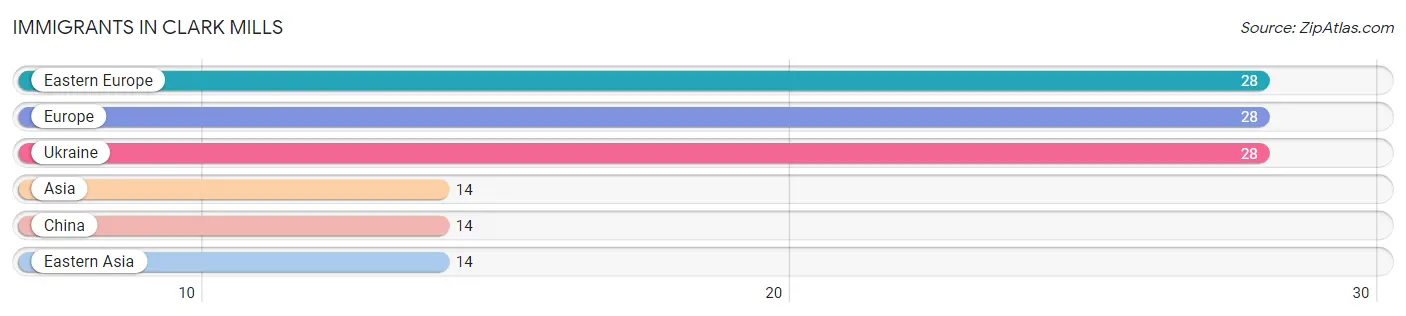
The most numerous immigrant groups reported in Clark Mills came from Eastern Europe (28 | 1.6%), Europe (28 | 1.6%), Ukraine (28 | 1.6%), Asia (14 | 0.8%), and China (14 | 0.8%), together accounting for 6.4% of all Clark Mills residents.
| Immigration Origin | # Population | % Population |
| Asia | 14 | 0.8% |
| China | 14 | 0.8% |
| Eastern Asia | 14 | 0.8% |
| Eastern Europe | 28 | 1.6% |
| Europe | 28 | 1.6% |
| Ukraine | 28 | 1.6% | View All 6 Rows |
Sex and Age in Clark Mills
Sex and Age in Clark Mills
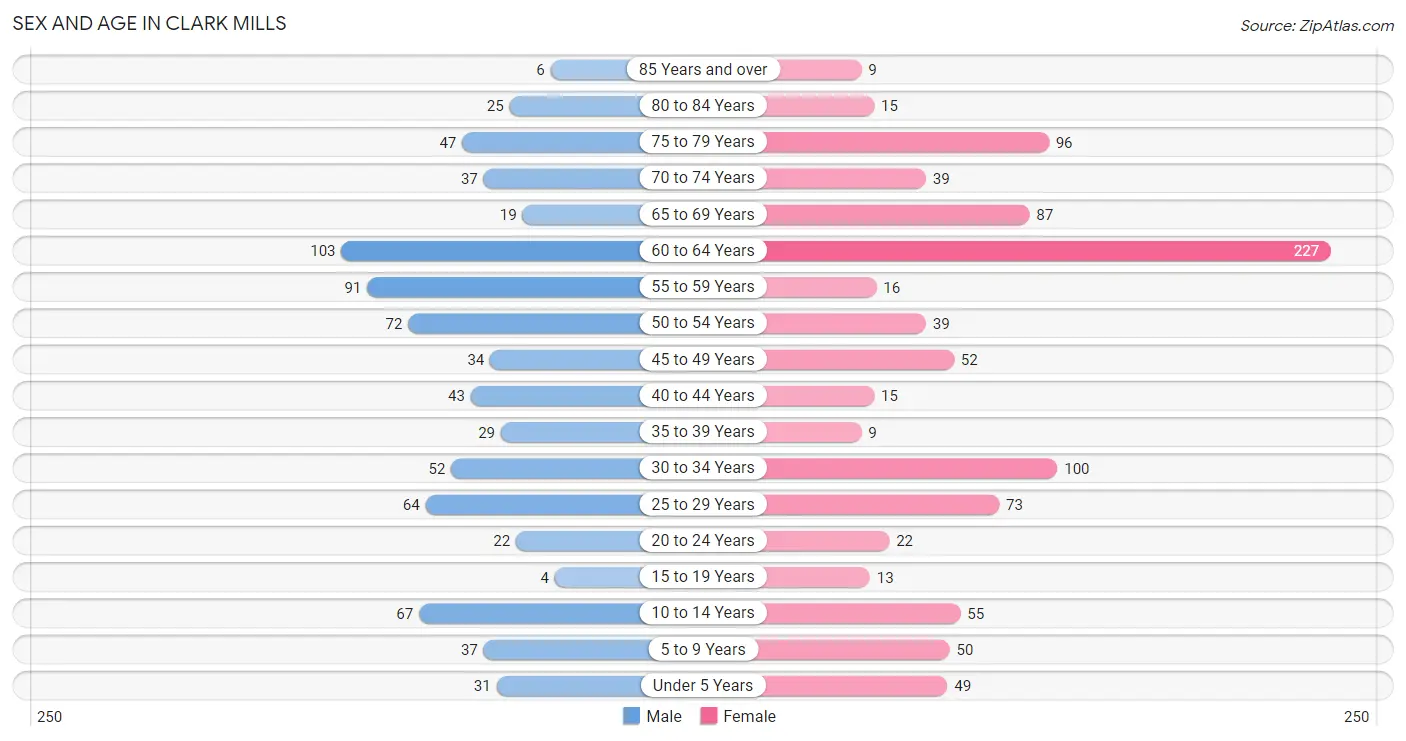
The most populous age groups in Clark Mills are 60 to 64 Years (103 | 13.2%) for men and 60 to 64 Years (227 | 23.5%) for women.
| Age Bracket | Male | Female |
| Under 5 Years | 31 (4.0%) | 49 (5.1%) |
| 5 to 9 Years | 37 (4.7%) | 50 (5.2%) |
| 10 to 14 Years | 67 (8.6%) | 55 (5.7%) |
| 15 to 19 Years | 4 (0.5%) | 13 (1.3%) |
| 20 to 24 Years | 22 (2.8%) | 22 (2.3%) |
| 25 to 29 Years | 64 (8.2%) | 73 (7.6%) |
| 30 to 34 Years | 52 (6.6%) | 100 (10.3%) |
| 35 to 39 Years | 29 (3.7%) | 9 (0.9%) |
| 40 to 44 Years | 43 (5.5%) | 15 (1.5%) |
| 45 to 49 Years | 34 (4.3%) | 52 (5.4%) |
| 50 to 54 Years | 72 (9.2%) | 39 (4.0%) |
| 55 to 59 Years | 91 (11.6%) | 16 (1.7%) |
| 60 to 64 Years | 103 (13.2%) | 227 (23.5%) |
| 65 to 69 Years | 19 (2.4%) | 87 (9.0%) |
| 70 to 74 Years | 37 (4.7%) | 39 (4.0%) |
| 75 to 79 Years | 47 (6.0%) | 96 (9.9%) |
| 80 to 84 Years | 25 (3.2%) | 15 (1.5%) |
| 85 Years and over | 6 (0.8%) | 9 (0.9%) |
| Total | 783 (100.0%) | 966 (100.0%) |
Families and Households in Clark Mills
Median Family Size in Clark Mills
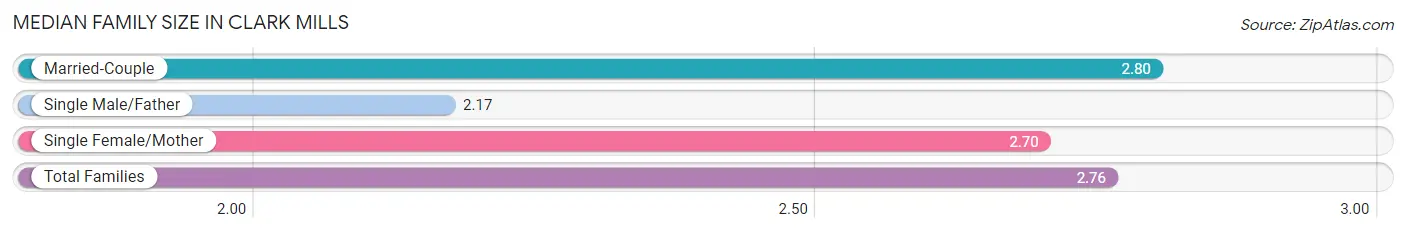
The median family size in Clark Mills is 2.76 persons per family, with married-couple families (323 | 83.9%) accounting for the largest median family size of 2.8 persons per family. On the other hand, single male/father families (18 | 4.7%) represent the smallest median family size with 2.17 persons per family.
| Family Type | # Families | Family Size |
| Married-Couple | 323 (83.9%) | 2.80 |
| Single Male/Father | 18 (4.7%) | 2.17 |
| Single Female/Mother | 44 (11.4%) | 2.70 |
| Total Families | 385 (100.0%) | 2.76 |
Median Household Size in Clark Mills
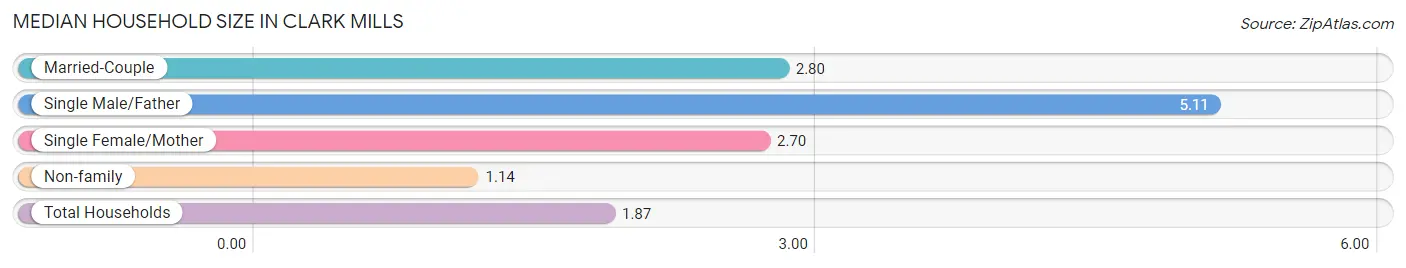
The median household size in Clark Mills is 1.87 persons per household, with single male/father households (18 | 1.9%) accounting for the largest median household size of 5.11 persons per household. non-family households (544 | 58.6%) represent the smallest median household size with 1.14 persons per household.
| Household Type | # Households | Household Size |
| Married-Couple | 323 (34.8%) | 2.80 |
| Single Male/Father | 18 (1.9%) | 5.11 |
| Single Female/Mother | 44 (4.7%) | 2.70 |
| Non-family | 544 (58.6%) | 1.14 |
| Total Households | 929 (100.0%) | 1.87 |
Household Size by Marriage Status in Clark Mills
Out of a total of 929 households in Clark Mills, 385 (41.4%) are family households, while 544 (58.6%) are nonfamily households. The most numerous type of family households are 2-person households, comprising 218, and the most common type of nonfamily households are 1-person households, comprising 464.
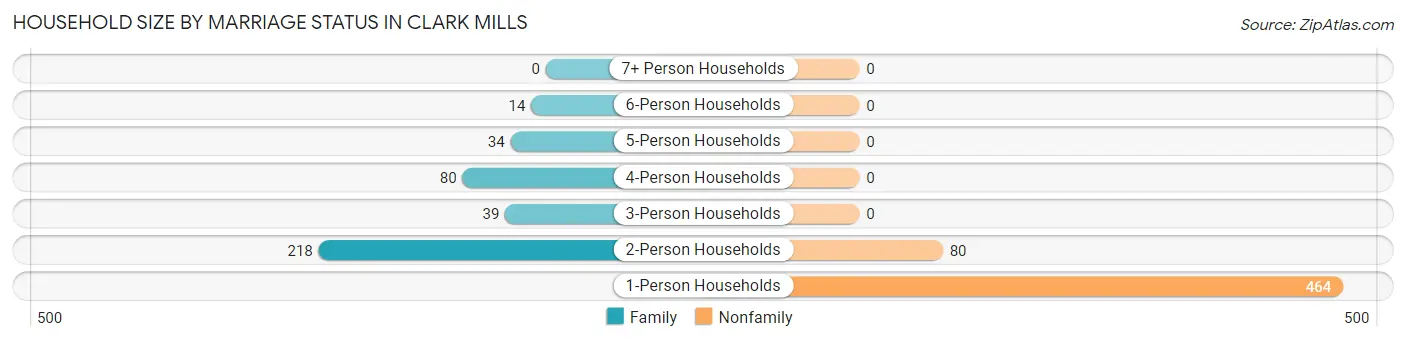
| Household Size | Family Households | Nonfamily Households |
| 1-Person Households | - | 464 (49.9%) |
| 2-Person Households | 218 (23.5%) | 80 (8.6%) |
| 3-Person Households | 39 (4.2%) | 0 (0.0%) |
| 4-Person Households | 80 (8.6%) | 0 (0.0%) |
| 5-Person Households | 34 (3.7%) | 0 (0.0%) |
| 6-Person Households | 14 (1.5%) | 0 (0.0%) |
| 7+ Person Households | 0 (0.0%) | 0 (0.0%) |
| Total | 385 (41.4%) | 544 (58.6%) |
Female Fertility in Clark Mills
Fertility by Age in Clark Mills
Average fertility rate in Clark Mills is 46.0 births per 1,000 women. Women in the age bracket of 20 to 34 years have the highest fertility rate with 67.0 births per 1,000 women. Women in the age bracket of 20 to 34 years acount for 100.0% of all women with births.
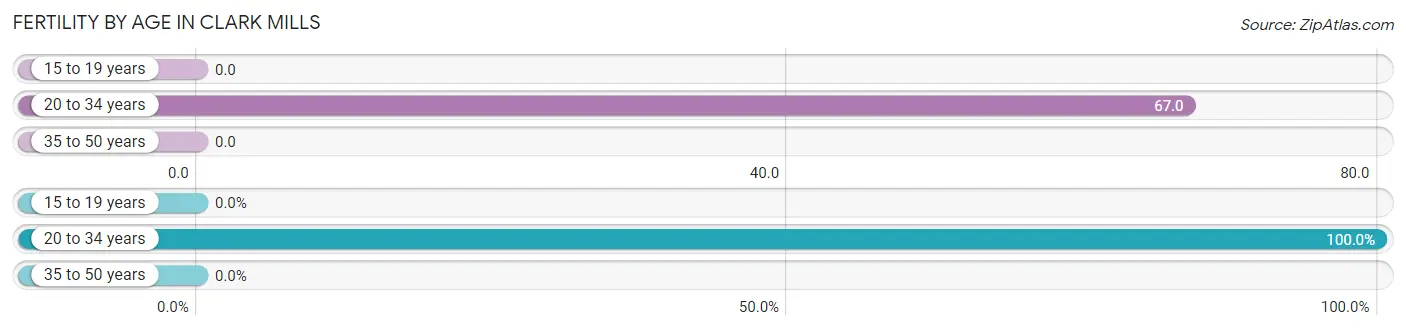
| Age Bracket | Women with Births | Births / 1,000 Women |
| 15 to 19 years | 0 (0.0%) | 0.0 |
| 20 to 34 years | 13 (100.0%) | 67.0 |
| 35 to 50 years | 0 (0.0%) | 0.0 |
| Total | 13 (100.0%) | 46.0 |
Fertility by Age by Marriage Status in Clark Mills
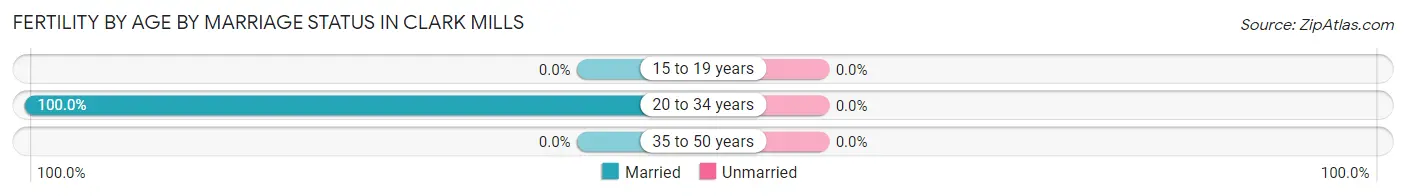
| Age Bracket | Married | Unmarried |
| 15 to 19 years | 0 (0.0%) | 0 (0.0%) |
| 20 to 34 years | 13 (100.0%) | 0 (0.0%) |
| 35 to 50 years | 0 (0.0%) | 0 (0.0%) |
| Total | 13 (100.0%) | 0 (0.0%) |
Fertility by Education in Clark Mills
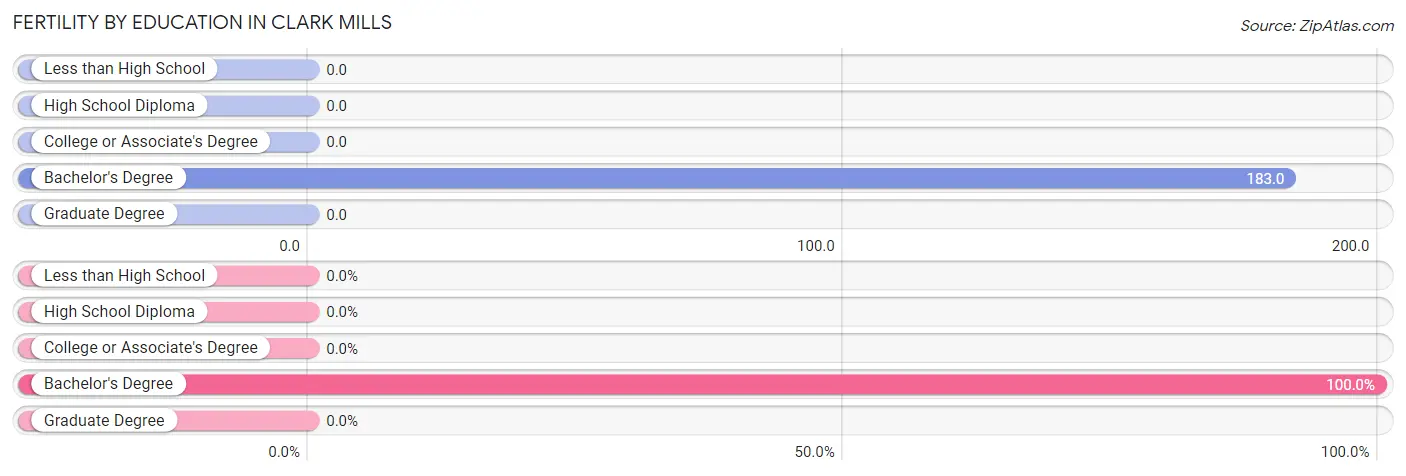
| Educational Attainment | Women with Births | Births / 1,000 Women |
| Less than High School | 0 (0.0%) | 0.0 |
| High School Diploma | 0 (0.0%) | 0.0 |
| College or Associate's Degree | 0 (0.0%) | 0.0 |
| Bachelor's Degree | 13 (100.0%) | 183.0 |
| Graduate Degree | 0 (0.0%) | 0.0 |
| Total | 13 (100.0%) | 46.0 |
Fertility by Education by Marriage Status in Clark Mills
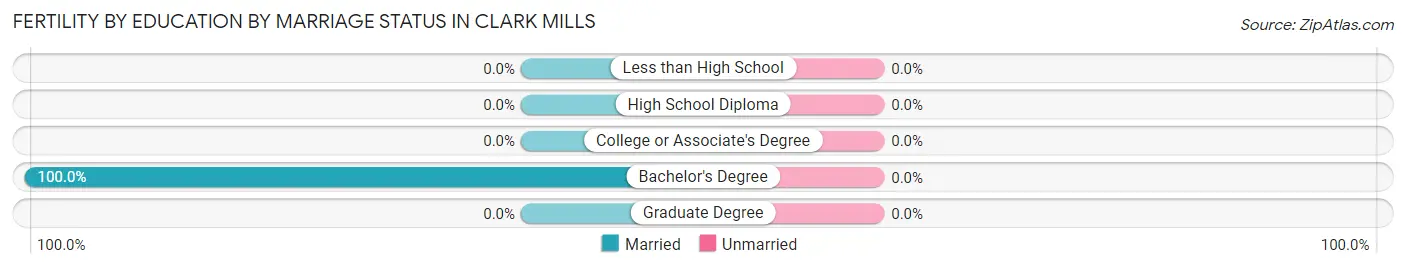
| Educational Attainment | Married | Unmarried |
| Less than High School | 0 (0.0%) | 0 (0.0%) |
| High School Diploma | 0 (0.0%) | 0 (0.0%) |
| College or Associate's Degree | 0 (0.0%) | 0 (0.0%) |
| Bachelor's Degree | 13 (100.0%) | 0 (0.0%) |
| Graduate Degree | 0 (0.0%) | 0 (0.0%) |
| Total | 13 (100.0%) | 0 (0.0%) |
Employment Characteristics in Clark Mills
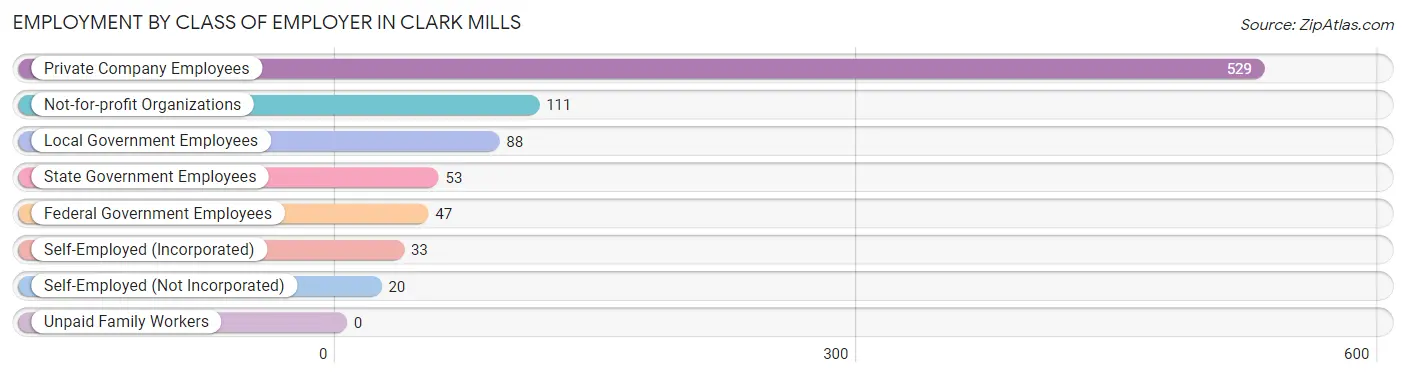
Employment by Class of Employer in Clark Mills
Among the 881 employed individuals in Clark Mills, private company employees (529 | 60.1%), not-for-profit organizations (111 | 12.6%), and local government employees (88 | 10.0%) make up the most common classes of employment.
| Employer Class | # Employees | % Employees |
| Private Company Employees | 529 | 60.1% |
| Self-Employed (Incorporated) | 33 | 3.7% |
| Self-Employed (Not Incorporated) | 20 | 2.3% |
| Not-for-profit Organizations | 111 | 12.6% |
| Local Government Employees | 88 | 10.0% |
| State Government Employees | 53 | 6.0% |
| Federal Government Employees | 47 | 5.3% |
| Unpaid Family Workers | 0 | 0.0% |
| Total | 881 | 100.0% |
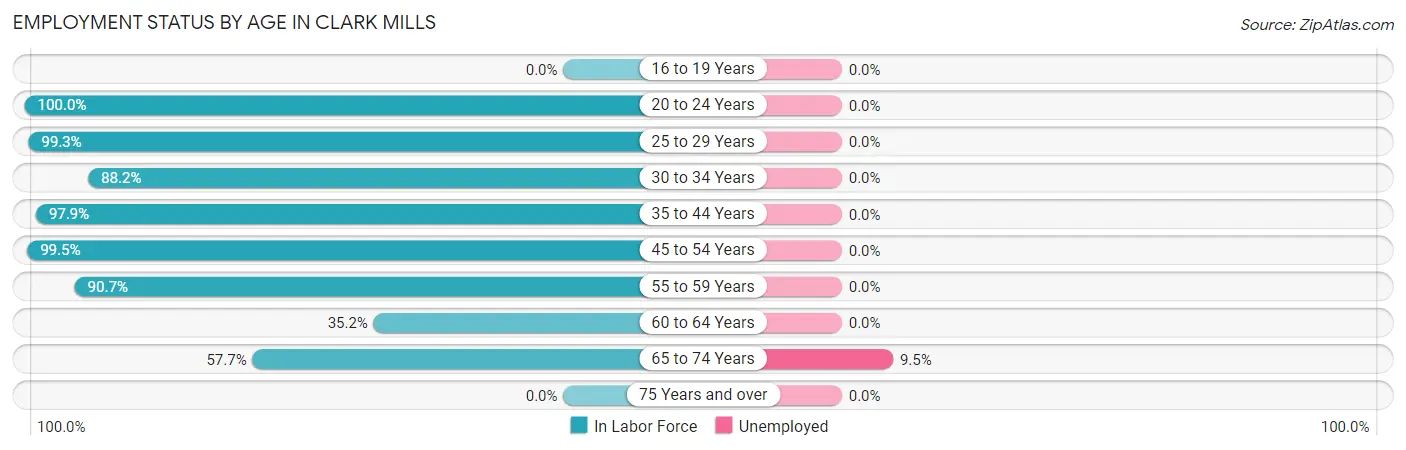
Employment Status by Age in Clark Mills
According to the labor force statistics for Clark Mills, out of the total population over 16 years of age (1,456), 63.3% or 922 individuals are in the labor force, with 1.1% or 10 of them unemployed. The age group with the highest labor force participation rate is 20 to 24 years, with 100.0% or 44 individuals in the labor force. Within the labor force, the 65 to 74 years age range has the highest percentage of unemployed individuals, with 9.5% or 10 of them being unemployed.
| Age Bracket | In Labor Force | Unemployed |
| 16 to 19 Years | 0 (0.0%) | 0 (0.0%) |
| 20 to 24 Years | 44 (100.0%) | 0 (0.0%) |
| 25 to 29 Years | 136 (99.3%) | 0 (0.0%) |
| 30 to 34 Years | 134 (88.2%) | 0 (0.0%) |
| 35 to 44 Years | 94 (97.9%) | 0 (0.0%) |
| 45 to 54 Years | 196 (99.5%) | 0 (0.0%) |
| 55 to 59 Years | 97 (90.7%) | 0 (0.0%) |
| 60 to 64 Years | 116 (35.2%) | 0 (0.0%) |
| 65 to 74 Years | 105 (57.7%) | 10 (9.5%) |
| 75 Years and over | 0 (0.0%) | 0 (0.0%) |
| Total | 922 (63.3%) | 10 (1.1%) |
Employment Status by Educational Attainment in Clark Mills
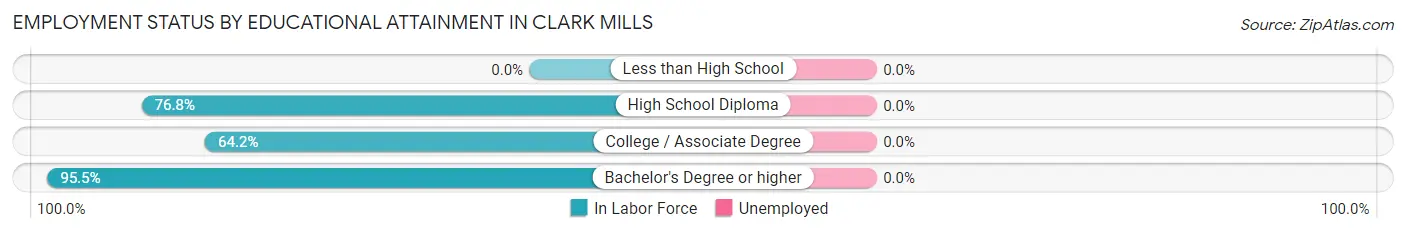
| Educational Attainment | In Labor Force | Unemployed |
| Less than High School | 0 (0.0%) | 0 (0.0%) |
| High School Diploma | 142 (76.8%) | 0 (0.0%) |
| College / Associate Degree | 309 (64.2%) | 0 (0.0%) |
| Bachelor's Degree or higher | 322 (95.5%) | 0 (0.0%) |
| Total | 773 (75.9%) | 0 (0.0%) |
Employment Occupations by Sex in Clark Mills
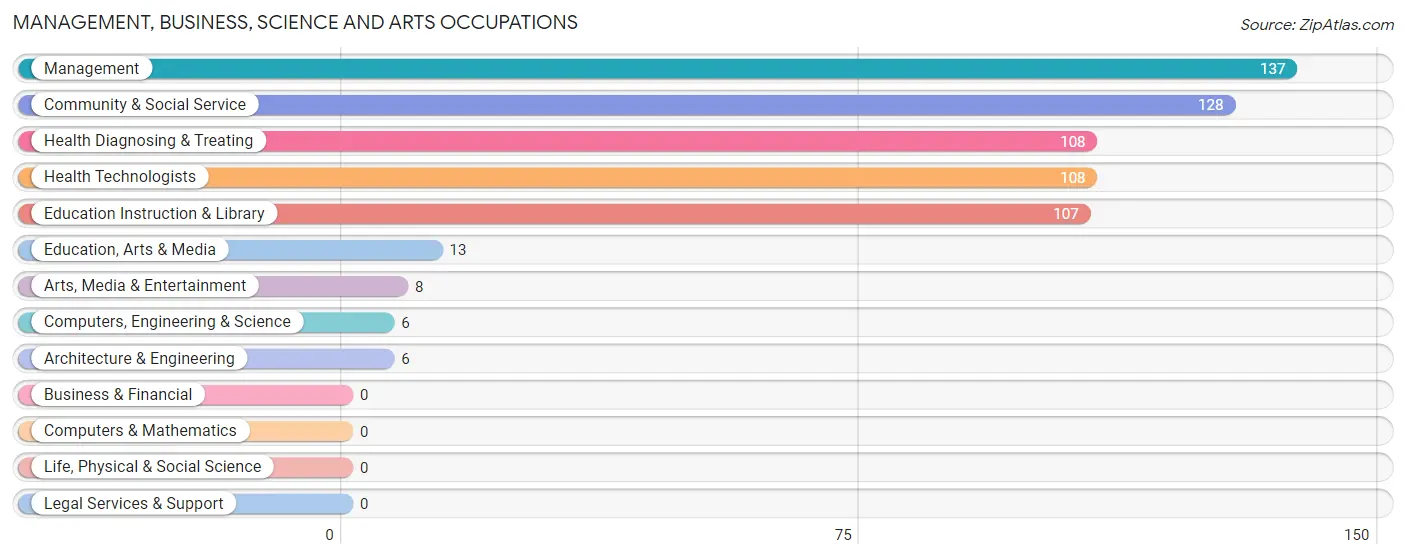
Management, Business, Science and Arts Occupations
The most common Management, Business, Science and Arts occupations in Clark Mills are Management (137 | 15.7%), Community & Social Service (128 | 14.7%), Health Diagnosing & Treating (108 | 12.4%), Health Technologists (108 | 12.4%), and Education Instruction & Library (107 | 12.3%).
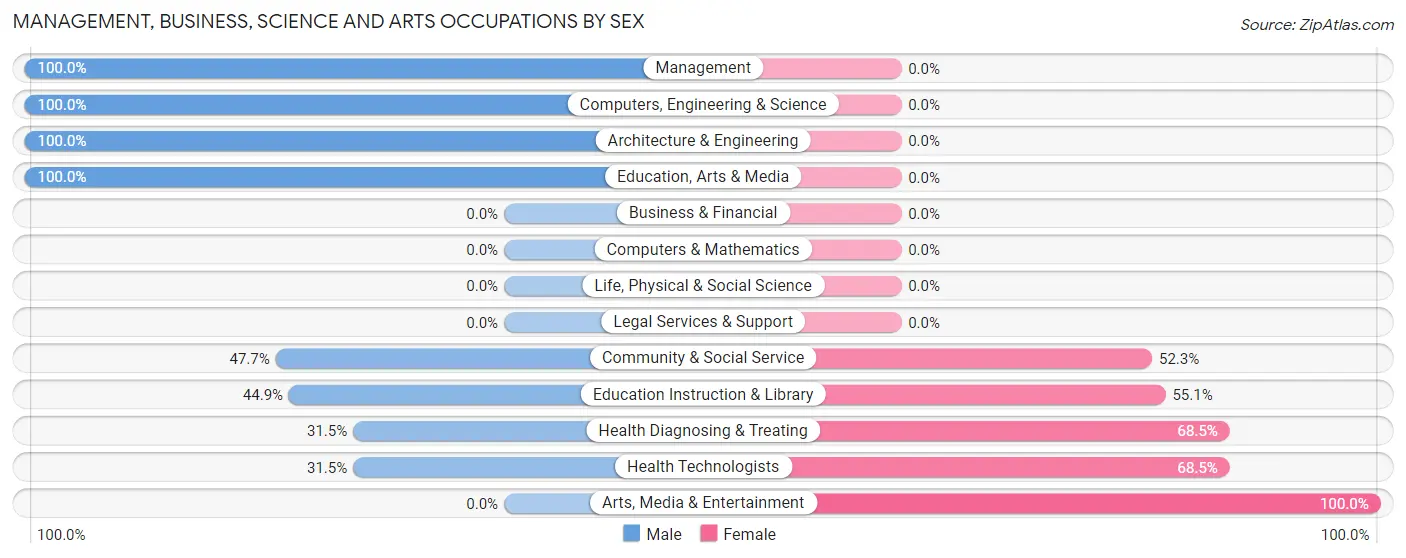
Management, Business, Science and Arts Occupations by Sex
Within the Management, Business, Science and Arts occupations in Clark Mills, the most male-oriented occupations are Management (100.0%), Computers, Engineering & Science (100.0%), and Architecture & Engineering (100.0%), while the most female-oriented occupations are Arts, Media & Entertainment (100.0%), Health Diagnosing & Treating (68.5%), and Health Technologists (68.5%).
| Occupation | Male | Female |
| Management | 137 (100.0%) | 0 (0.0%) |
| Business & Financial | 0 (0.0%) | 0 (0.0%) |
| Computers, Engineering & Science | 6 (100.0%) | 0 (0.0%) |
| Computers & Mathematics | 0 (0.0%) | 0 (0.0%) |
| Architecture & Engineering | 6 (100.0%) | 0 (0.0%) |
| Life, Physical & Social Science | 0 (0.0%) | 0 (0.0%) |
| Community & Social Service | 61 (47.7%) | 67 (52.3%) |
| Education, Arts & Media | 13 (100.0%) | 0 (0.0%) |
| Legal Services & Support | 0 (0.0%) | 0 (0.0%) |
| Education Instruction & Library | 48 (44.9%) | 59 (55.1%) |
| Arts, Media & Entertainment | 0 (0.0%) | 8 (100.0%) |
| Health Diagnosing & Treating | 34 (31.5%) | 74 (68.5%) |
| Health Technologists | 34 (31.5%) | 74 (68.5%) |
| Total (Category) | 238 (62.8%) | 141 (37.2%) |
| Total (Overall) | 441 (50.5%) | 432 (49.5%) |
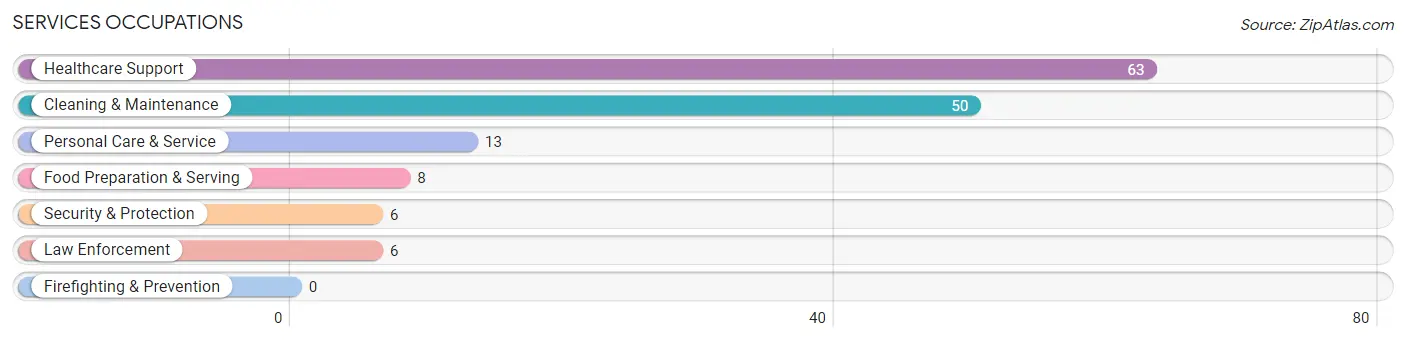
Services Occupations
The most common Services occupations in Clark Mills are Healthcare Support (63 | 7.2%), Cleaning & Maintenance (50 | 5.7%), Personal Care & Service (13 | 1.5%), Food Preparation & Serving (8 | 0.9%), and Security & Protection (6 | 0.7%).
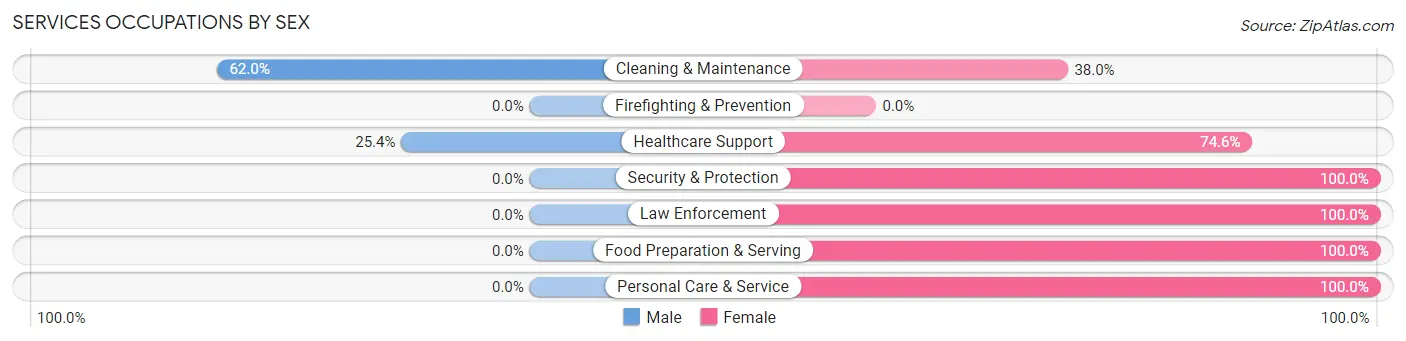
Services Occupations by Sex
Within the Services occupations in Clark Mills, the most male-oriented occupations are Cleaning & Maintenance (62.0%), and Healthcare Support (25.4%), while the most female-oriented occupations are Security & Protection (100.0%), Law Enforcement (100.0%), and Food Preparation & Serving (100.0%).
| Occupation | Male | Female |
| Healthcare Support | 16 (25.4%) | 47 (74.6%) |
| Security & Protection | 0 (0.0%) | 6 (100.0%) |
| Firefighting & Prevention | 0 (0.0%) | 0 (0.0%) |
| Law Enforcement | 0 (0.0%) | 6 (100.0%) |
| Food Preparation & Serving | 0 (0.0%) | 8 (100.0%) |
| Cleaning & Maintenance | 31 (62.0%) | 19 (38.0%) |
| Personal Care & Service | 0 (0.0%) | 13 (100.0%) |
| Total (Category) | 47 (33.6%) | 93 (66.4%) |
| Total (Overall) | 441 (50.5%) | 432 (49.5%) |
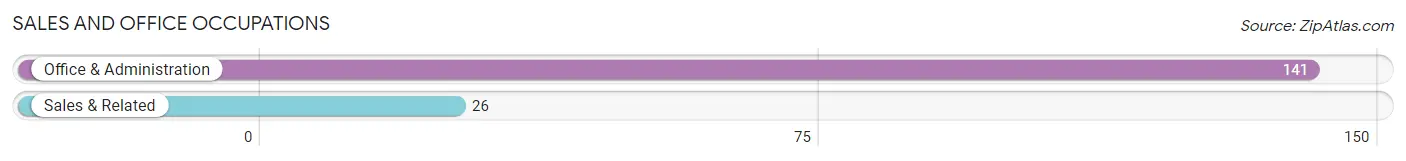
Sales and Office Occupations
The most common Sales and Office occupations in Clark Mills are Office & Administration (141 | 16.2%), and Sales & Related (26 | 3.0%).
Sales and Office Occupations by Sex
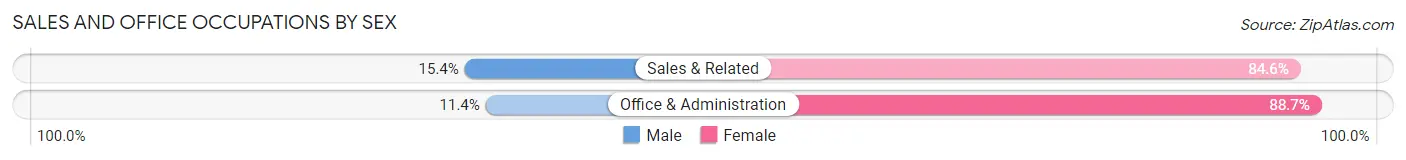
| Occupation | Male | Female |
| Sales & Related | 4 (15.4%) | 22 (84.6%) |
| Office & Administration | 16 (11.4%) | 125 (88.6%) |
| Total (Category) | 20 (12.0%) | 147 (88.0%) |
| Total (Overall) | 441 (50.5%) | 432 (49.5%) |
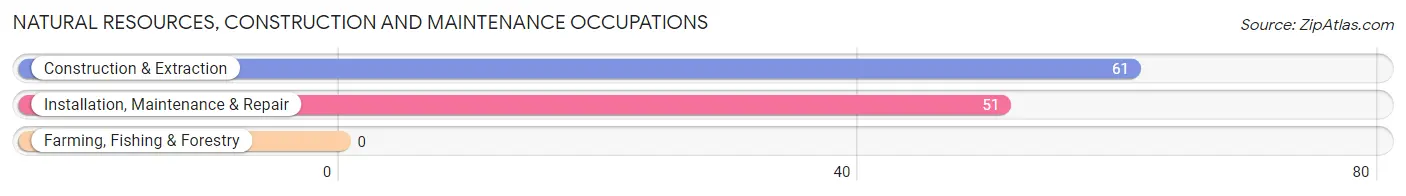
Natural Resources, Construction and Maintenance Occupations
The most common Natural Resources, Construction and Maintenance occupations in Clark Mills are Construction & Extraction (61 | 7.0%), and Installation, Maintenance & Repair (51 | 5.8%).
Natural Resources, Construction and Maintenance Occupations by Sex
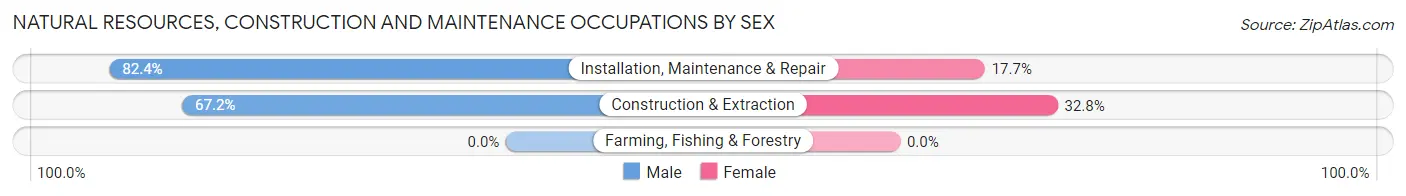
| Occupation | Male | Female |
| Farming, Fishing & Forestry | 0 (0.0%) | 0 (0.0%) |
| Construction & Extraction | 41 (67.2%) | 20 (32.8%) |
| Installation, Maintenance & Repair | 42 (82.4%) | 9 (17.6%) |
| Total (Category) | 83 (74.1%) | 29 (25.9%) |
| Total (Overall) | 441 (50.5%) | 432 (49.5%) |
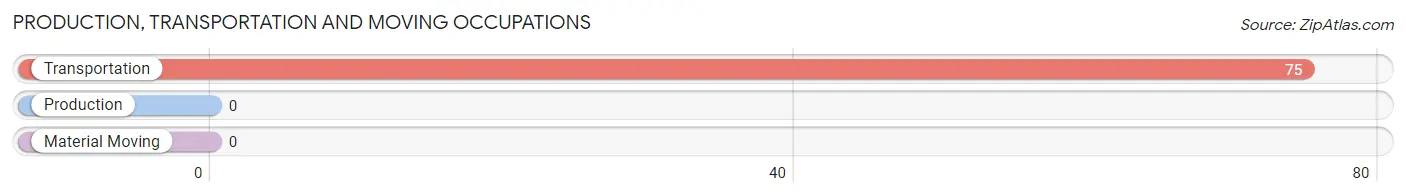
Production, Transportation and Moving Occupations
The most common Production, Transportation and Moving occupations in Clark Mills are , and Transportation (75 | 8.6%).
Production, Transportation and Moving Occupations by Sex
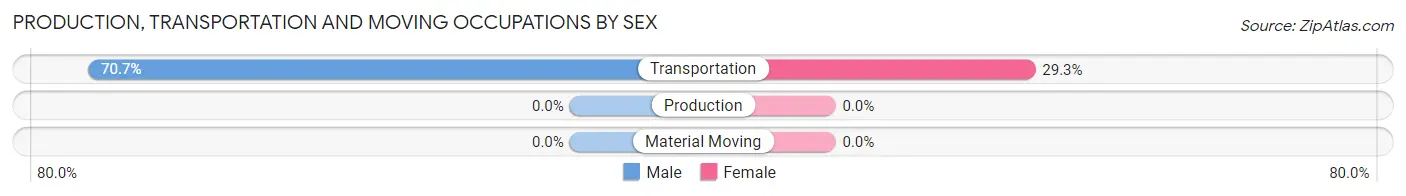
| Occupation | Male | Female |
| Production | 0 (0.0%) | 0 (0.0%) |
| Transportation | 53 (70.7%) | 22 (29.3%) |
| Material Moving | 0 (0.0%) | 0 (0.0%) |
| Total (Category) | 53 (70.7%) | 22 (29.3%) |
| Total (Overall) | 441 (50.5%) | 432 (49.5%) |
Employment Industries by Sex in Clark Mills
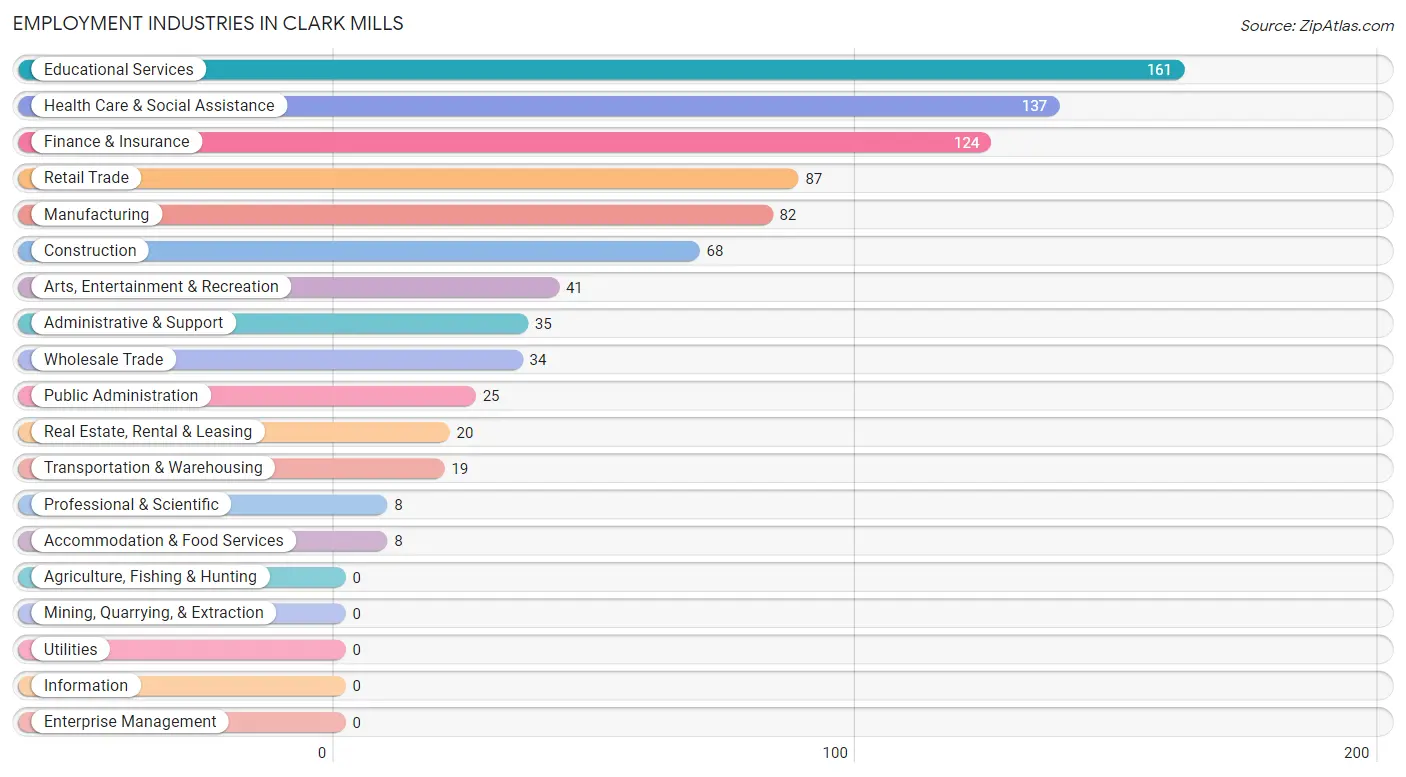
Employment Industries in Clark Mills
The major employment industries in Clark Mills include Educational Services (161 | 18.4%), Health Care & Social Assistance (137 | 15.7%), Finance & Insurance (124 | 14.2%), Retail Trade (87 | 10.0%), and Manufacturing (82 | 9.4%).
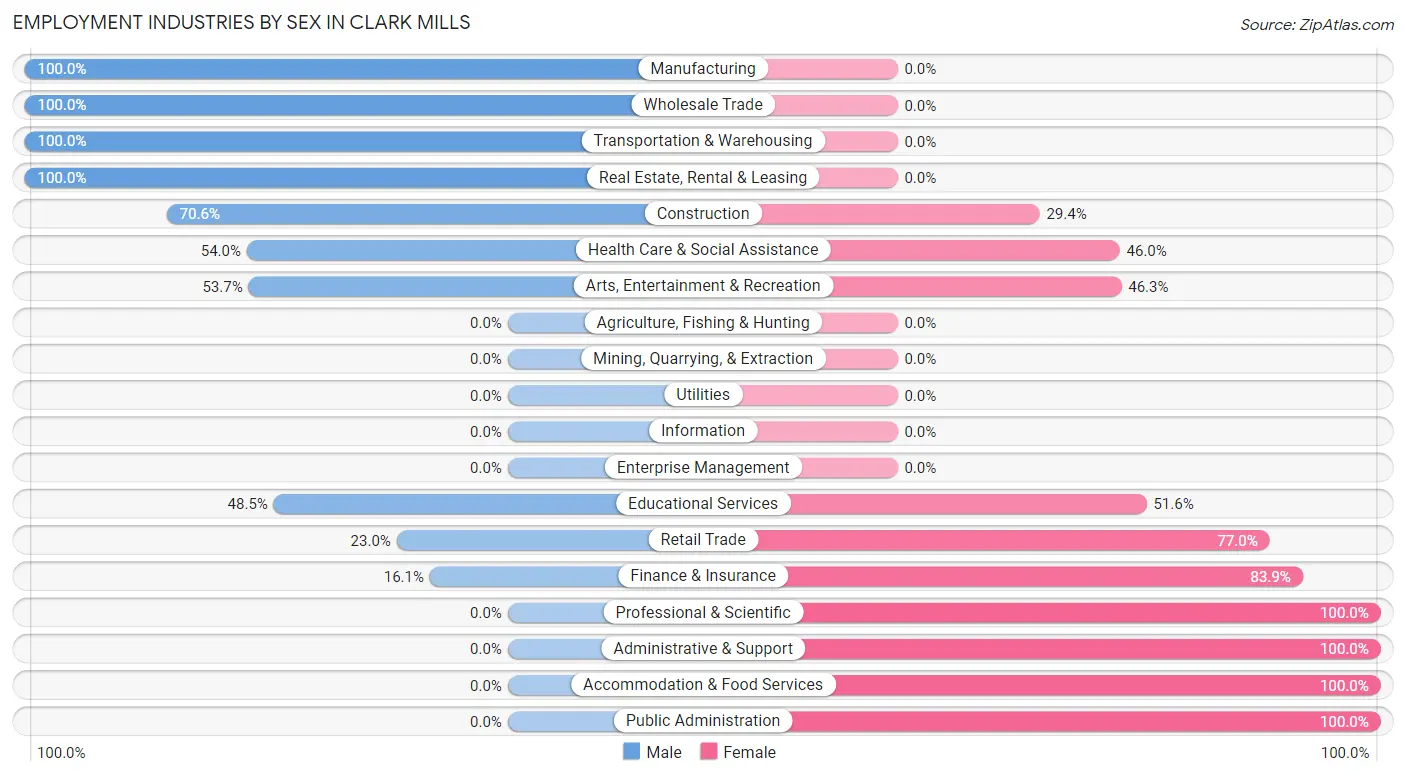
Employment Industries by Sex in Clark Mills
The Clark Mills industries that see more men than women are Manufacturing (100.0%), Wholesale Trade (100.0%), and Transportation & Warehousing (100.0%), whereas the industries that tend to have a higher number of women are Professional & Scientific (100.0%), Administrative & Support (100.0%), and Accommodation & Food Services (100.0%).
| Industry | Male | Female |
| Agriculture, Fishing & Hunting | 0 (0.0%) | 0 (0.0%) |
| Mining, Quarrying, & Extraction | 0 (0.0%) | 0 (0.0%) |
| Construction | 48 (70.6%) | 20 (29.4%) |
| Manufacturing | 82 (100.0%) | 0 (0.0%) |
| Wholesale Trade | 34 (100.0%) | 0 (0.0%) |
| Retail Trade | 20 (23.0%) | 67 (77.0%) |
| Transportation & Warehousing | 19 (100.0%) | 0 (0.0%) |
| Utilities | 0 (0.0%) | 0 (0.0%) |
| Information | 0 (0.0%) | 0 (0.0%) |
| Finance & Insurance | 20 (16.1%) | 104 (83.9%) |
| Real Estate, Rental & Leasing | 20 (100.0%) | 0 (0.0%) |
| Professional & Scientific | 0 (0.0%) | 8 (100.0%) |
| Enterprise Management | 0 (0.0%) | 0 (0.0%) |
| Administrative & Support | 0 (0.0%) | 35 (100.0%) |
| Educational Services | 78 (48.4%) | 83 (51.5%) |
| Health Care & Social Assistance | 74 (54.0%) | 63 (46.0%) |
| Arts, Entertainment & Recreation | 22 (53.7%) | 19 (46.3%) |
| Accommodation & Food Services | 0 (0.0%) | 8 (100.0%) |
| Public Administration | 0 (0.0%) | 25 (100.0%) |
| Total | 441 (50.5%) | 432 (49.5%) |
Education in Clark Mills
School Enrollment in Clark Mills
The most common levels of schooling among the 262 students in Clark Mills are middle school (120 | 45.8%), elementary school (74 | 28.2%), and nursery / preschool (39 | 14.9%).
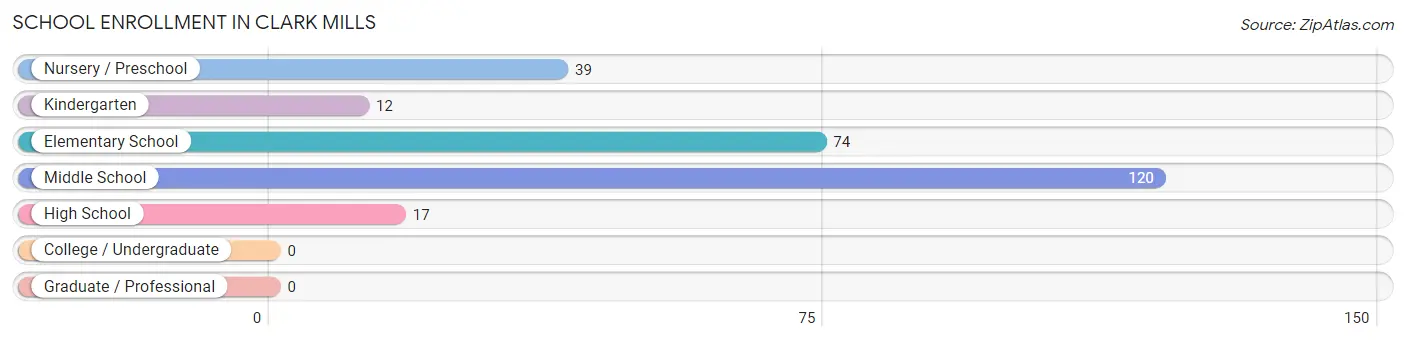
| School Level | # Students | % Students |
| Nursery / Preschool | 39 | 14.9% |
| Kindergarten | 12 | 4.6% |
| Elementary School | 74 | 28.2% |
| Middle School | 120 | 45.8% |
| High School | 17 | 6.5% |
| College / Undergraduate | 0 | 0.0% |
| Graduate / Professional | 0 | 0.0% |
| Total | 262 | 100.0% |
School Enrollment by Age by Funding Source in Clark Mills
Out of a total of 262 students who are enrolled in schools in Clark Mills, 13 (5.0%) attend a private institution, while the remaining 249 (95.0%) are enrolled in public schools. The age group of 3 to 4 year olds has the highest likelihood of being enrolled in private schools, with 13 (54.2% in the age bracket) enrolled. Conversely, the age group of 5 to 9 year old has the lowest likelihood of being enrolled in a private school, with 87 (100.0% in the age bracket) attending a public institution.
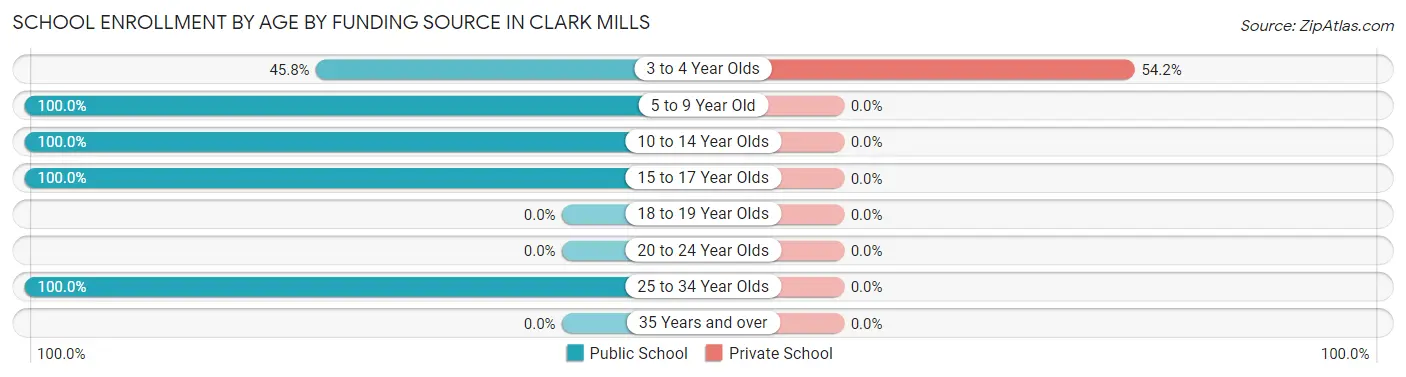
| Age Bracket | Public School | Private School |
| 3 to 4 Year Olds | 11 (45.8%) | 13 (54.2%) |
| 5 to 9 Year Old | 87 (100.0%) | 0 (0.0%) |
| 10 to 14 Year Olds | 122 (100.0%) | 0 (0.0%) |
| 15 to 17 Year Olds | 17 (100.0%) | 0 (0.0%) |
| 18 to 19 Year Olds | 0 (0.0%) | 0 (0.0%) |
| 20 to 24 Year Olds | 0 (0.0%) | 0 (0.0%) |
| 25 to 34 Year Olds | 12 (100.0%) | 0 (0.0%) |
| 35 Years and over | 0 (0.0%) | 0 (0.0%) |
| Total | 249 (95.0%) | 13 (5.0%) |
Educational Attainment by Field of Study in Clark Mills
Science & technology (90 | 18.9%), education (62 | 13.0%), liberal arts & history (60 | 12.6%), psychology (46 | 9.7%), and bio, nature & agricultural (37 | 7.8%) are the most common fields of study among 476 individuals in Clark Mills who have obtained a bachelor's degree or higher.
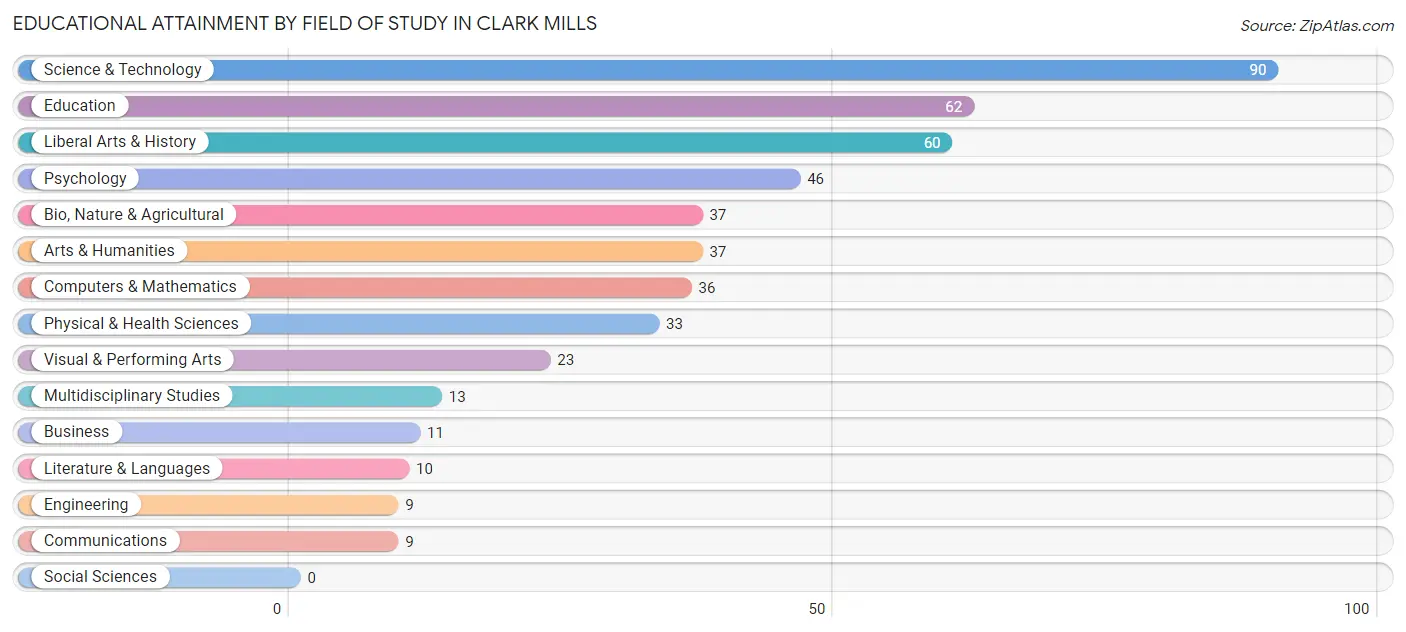
| Field of Study | # Graduates | % Graduates |
| Computers & Mathematics | 36 | 7.6% |
| Bio, Nature & Agricultural | 37 | 7.8% |
| Physical & Health Sciences | 33 | 6.9% |
| Psychology | 46 | 9.7% |
| Social Sciences | 0 | 0.0% |
| Engineering | 9 | 1.9% |
| Multidisciplinary Studies | 13 | 2.7% |
| Science & Technology | 90 | 18.9% |
| Business | 11 | 2.3% |
| Education | 62 | 13.0% |
| Literature & Languages | 10 | 2.1% |
| Liberal Arts & History | 60 | 12.6% |
| Visual & Performing Arts | 23 | 4.8% |
| Communications | 9 | 1.9% |
| Arts & Humanities | 37 | 7.8% |
| Total | 476 | 100.0% |
Transportation & Commute in Clark Mills
Vehicle Availability by Sex in Clark Mills
The most prevalent vehicle ownership categories in Clark Mills are males with 2 vehicles (296, accounting for 63.9%) and females with 2 vehicles (205, making up 70.8%).
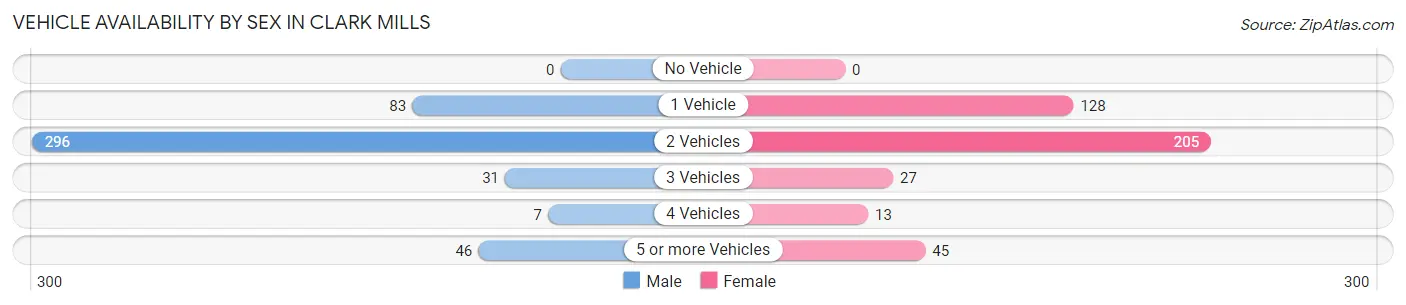
| Vehicles Available | Male | Female |
| No Vehicle | 0 (0.0%) | 0 (0.0%) |
| 1 Vehicle | 83 (17.9%) | 128 (30.6%) |
| 2 Vehicles | 296 (63.9%) | 205 (49.0%) |
| 3 Vehicles | 31 (6.7%) | 27 (6.5%) |
| 4 Vehicles | 7 (1.5%) | 13 (3.1%) |
| 5 or more Vehicles | 46 (9.9%) | 45 (10.8%) |
| Total | 463 (100.0%) | 418 (100.0%) |
Commute Time in Clark Mills
The most frequently occuring commute durations in Clark Mills are 15 to 19 minutes (275 commuters, 33.7%), 20 to 24 minutes (172 commuters, 21.1%), and 45 to 59 minutes (113 commuters, 13.9%).
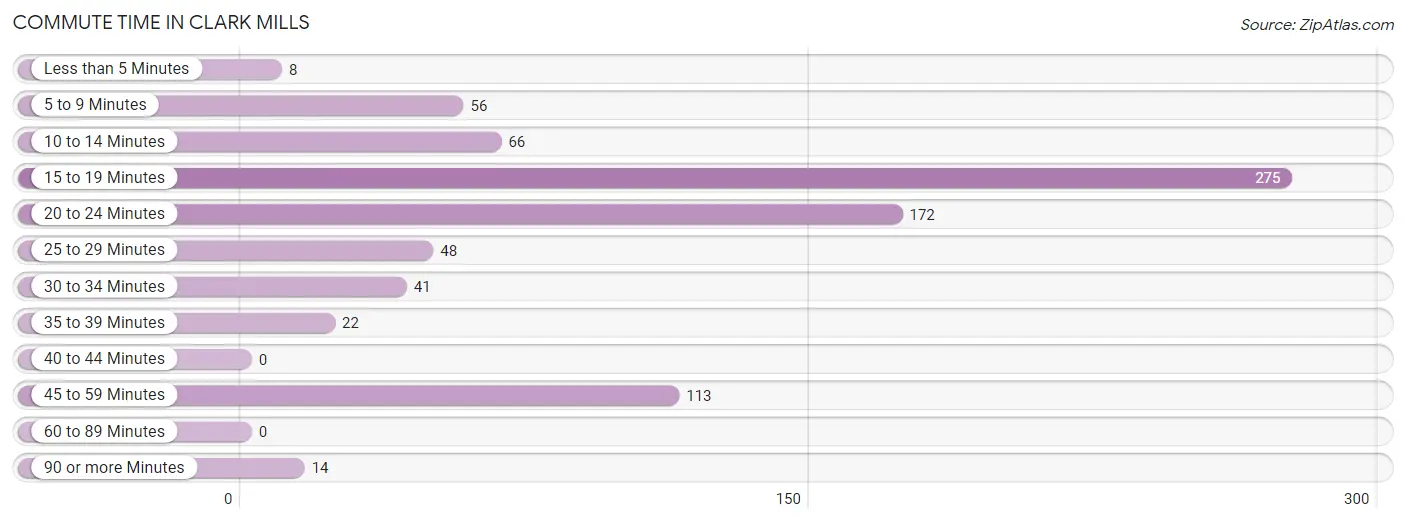
| Commute Time | # Commuters | % Commuters |
| Less than 5 Minutes | 8 | 1.0% |
| 5 to 9 Minutes | 56 | 6.9% |
| 10 to 14 Minutes | 66 | 8.1% |
| 15 to 19 Minutes | 275 | 33.7% |
| 20 to 24 Minutes | 172 | 21.1% |
| 25 to 29 Minutes | 48 | 5.9% |
| 30 to 34 Minutes | 41 | 5.0% |
| 35 to 39 Minutes | 22 | 2.7% |
| 40 to 44 Minutes | 0 | 0.0% |
| 45 to 59 Minutes | 113 | 13.9% |
| 60 to 89 Minutes | 0 | 0.0% |
| 90 or more Minutes | 14 | 1.7% |
Commute Time by Sex in Clark Mills
The most common commute times in Clark Mills are 15 to 19 minutes (140 commuters, 31.6%) for males and 15 to 19 minutes (135 commuters, 36.3%) for females.
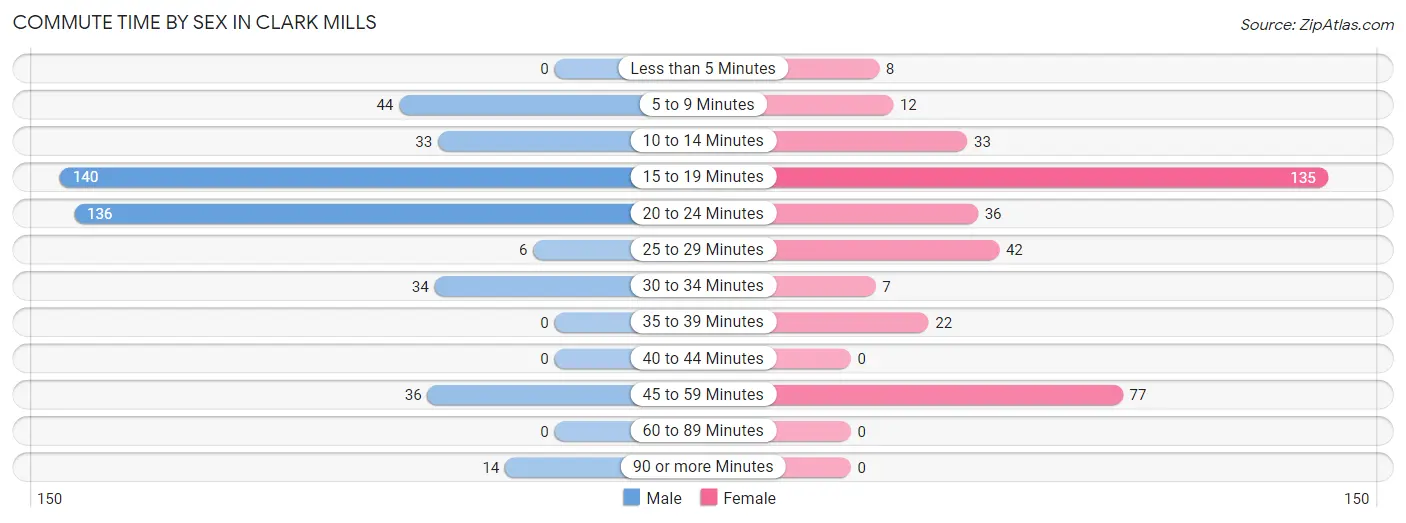
| Commute Time | Male | Female |
| Less than 5 Minutes | 0 (0.0%) | 8 (2.1%) |
| 5 to 9 Minutes | 44 (9.9%) | 12 (3.2%) |
| 10 to 14 Minutes | 33 (7.4%) | 33 (8.9%) |
| 15 to 19 Minutes | 140 (31.6%) | 135 (36.3%) |
| 20 to 24 Minutes | 136 (30.7%) | 36 (9.7%) |
| 25 to 29 Minutes | 6 (1.3%) | 42 (11.3%) |
| 30 to 34 Minutes | 34 (7.7%) | 7 (1.9%) |
| 35 to 39 Minutes | 0 (0.0%) | 22 (5.9%) |
| 40 to 44 Minutes | 0 (0.0%) | 0 (0.0%) |
| 45 to 59 Minutes | 36 (8.1%) | 77 (20.7%) |
| 60 to 89 Minutes | 0 (0.0%) | 0 (0.0%) |
| 90 or more Minutes | 14 (3.2%) | 0 (0.0%) |
Time of Departure to Work by Sex in Clark Mills
The most frequent times of departure to work in Clark Mills are 8:00 AM to 8:29 AM (166, 37.5%) for males and 7:30 AM to 7:59 AM (97, 26.1%) for females.
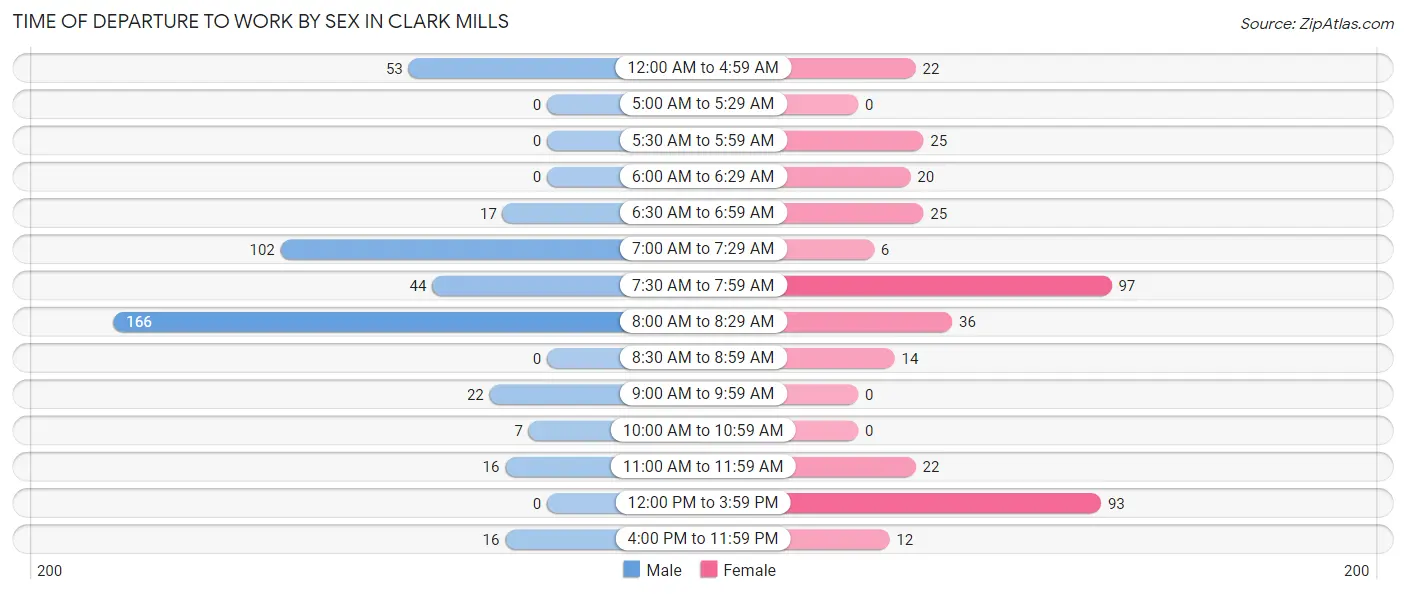
| Time of Departure | Male | Female |
| 12:00 AM to 4:59 AM | 53 (12.0%) | 22 (5.9%) |
| 5:00 AM to 5:29 AM | 0 (0.0%) | 0 (0.0%) |
| 5:30 AM to 5:59 AM | 0 (0.0%) | 25 (6.7%) |
| 6:00 AM to 6:29 AM | 0 (0.0%) | 20 (5.4%) |
| 6:30 AM to 6:59 AM | 17 (3.8%) | 25 (6.7%) |
| 7:00 AM to 7:29 AM | 102 (23.0%) | 6 (1.6%) |
| 7:30 AM to 7:59 AM | 44 (9.9%) | 97 (26.1%) |
| 8:00 AM to 8:29 AM | 166 (37.5%) | 36 (9.7%) |
| 8:30 AM to 8:59 AM | 0 (0.0%) | 14 (3.8%) |
| 9:00 AM to 9:59 AM | 22 (5.0%) | 0 (0.0%) |
| 10:00 AM to 10:59 AM | 7 (1.6%) | 0 (0.0%) |
| 11:00 AM to 11:59 AM | 16 (3.6%) | 22 (5.9%) |
| 12:00 PM to 3:59 PM | 0 (0.0%) | 93 (25.0%) |
| 4:00 PM to 11:59 PM | 16 (3.6%) | 12 (3.2%) |
| Total | 443 (100.0%) | 372 (100.0%) |
Housing Occupancy in Clark Mills
Occupancy by Ownership in Clark Mills
Of the total 929 dwellings in Clark Mills, owner-occupied units account for 507 (54.6%), while renter-occupied units make up 422 (45.4%).
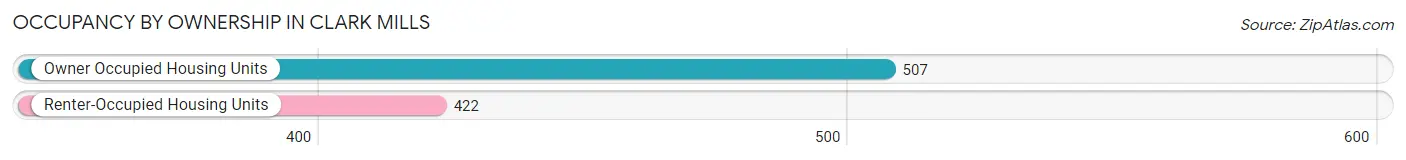
| Occupancy | # Housing Units | % Housing Units |
| Owner Occupied Housing Units | 507 | 54.6% |
| Renter-Occupied Housing Units | 422 | 45.4% |
| Total Occupied Housing Units | 929 | 100.0% |
Occupancy by Household Size in Clark Mills
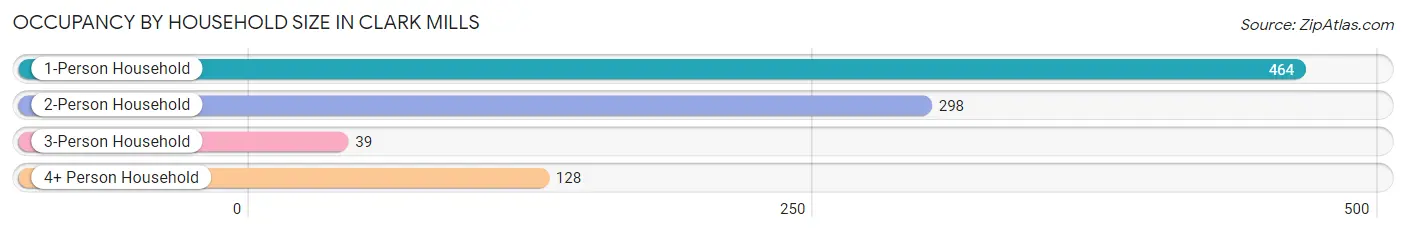
| Household Size | # Housing Units | % Housing Units |
| 1-Person Household | 464 | 49.9% |
| 2-Person Household | 298 | 32.1% |
| 3-Person Household | 39 | 4.2% |
| 4+ Person Household | 128 | 13.8% |
| Total Housing Units | 929 | 100.0% |
Occupancy by Ownership by Household Size in Clark Mills
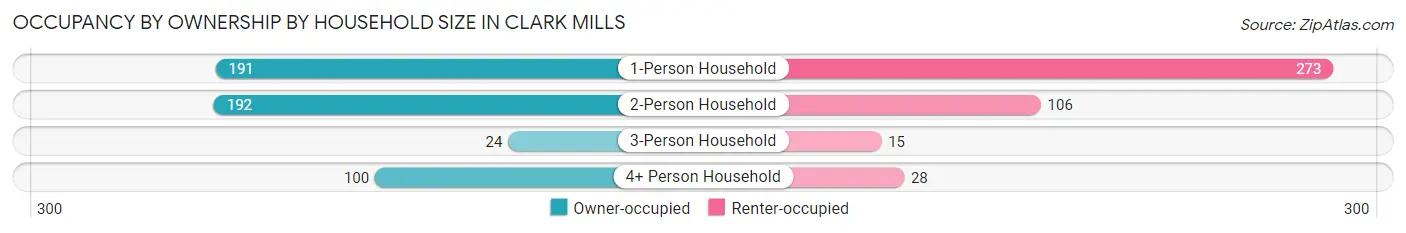
| Household Size | Owner-occupied | Renter-occupied |
| 1-Person Household | 191 (41.2%) | 273 (58.8%) |
| 2-Person Household | 192 (64.4%) | 106 (35.6%) |
| 3-Person Household | 24 (61.5%) | 15 (38.5%) |
| 4+ Person Household | 100 (78.1%) | 28 (21.9%) |
| Total Housing Units | 507 (54.6%) | 422 (45.4%) |
Occupancy by Educational Attainment in Clark Mills
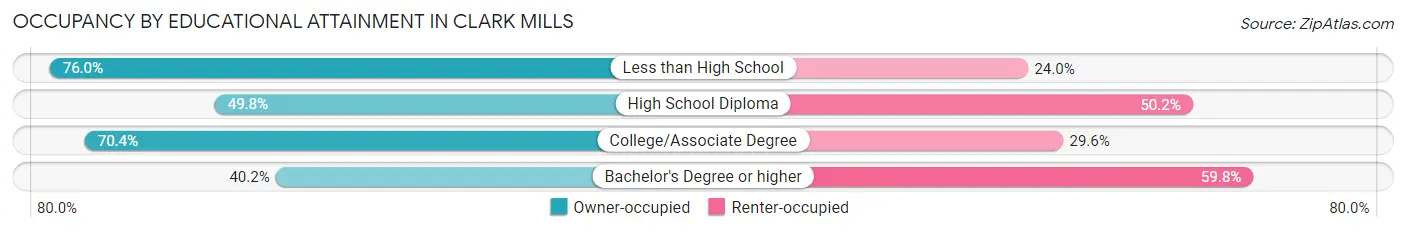
| Household Size | Owner-occupied | Renter-occupied |
| Less than High School | 19 (76.0%) | 6 (24.0%) |
| High School Diploma | 147 (49.8%) | 148 (50.2%) |
| College/Associate Degree | 224 (70.4%) | 94 (29.6%) |
| Bachelor's Degree or higher | 117 (40.2%) | 174 (59.8%) |
Occupancy by Age of Householder in Clark Mills
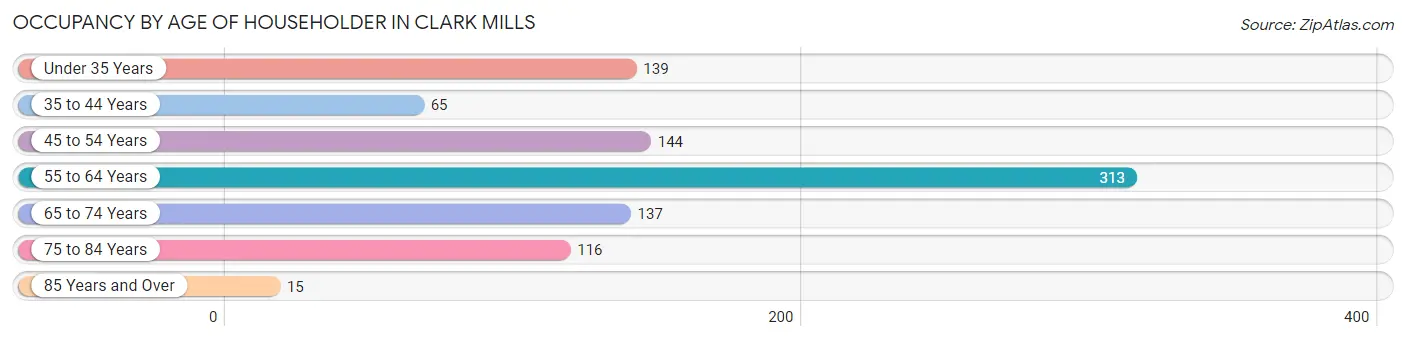
| Age Bracket | # Households | % Households |
| Under 35 Years | 139 | 15.0% |
| 35 to 44 Years | 65 | 7.0% |
| 45 to 54 Years | 144 | 15.5% |
| 55 to 64 Years | 313 | 33.7% |
| 65 to 74 Years | 137 | 14.7% |
| 75 to 84 Years | 116 | 12.5% |
| 85 Years and Over | 15 | 1.6% |
| Total | 929 | 100.0% |
Housing Finances in Clark Mills
Median Income by Occupancy in Clark Mills
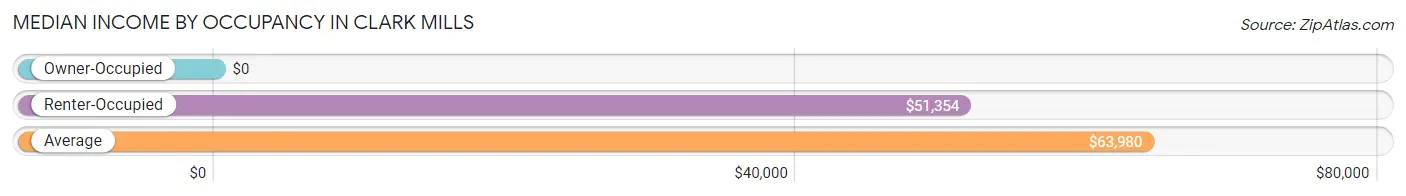
| Occupancy Type | # Households | Median Income |
| Owner-Occupied | 507 (54.6%) | $0 |
| Renter-Occupied | 422 (45.4%) | $51,354 |
| Average | 929 (100.0%) | $63,980 |
Occupancy by Householder Income Bracket in Clark Mills
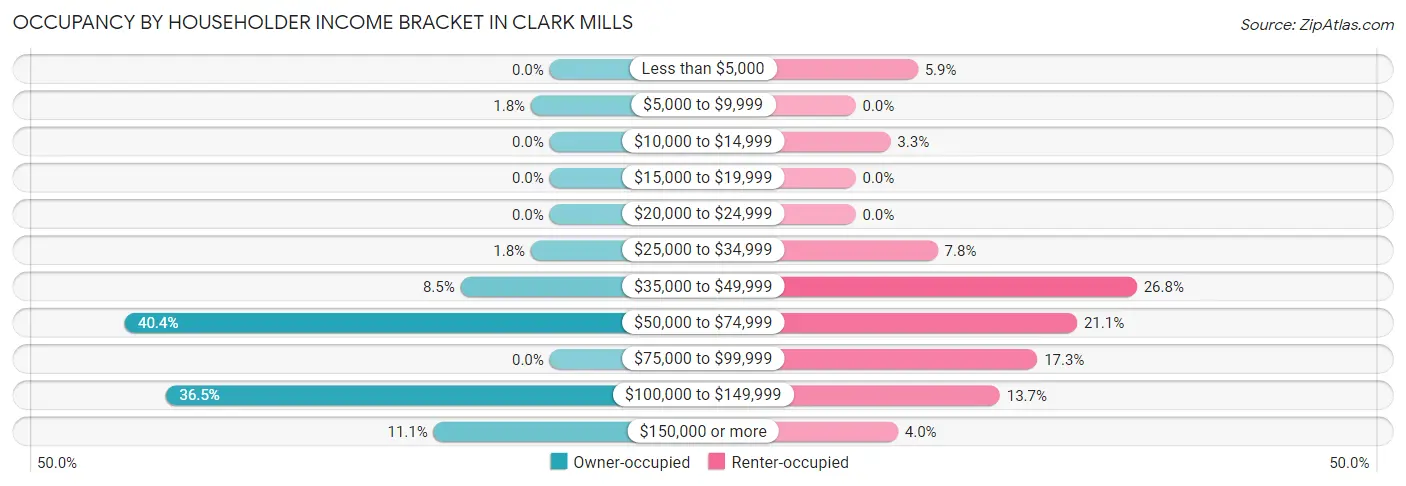
| Income Bracket | Owner-occupied | Renter-occupied |
| Less than $5,000 | 0 (0.0%) | 25 (5.9%) |
| $5,000 to $9,999 | 9 (1.8%) | 0 (0.0%) |
| $10,000 to $14,999 | 0 (0.0%) | 14 (3.3%) |
| $15,000 to $19,999 | 0 (0.0%) | 0 (0.0%) |
| $20,000 to $24,999 | 0 (0.0%) | 0 (0.0%) |
| $25,000 to $34,999 | 9 (1.8%) | 33 (7.8%) |
| $35,000 to $49,999 | 43 (8.5%) | 113 (26.8%) |
| $50,000 to $74,999 | 205 (40.4%) | 89 (21.1%) |
| $75,000 to $99,999 | 0 (0.0%) | 73 (17.3%) |
| $100,000 to $149,999 | 185 (36.5%) | 58 (13.7%) |
| $150,000 or more | 56 (11.1%) | 17 (4.0%) |
| Total | 507 (100.0%) | 422 (100.0%) |
Monthly Housing Cost Tiers in Clark Mills
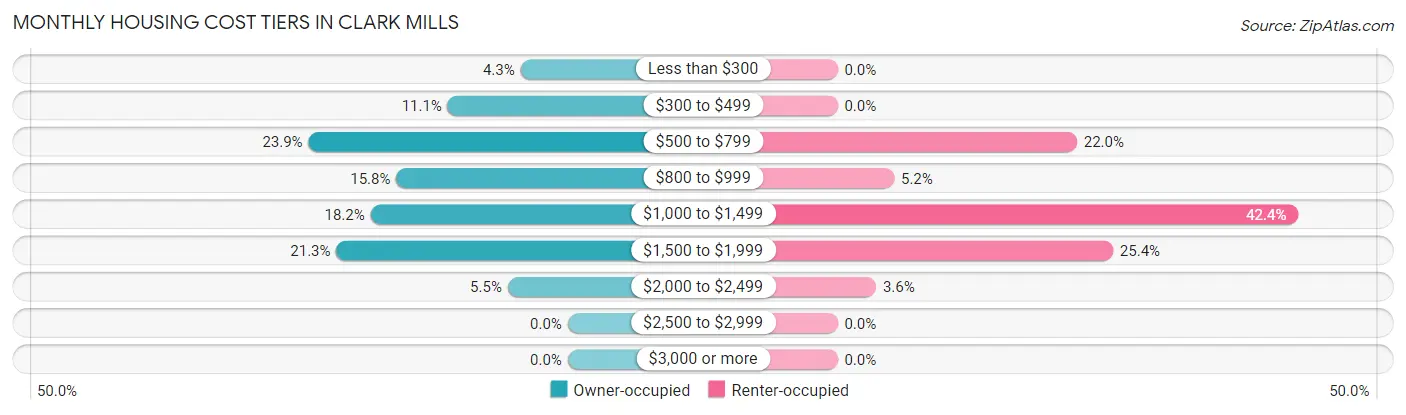
| Monthly Cost | Owner-occupied | Renter-occupied |
| Less than $300 | 22 (4.3%) | 0 (0.0%) |
| $300 to $499 | 56 (11.1%) | 0 (0.0%) |
| $500 to $799 | 121 (23.9%) | 93 (22.0%) |
| $800 to $999 | 80 (15.8%) | 22 (5.2%) |
| $1,000 to $1,499 | 92 (18.1%) | 179 (42.4%) |
| $1,500 to $1,999 | 108 (21.3%) | 107 (25.4%) |
| $2,000 to $2,499 | 28 (5.5%) | 15 (3.5%) |
| $2,500 to $2,999 | 0 (0.0%) | 0 (0.0%) |
| $3,000 or more | 0 (0.0%) | 0 (0.0%) |
| Total | 507 (100.0%) | 422 (100.0%) |
Physical Housing Characteristics in Clark Mills
Housing Structures in Clark Mills
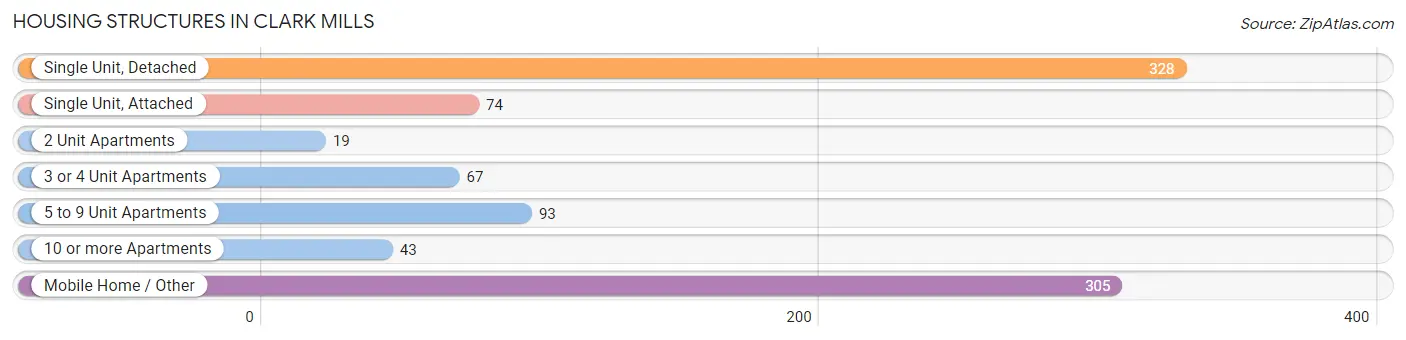
| Structure Type | # Housing Units | % Housing Units |
| Single Unit, Detached | 328 | 35.3% |
| Single Unit, Attached | 74 | 8.0% |
| 2 Unit Apartments | 19 | 2.1% |
| 3 or 4 Unit Apartments | 67 | 7.2% |
| 5 to 9 Unit Apartments | 93 | 10.0% |
| 10 or more Apartments | 43 | 4.6% |
| Mobile Home / Other | 305 | 32.8% |
| Total | 929 | 100.0% |
Housing Structures by Occupancy in Clark Mills
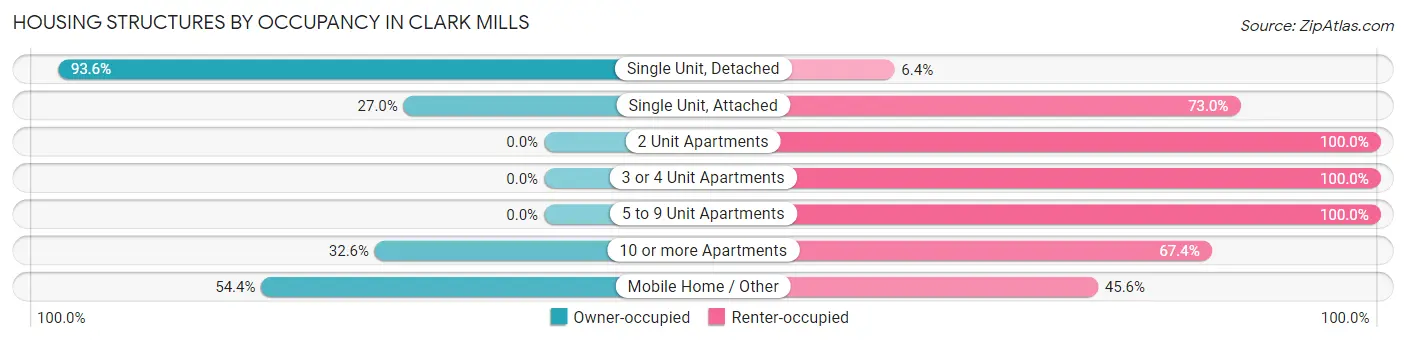
| Structure Type | Owner-occupied | Renter-occupied |
| Single Unit, Detached | 307 (93.6%) | 21 (6.4%) |
| Single Unit, Attached | 20 (27.0%) | 54 (73.0%) |
| 2 Unit Apartments | 0 (0.0%) | 19 (100.0%) |
| 3 or 4 Unit Apartments | 0 (0.0%) | 67 (100.0%) |
| 5 to 9 Unit Apartments | 0 (0.0%) | 93 (100.0%) |
| 10 or more Apartments | 14 (32.6%) | 29 (67.4%) |
| Mobile Home / Other | 166 (54.4%) | 139 (45.6%) |
| Total | 507 (54.6%) | 422 (45.4%) |
Housing Structures by Number of Rooms in Clark Mills
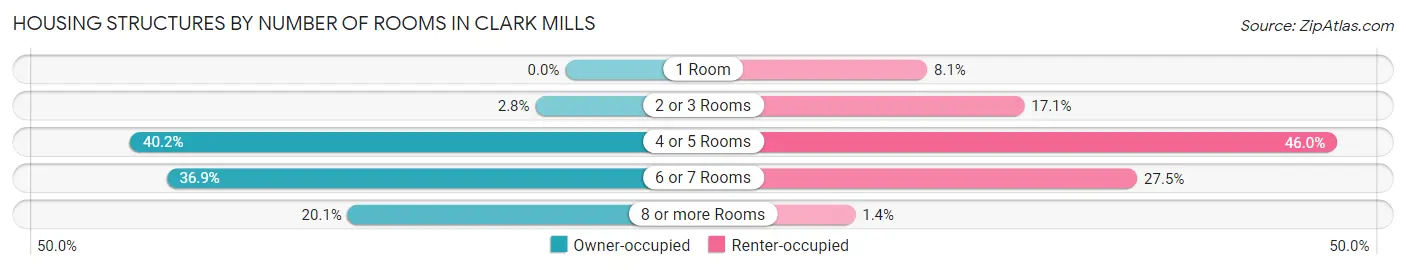
| Number of Rooms | Owner-occupied | Renter-occupied |
| 1 Room | 0 (0.0%) | 34 (8.1%) |
| 2 or 3 Rooms | 14 (2.8%) | 72 (17.1%) |
| 4 or 5 Rooms | 204 (40.2%) | 194 (46.0%) |
| 6 or 7 Rooms | 187 (36.9%) | 116 (27.5%) |
| 8 or more Rooms | 102 (20.1%) | 6 (1.4%) |
| Total | 507 (100.0%) | 422 (100.0%) |
Housing Structure by Heating Type in Clark Mills
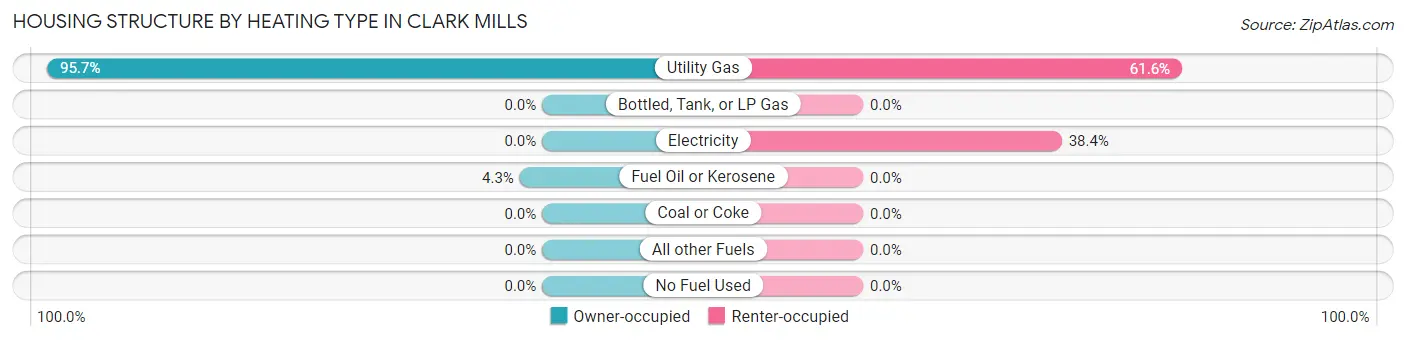
| Heating Type | Owner-occupied | Renter-occupied |
| Utility Gas | 485 (95.7%) | 260 (61.6%) |
| Bottled, Tank, or LP Gas | 0 (0.0%) | 0 (0.0%) |
| Electricity | 0 (0.0%) | 162 (38.4%) |
| Fuel Oil or Kerosene | 22 (4.3%) | 0 (0.0%) |
| Coal or Coke | 0 (0.0%) | 0 (0.0%) |
| All other Fuels | 0 (0.0%) | 0 (0.0%) |
| No Fuel Used | 0 (0.0%) | 0 (0.0%) |
| Total | 507 (100.0%) | 422 (100.0%) |
Household Vehicle Usage in Clark Mills
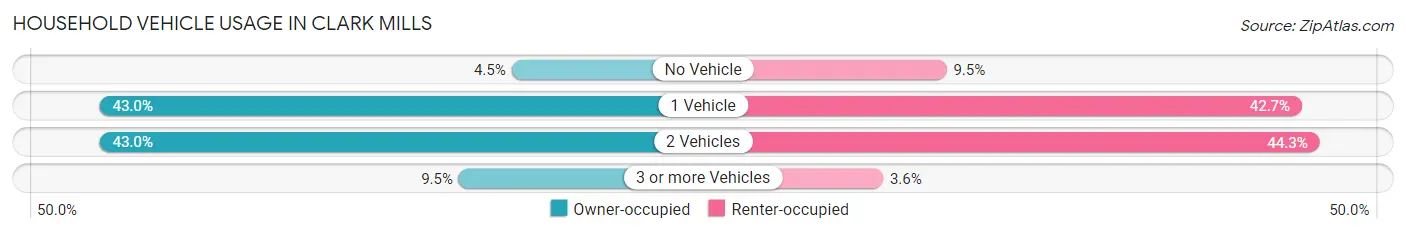
| Vehicles per Household | Owner-occupied | Renter-occupied |
| No Vehicle | 23 (4.5%) | 40 (9.5%) |
| 1 Vehicle | 218 (43.0%) | 180 (42.6%) |
| 2 Vehicles | 218 (43.0%) | 187 (44.3%) |
| 3 or more Vehicles | 48 (9.5%) | 15 (3.5%) |
| Total | 507 (100.0%) | 422 (100.0%) |
Real Estate & Mortgages in Clark Mills
Real Estate and Mortgage Overview in Clark Mills
| Characteristic | Without Mortgage | With Mortgage |
| Housing Units | 263 | 244 |
| Median Property Value | - | - |
| Median Household Income | $64,554 | $49 |
| Monthly Housing Costs | $636 | $0 |
| Real Estate Taxes | - | - |
Property Value by Mortgage Status in Clark Mills
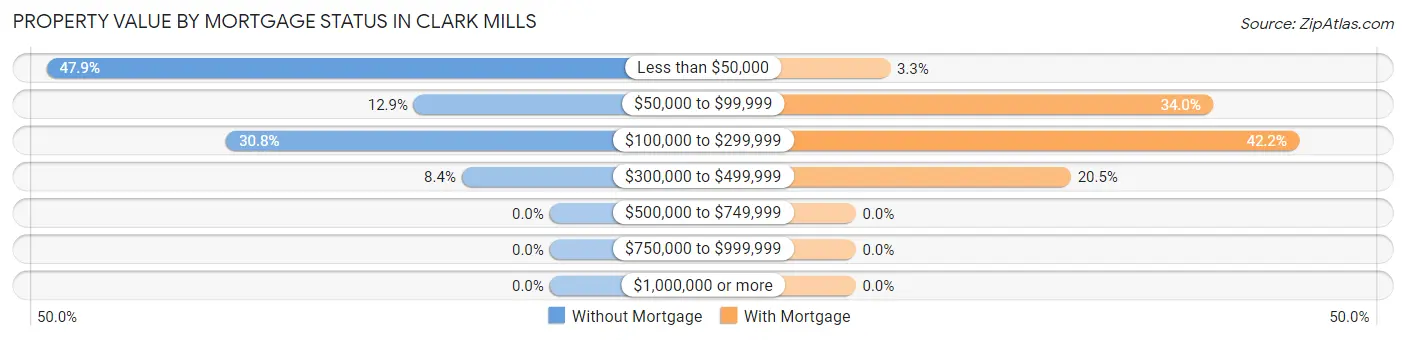
| Property Value | Without Mortgage | With Mortgage |
| Less than $50,000 | 126 (47.9%) | 8 (3.3%) |
| $50,000 to $99,999 | 34 (12.9%) | 83 (34.0%) |
| $100,000 to $299,999 | 81 (30.8%) | 103 (42.2%) |
| $300,000 to $499,999 | 22 (8.4%) | 50 (20.5%) |
| $500,000 to $749,999 | 0 (0.0%) | 0 (0.0%) |
| $750,000 to $999,999 | 0 (0.0%) | 0 (0.0%) |
| $1,000,000 or more | 0 (0.0%) | 0 (0.0%) |
| Total | 263 (100.0%) | 244 (100.0%) |
Household Income by Mortgage Status in Clark Mills
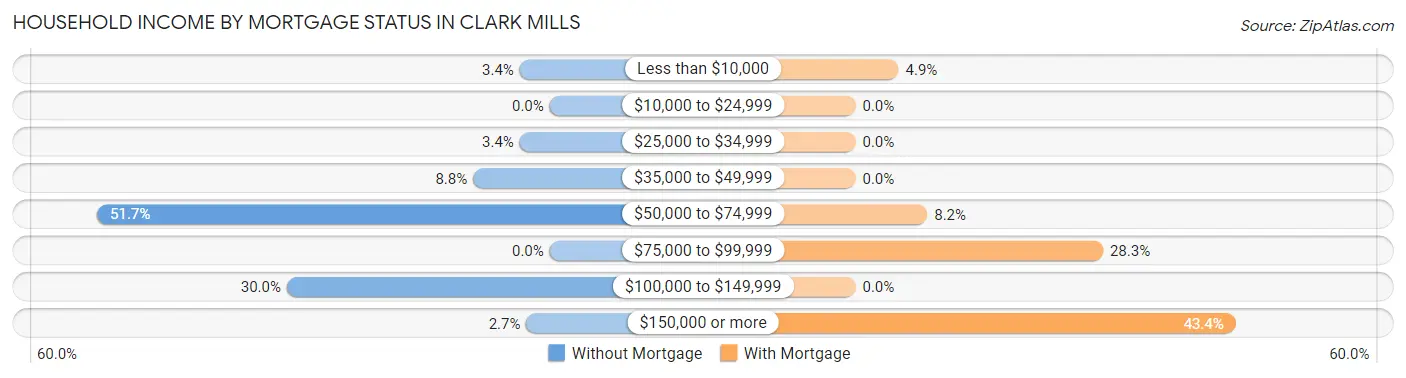
| Household Income | Without Mortgage | With Mortgage |
| Less than $10,000 | 9 (3.4%) | 12 (4.9%) |
| $10,000 to $24,999 | 0 (0.0%) | 0 (0.0%) |
| $25,000 to $34,999 | 9 (3.4%) | 0 (0.0%) |
| $35,000 to $49,999 | 23 (8.7%) | 0 (0.0%) |
| $50,000 to $74,999 | 136 (51.7%) | 20 (8.2%) |
| $75,000 to $99,999 | 0 (0.0%) | 69 (28.3%) |
| $100,000 to $149,999 | 79 (30.0%) | 0 (0.0%) |
| $150,000 or more | 7 (2.7%) | 106 (43.4%) |
| Total | 263 (100.0%) | 244 (100.0%) |
Property Value to Household Income Ratio in Clark Mills
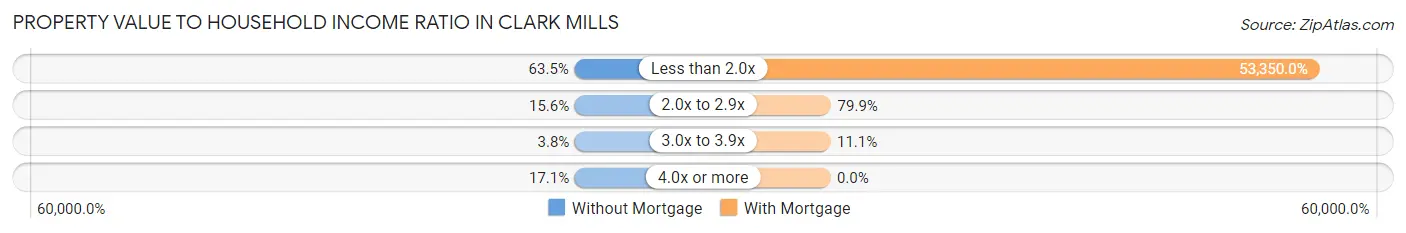
| Value-to-Income Ratio | Without Mortgage | With Mortgage |
| Less than 2.0x | 167 (63.5%) | 130,174 (53,350.0%) |
| 2.0x to 2.9x | 41 (15.6%) | 195 (79.9%) |
| 3.0x to 3.9x | 10 (3.8%) | 27 (11.1%) |
| 4.0x or more | 45 (17.1%) | 0 (0.0%) |
| Total | 263 (100.0%) | 244 (100.0%) |
Real Estate Taxes by Mortgage Status in Clark Mills
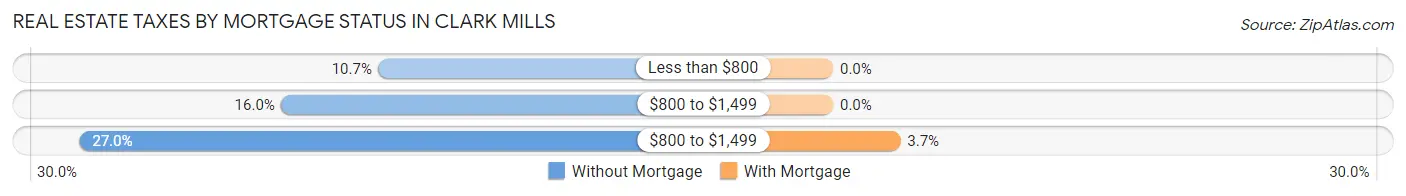
| Property Taxes | Without Mortgage | With Mortgage |
| Less than $800 | 28 (10.6%) | 0 (0.0%) |
| $800 to $1,499 | 42 (16.0%) | 0 (0.0%) |
| $800 to $1,499 | 71 (27.0%) | 9 (3.7%) |
| Total | 263 (100.0%) | 244 (100.0%) |
Health & Disability in Clark Mills
Health Insurance Coverage by Age in Clark Mills
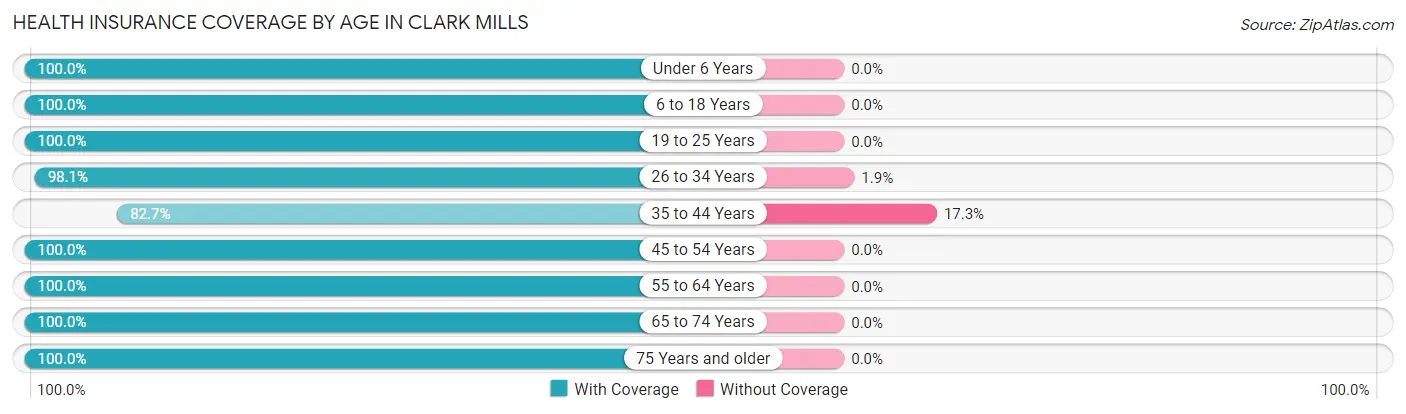
| Age Bracket | With Coverage | Without Coverage |
| Under 6 Years | 107 (100.0%) | 0 (0.0%) |
| 6 to 18 Years | 199 (100.0%) | 0 (0.0%) |
| 19 to 25 Years | 44 (100.0%) | 0 (0.0%) |
| 26 to 34 Years | 260 (98.1%) | 5 (1.9%) |
| 35 to 44 Years | 67 (82.7%) | 14 (17.3%) |
| 45 to 54 Years | 197 (100.0%) | 0 (0.0%) |
| 55 to 64 Years | 437 (100.0%) | 0 (0.0%) |
| 65 to 74 Years | 182 (100.0%) | 0 (0.0%) |
| 75 Years and older | 198 (100.0%) | 0 (0.0%) |
| Total | 1,691 (98.9%) | 19 (1.1%) |
Health Insurance Coverage by Citizenship Status in Clark Mills
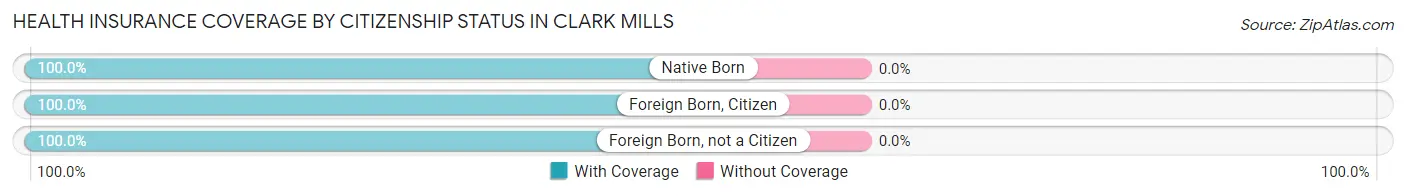
| Citizenship Status | With Coverage | Without Coverage |
| Native Born | 107 (100.0%) | 0 (0.0%) |
| Foreign Born, Citizen | 199 (100.0%) | 0 (0.0%) |
| Foreign Born, not a Citizen | 44 (100.0%) | 0 (0.0%) |
Health Insurance Coverage by Household Income in Clark Mills
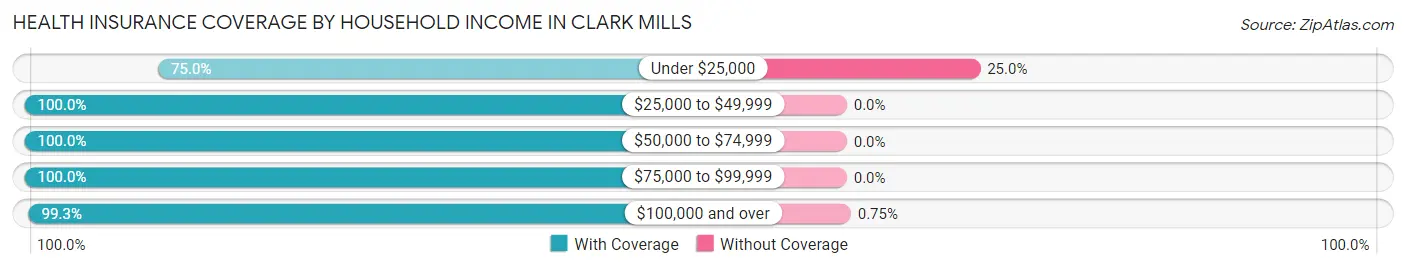
| Household Income | With Coverage | Without Coverage |
| Under $25,000 | 42 (75.0%) | 14 (25.0%) |
| $25,000 to $49,999 | 230 (100.0%) | 0 (0.0%) |
| $50,000 to $74,999 | 584 (100.0%) | 0 (0.0%) |
| $75,000 to $99,999 | 156 (100.0%) | 0 (0.0%) |
| $100,000 and over | 665 (99.3%) | 5 (0.7%) |
Public vs Private Health Insurance Coverage by Age in Clark Mills
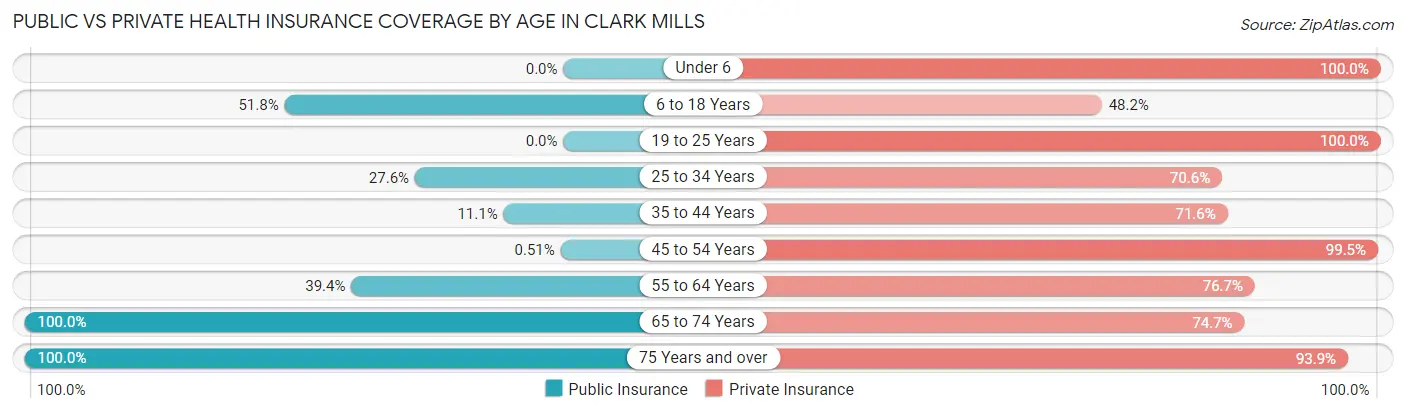
| Age Bracket | Public Insurance | Private Insurance |
| Under 6 | 0 (0.0%) | 107 (100.0%) |
| 6 to 18 Years | 103 (51.8%) | 96 (48.2%) |
| 19 to 25 Years | 0 (0.0%) | 44 (100.0%) |
| 25 to 34 Years | 73 (27.6%) | 187 (70.6%) |
| 35 to 44 Years | 9 (11.1%) | 58 (71.6%) |
| 45 to 54 Years | 1 (0.5%) | 196 (99.5%) |
| 55 to 64 Years | 172 (39.4%) | 335 (76.7%) |
| 65 to 74 Years | 182 (100.0%) | 136 (74.7%) |
| 75 Years and over | 198 (100.0%) | 186 (93.9%) |
| Total | 738 (43.2%) | 1,345 (78.6%) |
Disability Status by Sex by Age in Clark Mills
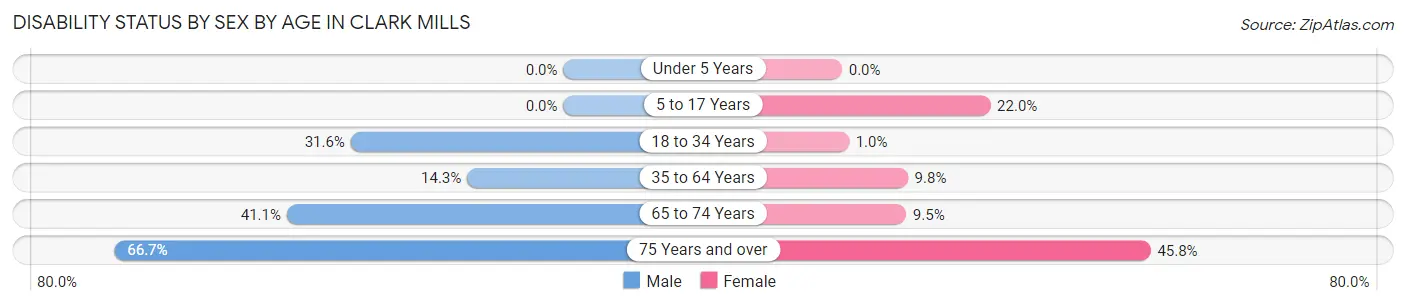
| Age Bracket | Male | Female |
| Under 5 Years | 0 (0.0%) | 0 (0.0%) |
| 5 to 17 Years | 0 (0.0%) | 26 (22.0%) |
| 18 to 34 Years | 36 (31.6%) | 2 (1.0%) |
| 35 to 64 Years | 51 (14.3%) | 35 (9.8%) |
| 65 to 74 Years | 23 (41.1%) | 12 (9.5%) |
| 75 Years and over | 52 (66.7%) | 55 (45.8%) |
Disability Class by Sex by Age in Clark Mills
Disability Class: Hearing Difficulty
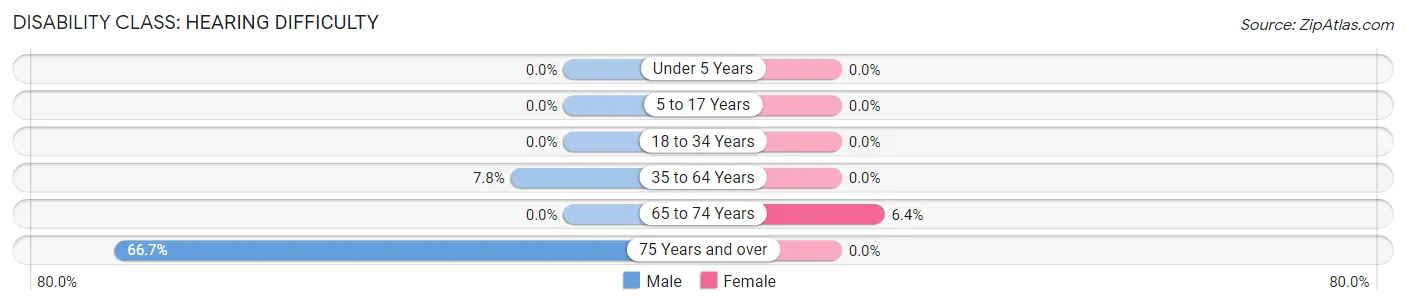
| Age Bracket | Male | Female |
| Under 5 Years | 0 (0.0%) | 0 (0.0%) |
| 5 to 17 Years | 0 (0.0%) | 0 (0.0%) |
| 18 to 34 Years | 0 (0.0%) | 0 (0.0%) |
| 35 to 64 Years | 28 (7.8%) | 0 (0.0%) |
| 65 to 74 Years | 0 (0.0%) | 8 (6.4%) |
| 75 Years and over | 52 (66.7%) | 0 (0.0%) |
Disability Class: Vision Difficulty
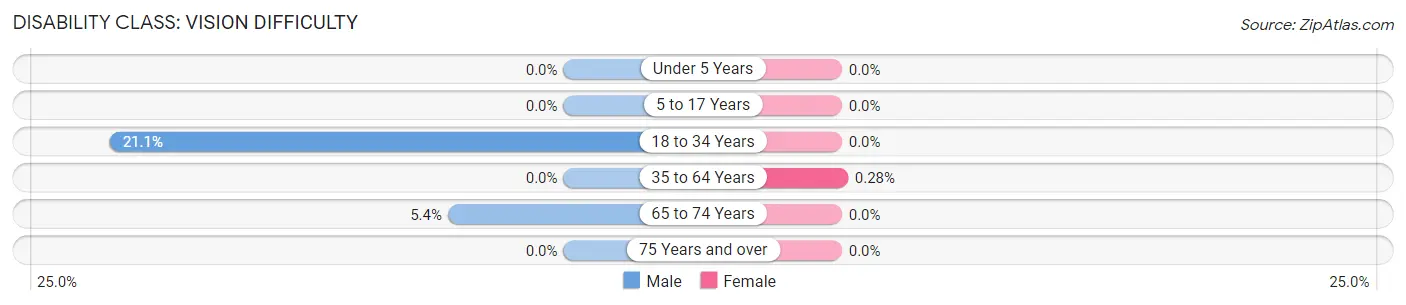
| Age Bracket | Male | Female |
| Under 5 Years | 0 (0.0%) | 0 (0.0%) |
| 5 to 17 Years | 0 (0.0%) | 0 (0.0%) |
| 18 to 34 Years | 24 (21.0%) | 0 (0.0%) |
| 35 to 64 Years | 0 (0.0%) | 1 (0.3%) |
| 65 to 74 Years | 3 (5.4%) | 0 (0.0%) |
| 75 Years and over | 0 (0.0%) | 0 (0.0%) |
Disability Class: Cognitive Difficulty
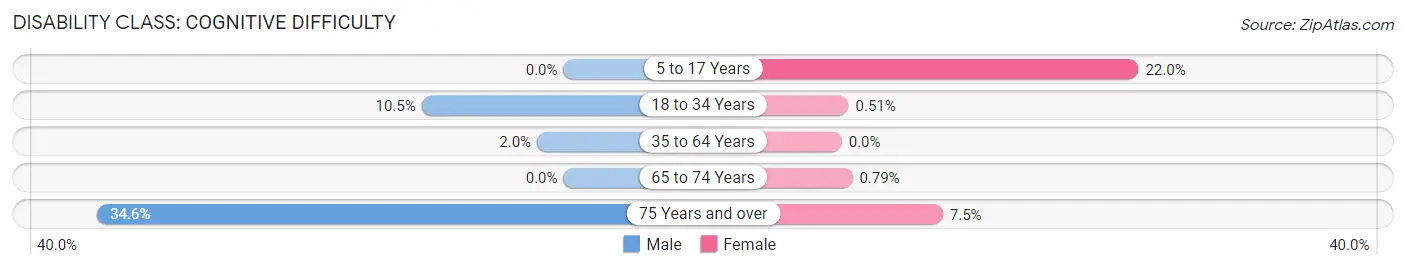
| Age Bracket | Male | Female |
| 5 to 17 Years | 0 (0.0%) | 26 (22.0%) |
| 18 to 34 Years | 12 (10.5%) | 1 (0.5%) |
| 35 to 64 Years | 7 (2.0%) | 0 (0.0%) |
| 65 to 74 Years | 0 (0.0%) | 1 (0.8%) |
| 75 Years and over | 27 (34.6%) | 9 (7.5%) |
Disability Class: Ambulatory Difficulty
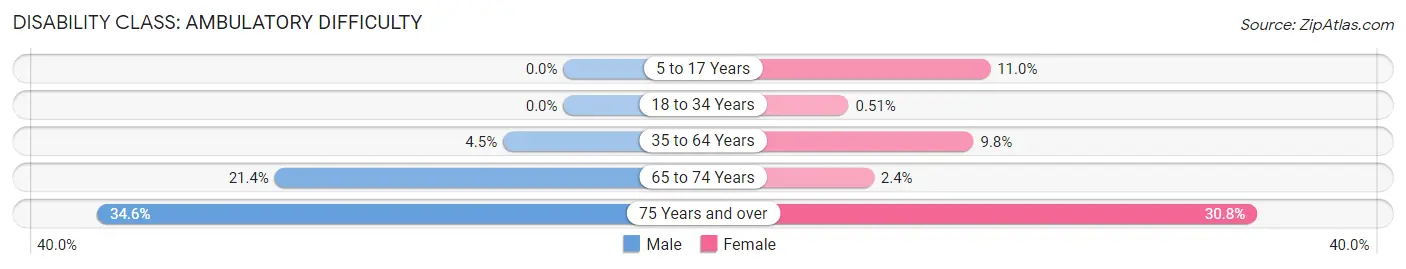
| Age Bracket | Male | Female |
| 5 to 17 Years | 0 (0.0%) | 13 (11.0%) |
| 18 to 34 Years | 0 (0.0%) | 1 (0.5%) |
| 35 to 64 Years | 16 (4.5%) | 35 (9.8%) |
| 65 to 74 Years | 12 (21.4%) | 3 (2.4%) |
| 75 Years and over | 27 (34.6%) | 37 (30.8%) |
Disability Class: Self-Care Difficulty
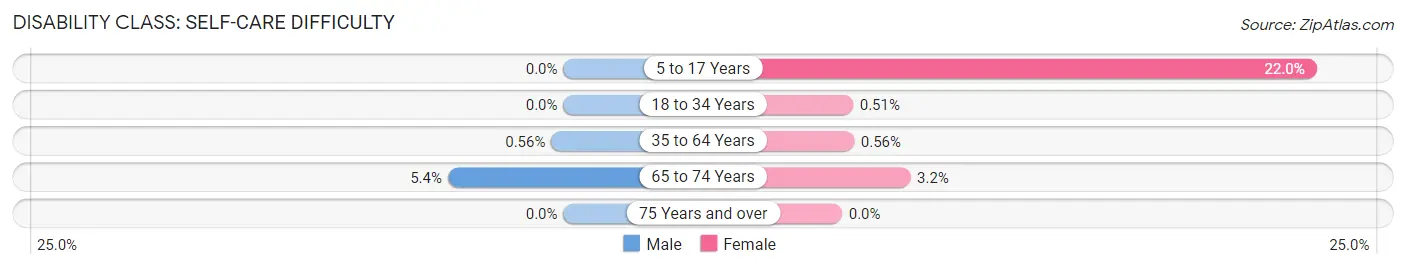
| Age Bracket | Male | Female |
| 5 to 17 Years | 0 (0.0%) | 26 (22.0%) |
| 18 to 34 Years | 0 (0.0%) | 1 (0.5%) |
| 35 to 64 Years | 2 (0.6%) | 2 (0.6%) |
| 65 to 74 Years | 3 (5.4%) | 4 (3.2%) |
| 75 Years and over | 0 (0.0%) | 0 (0.0%) |
Technology Access in Clark Mills
Computing Device Access in Clark Mills
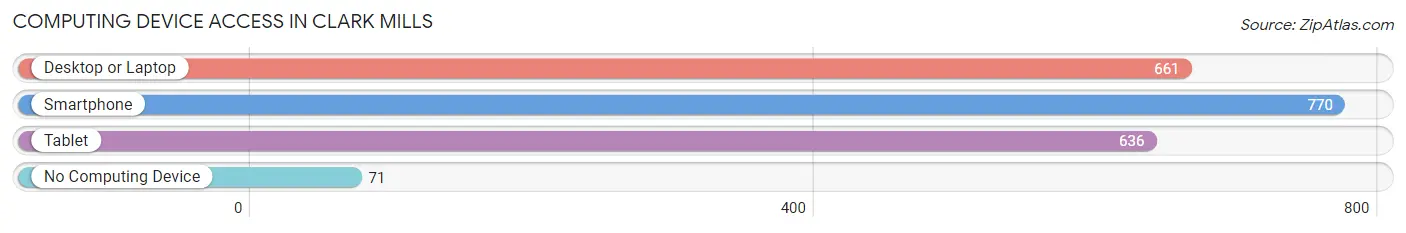
| Device Type | # Households | % Households |
| Desktop or Laptop | 661 | 71.2% |
| Smartphone | 770 | 82.9% |
| Tablet | 636 | 68.5% |
| No Computing Device | 71 | 7.6% |
| Total | 929 | 100.0% |
Internet Access in Clark Mills
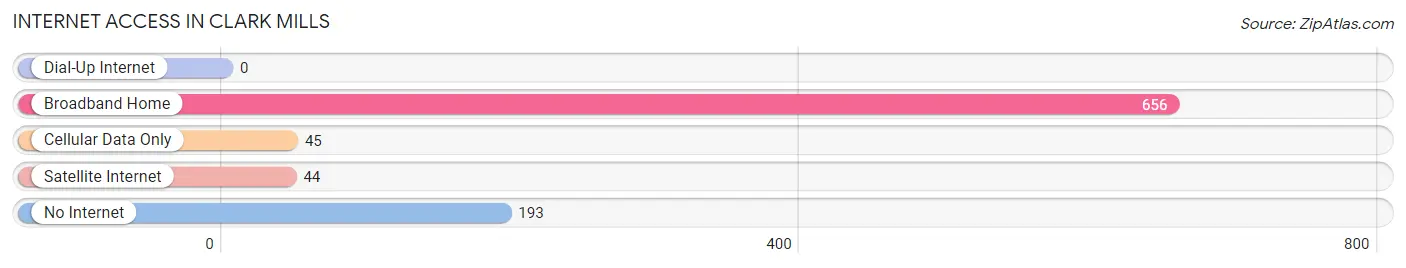
| Internet Type | # Households | % Households |
| Dial-Up Internet | 0 | 0.0% |
| Broadband Home | 656 | 70.6% |
| Cellular Data Only | 45 | 4.8% |
| Satellite Internet | 44 | 4.7% |
| No Internet | 193 | 20.8% |
| Total | 929 | 100.0% |
Clark Mills Summary
History
The hamlet of Clark Mills is located in the town of Whitestown in Oneida County, New York. The hamlet was first settled in 1790 by a man named John Clark, who built a sawmill and gristmill on the Sauquoit Creek. The hamlet was originally known as Clark’s Mills, but the name was eventually shortened to Clark Mills.
In 1810, the hamlet was incorporated as a village. The village was home to a variety of businesses, including a blacksmith shop, a tannery, a general store, and a hotel. The village also had a post office, which opened in 1820.
In 1845, the village was connected to the Erie Canal, which allowed for increased trade and commerce. The village continued to grow and prosper until the late 19th century, when the canal was replaced by the railroad. The village’s population began to decline as businesses moved away.
In the early 20th century, the village was home to a variety of small businesses, including a cheese factory, a creamery, and a sawmill. The village also had a school, a library, and a movie theater.
Geography
Clark Mills is located in the town of Whitestown in Oneida County, New York. The hamlet is situated on the Sauquoit Creek, which flows through the village. The village is located approximately 10 miles north of Utica and 25 miles east of Syracuse.
The village is located in a rural area, with the nearest major city being Utica. The village is surrounded by rolling hills and farmland. The village is located at an elevation of approximately 600 feet above sea level.
Economy
The economy of Clark Mills is largely based on agriculture and tourism. The village is home to several small businesses, including a cheese factory, a creamery, and a sawmill. The village also has a few restaurants and shops.
The village is also home to a variety of tourist attractions, including the Clark Mills Historical Society Museum, the Clark Mills Library, and the Clark Mills Movie Theater. The village also hosts a variety of events throughout the year, including the Clark Mills Summer Festival and the Clark Mills Fall Festival.
Demographics
As of the 2010 census, the population of Clark Mills was 1,845. The population is largely white (94.3%), with small percentages of African American (2.2%), Asian (1.2%), and Hispanic (1.2%) residents. The median household income is $50,938, and the median age is 43.
The village is served by the Clark Mills Central School District, which includes one elementary school, one middle school, and one high school. The village is also home to a branch of the Oneida County Public Library.
Common Questions
What is Per Capita Income in Clark Mills?
Per Capita income in Clark Mills is $44,999.
What is the Median Family Income in Clark Mills?
Median Family Income in Clark Mills is $117,607.
What is the Median Household income in Clark Mills?
Median Household Income in Clark Mills is $63,980.
What is Income or Wage Gap in Clark Mills?
Income or Wage Gap in Clark Mills is 7.7%.
Women in Clark Mills earn 92.3 cents for every dollar earned by a man.
What is Inequality or Gini Index in Clark Mills?
Inequality or Gini Index in Clark Mills is 0.35.
What is the Total Population of Clark Mills?
Total Population of Clark Mills is 1,749.
What is the Total Male Population of Clark Mills?
Total Male Population of Clark Mills is 783.
What is the Total Female Population of Clark Mills?
Total Female Population of Clark Mills is 966.
What is the Ratio of Males per 100 Females in Clark Mills?
There are 81.06 Males per 100 Females in Clark Mills.
What is the Ratio of Females per 100 Males in Clark Mills?
There are 123.37 Females per 100 Males in Clark Mills.
What is the Median Population Age in Clark Mills?
Median Population Age in Clark Mills is 51.2 Years.
What is the Average Family Size in Clark Mills
Average Family Size in Clark Mills is 2.8 People.
What is the Average Household Size in Clark Mills
Average Household Size in Clark Mills is 1.9 People.
How Large is the Labor Force in Clark Mills?
There are 922 People in the Labor Forcein in Clark Mills.
What is the Percentage of People in the Labor Force in Clark Mills?
63.3% of People are in the Labor Force in Clark Mills.
What is the Unemployment Rate in Clark Mills?
Unemployment Rate in Clark Mills is 1.1%.