Cities with the Highest Percentage of Belgian Population in Georgia
RELATED REPORTS & OPTIONS
Belgian
Georgia
Compare Cities
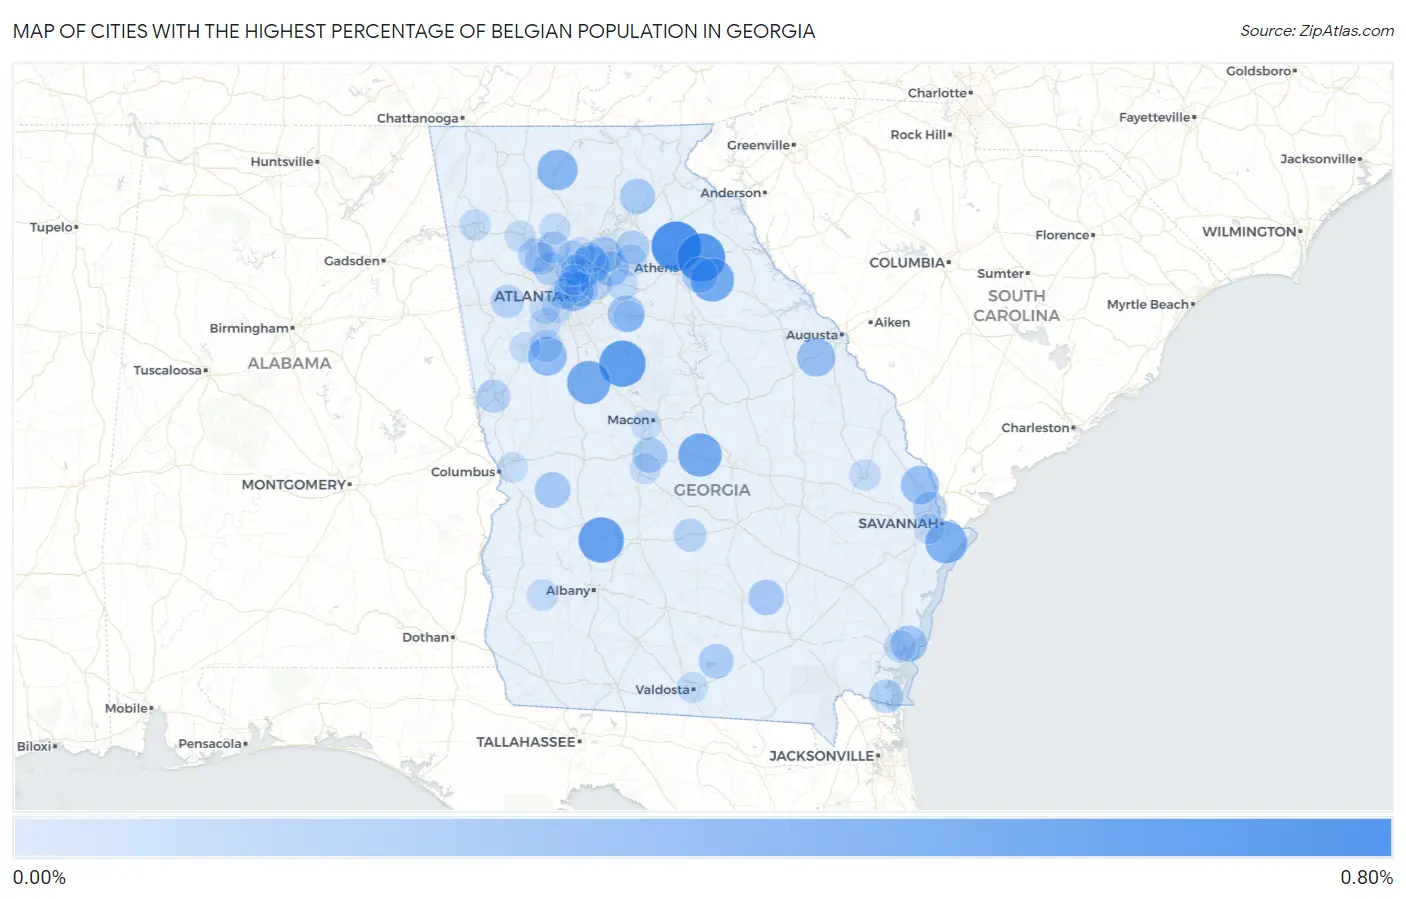
Map of Cities with the Highest Percentage of Belgian Population in Georgia
0.00%
0.80%
Cities with the Highest Percentage of Belgian Population in Georgia
| City | Belgian | vs State | vs National | |
| 1. | Nicholson | 0.73% | 0.036%(+0.689)#1 | 0.099%(+0.627)#1,029 |
| 2. | Colbert | 0.67% | 0.036%(+0.629)#2 | 0.099%(+0.567)#1,118 |
| 3. | Flovilla | 0.60% | 0.036%(+0.565)#3 | 0.099%(+0.502)#1,220 |
| 4. | Leslie | 0.57% | 0.036%(+0.535)#4 | 0.099%(+0.473)#1,268 |
| 5. | Allentown | 0.49% | 0.036%(+0.454)#5 | 0.099%(+0.391)#1,474 |
| 6. | Lexington | 0.49% | 0.036%(+0.451)#6 | 0.099%(+0.389)#1,480 |
| 7. | Milner | 0.49% | 0.036%(+0.451)#7 | 0.099%(+0.388)#1,483 |
| 8. | Skidaway Island | 0.43% | 0.036%(+0.394)#8 | 0.099%(+0.332)#1,618 |
| 9. | East Ellijay | 0.38% | 0.036%(+0.341)#9 | 0.099%(+0.279)#1,802 |
| 10. | Druid Hills | 0.34% | 0.036%(+0.306)#10 | 0.099%(+0.244)#1,940 |
| 11. | Berkeley Lake | 0.32% | 0.036%(+0.280)#11 | 0.099%(+0.218)#2,067 |
| 12. | Senoia | 0.31% | 0.036%(+0.276)#12 | 0.099%(+0.214)#2,082 |
| 13. | Blythe | 0.30% | 0.036%(+0.261)#13 | 0.099%(+0.199)#2,162 |
| 14. | Springfield | 0.29% | 0.036%(+0.254)#14 | 0.099%(+0.192)#2,207 |
| 15. | Oxford | 0.25% | 0.036%(+0.210)#15 | 0.099%(+0.147)#2,514 |
| 16. | Suwanee | 0.23% | 0.036%(+0.190)#16 | 0.099%(+0.127)#2,668 |
| 17. | St Simons | 0.23% | 0.036%(+0.189)#17 | 0.099%(+0.126)#2,676 |
| 18. | Arnoldsville | 0.21% | 0.036%(+0.169)#18 | 0.099%(+0.107)#2,817 |
| 19. | Buena Vista | 0.20% | 0.036%(+0.167)#19 | 0.099%(+0.105)#2,836 |
| 20. | Nicholls | 0.20% | 0.036%(+0.160)#20 | 0.099%(+0.097)#2,898 |
| 21. | Lawrenceville | 0.18% | 0.036%(+0.148)#21 | 0.099%(+0.085)#3,007 |
| 22. | Clermont | 0.18% | 0.036%(+0.147)#22 | 0.099%(+0.084)#3,015 |
| 23. | Warner Robins | 0.18% | 0.036%(+0.144)#23 | 0.099%(+0.082)#3,037 |
| 24. | Lakeland | 0.17% | 0.036%(+0.134)#24 | 0.099%(+0.072)#3,127 |
| 25. | Braselton | 0.14% | 0.036%(+0.109)#25 | 0.099%(+0.046)#3,381 |
| 26. | Port Wentworth | 0.14% | 0.036%(+0.108)#26 | 0.099%(+0.045)#3,389 |
| 27. | St Marys | 0.14% | 0.036%(+0.099)#27 | 0.099%(+0.036)#3,486 |
| 28. | Acworth | 0.13% | 0.036%(+0.089)#28 | 0.099%(+0.027)#3,595 |
| 29. | Scottdale | 0.12% | 0.036%(+0.087)#29 | 0.099%(+0.024)#3,615 |
| 30. | Lagrange | 0.12% | 0.036%(+0.082)#30 | 0.099%(+0.020)#3,654 |
| 31. | Berry College | 0.12% | 0.036%(+0.079)#31 | 0.099%(+0.017)#3,697 |
| 32. | Villa Rica | 0.12% | 0.036%(+0.079)#32 | 0.099%(+0.016)#3,707 |
| 33. | Marietta | 0.11% | 0.036%(+0.078)#33 | 0.099%(+0.015)#3,727 |
| 34. | Abbeville | 0.11% | 0.036%(+0.073)#34 | 0.099%(+0.010)#3,793 |
| 35. | Doraville | 0.10% | 0.036%(+0.067)#35 | 0.099%(+0.004)#3,861 |
| 36. | North Druid Hills | 0.099% | 0.036%(+0.062)#36 | 0.099%(-0.000)#3,921 |
| 37. | Kennesaw | 0.096% | 0.036%(+0.060)#37 | 0.099%(-0.003)#3,961 |
| 38. | Peachtree City | 0.086% | 0.036%(+0.050)#38 | 0.099%(-0.013)#4,091 |
| 39. | Athens-Clarke County Unified Government (Balance) | 0.077% | 0.036%(+0.041)#39 | 0.099%(-0.021)#4,205 |
| 40. | Mountain Park | 0.075% | 0.036%(+0.039)#40 | 0.099%(-0.024)#4,235 |
| 41. | Woodstock | 0.074% | 0.036%(+0.038)#41 | 0.099%(-0.025)#4,253 |
| 42. | Brunswick | 0.072% | 0.036%(+0.036)#42 | 0.099%(-0.027)#4,274 |
| 43. | Auburn | 0.064% | 0.036%(+0.028)#43 | 0.099%(-0.035)#4,400 |
| 44. | Fairburn | 0.061% | 0.036%(+0.024)#44 | 0.099%(-0.038)#4,451 |
| 45. | Canton | 0.057% | 0.036%(+0.020)#45 | 0.099%(-0.042)#4,509 |
| 46. | Loganville | 0.056% | 0.036%(+0.020)#46 | 0.099%(-0.043)#4,521 |
| 47. | Rome | 0.056% | 0.036%(+0.020)#47 | 0.099%(-0.043)#4,524 |
| 48. | Morgan | 0.055% | 0.036%(+0.018)#48 | 0.099%(-0.044)#4,545 |
| 49. | Statesboro | 0.054% | 0.036%(+0.018)#49 | 0.099%(-0.045)#4,552 |
| 50. | Atlanta | 0.050% | 0.036%(+0.014)#50 | 0.099%(-0.049)#4,619 |
| 51. | Sandy Springs | 0.049% | 0.036%(+0.013)#51 | 0.099%(-0.049)#4,629 |
| 52. | Alpharetta | 0.044% | 0.036%(+0.008)#52 | 0.099%(-0.055)#4,723 |
| 53. | Cartersville | 0.043% | 0.036%(+0.007)#53 | 0.099%(-0.056)#4,734 |
| 54. | Covington | 0.042% | 0.036%(+0.006)#54 | 0.099%(-0.057)#4,758 |
| 55. | Roswell | 0.042% | 0.036%(+0.006)#55 | 0.099%(-0.057)#4,760 |
| 56. | Dunwoody | 0.041% | 0.036%(+0.005)#56 | 0.099%(-0.058)#4,786 |
| 57. | Valdosta | 0.040% | 0.036%(+0.003)#57 | 0.099%(-0.059)#4,802 |
| 58. | Perry | 0.038% | 0.036%(+0.001)#58 | 0.099%(-0.061)#4,834 |
| 59. | East Point | 0.037% | 0.036%(+0.000)#59 | 0.099%(-0.062)#4,852 |
| 60. | Newnan | 0.035% | 0.036%(-0.001)#60 | 0.099%(-0.064)#4,878 |
| 61. | Johns Creek | 0.032% | 0.036%(-0.005)#61 | 0.099%(-0.067)#4,930 |
| 62. | Macon Bibb County | 0.029% | 0.036%(-0.008)#62 | 0.099%(-0.070)#4,976 |
| 63. | South Fulton | 0.029% | 0.036%(-0.008)#63 | 0.099%(-0.070)#4,977 |
| 64. | Brookhaven | 0.025% | 0.036%(-0.012)#64 | 0.099%(-0.074)#5,055 |
| 65. | Savannah | 0.024% | 0.036%(-0.012)#65 | 0.099%(-0.074)#5,060 |
| 66. | Columbus | 0.023% | 0.036%(-0.013)#66 | 0.099%(-0.075)#5,076 |
| 67. | Augusta-Richmond County Consolidated Government (Balance) | 0.0040% | 0.036%(-0.032)#67 | 0.099%(-0.095)#5,290 |
Common Questions
What are the Top 10 Cities with the Highest Percentage of Belgian Population in Georgia?
Top 10 Cities with the Highest Percentage of Belgian Population in Georgia are:
#1
0.73%
#2
0.67%
#3
0.60%
#4
0.57%
#5
0.49%
#6
0.49%
#7
0.49%
#8
0.43%
#9
0.38%
#10
0.34%
What city has the Highest Percentage of Belgian Population in Georgia?
Nicholson has the Highest Percentage of Belgian Population in Georgia with 0.73%.
What is the Percentage of Belgian Population in the State of Georgia?
Percentage of Belgian Population in Georgia is 0.036%.
What is the Percentage of Belgian Population in the United States?
Percentage of Belgian Population in the United States is 0.099%.