Cities with the Highest Percentage of Belgian Population in Maryland
RELATED REPORTS & OPTIONS
Belgian
Maryland
Compare Cities
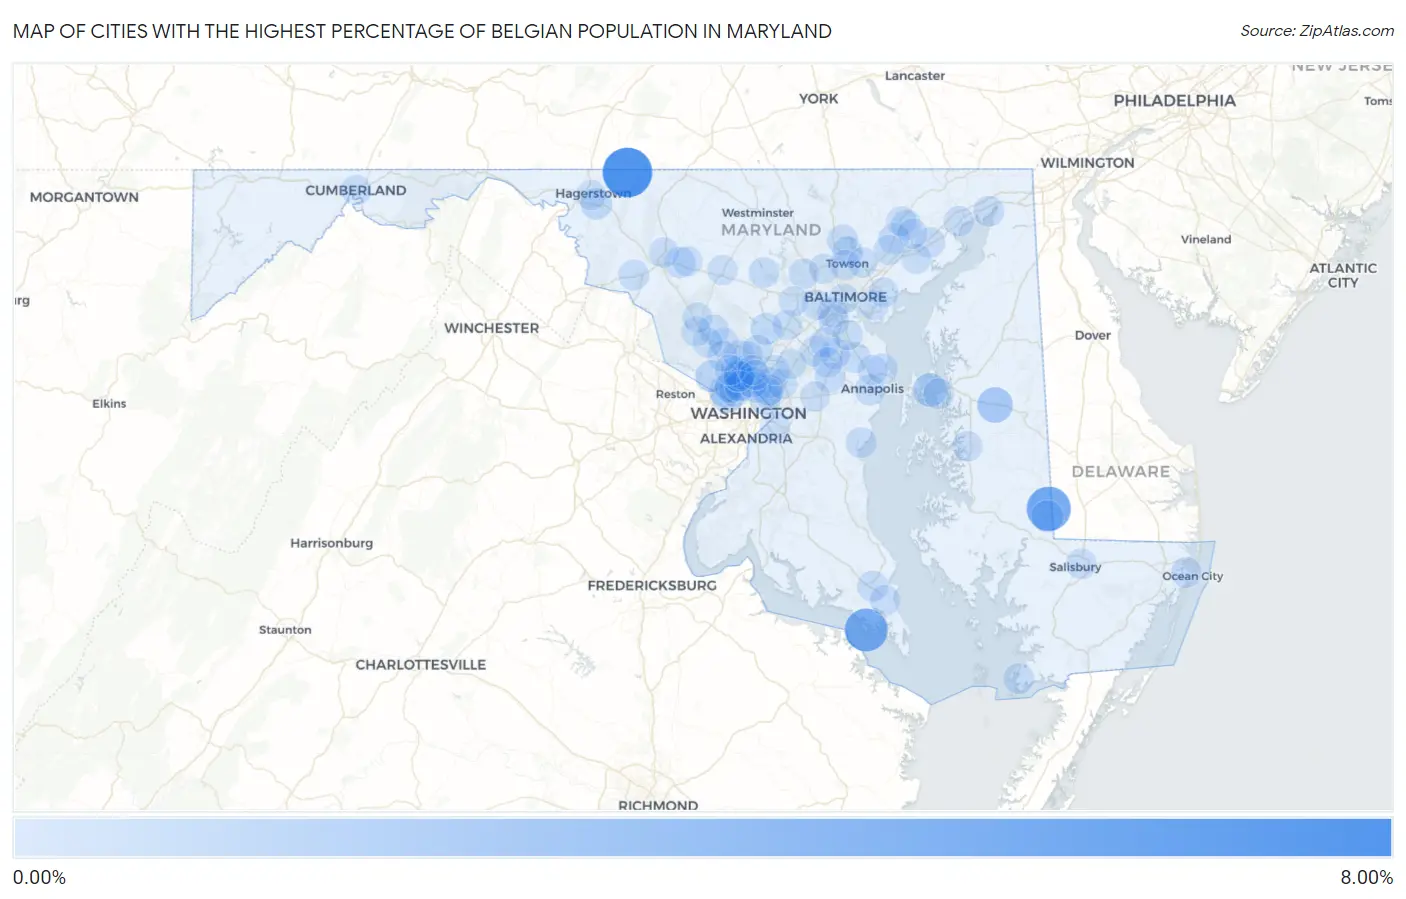
Map of Cities with the Highest Percentage of Belgian Population in Maryland
0.00%
8.00%
Cities with the Highest Percentage of Belgian Population in Maryland
| City | Belgian | vs State | vs National | |
| 1. | Ringgold | 7.59% | 0.057%(+7.54)#1 | 0.099%(+7.50)#45 |
| 2. | Galestown | 5.41% | 0.057%(+5.35)#2 | 0.099%(+5.31)#82 |
| 3. | Piney Point | 4.94% | 0.057%(+4.88)#3 | 0.099%(+4.84)#99 |
| 4. | Queen Anne | 2.02% | 0.057%(+1.96)#4 | 0.099%(+1.92)#336 |
| 5. | Kent Narrows | 1.38% | 0.057%(+1.33)#5 | 0.099%(+1.29)#525 |
| 6. | Brookmont | 1.13% | 0.057%(+1.07)#6 | 0.099%(+1.03)#662 |
| 7. | Sharptown | 0.80% | 0.057%(+0.739)#7 | 0.099%(+0.697)#943 |
| 8. | Chevy Chase | 0.79% | 0.057%(+0.729)#8 | 0.099%(+0.688)#952 |
| 9. | Glen Echo | 0.71% | 0.057%(+0.652)#9 | 0.099%(+0.610)#1,047 |
| 10. | Potomac | 0.61% | 0.057%(+0.551)#10 | 0.099%(+0.510)#1,208 |
| 11. | Mount Rainier | 0.61% | 0.057%(+0.548)#11 | 0.099%(+0.506)#1,214 |
| 12. | Somerset | 0.58% | 0.057%(+0.526)#12 | 0.099%(+0.485)#1,245 |
| 13. | Funkstown | 0.58% | 0.057%(+0.524)#13 | 0.099%(+0.482)#1,253 |
| 14. | Highland | 0.54% | 0.057%(+0.482)#14 | 0.099%(+0.441)#1,343 |
| 15. | Chevy Chase View | 0.53% | 0.057%(+0.477)#15 | 0.099%(+0.435)#1,364 |
| 16. | Garrett Park | 0.49% | 0.057%(+0.433)#16 | 0.099%(+0.391)#1,473 |
| 17. | Spring Ridge | 0.40% | 0.057%(+0.347)#17 | 0.099%(+0.305)#1,705 |
| 18. | Forest Glen | 0.35% | 0.057%(+0.293)#18 | 0.099%(+0.251)#1,909 |
| 19. | Annapolis | 0.31% | 0.057%(+0.257)#19 | 0.099%(+0.216)#2,077 |
| 20. | Severna Park | 0.30% | 0.057%(+0.244)#20 | 0.099%(+0.203)#2,139 |
| 21. | California | 0.29% | 0.057%(+0.229)#21 | 0.099%(+0.187)#2,234 |
| 22. | Bethesda | 0.28% | 0.057%(+0.228)#22 | 0.099%(+0.186)#2,244 |
| 23. | Kensington | 0.27% | 0.057%(+0.211)#23 | 0.099%(+0.169)#2,352 |
| 24. | Jefferson | 0.26% | 0.057%(+0.198)#24 | 0.099%(+0.156)#2,448 |
| 25. | Pleasant Hills | 0.25% | 0.057%(+0.198)#25 | 0.099%(+0.156)#2,452 |
| 26. | Chevy Chase Section Five | 0.25% | 0.057%(+0.194)#26 | 0.099%(+0.152)#2,478 |
| 27. | College Park | 0.25% | 0.057%(+0.193)#27 | 0.099%(+0.151)#2,485 |
| 28. | Cockeysville | 0.25% | 0.057%(+0.192)#28 | 0.099%(+0.151)#2,489 |
| 29. | Sykesville | 0.23% | 0.057%(+0.175)#29 | 0.099%(+0.133)#2,615 |
| 30. | Fort Meade | 0.22% | 0.057%(+0.163)#30 | 0.099%(+0.121)#2,708 |
| 31. | Grasonville | 0.21% | 0.057%(+0.153)#31 | 0.099%(+0.111)#2,783 |
| 32. | Crisfield | 0.20% | 0.057%(+0.147)#32 | 0.099%(+0.106)#2,827 |
| 33. | Montgomery Village | 0.20% | 0.057%(+0.141)#33 | 0.099%(+0.100)#2,875 |
| 34. | Charlestown | 0.20% | 0.057%(+0.138)#34 | 0.099%(+0.096)#2,903 |
| 35. | Gambrills | 0.19% | 0.057%(+0.136)#35 | 0.099%(+0.094)#2,927 |
| 36. | Deale | 0.19% | 0.057%(+0.134)#36 | 0.099%(+0.092)#2,942 |
| 37. | Riverside | 0.19% | 0.057%(+0.128)#37 | 0.099%(+0.087)#2,990 |
| 38. | Lansdowne | 0.18% | 0.057%(+0.126)#38 | 0.099%(+0.085)#3,008 |
| 39. | Linthicum | 0.18% | 0.057%(+0.120)#39 | 0.099%(+0.078)#3,073 |
| 40. | Takoma Park | 0.18% | 0.057%(+0.120)#40 | 0.099%(+0.078)#3,077 |
| 41. | Salisbury | 0.15% | 0.057%(+0.098)#41 | 0.099%(+0.056)#3,279 |
| 42. | University Park | 0.15% | 0.057%(+0.096)#42 | 0.099%(+0.054)#3,297 |
| 43. | West Ocean City | 0.15% | 0.057%(+0.095)#43 | 0.099%(+0.054)#3,306 |
| 44. | Aspen Hill | 0.15% | 0.057%(+0.094)#44 | 0.099%(+0.052)#3,318 |
| 45. | Silver Spring | 0.14% | 0.057%(+0.085)#45 | 0.099%(+0.043)#3,411 |
| 46. | Cape St Claire | 0.13% | 0.057%(+0.073)#46 | 0.099%(+0.031)#3,539 |
| 47. | Severn | 0.13% | 0.057%(+0.072)#47 | 0.099%(+0.031)#3,549 |
| 48. | Timonium | 0.12% | 0.057%(+0.063)#48 | 0.099%(+0.022)#3,638 |
| 49. | South Kensington | 0.12% | 0.057%(+0.062)#49 | 0.099%(+0.021)#3,649 |
| 50. | Layhill | 0.12% | 0.057%(+0.059)#50 | 0.099%(+0.018)#3,686 |
| 51. | Havre De Grace | 0.12% | 0.057%(+0.058)#51 | 0.099%(+0.016)#3,705 |
| 52. | Rockville | 0.11% | 0.057%(+0.052)#52 | 0.099%(+0.010)#3,796 |
| 53. | Easton | 0.11% | 0.057%(+0.048)#53 | 0.099%(+0.006)#3,838 |
| 54. | Lexington Park | 0.10% | 0.057%(+0.046)#54 | 0.099%(+0.005)#3,856 |
| 55. | Crofton | 0.10% | 0.057%(+0.045)#55 | 0.099%(+0.003)#3,870 |
| 56. | Honeygo | 0.100% | 0.057%(+0.042)#56 | 0.099%(+0.001)#3,907 |
| 57. | Cumberland | 0.095% | 0.057%(+0.037)#57 | 0.099%(-0.004)#3,977 |
| 58. | Bel Air | 0.094% | 0.057%(+0.037)#58 | 0.099%(-0.005)#3,982 |
| 59. | Towson | 0.094% | 0.057%(+0.037)#59 | 0.099%(-0.005)#3,990 |
| 60. | Frederick | 0.088% | 0.057%(+0.031)#60 | 0.099%(-0.011)#4,052 |
| 61. | North Bethesda | 0.086% | 0.057%(+0.029)#61 | 0.099%(-0.012)#4,078 |
| 62. | Kingsville | 0.086% | 0.057%(+0.029)#62 | 0.099%(-0.013)#4,089 |
| 63. | Edgewood | 0.084% | 0.057%(+0.026)#63 | 0.099%(-0.015)#4,119 |
| 64. | Randallstown | 0.080% | 0.057%(+0.023)#64 | 0.099%(-0.019)#4,173 |
| 65. | Cloverly | 0.079% | 0.057%(+0.022)#65 | 0.099%(-0.020)#4,182 |
| 66. | Glen Burnie | 0.078% | 0.057%(+0.021)#66 | 0.099%(-0.020)#4,192 |
| 67. | Odenton | 0.073% | 0.057%(+0.016)#67 | 0.099%(-0.026)#4,258 |
| 68. | Columbia | 0.070% | 0.057%(+0.013)#68 | 0.099%(-0.028)#4,294 |
| 69. | Catonsville | 0.070% | 0.057%(+0.013)#69 | 0.099%(-0.029)#4,297 |
| 70. | Green Valley | 0.069% | 0.057%(+0.012)#70 | 0.099%(-0.030)#4,311 |
| 71. | Greenbelt | 0.069% | 0.057%(+0.012)#71 | 0.099%(-0.030)#4,319 |
| 72. | Carney | 0.068% | 0.057%(+0.011)#72 | 0.099%(-0.031)#4,333 |
| 73. | Mount Airy | 0.062% | 0.057%(+0.005)#73 | 0.099%(-0.037)#4,435 |
| 74. | Redland | 0.055% | 0.057%(-0.003)#74 | 0.099%(-0.044)#4,546 |
| 75. | Gaithersburg | 0.054% | 0.057%(-0.004)#75 | 0.099%(-0.045)#4,559 |
| 76. | Clarksburg | 0.053% | 0.057%(-0.004)#76 | 0.099%(-0.046)#4,568 |
| 77. | Hyattsville | 0.053% | 0.057%(-0.004)#77 | 0.099%(-0.046)#4,572 |
| 78. | Linganore | 0.051% | 0.057%(-0.007)#78 | 0.099%(-0.048)#4,611 |
| 79. | South Laurel | 0.042% | 0.057%(-0.015)#79 | 0.099%(-0.057)#4,759 |
| 80. | Hagerstown | 0.041% | 0.057%(-0.016)#80 | 0.099%(-0.057)#4,770 |
| 81. | Bel Air North | 0.035% | 0.057%(-0.022)#81 | 0.099%(-0.064)#4,879 |
| 82. | Baltimore | 0.033% | 0.057%(-0.024)#82 | 0.099%(-0.066)#4,904 |
| 83. | Arnold | 0.032% | 0.057%(-0.025)#83 | 0.099%(-0.067)#4,920 |
| 84. | Beltsville | 0.030% | 0.057%(-0.027)#84 | 0.099%(-0.068)#4,948 |
| 85. | Bel Air South | 0.025% | 0.057%(-0.033)#85 | 0.099%(-0.074)#5,058 |
| 86. | Germantown | 0.020% | 0.057%(-0.037)#86 | 0.099%(-0.079)#5,134 |
| 87. | Kemp Mill | 0.014% | 0.057%(-0.043)#87 | 0.099%(-0.085)#5,204 |
| 88. | Dundalk | 0.014% | 0.057%(-0.044)#88 | 0.099%(-0.085)#5,209 |
| 89. | Four Corners | 0.013% | 0.057%(-0.044)#89 | 0.099%(-0.086)#5,216 |
| 90. | Bowie | 0.012% | 0.057%(-0.045)#90 | 0.099%(-0.087)#5,222 |
| 91. | Ellicott City | 0.011% | 0.057%(-0.046)#91 | 0.099%(-0.088)#5,239 |
| 92. | Essex | 0.0098% | 0.057%(-0.047)#92 | 0.099%(-0.089)#5,247 |
| 93. | Pikesville | 0.0088% | 0.057%(-0.048)#93 | 0.099%(-0.090)#5,257 |
| 94. | Suitland | 0.0039% | 0.057%(-0.053)#94 | 0.099%(-0.095)#5,291 |
Common Questions
What are the Top 10 Cities with the Highest Percentage of Belgian Population in Maryland?
Top 10 Cities with the Highest Percentage of Belgian Population in Maryland are:
#1
7.59%
#2
5.41%
#3
4.94%
#4
2.02%
#5
1.38%
#6
1.13%
#7
0.80%
#8
0.79%
#9
0.71%
#10
0.61%
What city has the Highest Percentage of Belgian Population in Maryland?
Ringgold has the Highest Percentage of Belgian Population in Maryland with 7.59%.
What is the Percentage of Belgian Population in the State of Maryland?
Percentage of Belgian Population in Maryland is 0.057%.
What is the Percentage of Belgian Population in the United States?
Percentage of Belgian Population in the United States is 0.099%.