Cities with the Largest Pakistani Community in Michigan
RELATED REPORTS & OPTIONS
Pakistani
Michigan
Compare Cities
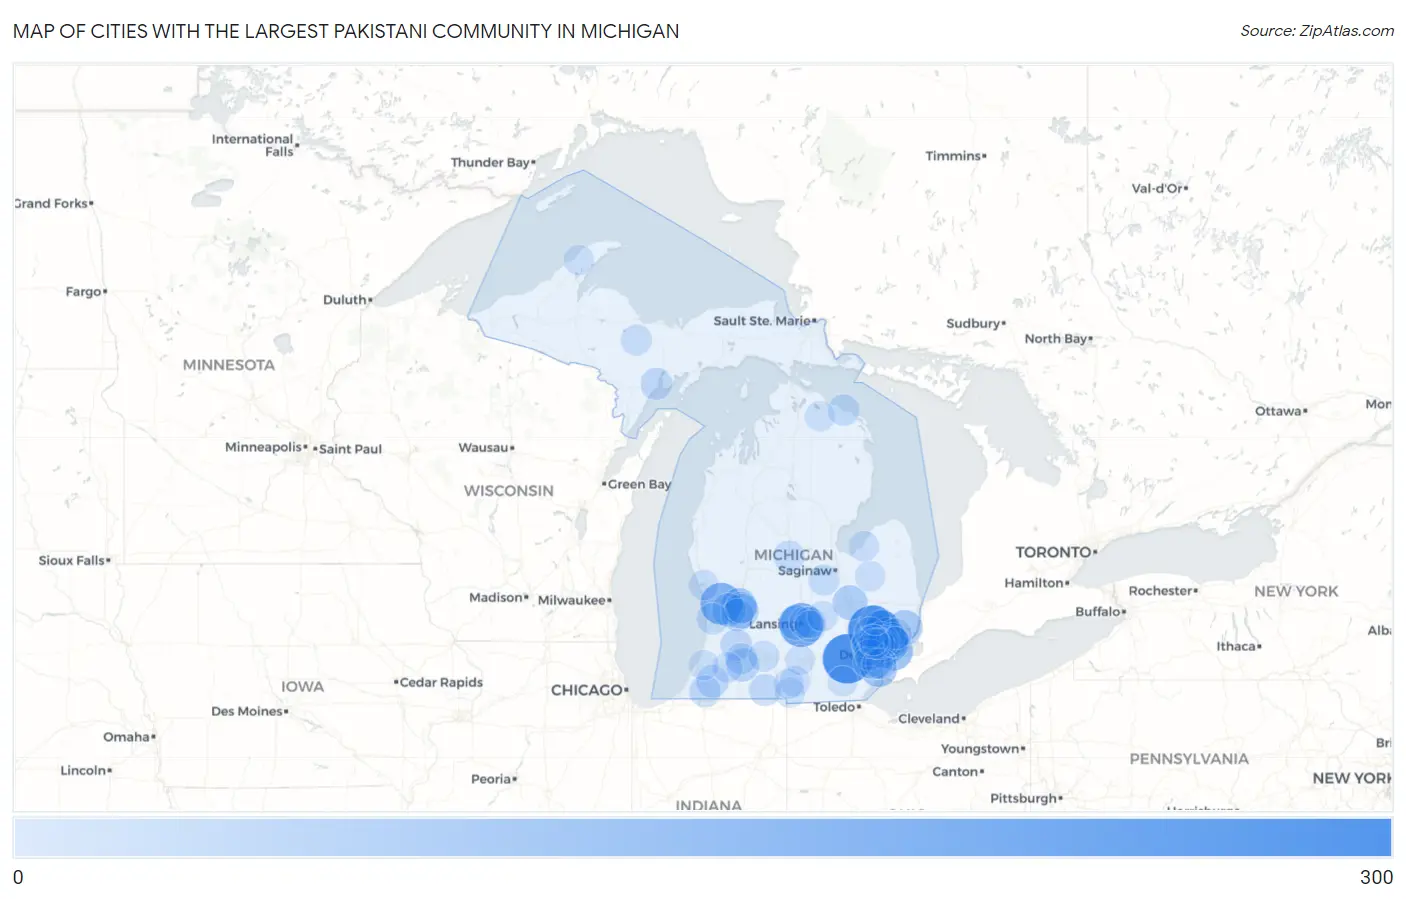
Map of Cities with the Largest Pakistani Community in Michigan
0
300
Cities with the Largest Pakistani Community in Michigan
| City | Pakistani | vs State | vs National | |
| 1. | Ann Arbor | 274 | 5,035(5.44%)#1 | 321,133(0.09%)#164 |
| 2. | Pontiac | 265 | 5,035(5.26%)#2 | 321,133(0.08%)#172 |
| 3. | Lansing | 191 | 5,035(3.79%)#3 | 321,133(0.06%)#290 |
| 4. | Allendale | 162 | 5,035(3.22%)#4 | 321,133(0.05%)#357 |
| 5. | Warren | 156 | 5,035(3.10%)#5 | 321,133(0.05%)#374 |
| 6. | Troy | 116 | 5,035(2.30%)#6 | 321,133(0.04%)#538 |
| 7. | Rochester Hills | 115 | 5,035(2.28%)#7 | 321,133(0.04%)#543 |
| 8. | Grosse Pointe Park | 114 | 5,035(2.26%)#8 | 321,133(0.04%)#549 |
| 9. | Trenton | 87 | 5,035(1.73%)#9 | 321,133(0.03%)#713 |
| 10. | Grand Rapids | 84 | 5,035(1.67%)#10 | 321,133(0.03%)#736 |
| 11. | New Baltimore | 67 | 5,035(1.33%)#11 | 321,133(0.02%)#904 |
| 12. | Sterling Heights | 62 | 5,035(1.23%)#12 | 321,133(0.02%)#948 |
| 13. | Waverly | 61 | 5,035(1.21%)#13 | 321,133(0.02%)#974 |
| 14. | Flint | 59 | 5,035(1.17%)#14 | 321,133(0.02%)#996 |
| 15. | Kentwood | 58 | 5,035(1.15%)#15 | 321,133(0.02%)#1,013 |
| 16. | Rochester | 54 | 5,035(1.07%)#16 | 321,133(0.02%)#1,063 |
| 17. | Taylor | 53 | 5,035(1.05%)#17 | 321,133(0.02%)#1,073 |
| 18. | Jenison | 50 | 5,035(0.99%)#18 | 321,133(0.02%)#1,120 |
| 19. | Hazel Park | 49 | 5,035(0.97%)#19 | 321,133(0.02%)#1,140 |
| 20. | Clawson | 49 | 5,035(0.97%)#20 | 321,133(0.02%)#1,144 |
| 21. | Portage | 41 | 5,035(0.81%)#21 | 321,133(0.01%)#1,302 |
| 22. | Ferndale | 36 | 5,035(0.71%)#22 | 321,133(0.01%)#1,435 |
| 23. | Cutlerville | 32 | 5,035(0.64%)#23 | 321,133(0.01%)#1,542 |
| 24. | Detroit | 30 | 5,035(0.60%)#24 | 321,133(0.01%)#1,582 |
| 25. | Dowagiac | 30 | 5,035(0.60%)#25 | 321,133(0.01%)#1,605 |
| 26. | Bronson | 25 | 5,035(0.50%)#26 | 321,133(0.01%)#1,771 |
| 27. | Escanaba | 24 | 5,035(0.48%)#27 | 321,133(0.01%)#1,794 |
| 28. | Niles | 23 | 5,035(0.46%)#28 | 321,133(0.01%)#1,842 |
| 29. | Fraser | 22 | 5,035(0.44%)#29 | 321,133(0.01%)#1,883 |
| 30. | Otsego | 22 | 5,035(0.44%)#30 | 321,133(0.01%)#1,900 |
| 31. | Beechwood | 21 | 5,035(0.42%)#31 | 321,133(0.01%)#1,931 |
| 32. | Roseville | 20 | 5,035(0.40%)#32 | 321,133(0.01%)#1,944 |
| 33. | Farmington | 20 | 5,035(0.40%)#33 | 321,133(0.01%)#1,964 |
| 34. | East Grand Rapids | 20 | 5,035(0.40%)#34 | 321,133(0.01%)#1,966 |
| 35. | Kalamazoo | 19 | 5,035(0.38%)#35 | 321,133(0.01%)#1,988 |
| 36. | East Lansing | 18 | 5,035(0.36%)#36 | 321,133(0.01%)#2,030 |
| 37. | Rogers City | 17 | 5,035(0.34%)#37 | 321,133(0.01%)#2,105 |
| 38. | Livonia | 16 | 5,035(0.32%)#38 | 321,133(0.00%)#2,114 |
| 39. | Haslett | 16 | 5,035(0.32%)#39 | 321,133(0.00%)#2,138 |
| 40. | Pleasant Ridge | 16 | 5,035(0.32%)#40 | 321,133(0.00%)#2,161 |
| 41. | Mount Pleasant | 15 | 5,035(0.30%)#41 | 321,133(0.00%)#2,191 |
| 42. | Madison Heights | 14 | 5,035(0.28%)#42 | 321,133(0.00%)#2,239 |
| 43. | Okemos | 14 | 5,035(0.28%)#43 | 321,133(0.00%)#2,240 |
| 44. | Franklin | 14 | 5,035(0.28%)#44 | 321,133(0.00%)#2,277 |
| 45. | Farmington Hills | 13 | 5,035(0.26%)#45 | 321,133(0.00%)#2,284 |
| 46. | St Charles | 13 | 5,035(0.26%)#46 | 321,133(0.00%)#2,331 |
| 47. | Garden City | 12 | 5,035(0.24%)#47 | 321,133(0.00%)#2,350 |
| 48. | Mount Clemens | 12 | 5,035(0.24%)#48 | 321,133(0.00%)#2,361 |
| 49. | Gwinn | 12 | 5,035(0.24%)#49 | 321,133(0.00%)#2,399 |
| 50. | Romulus | 11 | 5,035(0.22%)#50 | 321,133(0.00%)#2,427 |
| 51. | St Clair Shores | 10 | 5,035(0.20%)#51 | 321,133(0.00%)#2,489 |
| 52. | Sylvan Lake | 10 | 5,035(0.20%)#52 | 321,133(0.00%)#2,551 |
| 53. | Battle Creek | 9 | 5,035(0.18%)#53 | 321,133(0.00%)#2,563 |
| 54. | Oak Park | 9 | 5,035(0.18%)#54 | 321,133(0.00%)#2,571 |
| 55. | Wyandotte | 9 | 5,035(0.18%)#55 | 321,133(0.00%)#2,579 |
| 56. | Jonesville | 6 | 5,035(0.12%)#56 | 321,133(0.00%)#2,861 |
| 57. | Muskegon | 5 | 5,035(0.10%)#57 | 321,133(0.00%)#2,898 |
| 58. | Sebewaing | 5 | 5,035(0.10%)#58 | 321,133(0.00%)#2,947 |
| 59. | Southgate | 4 | 5,035(0.08%)#59 | 321,133(0.00%)#2,979 |
| 60. | Lawton | 4 | 5,035(0.08%)#60 | 321,133(0.00%)#3,024 |
| 61. | Morrice | 4 | 5,035(0.08%)#61 | 321,133(0.00%)#3,027 |
| 62. | Bingham Farms | 4 | 5,035(0.08%)#62 | 321,133(0.00%)#3,028 |
| 63. | Mayville | 4 | 5,035(0.08%)#63 | 321,133(0.00%)#3,037 |
| 64. | Onaway | 3 | 5,035(0.06%)#64 | 321,133(0.00%)#3,123 |
| 65. | Calumet | 3 | 5,035(0.06%)#65 | 321,133(0.00%)#3,125 |
| 66. | Southfield | 2 | 5,035(0.04%)#66 | 321,133(0.00%)#3,146 |
| 67. | Watervliet | 2 | 5,035(0.04%)#67 | 321,133(0.00%)#3,180 |
| 68. | Parma | 2 | 5,035(0.04%)#68 | 321,133(0.00%)#3,207 |
| 69. | Lake Orion | 1 | 5,035(0.02%)#69 | 321,133(0.00%)#3,261 |
| 70. | Reading | 1 | 5,035(0.02%)#70 | 321,133(0.00%)#3,272 |
| 71. | Britton | 1 | 5,035(0.02%)#71 | 321,133(0.00%)#3,293 |
| 72. | Allen | 1 | 5,035(0.02%)#72 | 321,133(0.00%)#3,318 |
Common Questions
What are the Top 10 Cities with the Largest Pakistani Community in Michigan?
Top 10 Cities with the Largest Pakistani Community in Michigan are:
#1
274
#2
265
#3
191
#4
162
#5
156
#6
116
#7
115
#8
114
#9
87
#10
84
What city has the Largest Pakistani Community in Michigan?
Ann Arbor has the Largest Pakistani Community in Michigan with 274.
What is the Total Pakistani Population in the State of Michigan?
Total Pakistani Population in Michigan is 5,035.
What is the Total Pakistani Population in the United States?
Total Pakistani Population in the United States is 321,133.