St Charles, MI Map & Demographics
St Charles Map
St Charles Overview
$28,581
PER CAPITA INCOME
$71,375
AVG FAMILY INCOME
$51,875
AVG HOUSEHOLD INCOME
29.6%
WAGE / INCOME GAP [ % ]
70.4¢/ $1
WAGE / INCOME GAP [ $ ]
$5,863
FAMILY INCOME DEFICIT
0.48
INEQUALITY / GINI INDEX
2,020
TOTAL POPULATION
955
MALE POPULATION
1,065
FEMALE POPULATION
89.67
MALES / 100 FEMALES
111.52
FEMALES / 100 MALES
45.4
MEDIAN AGE
3.0
AVG FAMILY SIZE
2.4
AVG HOUSEHOLD SIZE
879
LABOR FORCE [ PEOPLE ]
55.1%
PERCENT IN LABOR FORCE
4.7%
UNEMPLOYMENT RATE
Income in St Charles
Income Overview in St Charles
Per Capita Income in St Charles is $28,581, while median incomes of families and households are $71,375 and $51,875 respectively.
| Characteristic | Number | Measure |
| Per Capita Income | 2,020 | $28,581 |
| Median Family Income | 584 | $71,375 |
| Mean Family Income | 584 | $85,676 |
| Median Household Income | 812 | $51,875 |
| Mean Household Income | 812 | $72,789 |
| Income Deficit | 584 | $5,863 |
| Wage / Income Gap (%) | 2,020 | 29.57% |
| Wage / Income Gap ($) | 2,020 | 70.43¢ per $1 |
| Gini / Inequality Index | 2,020 | 0.48 |
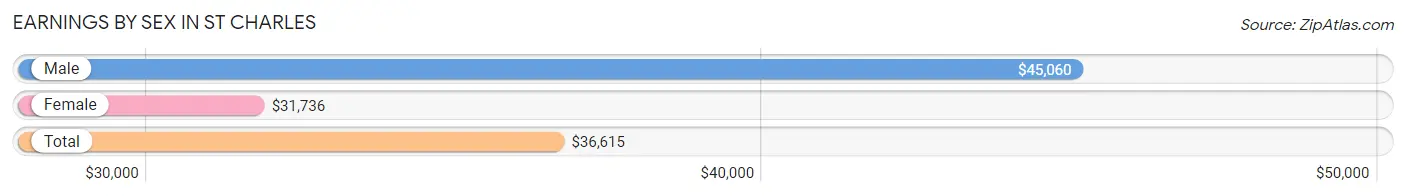
Earnings by Sex in St Charles
Average Earnings in St Charles are $36,615, $45,060 for men and $31,736 for women, a difference of 29.6%.
| Sex | Number | Average Earnings |
| Male | 439 (48.8%) | $45,060 |
| Female | 461 (51.2%) | $31,736 |
| Total | 900 (100.0%) | $36,615 |
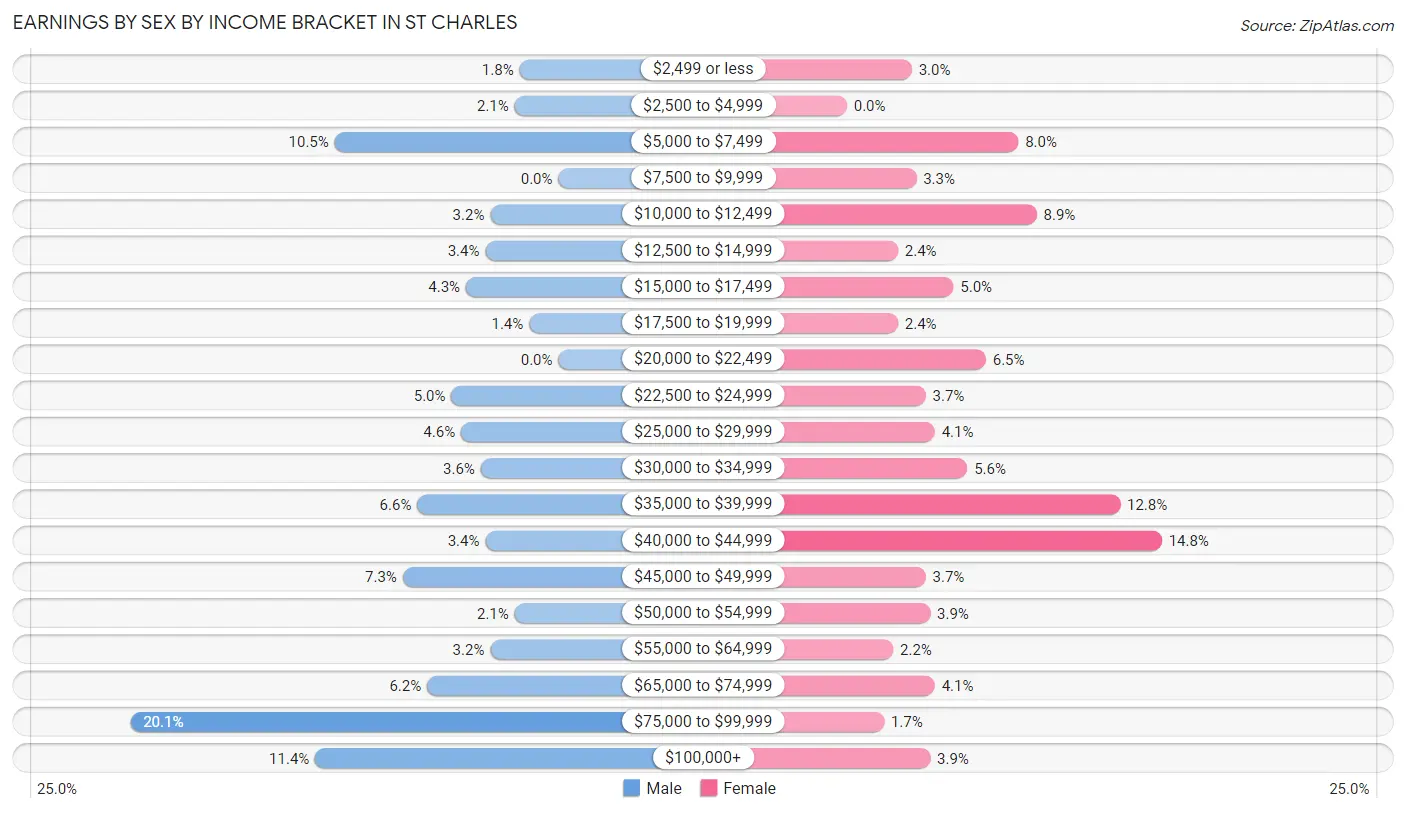
Earnings by Sex by Income Bracket in St Charles
The most common earnings brackets in St Charles are $75,000 to $99,999 for men (88 | 20.1%) and $40,000 to $44,999 for women (68 | 14.7%).
| Income | Male | Female |
| $2,499 or less | 8 (1.8%) | 14 (3.0%) |
| $2,500 to $4,999 | 9 (2.1%) | 0 (0.0%) |
| $5,000 to $7,499 | 46 (10.5%) | 37 (8.0%) |
| $7,500 to $9,999 | 0 (0.0%) | 15 (3.3%) |
| $10,000 to $12,499 | 14 (3.2%) | 41 (8.9%) |
| $12,500 to $14,999 | 15 (3.4%) | 11 (2.4%) |
| $15,000 to $17,499 | 19 (4.3%) | 23 (5.0%) |
| $17,500 to $19,999 | 6 (1.4%) | 11 (2.4%) |
| $20,000 to $22,499 | 0 (0.0%) | 30 (6.5%) |
| $22,500 to $24,999 | 22 (5.0%) | 17 (3.7%) |
| $25,000 to $29,999 | 20 (4.6%) | 19 (4.1%) |
| $30,000 to $34,999 | 16 (3.6%) | 26 (5.6%) |
| $35,000 to $39,999 | 29 (6.6%) | 59 (12.8%) |
| $40,000 to $44,999 | 15 (3.4%) | 68 (14.7%) |
| $45,000 to $49,999 | 32 (7.3%) | 17 (3.7%) |
| $50,000 to $54,999 | 9 (2.1%) | 18 (3.9%) |
| $55,000 to $64,999 | 14 (3.2%) | 10 (2.2%) |
| $65,000 to $74,999 | 27 (6.1%) | 19 (4.1%) |
| $75,000 to $99,999 | 88 (20.1%) | 8 (1.7%) |
| $100,000+ | 50 (11.4%) | 18 (3.9%) |
| Total | 439 (100.0%) | 461 (100.0%) |
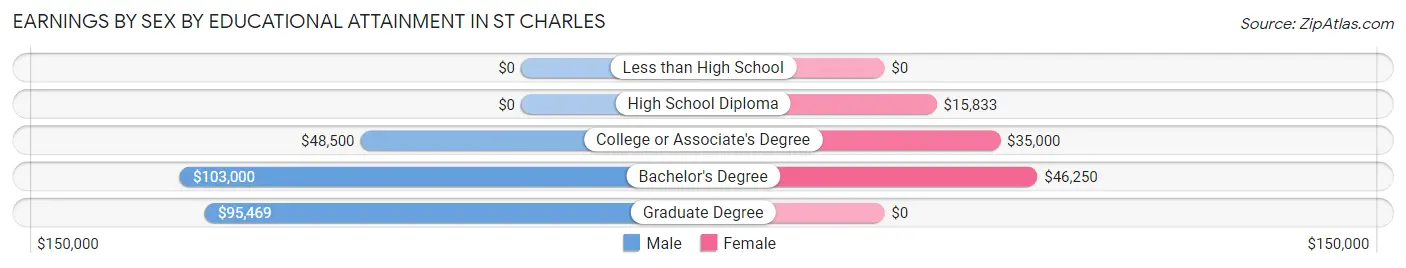
Earnings by Sex by Educational Attainment in St Charles
Average earnings in St Charles are $48,750 for men and $33,125 for women, a difference of 32.1%. Men with an educational attainment of bachelor's degree enjoy the highest average annual earnings of $103,000, while those with college or associate's degree education earn the least with $48,500. Women with an educational attainment of bachelor's degree earn the most with the average annual earnings of $46,250, while those with high school diploma education have the smallest earnings of $15,833.
| Educational Attainment | Male Income | Female Income |
| Less than High School | - | - |
| High School Diploma | - | - |
| College or Associate's Degree | $48,500 | $35,000 |
| Bachelor's Degree | $103,000 | $46,250 |
| Graduate Degree | $95,469 | $0 |
| Total | $48,750 | $33,125 |
Family Income in St Charles
Family Income Brackets in St Charles
According to the St Charles family income data, there are 136 families falling into the $100,000 to $149,999 income range, which is the most common income bracket and makes up 23.3% of all families. Conversely, the less than $10,000 income bracket is the least frequent group with only 2 families (0.3%) belonging to this category.
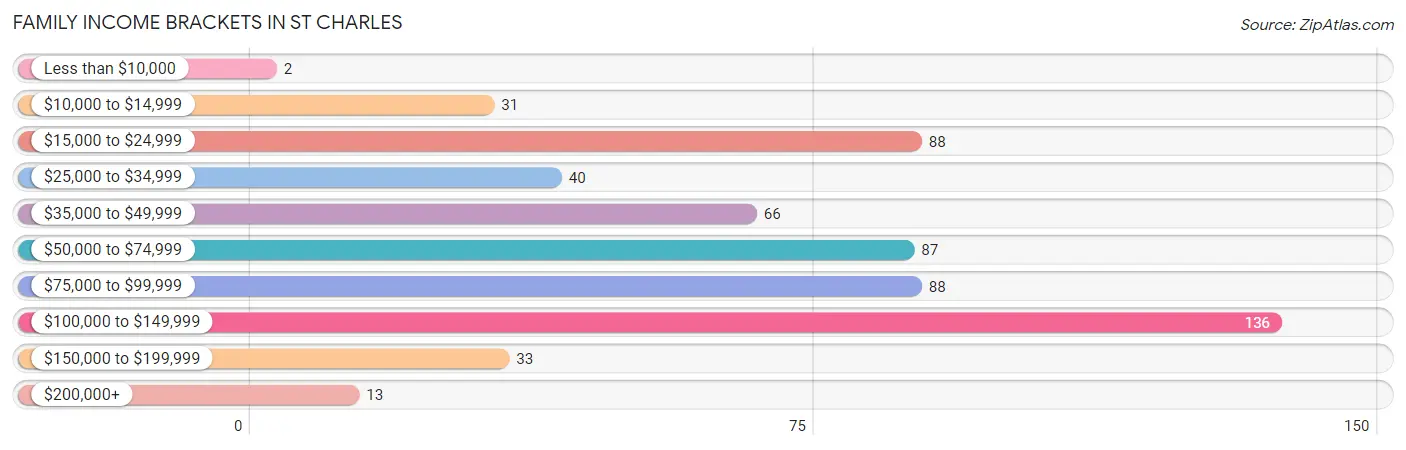
| Income Bracket | # Families | % Families |
| Less than $10,000 | 2 | 0.3% |
| $10,000 to $14,999 | 31 | 5.3% |
| $15,000 to $24,999 | 88 | 15.1% |
| $25,000 to $34,999 | 40 | 6.8% |
| $35,000 to $49,999 | 66 | 11.3% |
| $50,000 to $74,999 | 87 | 14.9% |
| $75,000 to $99,999 | 88 | 15.1% |
| $100,000 to $149,999 | 136 | 23.3% |
| $150,000 to $199,999 | 33 | 5.7% |
| $200,000+ | 13 | 2.2% |
Family Income by Famaliy Size in St Charles
4-person families (123 | 21.1%) account for the highest median family income in St Charles with $135,409 per family, while 4-person families (123 | 21.1%) have the highest median income of $33,852 per family member.
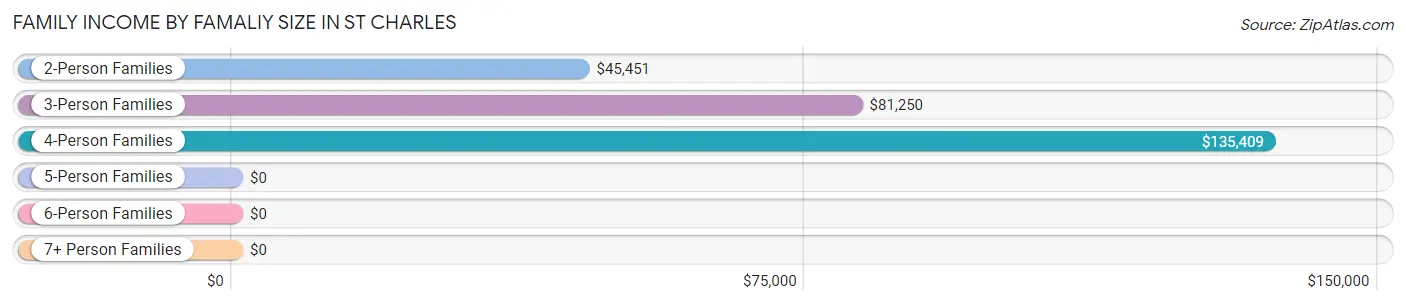
| Income Bracket | # Families | Median Income |
| 2-Person Families | 291 (49.8%) | $45,451 |
| 3-Person Families | 113 (19.4%) | $81,250 |
| 4-Person Families | 123 (21.1%) | $135,409 |
| 5-Person Families | 33 (5.7%) | $0 |
| 6-Person Families | 4 (0.7%) | $0 |
| 7+ Person Families | 20 (3.4%) | $0 |
| Total | 584 (100.0%) | $71,375 |
Family Income by Number of Earners in St Charles
The median family income in St Charles is $71,375, with families comprising 3+ earners (40) having the highest median family income of $121,250, while families with 1 earner (205) have the lowest median family income of $33,906, accounting for 6.9% and 35.1% of families, respectively.
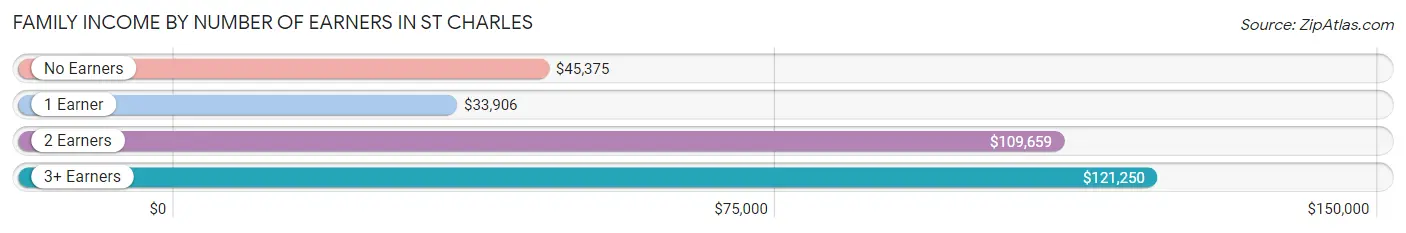
| Number of Earners | # Families | Median Income |
| No Earners | 120 (20.5%) | $45,375 |
| 1 Earner | 205 (35.1%) | $33,906 |
| 2 Earners | 219 (37.5%) | $109,659 |
| 3+ Earners | 40 (6.9%) | $121,250 |
| Total | 584 (100.0%) | $71,375 |
Household Income in St Charles
Household Income Brackets in St Charles
With 154 households falling in the category, the $100,000 to $149,999 income range is the most frequent in St Charles, accounting for 19.0% of all households. In contrast, only 13 households (1.6%) fall into the $200,000+ income bracket, making it the least populous group.
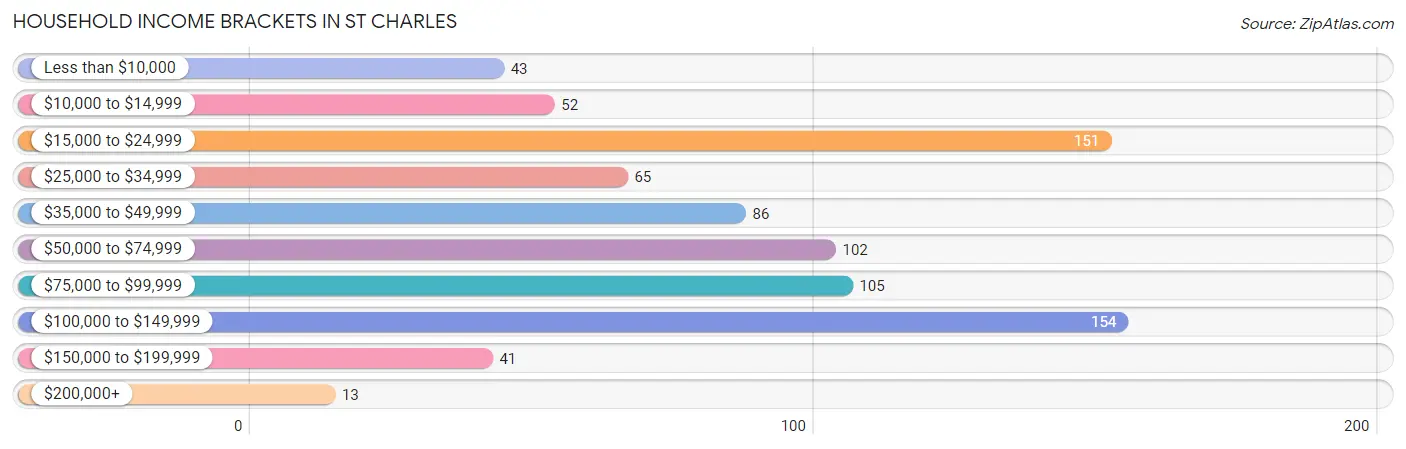
| Income Bracket | # Households | % Households |
| Less than $10,000 | 43 | 5.3% |
| $10,000 to $14,999 | 52 | 6.4% |
| $15,000 to $24,999 | 151 | 18.6% |
| $25,000 to $34,999 | 65 | 8.0% |
| $35,000 to $49,999 | 86 | 10.6% |
| $50,000 to $74,999 | 102 | 12.6% |
| $75,000 to $99,999 | 105 | 12.9% |
| $100,000 to $149,999 | 154 | 19.0% |
| $150,000 to $199,999 | 41 | 5.0% |
| $200,000+ | 13 | 1.6% |
Household Income by Householder Age in St Charles
The median household income in St Charles is $51,875, with the highest median household income of $77,857 found in the 25 to 44 years age bracket for the primary householder. A total of 160 households (19.7%) fall into this category. Meanwhile, the 15 to 24 years age bracket for the primary householder has the lowest median household income of $0, with 10 households (1.2%) in this group.
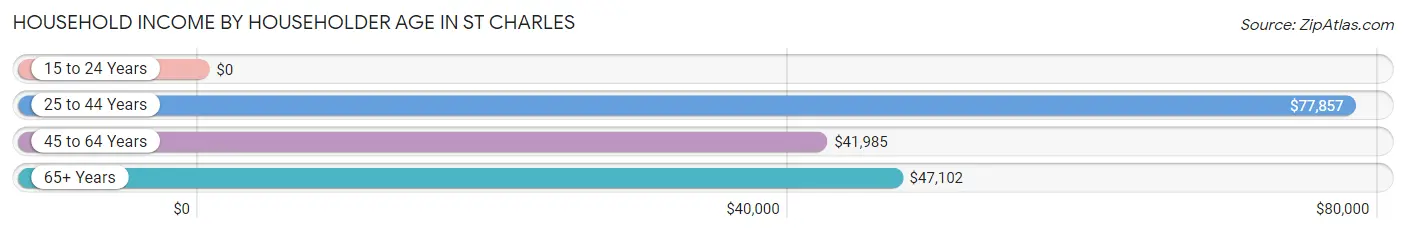
| Income Bracket | # Households | Median Income |
| 15 to 24 Years | 10 (1.2%) | $0 |
| 25 to 44 Years | 160 (19.7%) | $77,857 |
| 45 to 64 Years | 401 (49.4%) | $41,985 |
| 65+ Years | 241 (29.7%) | $47,102 |
| Total | 812 (100.0%) | $51,875 |
Poverty in St Charles
Income Below Poverty by Sex and Age in St Charles
With 19.0% poverty level for males and 17.2% for females among the residents of St Charles, 15 year old males and 45 to 54 year old females are the most vulnerable to poverty, with 11 males (73.3%) and 62 females (30.7%) in their respective age groups living below the poverty level.
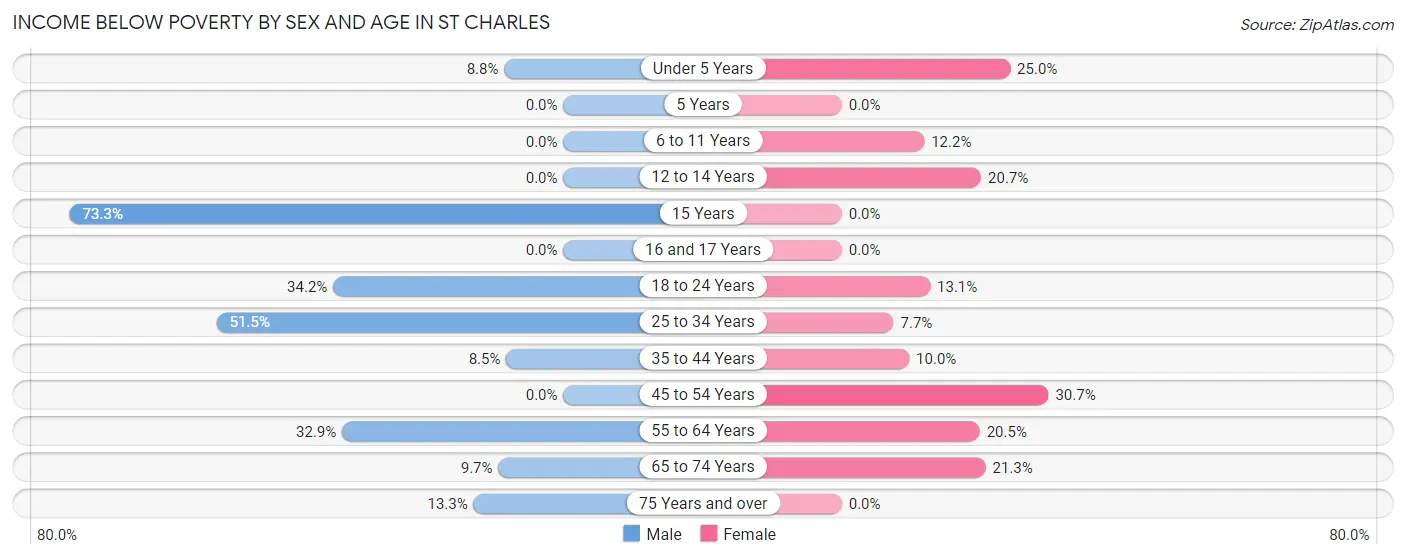
| Age Bracket | Male | Female |
| Under 5 Years | 5 (8.8%) | 10 (25.0%) |
| 5 Years | 0 (0.0%) | 0 (0.0%) |
| 6 to 11 Years | 0 (0.0%) | 6 (12.2%) |
| 12 to 14 Years | 0 (0.0%) | 12 (20.7%) |
| 15 Years | 11 (73.3%) | 0 (0.0%) |
| 16 and 17 Years | 0 (0.0%) | 0 (0.0%) |
| 18 to 24 Years | 27 (34.2%) | 8 (13.1%) |
| 25 to 34 Years | 69 (51.5%) | 10 (7.7%) |
| 35 to 44 Years | 5 (8.5%) | 6 (10.0%) |
| 45 to 54 Years | 0 (0.0%) | 62 (30.7%) |
| 55 to 64 Years | 45 (32.9%) | 34 (20.5%) |
| 65 to 74 Years | 11 (9.7%) | 35 (21.3%) |
| 75 Years and over | 4 (13.3%) | 0 (0.0%) |
| Total | 177 (19.0%) | 183 (17.2%) |
Income Above Poverty by Sex and Age in St Charles
According to the poverty statistics in St Charles, males aged 5 years and females aged 5 years are the age groups that are most secure financially, with 100.0% of males and 100.0% of females in these age groups living above the poverty line.
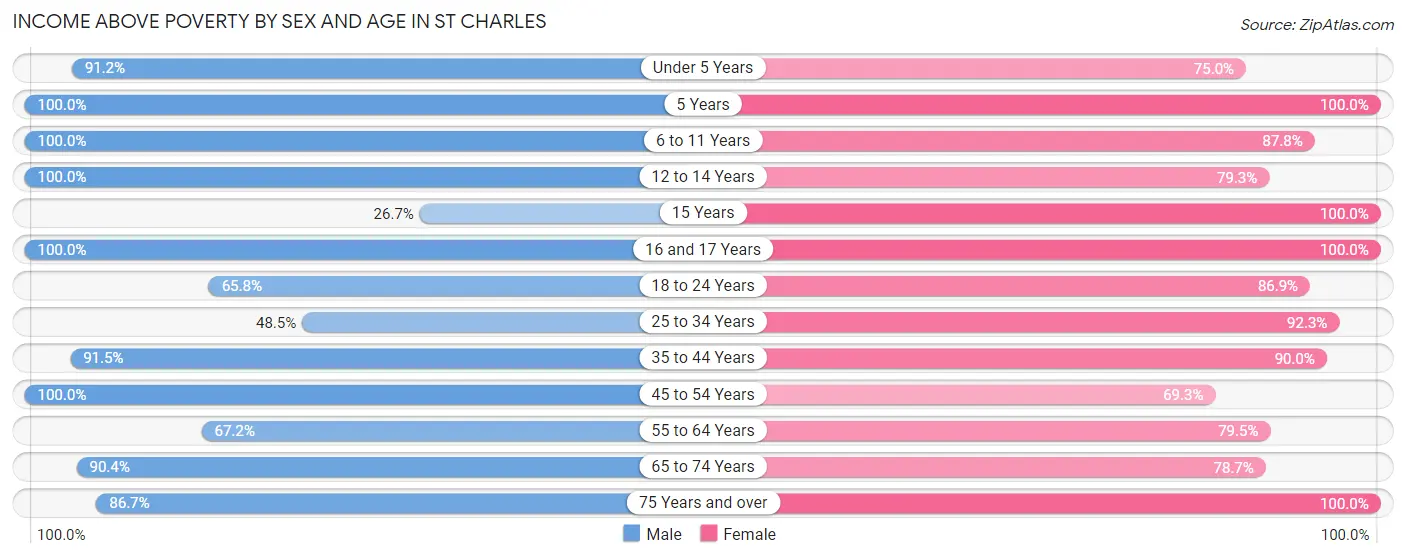
| Age Bracket | Male | Female |
| Under 5 Years | 52 (91.2%) | 30 (75.0%) |
| 5 Years | 21 (100.0%) | 15 (100.0%) |
| 6 to 11 Years | 71 (100.0%) | 43 (87.8%) |
| 12 to 14 Years | 44 (100.0%) | 46 (79.3%) |
| 15 Years | 4 (26.7%) | 54 (100.0%) |
| 16 and 17 Years | 36 (100.0%) | 4 (100.0%) |
| 18 to 24 Years | 52 (65.8%) | 53 (86.9%) |
| 25 to 34 Years | 65 (48.5%) | 120 (92.3%) |
| 35 to 44 Years | 54 (91.5%) | 54 (90.0%) |
| 45 to 54 Years | 137 (100.0%) | 140 (69.3%) |
| 55 to 64 Years | 92 (67.1%) | 132 (79.5%) |
| 65 to 74 Years | 103 (90.3%) | 129 (78.7%) |
| 75 Years and over | 26 (86.7%) | 62 (100.0%) |
| Total | 757 (81.0%) | 882 (82.8%) |
Income Below Poverty Among Married-Couple Families in St Charles
The poverty statistics for married-couple families in St Charles show that 4.9% or 20 of the total 411 families live below the poverty line. Families with 1 or 2 children have the highest poverty rate of 8.9%, comprising of 14 families. On the other hand, families with 3 or 4 children have the lowest poverty rate of 0.0%, which includes 0 families.
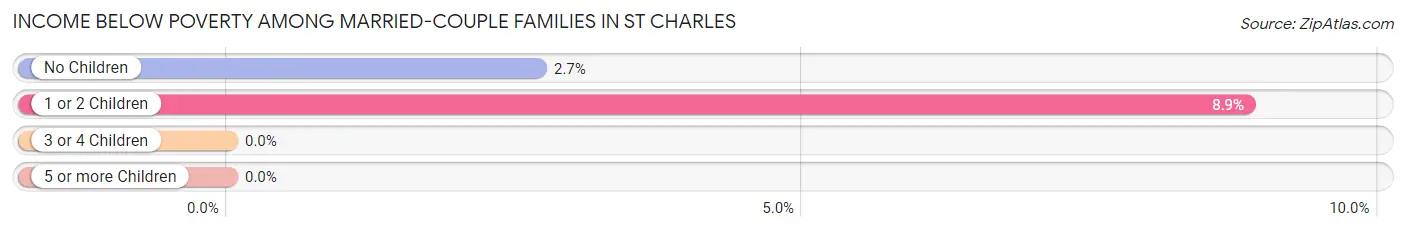
| Children | Above Poverty | Below Poverty |
| No Children | 217 (97.3%) | 6 (2.7%) |
| 1 or 2 Children | 144 (91.1%) | 14 (8.9%) |
| 3 or 4 Children | 10 (100.0%) | 0 (0.0%) |
| 5 or more Children | 20 (100.0%) | 0 (0.0%) |
| Total | 391 (95.1%) | 20 (4.9%) |
Income Below Poverty Among Single-Parent Households in St Charles
According to the poverty data in St Charles, 66.7% or 22 single-father households and 40.7% or 57 single-mother households are living below the poverty line. Among single-father households, those with 1 or 2 children have the highest poverty rate, with 11 households (100.0%) experiencing poverty. Likewise, among single-mother households, those with no children have the highest poverty rate, with 47 households (46.1%) falling below the poverty line.
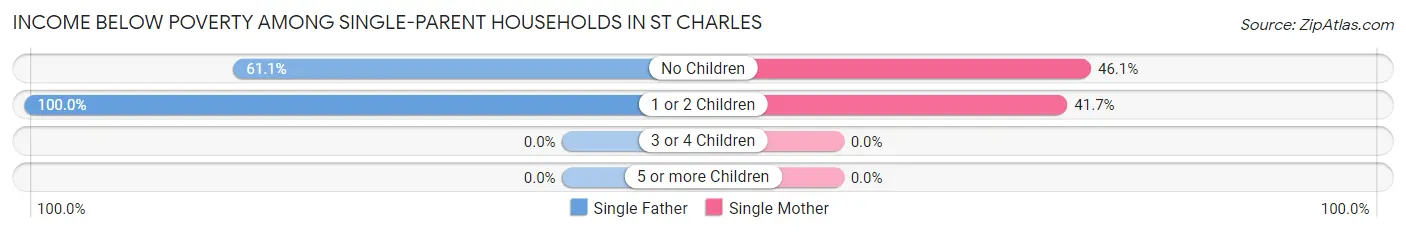
| Children | Single Father | Single Mother |
| No Children | 11 (61.1%) | 47 (46.1%) |
| 1 or 2 Children | 11 (100.0%) | 10 (41.7%) |
| 3 or 4 Children | 0 (0.0%) | 0 (0.0%) |
| 5 or more Children | 0 (0.0%) | 0 (0.0%) |
| Total | 22 (66.7%) | 57 (40.7%) |
Income Below Poverty Among Married-Couple vs Single-Parent Households in St Charles
The poverty data for St Charles shows that 20 of the married-couple family households (4.9%) and 79 of the single-parent households (45.7%) are living below the poverty level. Within the married-couple family households, those with 1 or 2 children have the highest poverty rate, with 14 households (8.9%) falling below the poverty line. Among the single-parent households, those with 1 or 2 children have the highest poverty rate, with 21 household (60.0%) living below poverty.
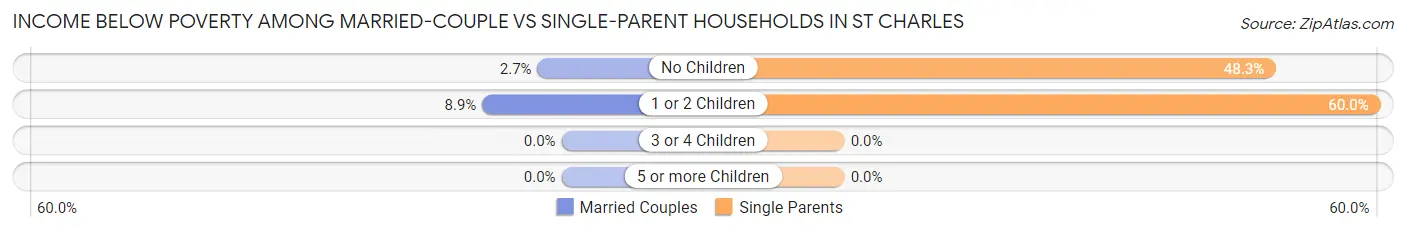
| Children | Married-Couple Families | Single-Parent Households |
| No Children | 6 (2.7%) | 58 (48.3%) |
| 1 or 2 Children | 14 (8.9%) | 21 (60.0%) |
| 3 or 4 Children | 0 (0.0%) | 0 (0.0%) |
| 5 or more Children | 0 (0.0%) | 0 (0.0%) |
| Total | 20 (4.9%) | 79 (45.7%) |
Race in St Charles
The most populous races in St Charles are White / Caucasian (1,863 | 92.2%), Hispanic or Latino (256 | 12.7%), and Two or more Races (70 | 3.5%).
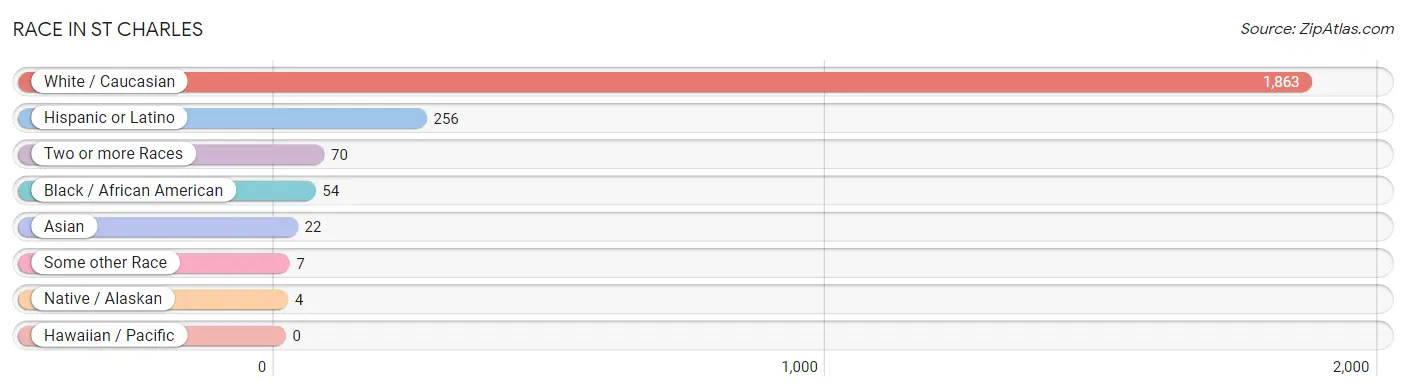
| Race | # Population | % Population |
| Asian | 22 | 1.1% |
| Black / African American | 54 | 2.7% |
| Hawaiian / Pacific | 0 | 0.0% |
| Hispanic or Latino | 256 | 12.7% |
| Native / Alaskan | 4 | 0.2% |
| White / Caucasian | 1,863 | 92.2% |
| Two or more Races | 70 | 3.5% |
| Some other Race | 7 | 0.4% |
| Total | 2,020 | 100.0% |
Ancestry in St Charles
The most populous ancestries reported in St Charles are German (492 | 24.4%), Irish (265 | 13.1%), Polish (236 | 11.7%), English (211 | 10.4%), and Mexican (168 | 8.3%), together accounting for 67.9% of all St Charles residents.
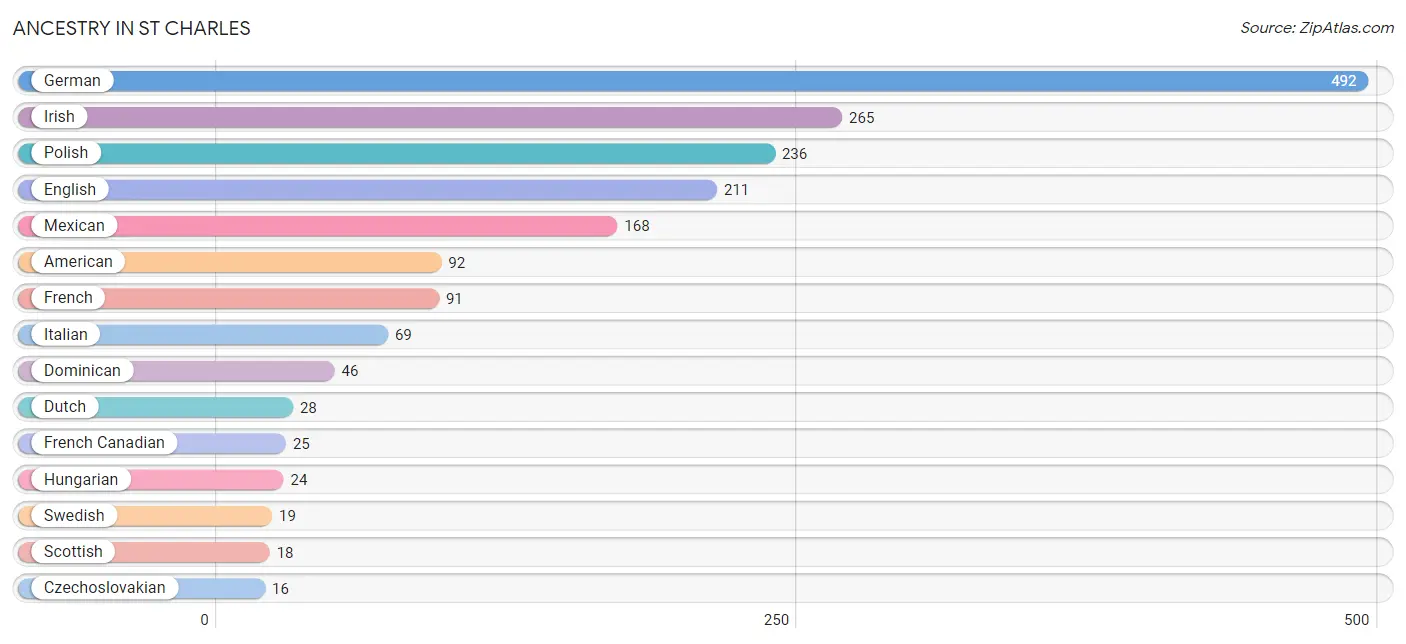
| Ancestry | # Population | % Population |
| American | 92 | 4.5% |
| Belgian | 4 | 0.2% |
| British | 12 | 0.6% |
| Czech | 8 | 0.4% |
| Czechoslovakian | 16 | 0.8% |
| Danish | 16 | 0.8% |
| Dominican | 46 | 2.3% |
| Dutch | 28 | 1.4% |
| English | 211 | 10.4% |
| European | 13 | 0.6% |
| Finnish | 5 | 0.3% |
| French | 91 | 4.5% |
| French Canadian | 25 | 1.2% |
| German | 492 | 24.4% |
| Greek | 4 | 0.2% |
| Hungarian | 24 | 1.2% |
| Irish | 265 | 13.1% |
| Italian | 69 | 3.4% |
| Korean | 9 | 0.4% |
| Mexican | 168 | 8.3% |
| Norwegian | 16 | 0.8% |
| Pakistani | 13 | 0.6% |
| Polish | 236 | 11.7% |
| Potawatomi | 4 | 0.2% |
| Russian | 10 | 0.5% |
| Scandinavian | 4 | 0.2% |
| Scotch-Irish | 4 | 0.2% |
| Scottish | 18 | 0.9% |
| Slovak | 6 | 0.3% |
| Subsaharan African | 8 | 0.4% |
| Swedish | 19 | 0.9% | View All 31 Rows |
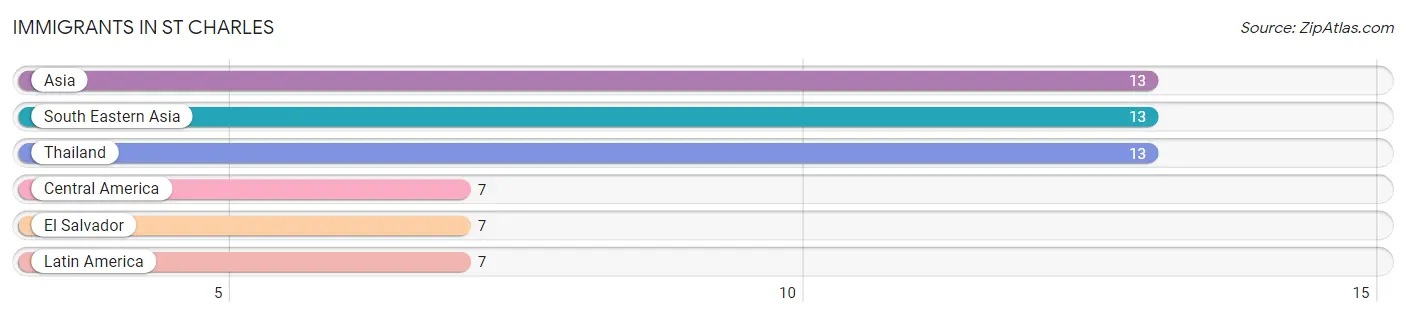
Immigrants in St Charles
The most numerous immigrant groups reported in St Charles came from Asia (13 | 0.6%), South Eastern Asia (13 | 0.6%), Thailand (13 | 0.6%), Central America (7 | 0.4%), and El Salvador (7 | 0.4%), together accounting for 2.6% of all St Charles residents.
| Immigration Origin | # Population | % Population |
| Asia | 13 | 0.6% |
| Central America | 7 | 0.4% |
| El Salvador | 7 | 0.4% |
| Latin America | 7 | 0.4% |
| South Eastern Asia | 13 | 0.6% |
| Thailand | 13 | 0.6% | View All 6 Rows |
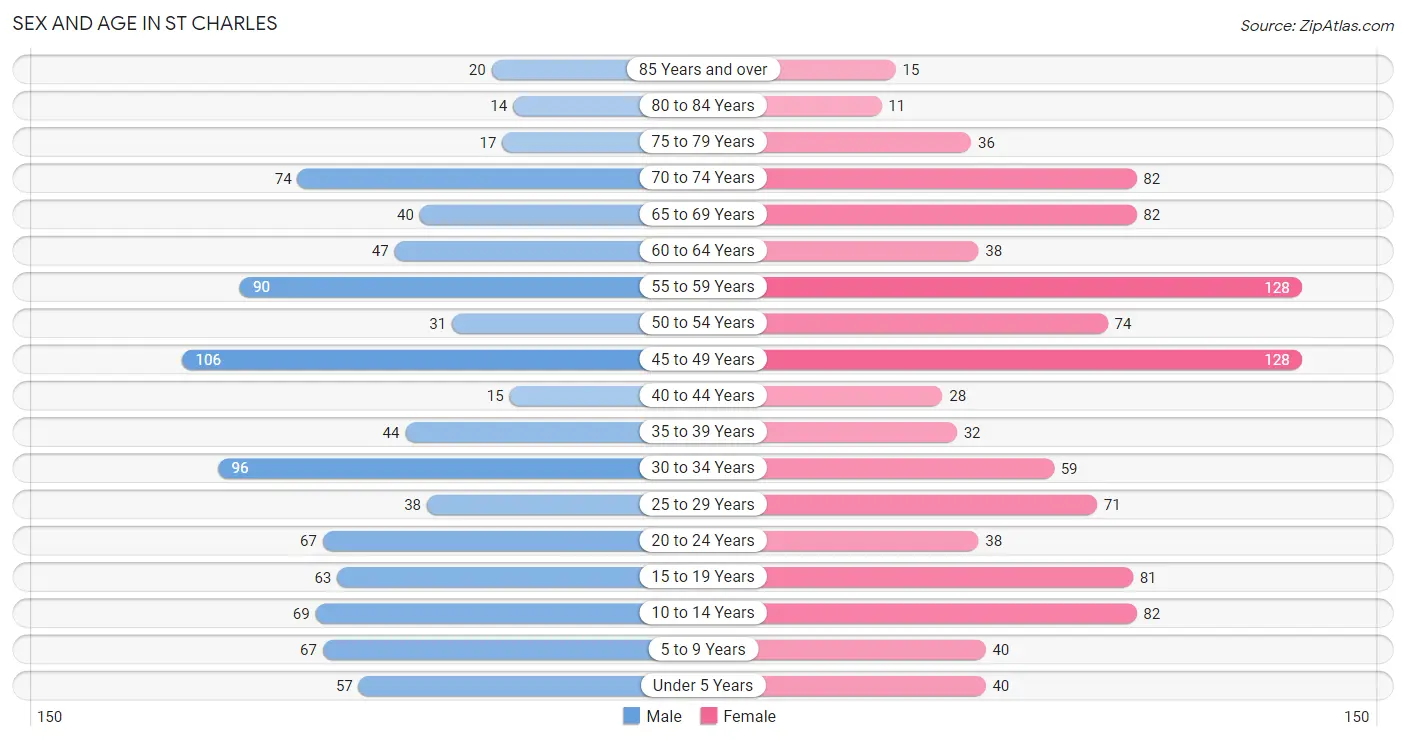
Sex and Age in St Charles
Sex and Age in St Charles
The most populous age groups in St Charles are 45 to 49 Years (106 | 11.1%) for men and 45 to 49 Years (128 | 12.0%) for women.
| Age Bracket | Male | Female |
| Under 5 Years | 57 (6.0%) | 40 (3.8%) |
| 5 to 9 Years | 67 (7.0%) | 40 (3.8%) |
| 10 to 14 Years | 69 (7.2%) | 82 (7.7%) |
| 15 to 19 Years | 63 (6.6%) | 81 (7.6%) |
| 20 to 24 Years | 67 (7.0%) | 38 (3.6%) |
| 25 to 29 Years | 38 (4.0%) | 71 (6.7%) |
| 30 to 34 Years | 96 (10.1%) | 59 (5.5%) |
| 35 to 39 Years | 44 (4.6%) | 32 (3.0%) |
| 40 to 44 Years | 15 (1.6%) | 28 (2.6%) |
| 45 to 49 Years | 106 (11.1%) | 128 (12.0%) |
| 50 to 54 Years | 31 (3.3%) | 74 (7.0%) |
| 55 to 59 Years | 90 (9.4%) | 128 (12.0%) |
| 60 to 64 Years | 47 (4.9%) | 38 (3.6%) |
| 65 to 69 Years | 40 (4.2%) | 82 (7.7%) |
| 70 to 74 Years | 74 (7.7%) | 82 (7.7%) |
| 75 to 79 Years | 17 (1.8%) | 36 (3.4%) |
| 80 to 84 Years | 14 (1.5%) | 11 (1.0%) |
| 85 Years and over | 20 (2.1%) | 15 (1.4%) |
| Total | 955 (100.0%) | 1,065 (100.0%) |
Families and Households in St Charles
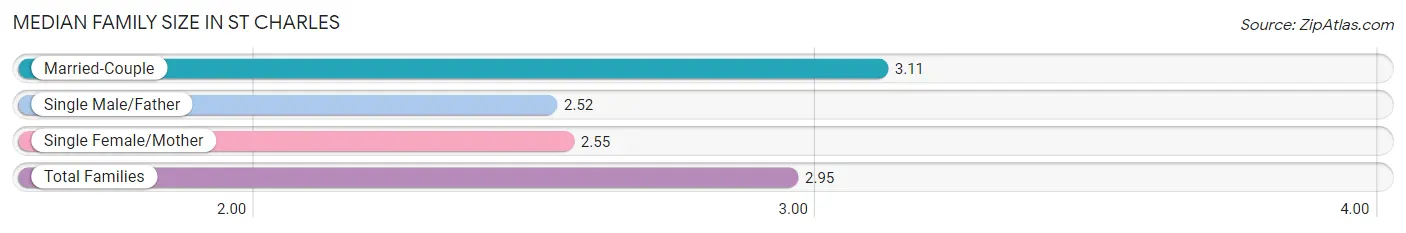
Median Family Size in St Charles
The median family size in St Charles is 2.95 persons per family, with married-couple families (411 | 70.4%) accounting for the largest median family size of 3.11 persons per family. On the other hand, single male/father families (33 | 5.7%) represent the smallest median family size with 2.52 persons per family.
| Family Type | # Families | Family Size |
| Married-Couple | 411 (70.4%) | 3.11 |
| Single Male/Father | 33 (5.7%) | 2.52 |
| Single Female/Mother | 140 (24.0%) | 2.55 |
| Total Families | 584 (100.0%) | 2.95 |
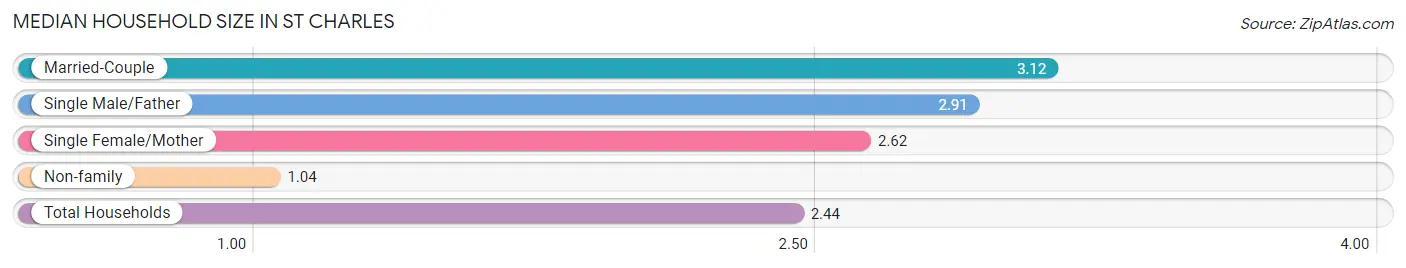
Median Household Size in St Charles
The median household size in St Charles is 2.44 persons per household, with married-couple households (411 | 50.6%) accounting for the largest median household size of 3.12 persons per household. non-family households (228 | 28.1%) represent the smallest median household size with 1.04 persons per household.
| Household Type | # Households | Household Size |
| Married-Couple | 411 (50.6%) | 3.12 |
| Single Male/Father | 33 (4.1%) | 2.91 |
| Single Female/Mother | 140 (17.2%) | 2.62 |
| Non-family | 228 (28.1%) | 1.04 |
| Total Households | 812 (100.0%) | 2.44 |
Household Size by Marriage Status in St Charles
Out of a total of 812 households in St Charles, 584 (71.9%) are family households, while 228 (28.1%) are nonfamily households. The most numerous type of family households are 2-person households, comprising 274, and the most common type of nonfamily households are 1-person households, comprising 220.
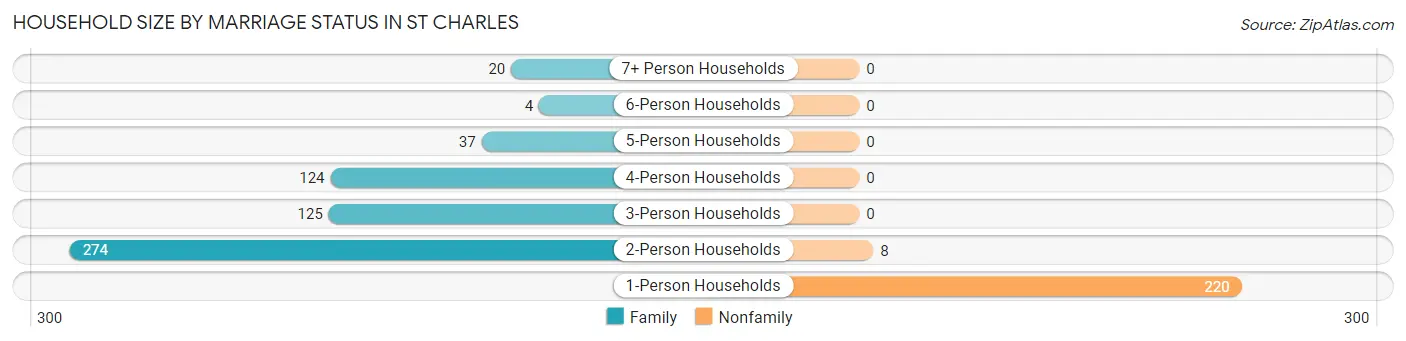
| Household Size | Family Households | Nonfamily Households |
| 1-Person Households | - | 220 (27.1%) |
| 2-Person Households | 274 (33.7%) | 8 (1.0%) |
| 3-Person Households | 125 (15.4%) | 0 (0.0%) |
| 4-Person Households | 124 (15.3%) | 0 (0.0%) |
| 5-Person Households | 37 (4.6%) | 0 (0.0%) |
| 6-Person Households | 4 (0.5%) | 0 (0.0%) |
| 7+ Person Households | 20 (2.5%) | 0 (0.0%) |
| Total | 584 (71.9%) | 228 (28.1%) |
Female Fertility in St Charles
Fertility by Age in St Charles
Average fertility rate in St Charles is 34.0 births per 1,000 women. Women in the age bracket of 20 to 34 years have the highest fertility rate with 89.0 births per 1,000 women. Women in the age bracket of 20 to 34 years acount for 100.0% of all women with births.
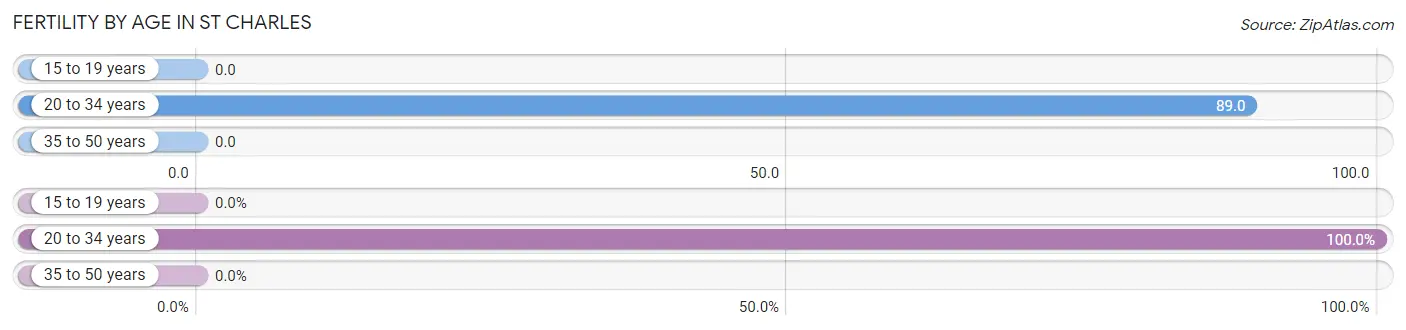
| Age Bracket | Women with Births | Births / 1,000 Women |
| 15 to 19 years | 0 (0.0%) | 0.0 |
| 20 to 34 years | 15 (100.0%) | 89.0 |
| 35 to 50 years | 0 (0.0%) | 0.0 |
| Total | 15 (100.0%) | 34.0 |
Fertility by Age by Marriage Status in St Charles
73.3% of women with births (15) in St Charles are married. The highest percentage of unmarried women with births falls into 20 to 34 years age bracket with 26.7% of them unmarried at the time of birth, while the lowest percentage of unmarried women with births belong to 20 to 34 years age bracket with 26.7% of them unmarried.
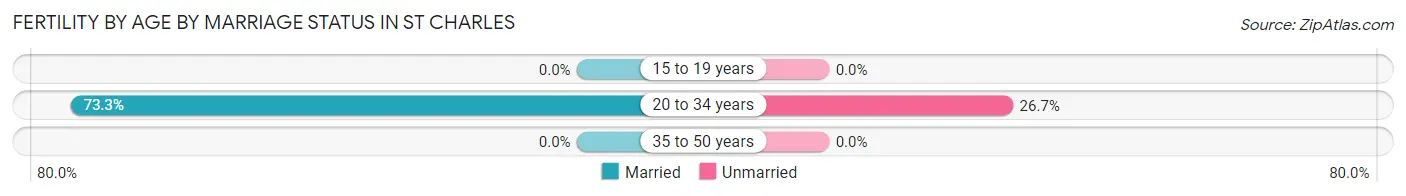
| Age Bracket | Married | Unmarried |
| 15 to 19 years | 0 (0.0%) | 0 (0.0%) |
| 20 to 34 years | 11 (73.3%) | 4 (26.7%) |
| 35 to 50 years | 0 (0.0%) | 0 (0.0%) |
| Total | 11 (73.3%) | 4 (26.7%) |
Fertility by Education in St Charles
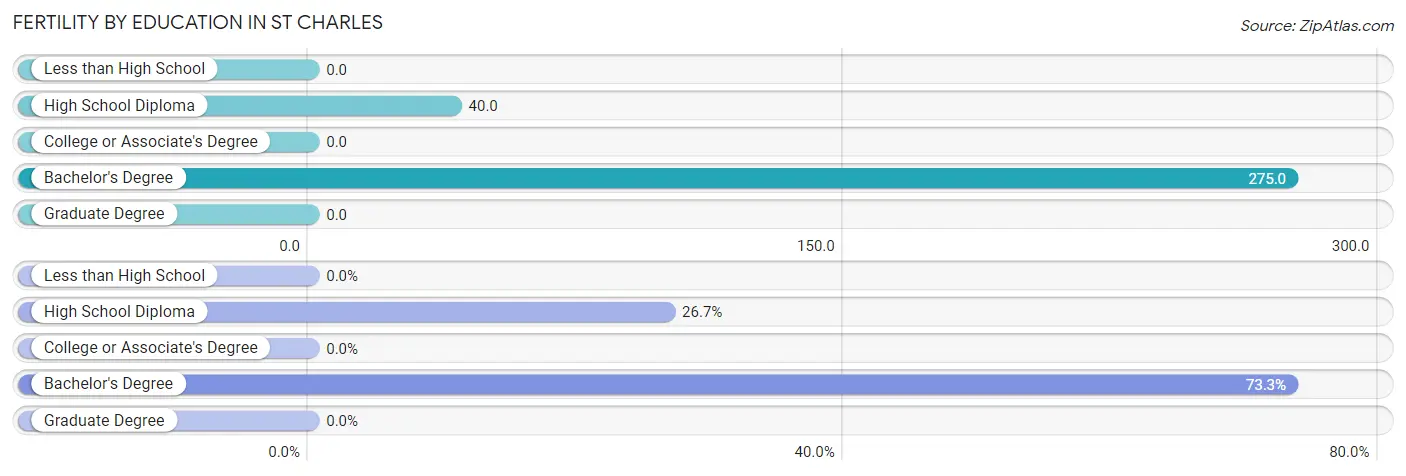
| Educational Attainment | Women with Births | Births / 1,000 Women |
| Less than High School | 0 (0.0%) | 0.0 |
| High School Diploma | 4 (26.7%) | 40.0 |
| College or Associate's Degree | 0 (0.0%) | 0.0 |
| Bachelor's Degree | 11 (73.3%) | 275.0 |
| Graduate Degree | 0 (0.0%) | 0.0 |
| Total | 15 (100.0%) | 34.0 |
Fertility by Education by Marriage Status in St Charles
26.7% of women with births in St Charles are unmarried. Women with the educational attainment of bachelor's degree are most likely to be married with 100.0% of them married at childbirth, while women with the educational attainment of high school diploma are least likely to be married with 100.0% of them unmarried at childbirth.
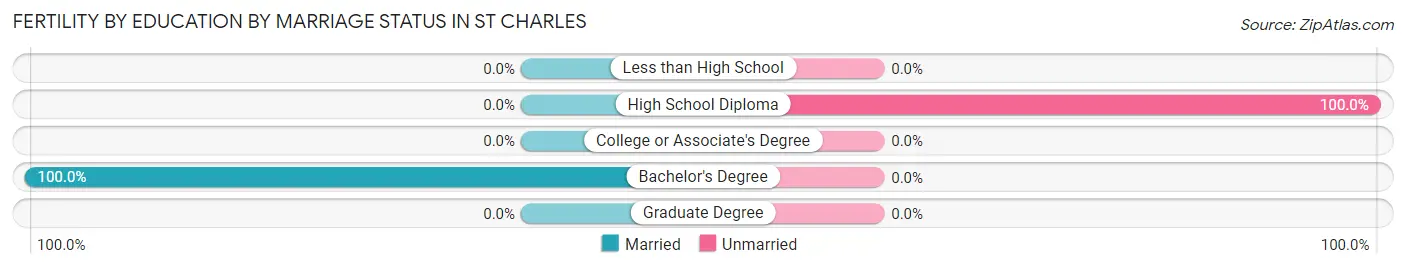
| Educational Attainment | Married | Unmarried |
| Less than High School | 0 (0.0%) | 0 (0.0%) |
| High School Diploma | 0 (0.0%) | 4 (100.0%) |
| College or Associate's Degree | 0 (0.0%) | 0 (0.0%) |
| Bachelor's Degree | 11 (100.0%) | 0 (0.0%) |
| Graduate Degree | 0 (0.0%) | 0 (0.0%) |
| Total | 11 (73.3%) | 4 (26.7%) |
Employment Characteristics in St Charles
Employment by Class of Employer in St Charles
Among the 816 employed individuals in St Charles, private company employees (558 | 68.4%), not-for-profit organizations (104 | 12.8%), and state government employees (80 | 9.8%) make up the most common classes of employment.
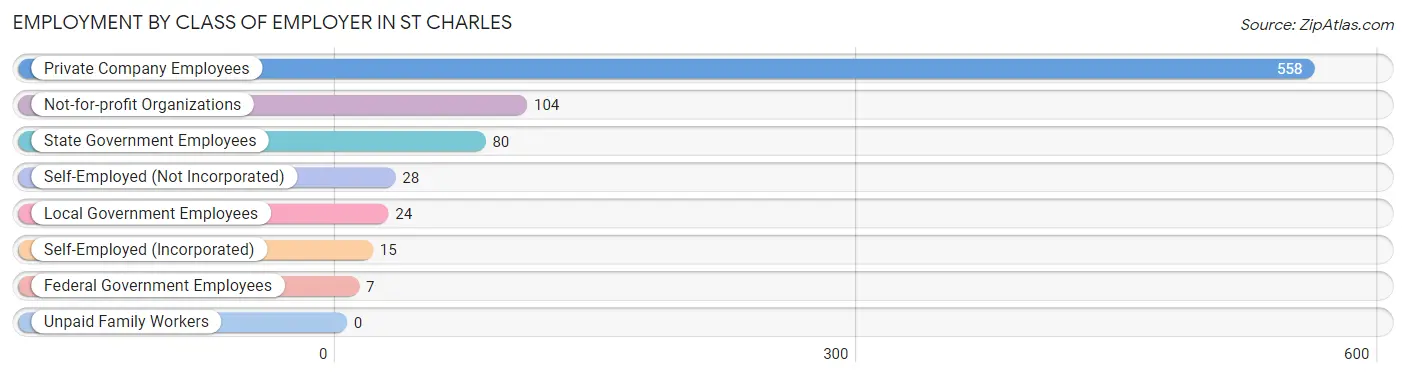
| Employer Class | # Employees | % Employees |
| Private Company Employees | 558 | 68.4% |
| Self-Employed (Incorporated) | 15 | 1.8% |
| Self-Employed (Not Incorporated) | 28 | 3.4% |
| Not-for-profit Organizations | 104 | 12.8% |
| Local Government Employees | 24 | 2.9% |
| State Government Employees | 80 | 9.8% |
| Federal Government Employees | 7 | 0.9% |
| Unpaid Family Workers | 0 | 0.0% |
| Total | 816 | 100.0% |
Employment Status by Age in St Charles
According to the labor force statistics for St Charles, out of the total population over 16 years of age (1,596), 55.1% or 879 individuals are in the labor force, with 4.7% or 41 of them unemployed. The age group with the highest labor force participation rate is 35 to 44 years, with 89.9% or 107 individuals in the labor force. Within the labor force, the 25 to 29 years age range has the highest percentage of unemployed individuals, with 24.1% or 19 of them being unemployed.
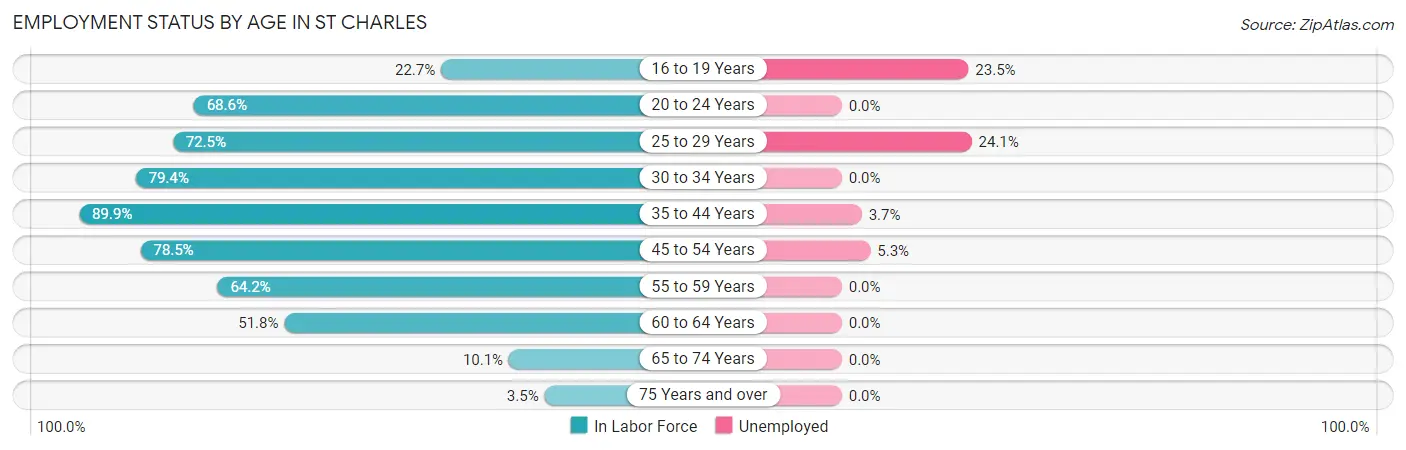
| Age Bracket | In Labor Force | Unemployed |
| 16 to 19 Years | 17 (22.7%) | 4 (23.5%) |
| 20 to 24 Years | 72 (68.6%) | 0 (0.0%) |
| 25 to 29 Years | 79 (72.5%) | 19 (24.1%) |
| 30 to 34 Years | 123 (79.4%) | 0 (0.0%) |
| 35 to 44 Years | 107 (89.9%) | 4 (3.7%) |
| 45 to 54 Years | 266 (78.5%) | 14 (5.3%) |
| 55 to 59 Years | 140 (64.2%) | 0 (0.0%) |
| 60 to 64 Years | 44 (51.8%) | 0 (0.0%) |
| 65 to 74 Years | 28 (10.1%) | 0 (0.0%) |
| 75 Years and over | 4 (3.5%) | 0 (0.0%) |
| Total | 879 (55.1%) | 41 (4.7%) |
Employment Status by Educational Attainment in St Charles
According to labor force statistics for St Charles, 74.0% of individuals (758) out of the total population between 25 and 64 years of age (1,025) are in the labor force, with 4.9% or 37 of them being unemployed. The group with the highest labor force participation rate are those with the educational attainment of bachelor's degree or higher, with 90.6% or 163 individuals in the labor force. Within the labor force, individuals with college / associate degree education have the highest percentage of unemployment, with 8.4% or 32 of them being unemployed.
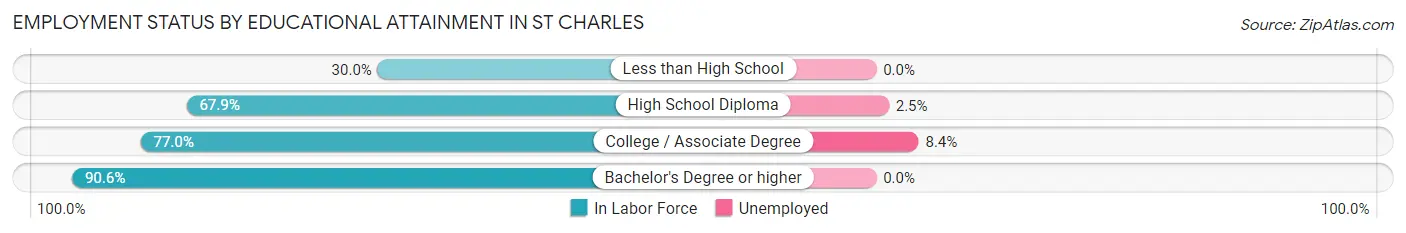
| Educational Attainment | In Labor Force | Unemployed |
| Less than High School | 18 (30.0%) | 0 (0.0%) |
| High School Diploma | 197 (67.9%) | 7 (2.5%) |
| College / Associate Degree | 381 (77.0%) | 42 (8.4%) |
| Bachelor's Degree or higher | 163 (90.6%) | 0 (0.0%) |
| Total | 758 (74.0%) | 50 (4.9%) |
Employment Occupations by Sex in St Charles
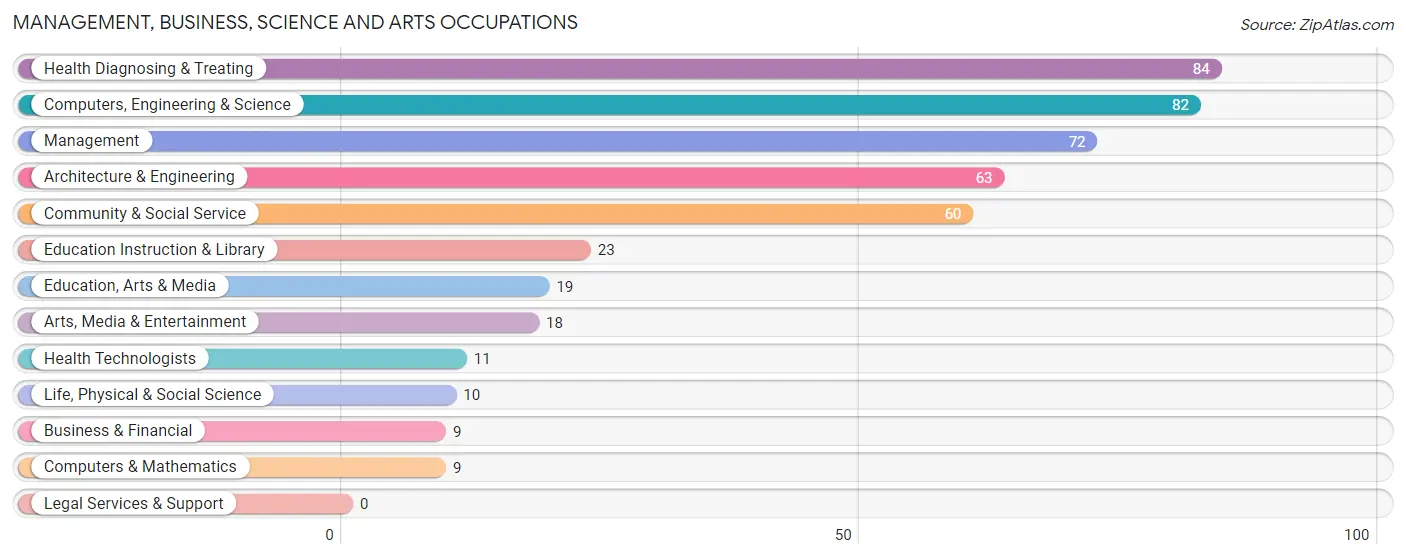
Management, Business, Science and Arts Occupations
The most common Management, Business, Science and Arts occupations in St Charles are Health Diagnosing & Treating (84 | 10.0%), Computers, Engineering & Science (82 | 9.8%), Management (72 | 8.6%), Architecture & Engineering (63 | 7.5%), and Community & Social Service (60 | 7.1%).
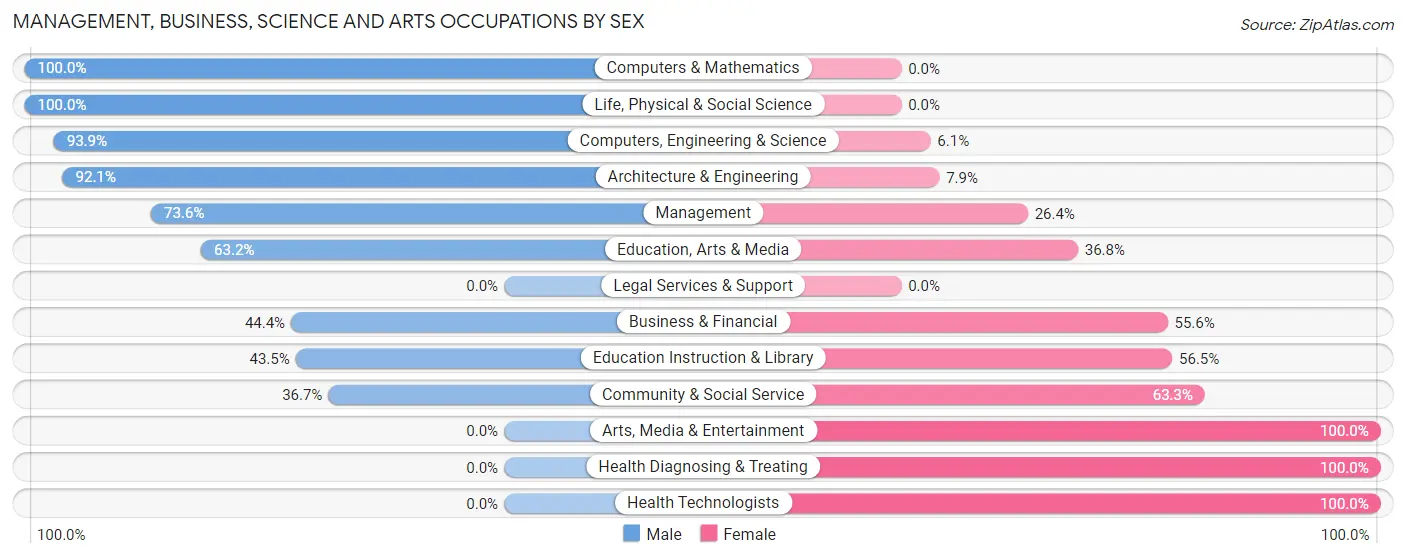
Management, Business, Science and Arts Occupations by Sex
Within the Management, Business, Science and Arts occupations in St Charles, the most male-oriented occupations are Computers & Mathematics (100.0%), Life, Physical & Social Science (100.0%), and Computers, Engineering & Science (93.9%), while the most female-oriented occupations are Arts, Media & Entertainment (100.0%), Health Diagnosing & Treating (100.0%), and Health Technologists (100.0%).
| Occupation | Male | Female |
| Management | 53 (73.6%) | 19 (26.4%) |
| Business & Financial | 4 (44.4%) | 5 (55.6%) |
| Computers, Engineering & Science | 77 (93.9%) | 5 (6.1%) |
| Computers & Mathematics | 9 (100.0%) | 0 (0.0%) |
| Architecture & Engineering | 58 (92.1%) | 5 (7.9%) |
| Life, Physical & Social Science | 10 (100.0%) | 0 (0.0%) |
| Community & Social Service | 22 (36.7%) | 38 (63.3%) |
| Education, Arts & Media | 12 (63.2%) | 7 (36.8%) |
| Legal Services & Support | 0 (0.0%) | 0 (0.0%) |
| Education Instruction & Library | 10 (43.5%) | 13 (56.5%) |
| Arts, Media & Entertainment | 0 (0.0%) | 18 (100.0%) |
| Health Diagnosing & Treating | 0 (0.0%) | 84 (100.0%) |
| Health Technologists | 0 (0.0%) | 11 (100.0%) |
| Total (Category) | 156 (50.8%) | 151 (49.2%) |
| Total (Overall) | 415 (49.5%) | 424 (50.5%) |
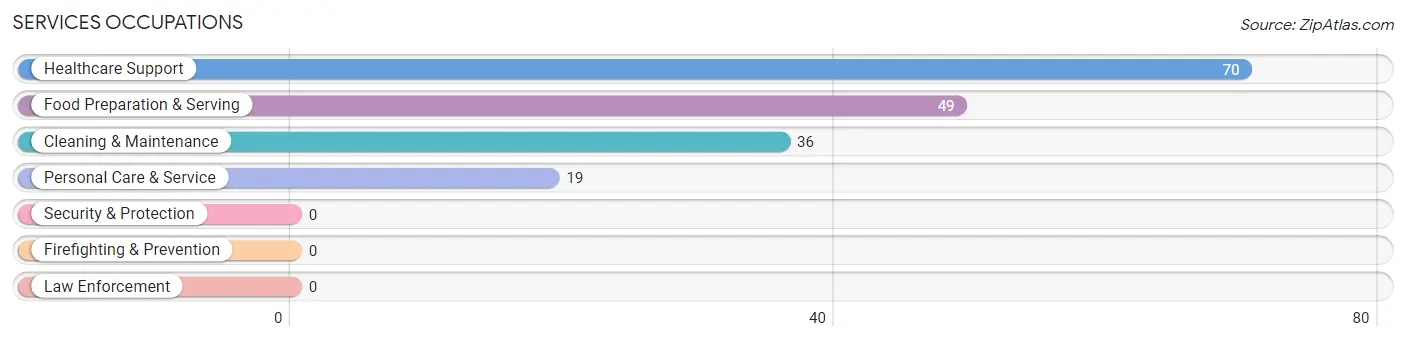
Services Occupations
The most common Services occupations in St Charles are Healthcare Support (70 | 8.3%), Food Preparation & Serving (49 | 5.8%), Cleaning & Maintenance (36 | 4.3%), and Personal Care & Service (19 | 2.3%).
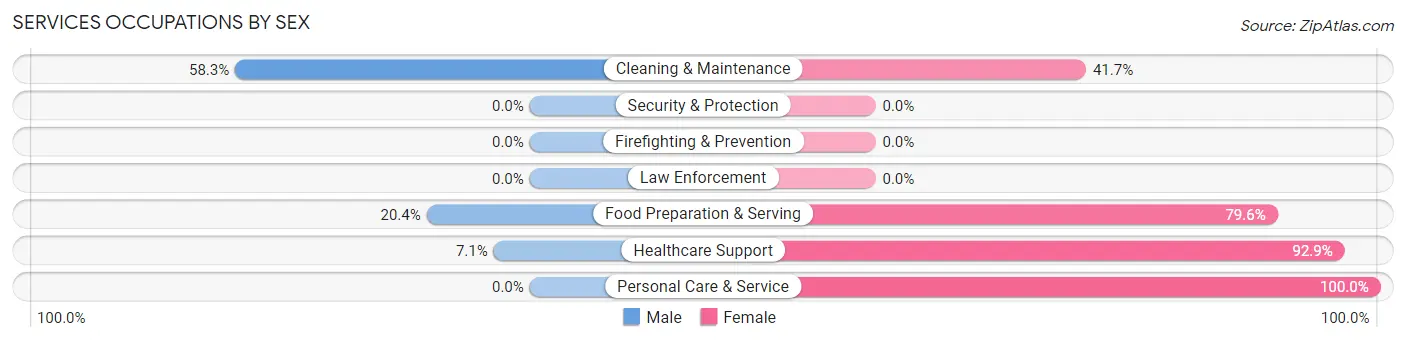
Services Occupations by Sex
Within the Services occupations in St Charles, the most male-oriented occupations are Cleaning & Maintenance (58.3%), Food Preparation & Serving (20.4%), and Healthcare Support (7.1%), while the most female-oriented occupations are Personal Care & Service (100.0%), Healthcare Support (92.9%), and Food Preparation & Serving (79.6%).
| Occupation | Male | Female |
| Healthcare Support | 5 (7.1%) | 65 (92.9%) |
| Security & Protection | 0 (0.0%) | 0 (0.0%) |
| Firefighting & Prevention | 0 (0.0%) | 0 (0.0%) |
| Law Enforcement | 0 (0.0%) | 0 (0.0%) |
| Food Preparation & Serving | 10 (20.4%) | 39 (79.6%) |
| Cleaning & Maintenance | 21 (58.3%) | 15 (41.7%) |
| Personal Care & Service | 0 (0.0%) | 19 (100.0%) |
| Total (Category) | 36 (20.7%) | 138 (79.3%) |
| Total (Overall) | 415 (49.5%) | 424 (50.5%) |
Sales and Office Occupations
The most common Sales and Office occupations in St Charles are Office & Administration (73 | 8.7%), and Sales & Related (44 | 5.2%).
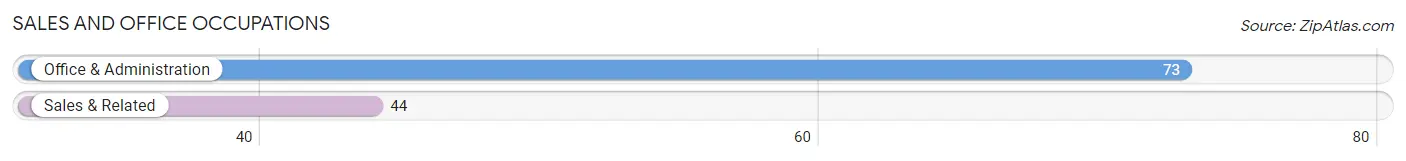
Sales and Office Occupations by Sex
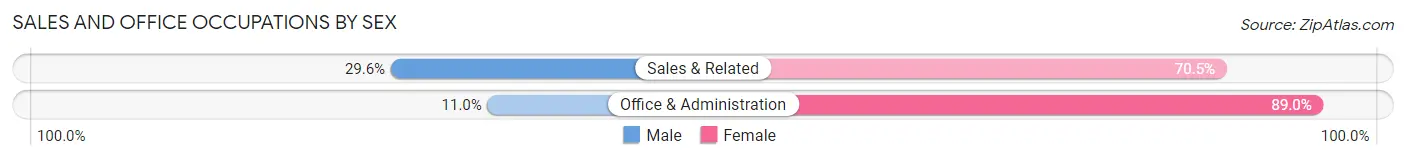
| Occupation | Male | Female |
| Sales & Related | 13 (29.5%) | 31 (70.5%) |
| Office & Administration | 8 (11.0%) | 65 (89.0%) |
| Total (Category) | 21 (17.9%) | 96 (82.1%) |
| Total (Overall) | 415 (49.5%) | 424 (50.5%) |
Natural Resources, Construction and Maintenance Occupations
The most common Natural Resources, Construction and Maintenance occupations in St Charles are Installation, Maintenance & Repair (31 | 3.7%), and Construction & Extraction (26 | 3.1%).
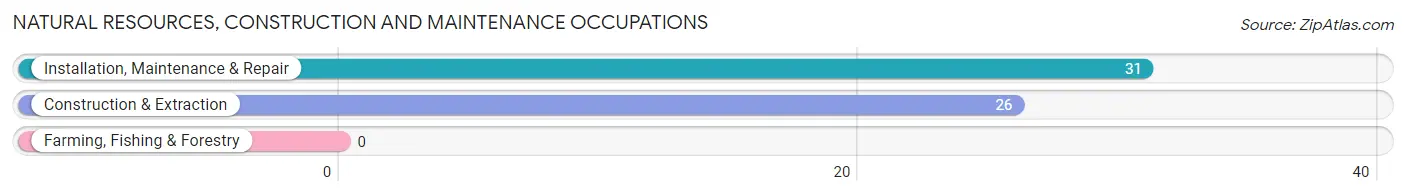
Natural Resources, Construction and Maintenance Occupations by Sex
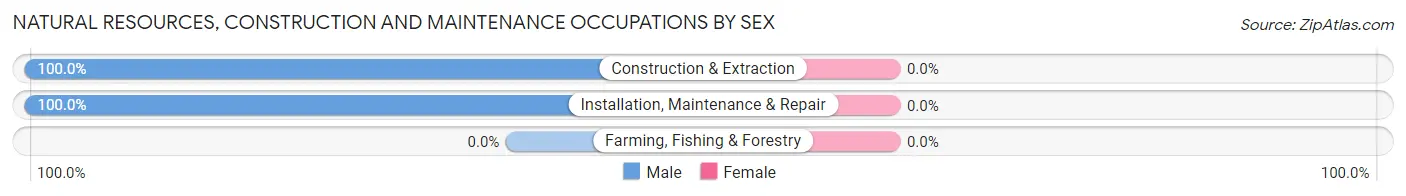
| Occupation | Male | Female |
| Farming, Fishing & Forestry | 0 (0.0%) | 0 (0.0%) |
| Construction & Extraction | 26 (100.0%) | 0 (0.0%) |
| Installation, Maintenance & Repair | 31 (100.0%) | 0 (0.0%) |
| Total (Category) | 57 (100.0%) | 0 (0.0%) |
| Total (Overall) | 415 (49.5%) | 424 (50.5%) |
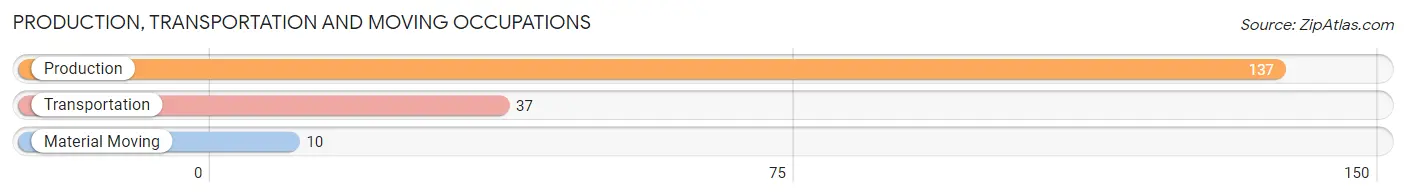
Production, Transportation and Moving Occupations
The most common Production, Transportation and Moving occupations in St Charles are Production (137 | 16.3%), Transportation (37 | 4.4%), and Material Moving (10 | 1.2%).
Production, Transportation and Moving Occupations by Sex
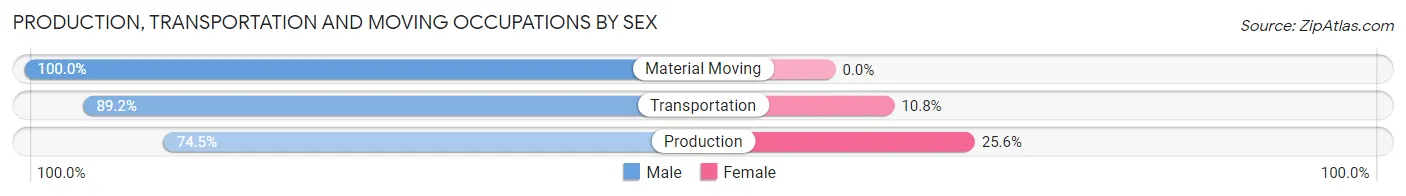
| Occupation | Male | Female |
| Production | 102 (74.5%) | 35 (25.6%) |
| Transportation | 33 (89.2%) | 4 (10.8%) |
| Material Moving | 10 (100.0%) | 0 (0.0%) |
| Total (Category) | 145 (78.8%) | 39 (21.2%) |
| Total (Overall) | 415 (49.5%) | 424 (50.5%) |
Employment Industries by Sex in St Charles
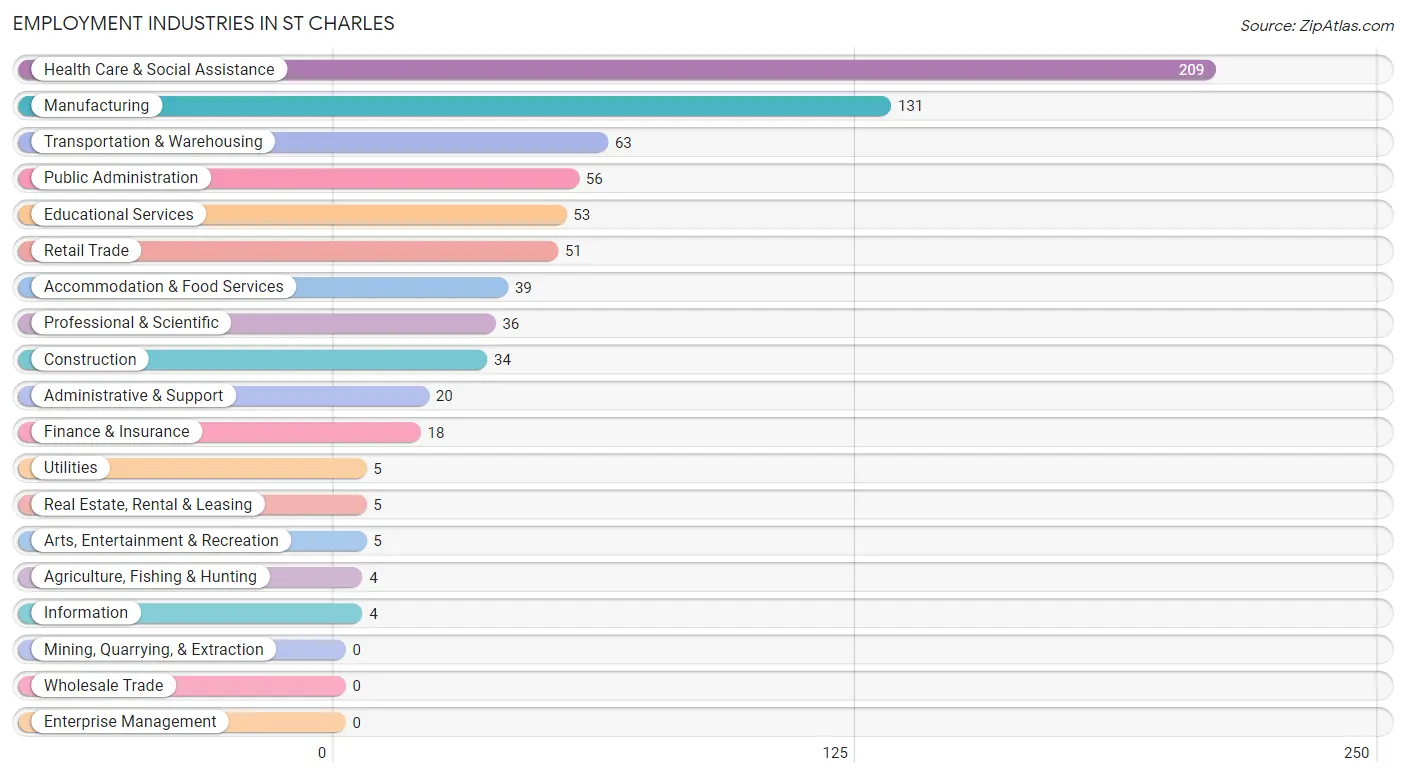
Employment Industries in St Charles
The major employment industries in St Charles include Health Care & Social Assistance (209 | 24.9%), Manufacturing (131 | 15.6%), Transportation & Warehousing (63 | 7.5%), Public Administration (56 | 6.7%), and Educational Services (53 | 6.3%).
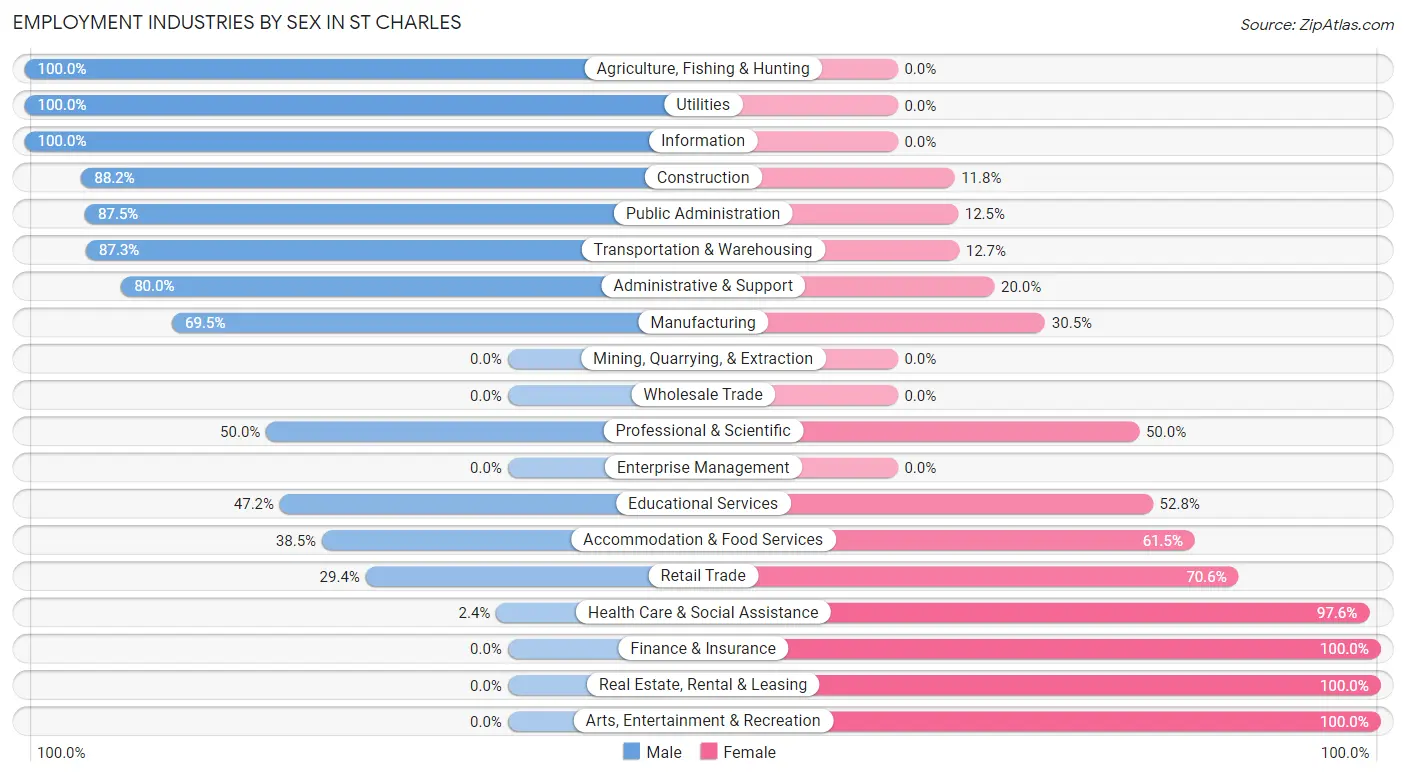
Employment Industries by Sex in St Charles
The St Charles industries that see more men than women are Agriculture, Fishing & Hunting (100.0%), Utilities (100.0%), and Information (100.0%), whereas the industries that tend to have a higher number of women are Finance & Insurance (100.0%), Real Estate, Rental & Leasing (100.0%), and Arts, Entertainment & Recreation (100.0%).
| Industry | Male | Female |
| Agriculture, Fishing & Hunting | 4 (100.0%) | 0 (0.0%) |
| Mining, Quarrying, & Extraction | 0 (0.0%) | 0 (0.0%) |
| Construction | 30 (88.2%) | 4 (11.8%) |
| Manufacturing | 91 (69.5%) | 40 (30.5%) |
| Wholesale Trade | 0 (0.0%) | 0 (0.0%) |
| Retail Trade | 15 (29.4%) | 36 (70.6%) |
| Transportation & Warehousing | 55 (87.3%) | 8 (12.7%) |
| Utilities | 5 (100.0%) | 0 (0.0%) |
| Information | 4 (100.0%) | 0 (0.0%) |
| Finance & Insurance | 0 (0.0%) | 18 (100.0%) |
| Real Estate, Rental & Leasing | 0 (0.0%) | 5 (100.0%) |
| Professional & Scientific | 18 (50.0%) | 18 (50.0%) |
| Enterprise Management | 0 (0.0%) | 0 (0.0%) |
| Administrative & Support | 16 (80.0%) | 4 (20.0%) |
| Educational Services | 25 (47.2%) | 28 (52.8%) |
| Health Care & Social Assistance | 5 (2.4%) | 204 (97.6%) |
| Arts, Entertainment & Recreation | 0 (0.0%) | 5 (100.0%) |
| Accommodation & Food Services | 15 (38.5%) | 24 (61.5%) |
| Public Administration | 49 (87.5%) | 7 (12.5%) |
| Total | 415 (49.5%) | 424 (50.5%) |
Education in St Charles
School Enrollment in St Charles
The most common levels of schooling among the 463 students in St Charles are high school (171 | 36.9%), elementary school (96 | 20.7%), and middle school (92 | 19.9%).
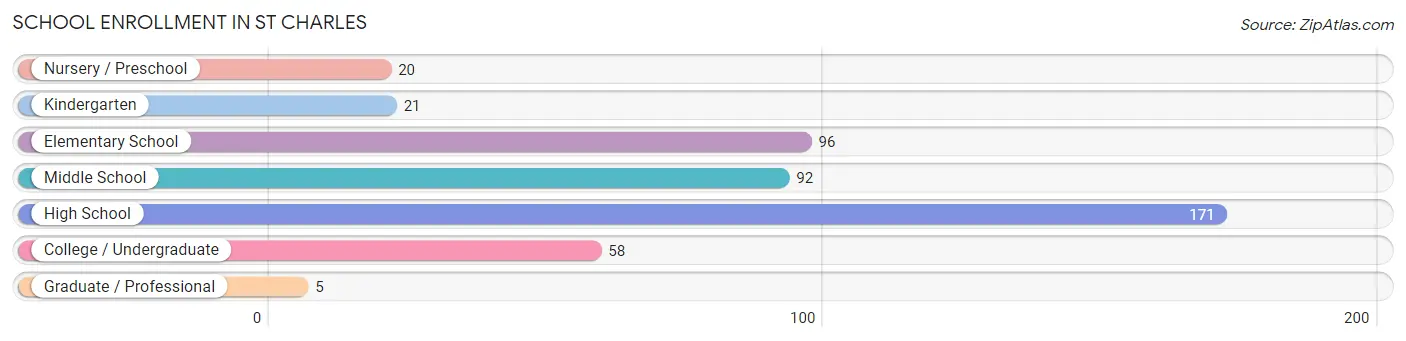
| School Level | # Students | % Students |
| Nursery / Preschool | 20 | 4.3% |
| Kindergarten | 21 | 4.5% |
| Elementary School | 96 | 20.7% |
| Middle School | 92 | 19.9% |
| High School | 171 | 36.9% |
| College / Undergraduate | 58 | 12.5% |
| Graduate / Professional | 5 | 1.1% |
| Total | 463 | 100.0% |
School Enrollment by Age by Funding Source in St Charles
Out of a total of 463 students who are enrolled in schools in St Charles, 25 (5.4%) attend a private institution, while the remaining 438 (94.6%) are enrolled in public schools. The age group of 5 to 9 year old has the highest likelihood of being enrolled in private schools, with 17 (16.7% in the age bracket) enrolled. Conversely, the age group of 3 to 4 year olds has the lowest likelihood of being enrolled in a private school, with 10 (100.0% in the age bracket) attending a public institution.
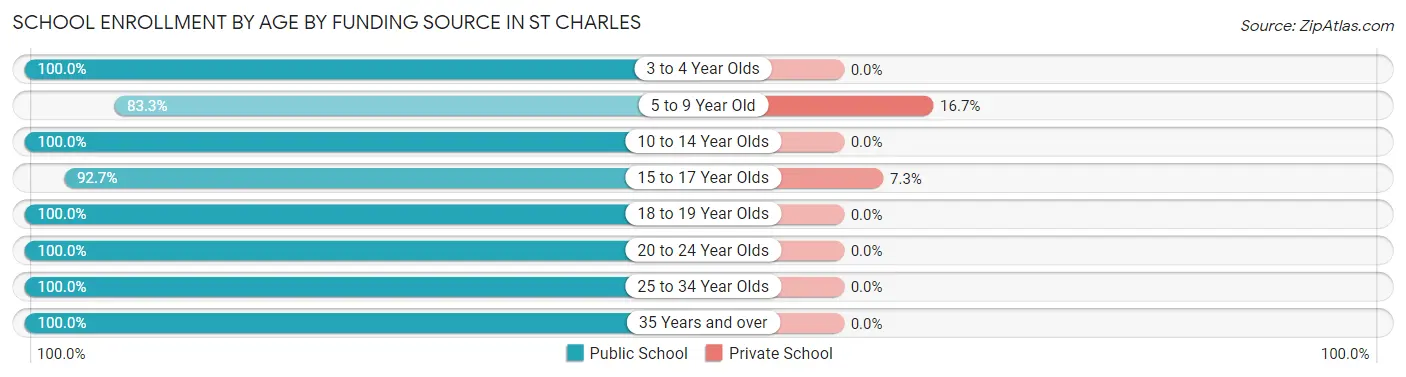
| Age Bracket | Public School | Private School |
| 3 to 4 Year Olds | 10 (100.0%) | 0 (0.0%) |
| 5 to 9 Year Old | 85 (83.3%) | 17 (16.7%) |
| 10 to 14 Year Olds | 151 (100.0%) | 0 (0.0%) |
| 15 to 17 Year Olds | 101 (92.7%) | 8 (7.3%) |
| 18 to 19 Year Olds | 23 (100.0%) | 0 (0.0%) |
| 20 to 24 Year Olds | 37 (100.0%) | 0 (0.0%) |
| 25 to 34 Year Olds | 27 (100.0%) | 0 (0.0%) |
| 35 Years and over | 4 (100.0%) | 0 (0.0%) |
| Total | 438 (94.6%) | 25 (5.4%) |
Educational Attainment by Field of Study in St Charles
Education (61 | 25.6%), engineering (45 | 18.9%), business (39 | 16.4%), arts & humanities (22 | 9.2%), and liberal arts & history (17 | 7.1%) are the most common fields of study among 238 individuals in St Charles who have obtained a bachelor's degree or higher.
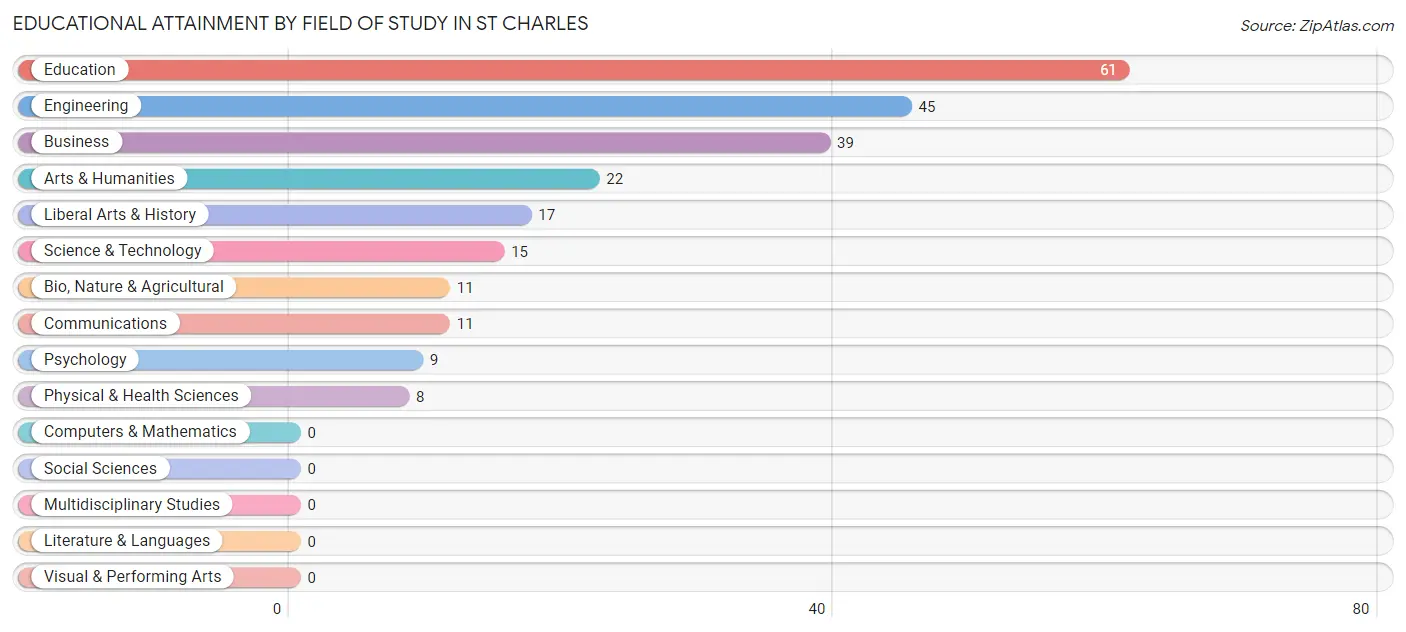
| Field of Study | # Graduates | % Graduates |
| Computers & Mathematics | 0 | 0.0% |
| Bio, Nature & Agricultural | 11 | 4.6% |
| Physical & Health Sciences | 8 | 3.4% |
| Psychology | 9 | 3.8% |
| Social Sciences | 0 | 0.0% |
| Engineering | 45 | 18.9% |
| Multidisciplinary Studies | 0 | 0.0% |
| Science & Technology | 15 | 6.3% |
| Business | 39 | 16.4% |
| Education | 61 | 25.6% |
| Literature & Languages | 0 | 0.0% |
| Liberal Arts & History | 17 | 7.1% |
| Visual & Performing Arts | 0 | 0.0% |
| Communications | 11 | 4.6% |
| Arts & Humanities | 22 | 9.2% |
| Total | 238 | 100.0% |
Transportation & Commute in St Charles
Vehicle Availability by Sex in St Charles
The most prevalent vehicle ownership categories in St Charles are males with 2 vehicles (152, accounting for 37.4%) and females with 2 vehicles (165, making up 37.1%).
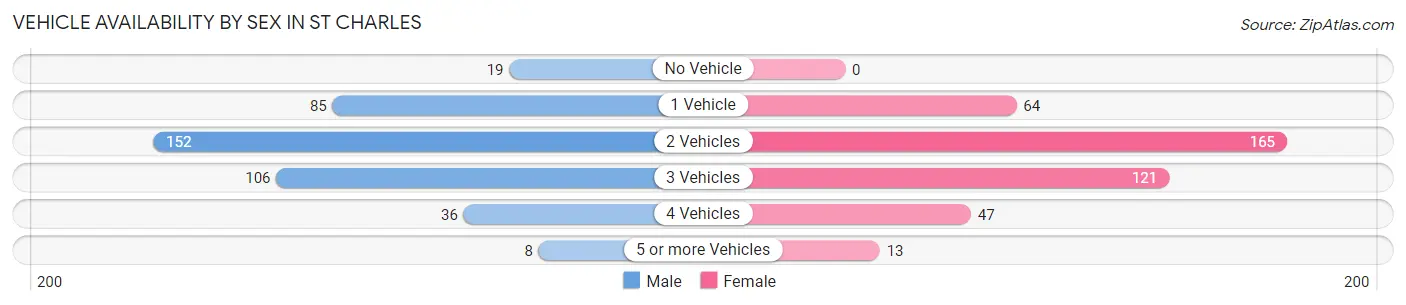
| Vehicles Available | Male | Female |
| No Vehicle | 19 (4.7%) | 0 (0.0%) |
| 1 Vehicle | 85 (20.9%) | 64 (15.6%) |
| 2 Vehicles | 152 (37.4%) | 165 (40.2%) |
| 3 Vehicles | 106 (26.1%) | 121 (29.5%) |
| 4 Vehicles | 36 (8.9%) | 47 (11.5%) |
| 5 or more Vehicles | 8 (2.0%) | 13 (3.2%) |
| Total | 406 (100.0%) | 410 (100.0%) |
Commute Time in St Charles
The most frequently occuring commute durations in St Charles are 30 to 34 minutes (172 commuters, 22.5%), 15 to 19 minutes (94 commuters, 12.3%), and 10 to 14 minutes (88 commuters, 11.5%).
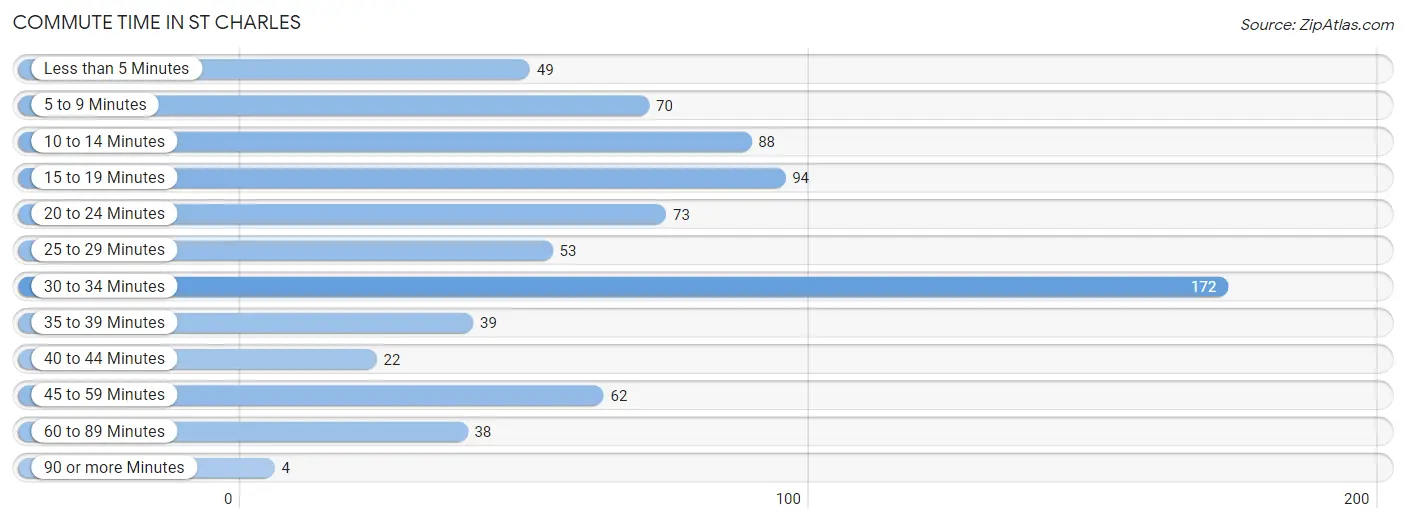
| Commute Time | # Commuters | % Commuters |
| Less than 5 Minutes | 49 | 6.4% |
| 5 to 9 Minutes | 70 | 9.2% |
| 10 to 14 Minutes | 88 | 11.5% |
| 15 to 19 Minutes | 94 | 12.3% |
| 20 to 24 Minutes | 73 | 9.6% |
| 25 to 29 Minutes | 53 | 6.9% |
| 30 to 34 Minutes | 172 | 22.5% |
| 35 to 39 Minutes | 39 | 5.1% |
| 40 to 44 Minutes | 22 | 2.9% |
| 45 to 59 Minutes | 62 | 8.1% |
| 60 to 89 Minutes | 38 | 5.0% |
| 90 or more Minutes | 4 | 0.5% |
Commute Time by Sex in St Charles
The most common commute times in St Charles are 30 to 34 minutes (131 commuters, 35.8%) for males and 15 to 19 minutes (67 commuters, 16.8%) for females.
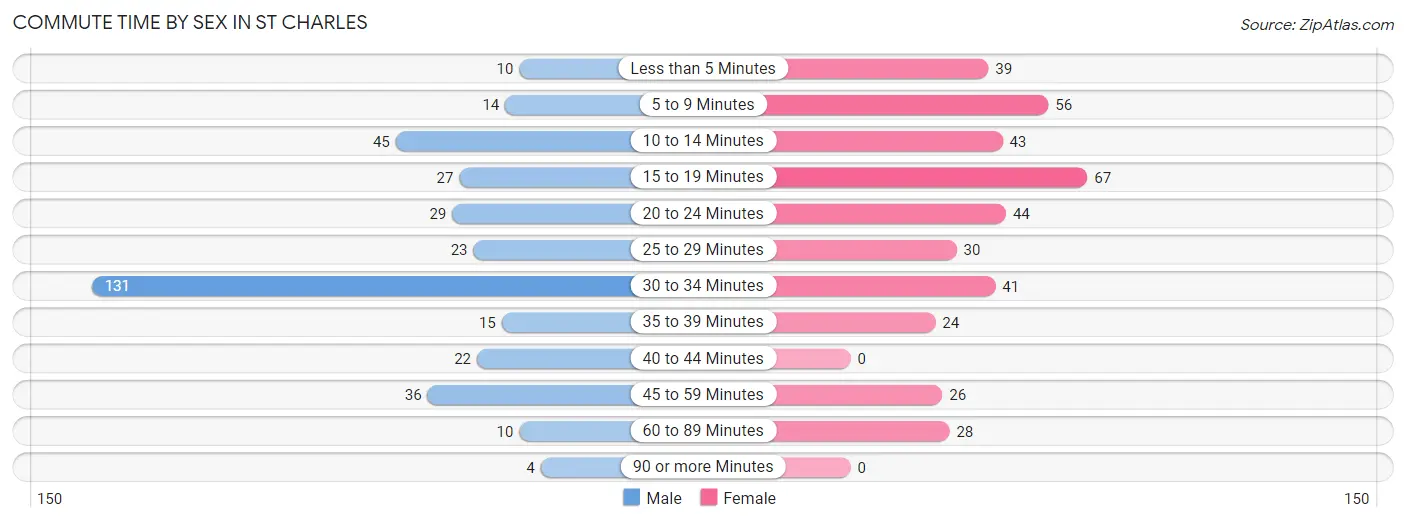
| Commute Time | Male | Female |
| Less than 5 Minutes | 10 (2.7%) | 39 (9.8%) |
| 5 to 9 Minutes | 14 (3.8%) | 56 (14.1%) |
| 10 to 14 Minutes | 45 (12.3%) | 43 (10.8%) |
| 15 to 19 Minutes | 27 (7.4%) | 67 (16.8%) |
| 20 to 24 Minutes | 29 (7.9%) | 44 (11.1%) |
| 25 to 29 Minutes | 23 (6.3%) | 30 (7.5%) |
| 30 to 34 Minutes | 131 (35.8%) | 41 (10.3%) |
| 35 to 39 Minutes | 15 (4.1%) | 24 (6.0%) |
| 40 to 44 Minutes | 22 (6.0%) | 0 (0.0%) |
| 45 to 59 Minutes | 36 (9.8%) | 26 (6.5%) |
| 60 to 89 Minutes | 10 (2.7%) | 28 (7.0%) |
| 90 or more Minutes | 4 (1.1%) | 0 (0.0%) |
Time of Departure to Work by Sex in St Charles
The most frequent times of departure to work in St Charles are 7:00 AM to 7:29 AM (124, 33.9%) for males and 7:30 AM to 7:59 AM (98, 24.6%) for females.
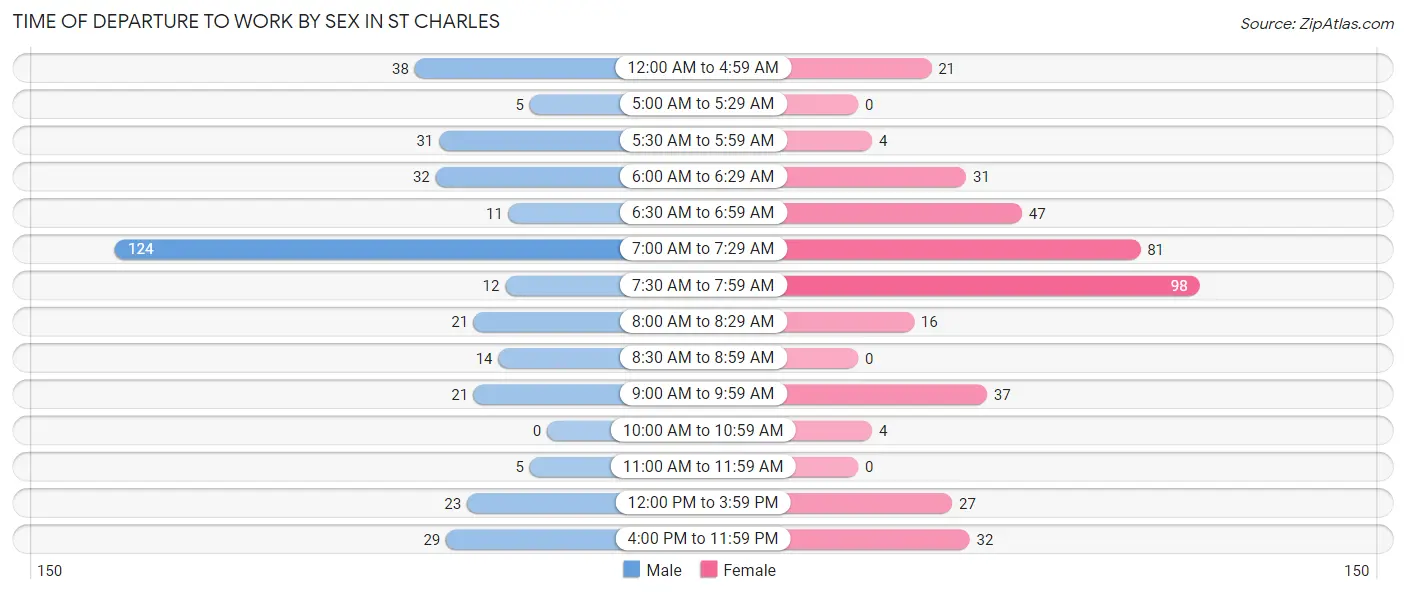
| Time of Departure | Male | Female |
| 12:00 AM to 4:59 AM | 38 (10.4%) | 21 (5.3%) |
| 5:00 AM to 5:29 AM | 5 (1.4%) | 0 (0.0%) |
| 5:30 AM to 5:59 AM | 31 (8.5%) | 4 (1.0%) |
| 6:00 AM to 6:29 AM | 32 (8.7%) | 31 (7.8%) |
| 6:30 AM to 6:59 AM | 11 (3.0%) | 47 (11.8%) |
| 7:00 AM to 7:29 AM | 124 (33.9%) | 81 (20.3%) |
| 7:30 AM to 7:59 AM | 12 (3.3%) | 98 (24.6%) |
| 8:00 AM to 8:29 AM | 21 (5.7%) | 16 (4.0%) |
| 8:30 AM to 8:59 AM | 14 (3.8%) | 0 (0.0%) |
| 9:00 AM to 9:59 AM | 21 (5.7%) | 37 (9.3%) |
| 10:00 AM to 10:59 AM | 0 (0.0%) | 4 (1.0%) |
| 11:00 AM to 11:59 AM | 5 (1.4%) | 0 (0.0%) |
| 12:00 PM to 3:59 PM | 23 (6.3%) | 27 (6.8%) |
| 4:00 PM to 11:59 PM | 29 (7.9%) | 32 (8.0%) |
| Total | 366 (100.0%) | 398 (100.0%) |
Housing Occupancy in St Charles
Occupancy by Ownership in St Charles
Of the total 812 dwellings in St Charles, owner-occupied units account for 601 (74.0%), while renter-occupied units make up 211 (26.0%).
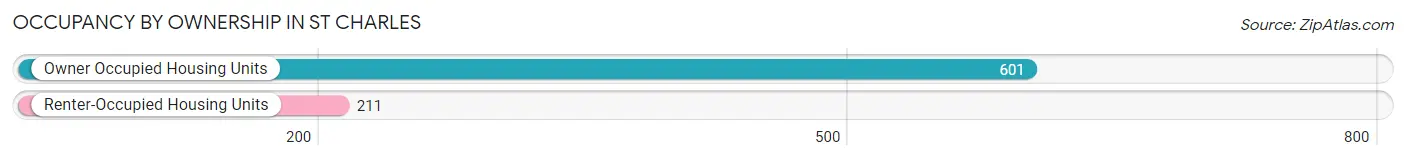
| Occupancy | # Housing Units | % Housing Units |
| Owner Occupied Housing Units | 601 | 74.0% |
| Renter-Occupied Housing Units | 211 | 26.0% |
| Total Occupied Housing Units | 812 | 100.0% |
Occupancy by Household Size in St Charles
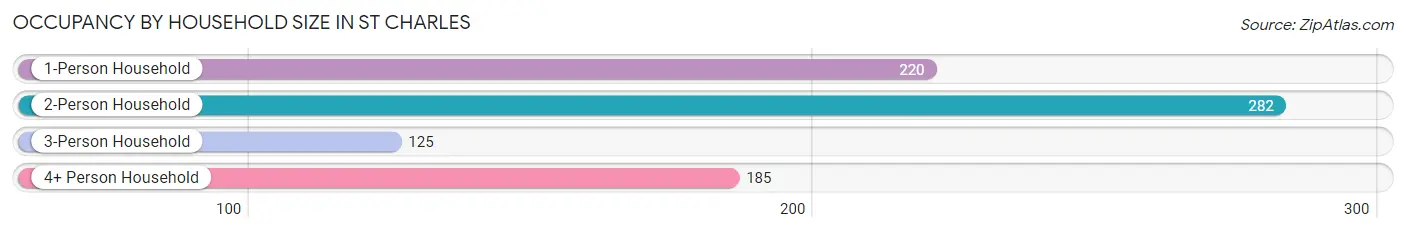
| Household Size | # Housing Units | % Housing Units |
| 1-Person Household | 220 | 27.1% |
| 2-Person Household | 282 | 34.7% |
| 3-Person Household | 125 | 15.4% |
| 4+ Person Household | 185 | 22.8% |
| Total Housing Units | 812 | 100.0% |
Occupancy by Ownership by Household Size in St Charles
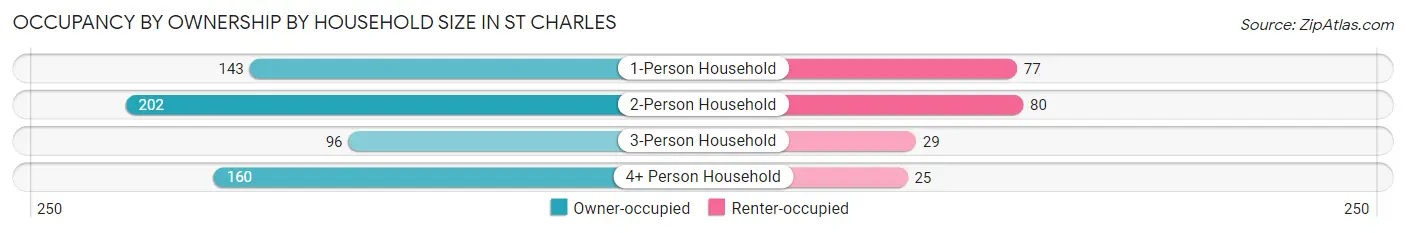
| Household Size | Owner-occupied | Renter-occupied |
| 1-Person Household | 143 (65.0%) | 77 (35.0%) |
| 2-Person Household | 202 (71.6%) | 80 (28.4%) |
| 3-Person Household | 96 (76.8%) | 29 (23.2%) |
| 4+ Person Household | 160 (86.5%) | 25 (13.5%) |
| Total Housing Units | 601 (74.0%) | 211 (26.0%) |
Occupancy by Educational Attainment in St Charles
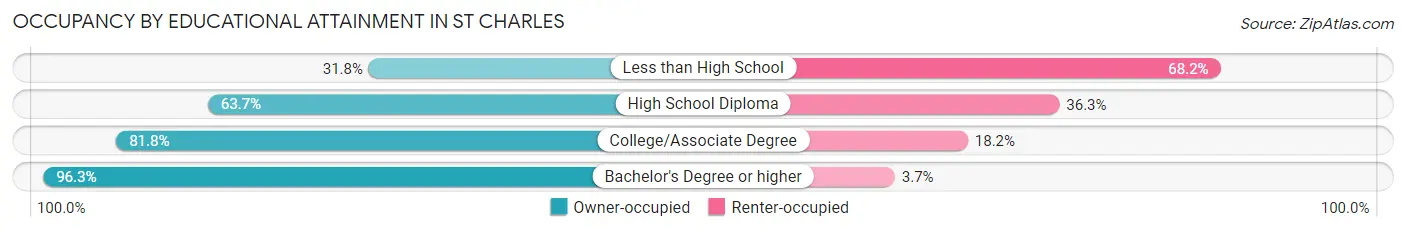
| Household Size | Owner-occupied | Renter-occupied |
| Less than High School | 27 (31.8%) | 58 (68.2%) |
| High School Diploma | 128 (63.7%) | 73 (36.3%) |
| College/Associate Degree | 342 (81.8%) | 76 (18.2%) |
| Bachelor's Degree or higher | 104 (96.3%) | 4 (3.7%) |
Occupancy by Age of Householder in St Charles
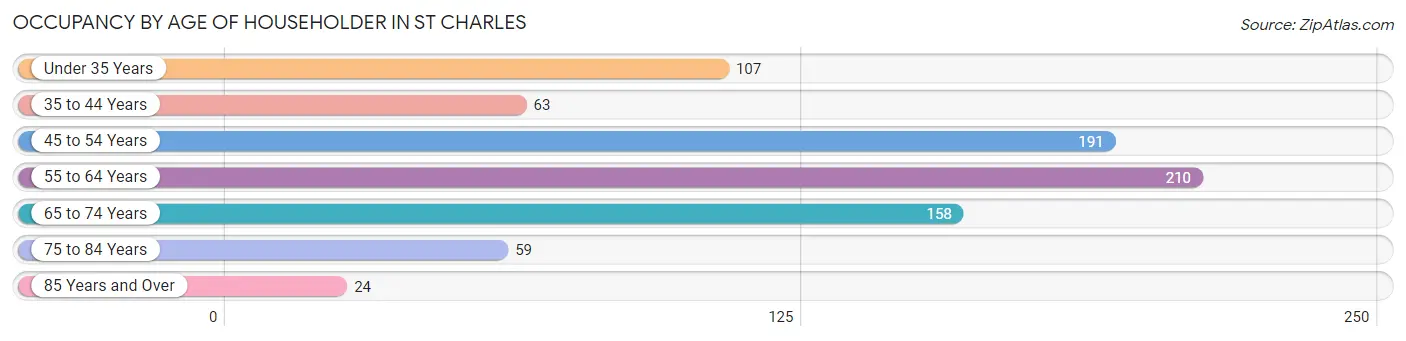
| Age Bracket | # Households | % Households |
| Under 35 Years | 107 | 13.2% |
| 35 to 44 Years | 63 | 7.8% |
| 45 to 54 Years | 191 | 23.5% |
| 55 to 64 Years | 210 | 25.9% |
| 65 to 74 Years | 158 | 19.5% |
| 75 to 84 Years | 59 | 7.3% |
| 85 Years and Over | 24 | 3.0% |
| Total | 812 | 100.0% |
Housing Finances in St Charles
Median Income by Occupancy in St Charles
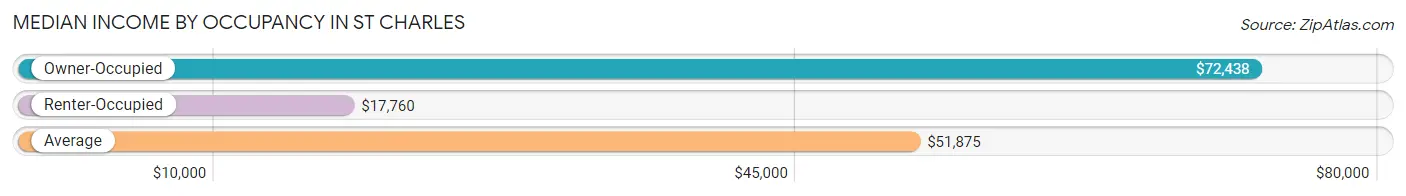
| Occupancy Type | # Households | Median Income |
| Owner-Occupied | 601 (74.0%) | $72,438 |
| Renter-Occupied | 211 (26.0%) | $17,760 |
| Average | 812 (100.0%) | $51,875 |
Occupancy by Householder Income Bracket in St Charles
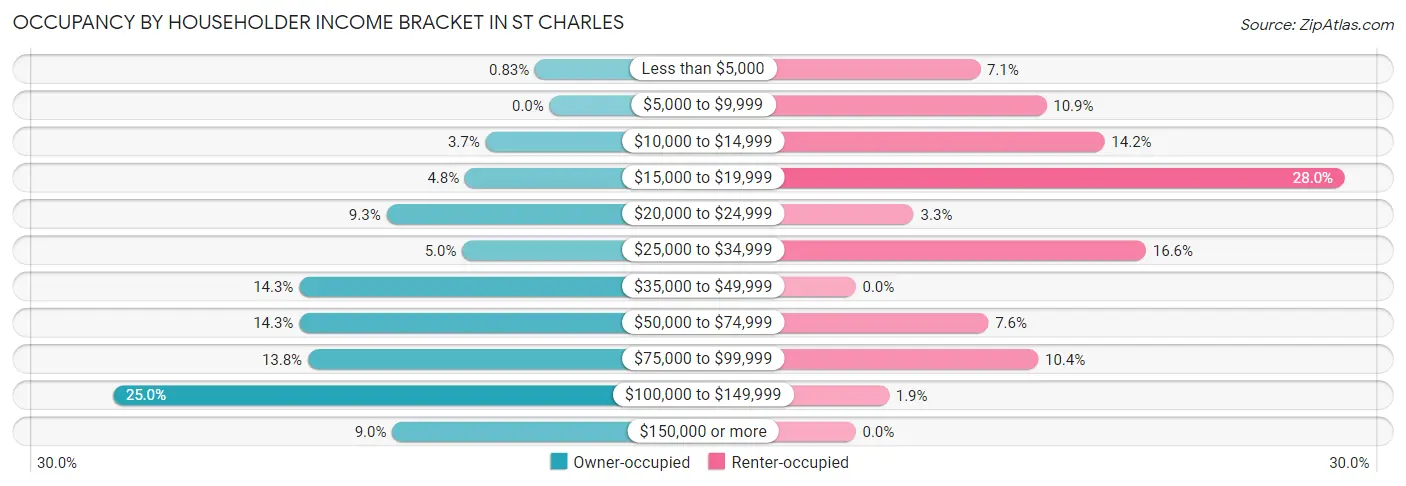
| Income Bracket | Owner-occupied | Renter-occupied |
| Less than $5,000 | 5 (0.8%) | 15 (7.1%) |
| $5,000 to $9,999 | 0 (0.0%) | 23 (10.9%) |
| $10,000 to $14,999 | 22 (3.7%) | 30 (14.2%) |
| $15,000 to $19,999 | 29 (4.8%) | 59 (28.0%) |
| $20,000 to $24,999 | 56 (9.3%) | 7 (3.3%) |
| $25,000 to $34,999 | 30 (5.0%) | 35 (16.6%) |
| $35,000 to $49,999 | 86 (14.3%) | 0 (0.0%) |
| $50,000 to $74,999 | 86 (14.3%) | 16 (7.6%) |
| $75,000 to $99,999 | 83 (13.8%) | 22 (10.4%) |
| $100,000 to $149,999 | 150 (25.0%) | 4 (1.9%) |
| $150,000 or more | 54 (9.0%) | 0 (0.0%) |
| Total | 601 (100.0%) | 211 (100.0%) |
Monthly Housing Cost Tiers in St Charles
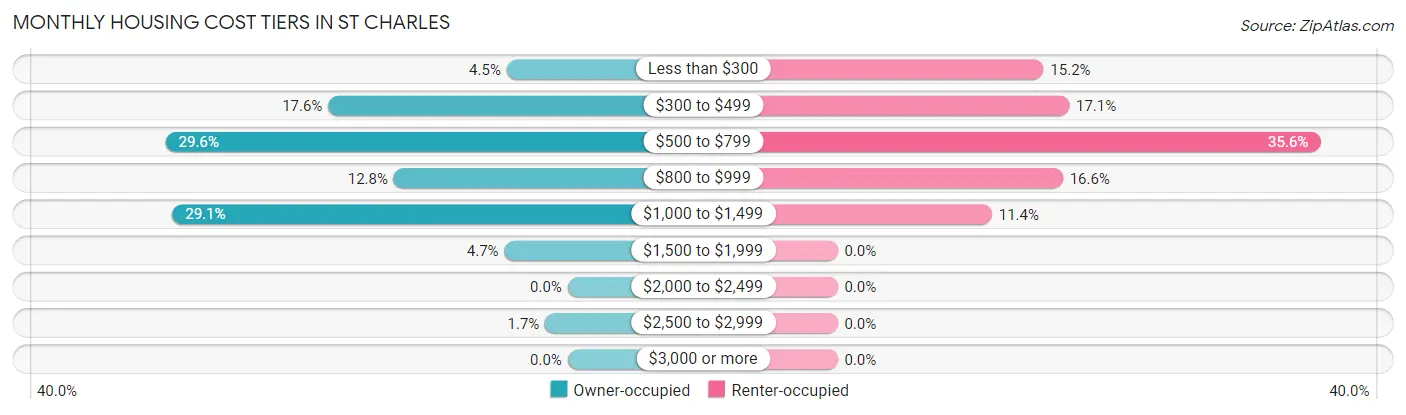
| Monthly Cost | Owner-occupied | Renter-occupied |
| Less than $300 | 27 (4.5%) | 32 (15.2%) |
| $300 to $499 | 106 (17.6%) | 36 (17.1%) |
| $500 to $799 | 178 (29.6%) | 75 (35.5%) |
| $800 to $999 | 77 (12.8%) | 35 (16.6%) |
| $1,000 to $1,499 | 175 (29.1%) | 24 (11.4%) |
| $1,500 to $1,999 | 28 (4.7%) | 0 (0.0%) |
| $2,000 to $2,499 | 0 (0.0%) | 0 (0.0%) |
| $2,500 to $2,999 | 10 (1.7%) | 0 (0.0%) |
| $3,000 or more | 0 (0.0%) | 0 (0.0%) |
| Total | 601 (100.0%) | 211 (100.0%) |
Physical Housing Characteristics in St Charles
Housing Structures in St Charles
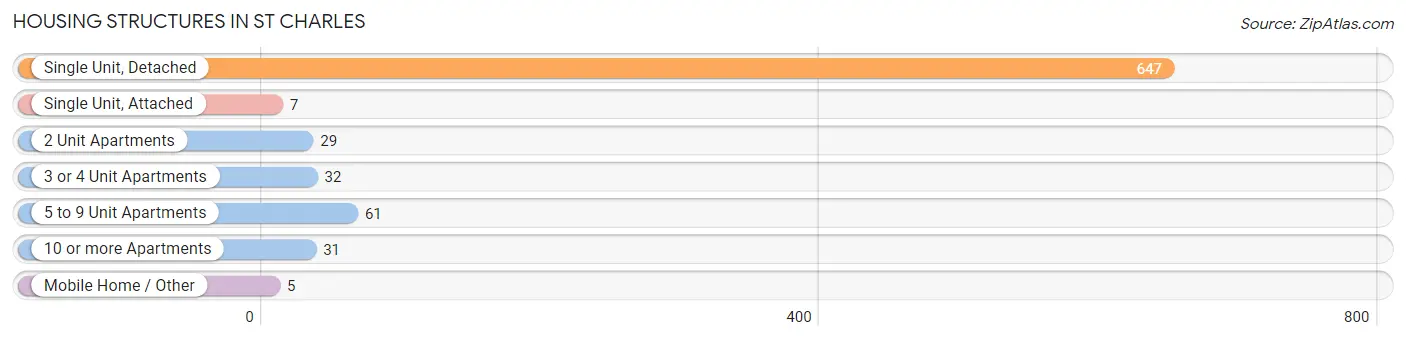
| Structure Type | # Housing Units | % Housing Units |
| Single Unit, Detached | 647 | 79.7% |
| Single Unit, Attached | 7 | 0.9% |
| 2 Unit Apartments | 29 | 3.6% |
| 3 or 4 Unit Apartments | 32 | 3.9% |
| 5 to 9 Unit Apartments | 61 | 7.5% |
| 10 or more Apartments | 31 | 3.8% |
| Mobile Home / Other | 5 | 0.6% |
| Total | 812 | 100.0% |
Housing Structures by Occupancy in St Charles
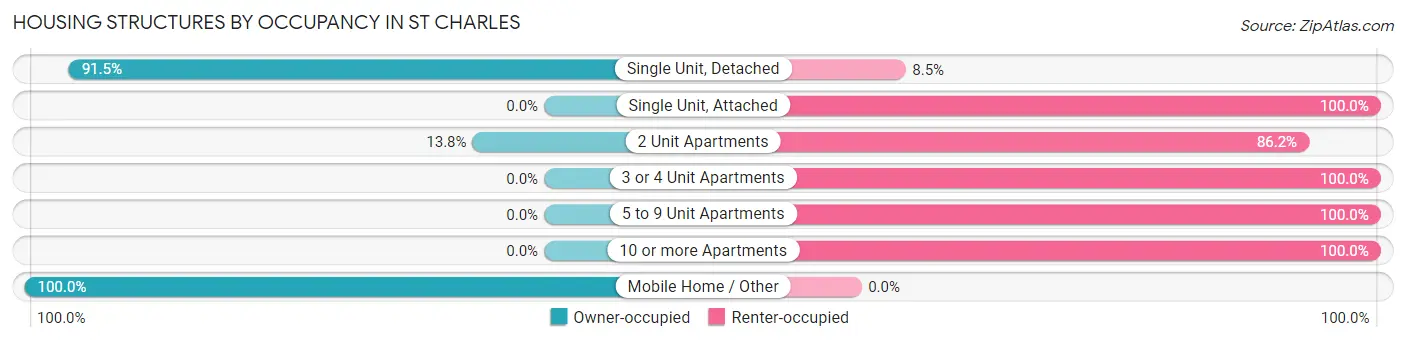
| Structure Type | Owner-occupied | Renter-occupied |
| Single Unit, Detached | 592 (91.5%) | 55 (8.5%) |
| Single Unit, Attached | 0 (0.0%) | 7 (100.0%) |
| 2 Unit Apartments | 4 (13.8%) | 25 (86.2%) |
| 3 or 4 Unit Apartments | 0 (0.0%) | 32 (100.0%) |
| 5 to 9 Unit Apartments | 0 (0.0%) | 61 (100.0%) |
| 10 or more Apartments | 0 (0.0%) | 31 (100.0%) |
| Mobile Home / Other | 5 (100.0%) | 0 (0.0%) |
| Total | 601 (74.0%) | 211 (26.0%) |
Housing Structures by Number of Rooms in St Charles
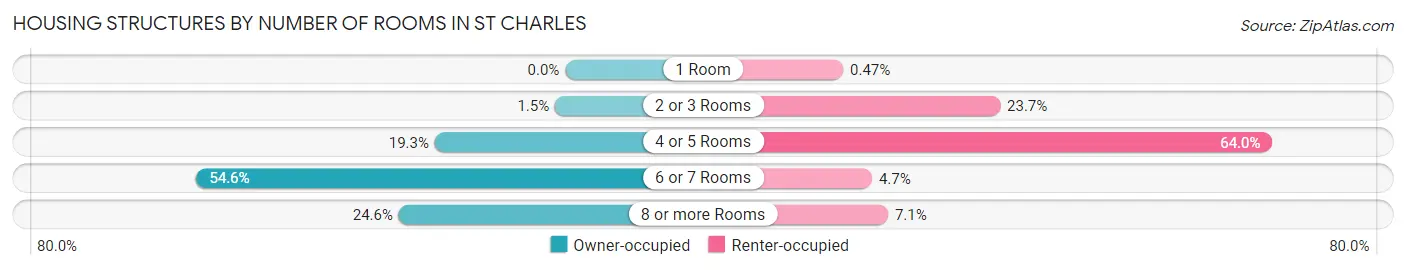
| Number of Rooms | Owner-occupied | Renter-occupied |
| 1 Room | 0 (0.0%) | 1 (0.5%) |
| 2 or 3 Rooms | 9 (1.5%) | 50 (23.7%) |
| 4 or 5 Rooms | 116 (19.3%) | 135 (64.0%) |
| 6 or 7 Rooms | 328 (54.6%) | 10 (4.7%) |
| 8 or more Rooms | 148 (24.6%) | 15 (7.1%) |
| Total | 601 (100.0%) | 211 (100.0%) |
Housing Structure by Heating Type in St Charles
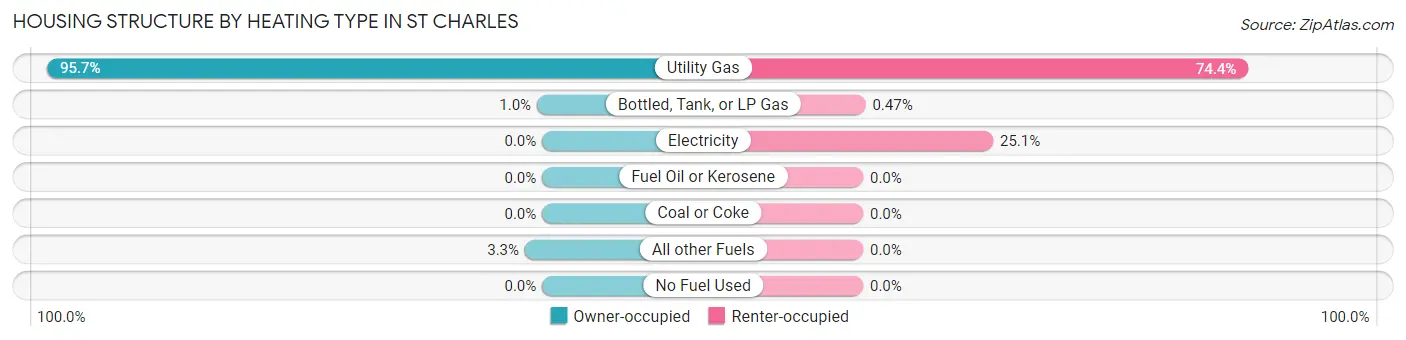
| Heating Type | Owner-occupied | Renter-occupied |
| Utility Gas | 575 (95.7%) | 157 (74.4%) |
| Bottled, Tank, or LP Gas | 6 (1.0%) | 1 (0.5%) |
| Electricity | 0 (0.0%) | 53 (25.1%) |
| Fuel Oil or Kerosene | 0 (0.0%) | 0 (0.0%) |
| Coal or Coke | 0 (0.0%) | 0 (0.0%) |
| All other Fuels | 20 (3.3%) | 0 (0.0%) |
| No Fuel Used | 0 (0.0%) | 0 (0.0%) |
| Total | 601 (100.0%) | 211 (100.0%) |
Household Vehicle Usage in St Charles
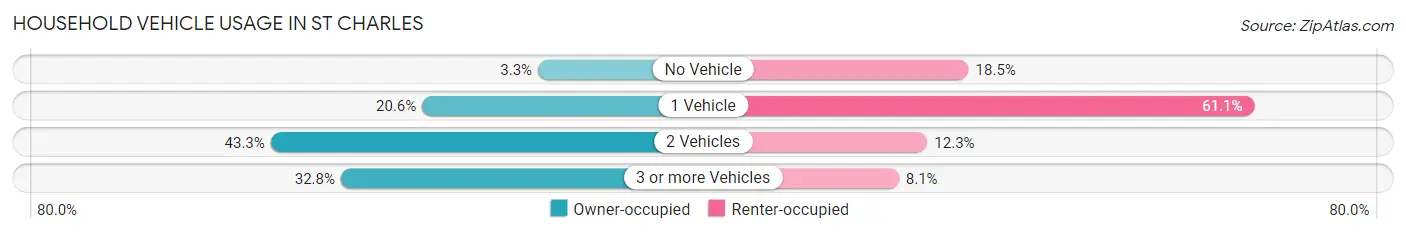
| Vehicles per Household | Owner-occupied | Renter-occupied |
| No Vehicle | 20 (3.3%) | 39 (18.5%) |
| 1 Vehicle | 124 (20.6%) | 129 (61.1%) |
| 2 Vehicles | 260 (43.3%) | 26 (12.3%) |
| 3 or more Vehicles | 197 (32.8%) | 17 (8.1%) |
| Total | 601 (100.0%) | 211 (100.0%) |
Real Estate & Mortgages in St Charles
Real Estate and Mortgage Overview in St Charles
| Characteristic | Without Mortgage | With Mortgage |
| Housing Units | 254 | 347 |
| Median Property Value | $98,700 | $99,800 |
| Median Household Income | $52,083 | $34 |
| Monthly Housing Costs | $491 | $0 |
| Real Estate Taxes | $1,836 | $0 |
Property Value by Mortgage Status in St Charles
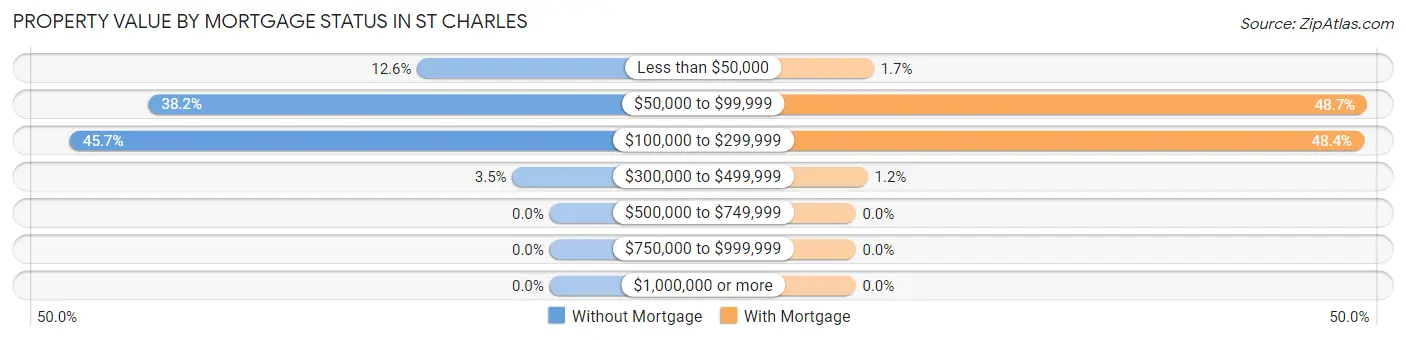
| Property Value | Without Mortgage | With Mortgage |
| Less than $50,000 | 32 (12.6%) | 6 (1.7%) |
| $50,000 to $99,999 | 97 (38.2%) | 169 (48.7%) |
| $100,000 to $299,999 | 116 (45.7%) | 168 (48.4%) |
| $300,000 to $499,999 | 9 (3.5%) | 4 (1.1%) |
| $500,000 to $749,999 | 0 (0.0%) | 0 (0.0%) |
| $750,000 to $999,999 | 0 (0.0%) | 0 (0.0%) |
| $1,000,000 or more | 0 (0.0%) | 0 (0.0%) |
| Total | 254 (100.0%) | 347 (100.0%) |
Household Income by Mortgage Status in St Charles
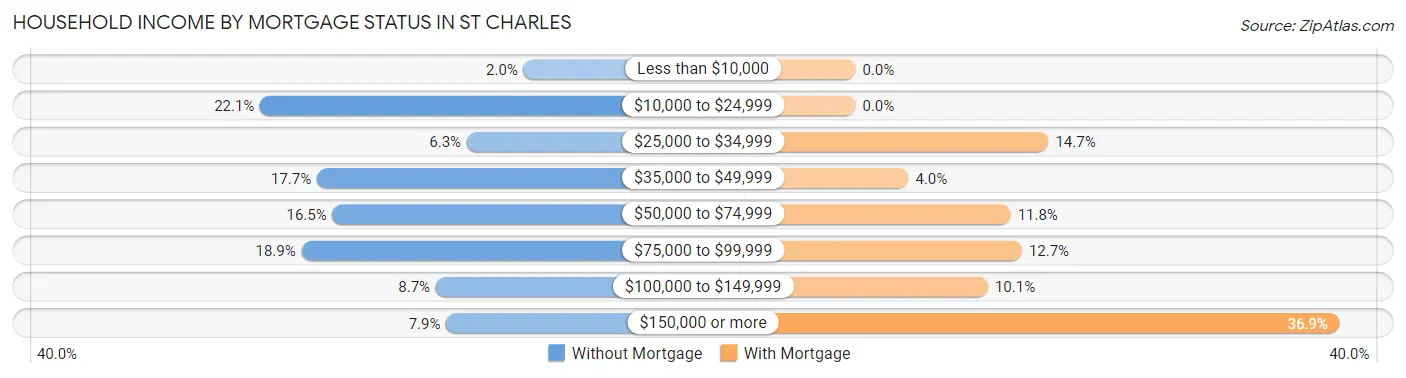
| Household Income | Without Mortgage | With Mortgage |
| Less than $10,000 | 5 (2.0%) | 0 (0.0%) |
| $10,000 to $24,999 | 56 (22.1%) | 0 (0.0%) |
| $25,000 to $34,999 | 16 (6.3%) | 51 (14.7%) |
| $35,000 to $49,999 | 45 (17.7%) | 14 (4.0%) |
| $50,000 to $74,999 | 42 (16.5%) | 41 (11.8%) |
| $75,000 to $99,999 | 48 (18.9%) | 44 (12.7%) |
| $100,000 to $149,999 | 22 (8.7%) | 35 (10.1%) |
| $150,000 or more | 20 (7.9%) | 128 (36.9%) |
| Total | 254 (100.0%) | 347 (100.0%) |
Property Value to Household Income Ratio in St Charles
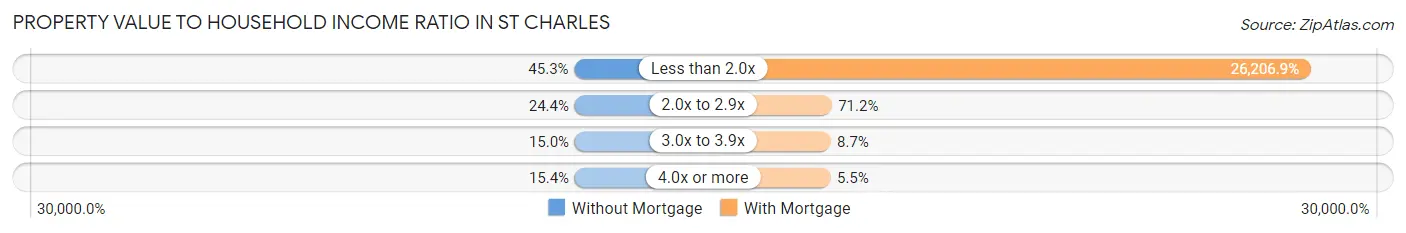
| Value-to-Income Ratio | Without Mortgage | With Mortgage |
| Less than 2.0x | 115 (45.3%) | 90,938 (26,206.9%) |
| 2.0x to 2.9x | 62 (24.4%) | 247 (71.2%) |
| 3.0x to 3.9x | 38 (15.0%) | 30 (8.6%) |
| 4.0x or more | 39 (15.3%) | 19 (5.5%) |
| Total | 254 (100.0%) | 347 (100.0%) |
Real Estate Taxes by Mortgage Status in St Charles
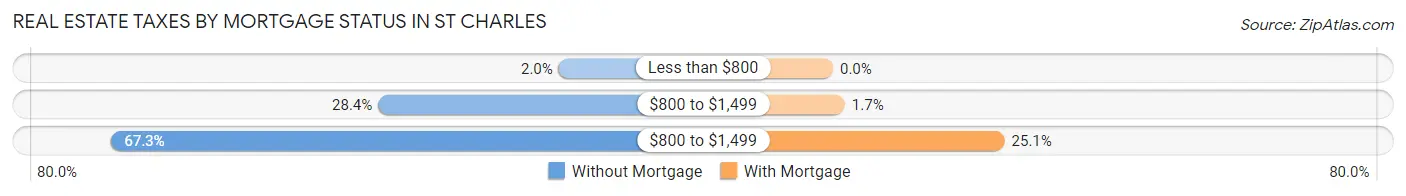
| Property Taxes | Without Mortgage | With Mortgage |
| Less than $800 | 5 (2.0%) | 0 (0.0%) |
| $800 to $1,499 | 72 (28.3%) | 6 (1.7%) |
| $800 to $1,499 | 171 (67.3%) | 87 (25.1%) |
| Total | 254 (100.0%) | 347 (100.0%) |
Health & Disability in St Charles
Health Insurance Coverage by Age in St Charles
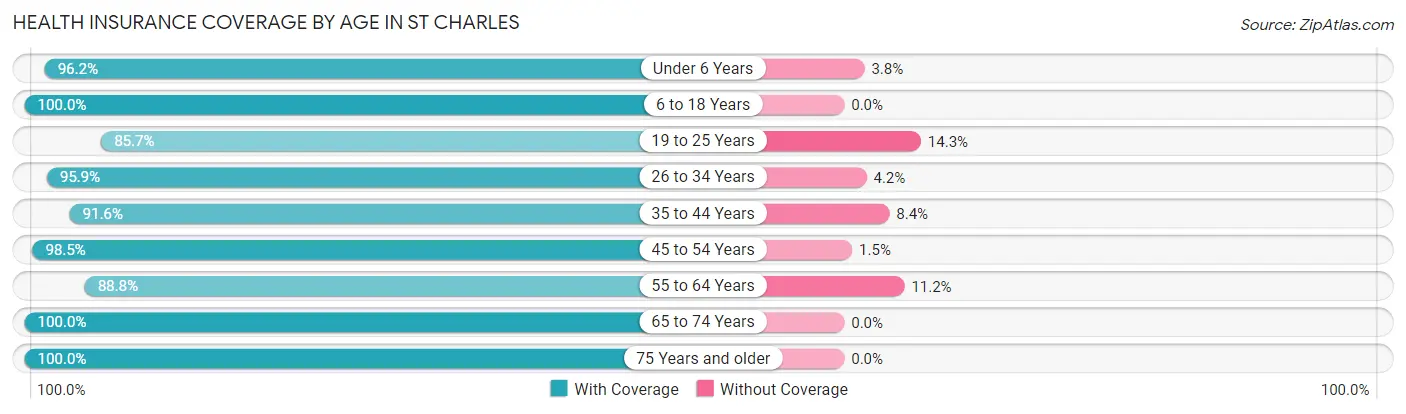
| Age Bracket | With Coverage | Without Coverage |
| Under 6 Years | 128 (96.2%) | 5 (3.8%) |
| 6 to 18 Years | 354 (100.0%) | 0 (0.0%) |
| 19 to 25 Years | 120 (85.7%) | 20 (14.3%) |
| 26 to 34 Years | 231 (95.9%) | 10 (4.2%) |
| 35 to 44 Years | 109 (91.6%) | 10 (8.4%) |
| 45 to 54 Years | 334 (98.5%) | 5 (1.5%) |
| 55 to 64 Years | 269 (88.8%) | 34 (11.2%) |
| 65 to 74 Years | 278 (100.0%) | 0 (0.0%) |
| 75 Years and older | 92 (100.0%) | 0 (0.0%) |
| Total | 1,915 (95.8%) | 84 (4.2%) |
Health Insurance Coverage by Citizenship Status in St Charles
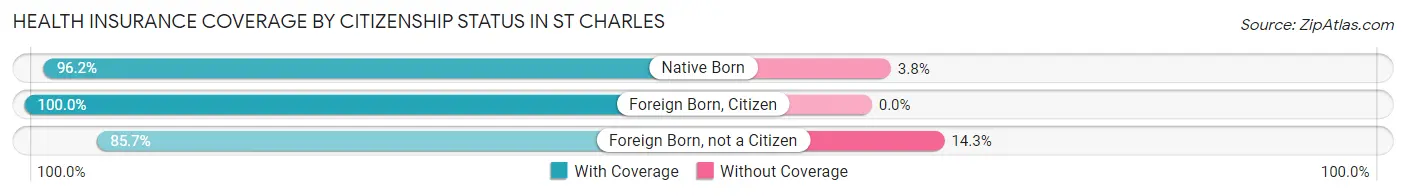
| Citizenship Status | With Coverage | Without Coverage |
| Native Born | 128 (96.2%) | 5 (3.8%) |
| Foreign Born, Citizen | 354 (100.0%) | 0 (0.0%) |
| Foreign Born, not a Citizen | 120 (85.7%) | 20 (14.3%) |
Health Insurance Coverage by Household Income in St Charles
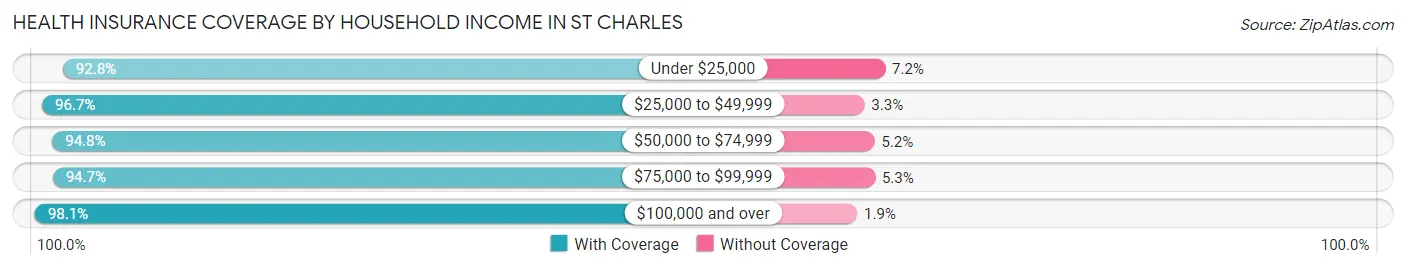
| Household Income | With Coverage | Without Coverage |
| Under $25,000 | 388 (92.8%) | 30 (7.2%) |
| $25,000 to $49,999 | 293 (96.7%) | 10 (3.3%) |
| $50,000 to $74,999 | 292 (94.8%) | 16 (5.2%) |
| $75,000 to $99,999 | 269 (94.7%) | 15 (5.3%) |
| $100,000 and over | 658 (98.1%) | 13 (1.9%) |
Public vs Private Health Insurance Coverage by Age in St Charles
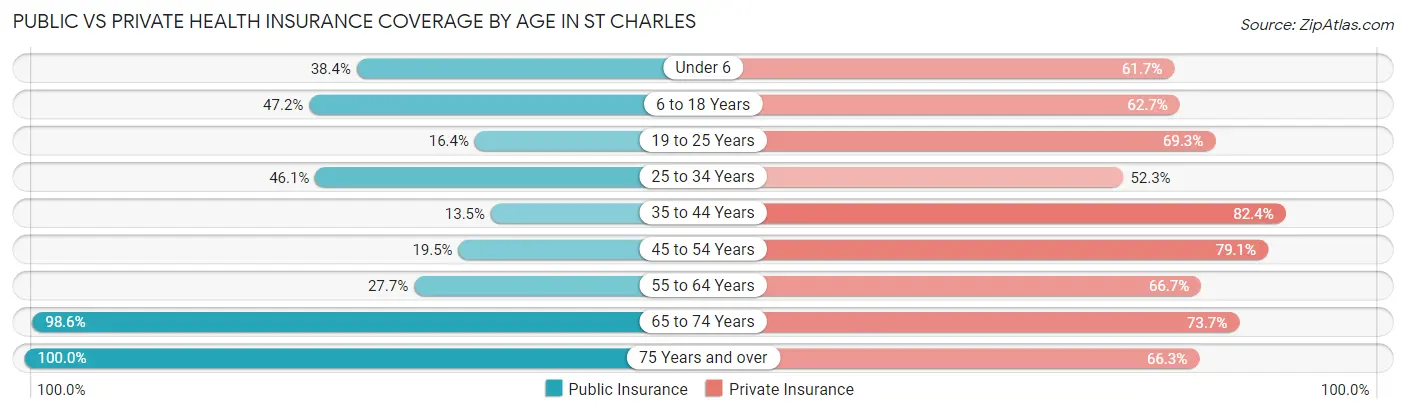
| Age Bracket | Public Insurance | Private Insurance |
| Under 6 | 51 (38.4%) | 82 (61.7%) |
| 6 to 18 Years | 167 (47.2%) | 222 (62.7%) |
| 19 to 25 Years | 23 (16.4%) | 97 (69.3%) |
| 25 to 34 Years | 111 (46.1%) | 126 (52.3%) |
| 35 to 44 Years | 16 (13.5%) | 98 (82.4%) |
| 45 to 54 Years | 66 (19.5%) | 268 (79.1%) |
| 55 to 64 Years | 84 (27.7%) | 202 (66.7%) |
| 65 to 74 Years | 274 (98.6%) | 205 (73.7%) |
| 75 Years and over | 92 (100.0%) | 61 (66.3%) |
| Total | 884 (44.2%) | 1,361 (68.1%) |
Disability Status by Sex by Age in St Charles
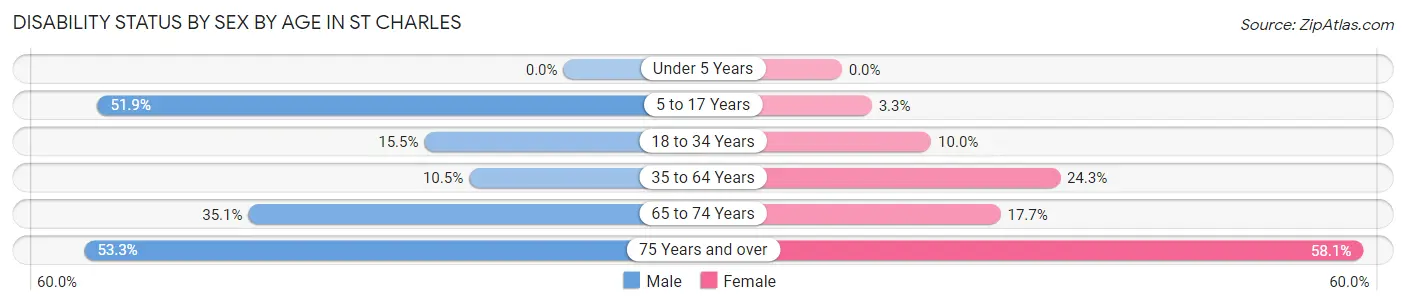
| Age Bracket | Male | Female |
| Under 5 Years | 0 (0.0%) | 0 (0.0%) |
| 5 to 17 Years | 97 (51.9%) | 6 (3.3%) |
| 18 to 34 Years | 33 (15.5%) | 19 (10.0%) |
| 35 to 64 Years | 35 (10.5%) | 104 (24.3%) |
| 65 to 74 Years | 40 (35.1%) | 29 (17.7%) |
| 75 Years and over | 16 (53.3%) | 36 (58.1%) |
Disability Class by Sex by Age in St Charles
Disability Class: Hearing Difficulty
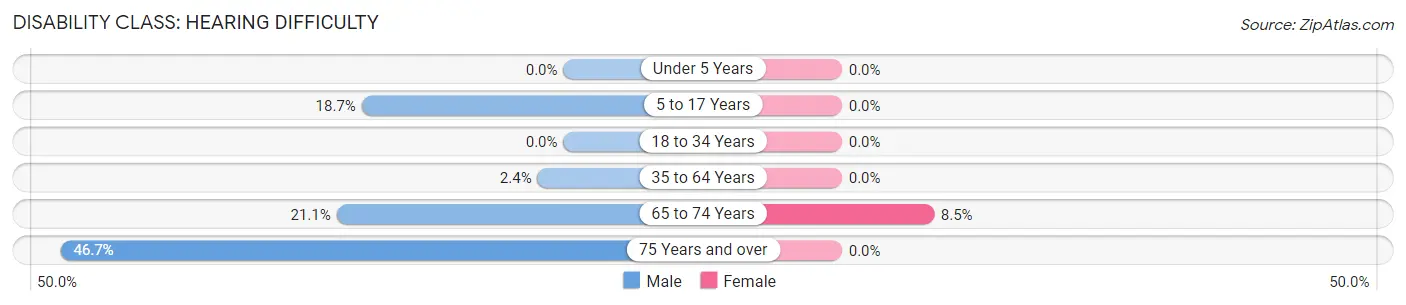
| Age Bracket | Male | Female |
| Under 5 Years | 0 (0.0%) | 0 (0.0%) |
| 5 to 17 Years | 35 (18.7%) | 0 (0.0%) |
| 18 to 34 Years | 0 (0.0%) | 0 (0.0%) |
| 35 to 64 Years | 8 (2.4%) | 0 (0.0%) |
| 65 to 74 Years | 24 (21.0%) | 14 (8.5%) |
| 75 Years and over | 14 (46.7%) | 0 (0.0%) |
Disability Class: Vision Difficulty
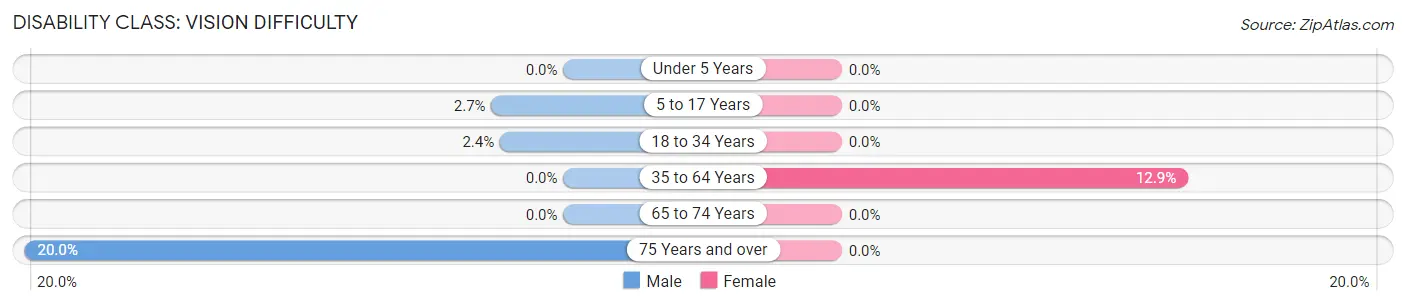
| Age Bracket | Male | Female |
| Under 5 Years | 0 (0.0%) | 0 (0.0%) |
| 5 to 17 Years | 5 (2.7%) | 0 (0.0%) |
| 18 to 34 Years | 5 (2.4%) | 0 (0.0%) |
| 35 to 64 Years | 0 (0.0%) | 55 (12.9%) |
| 65 to 74 Years | 0 (0.0%) | 0 (0.0%) |
| 75 Years and over | 6 (20.0%) | 0 (0.0%) |
Disability Class: Cognitive Difficulty
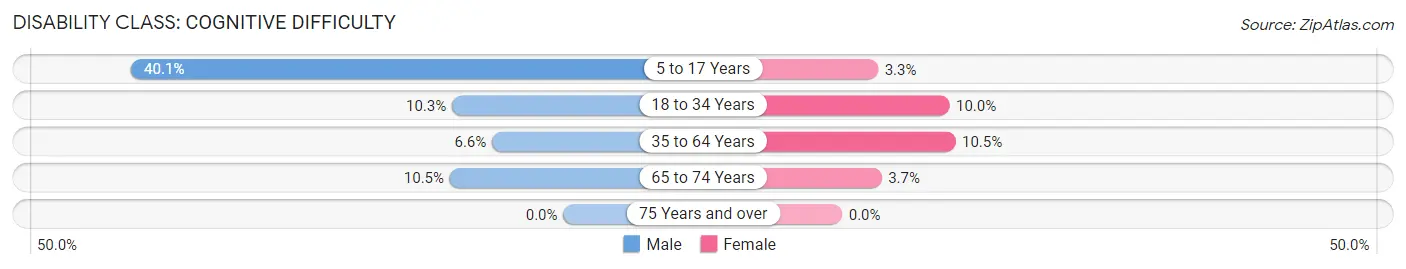
| Age Bracket | Male | Female |
| 5 to 17 Years | 75 (40.1%) | 6 (3.3%) |
| 18 to 34 Years | 22 (10.3%) | 19 (10.0%) |
| 35 to 64 Years | 22 (6.6%) | 45 (10.5%) |
| 65 to 74 Years | 12 (10.5%) | 6 (3.7%) |
| 75 Years and over | 0 (0.0%) | 0 (0.0%) |
Disability Class: Ambulatory Difficulty
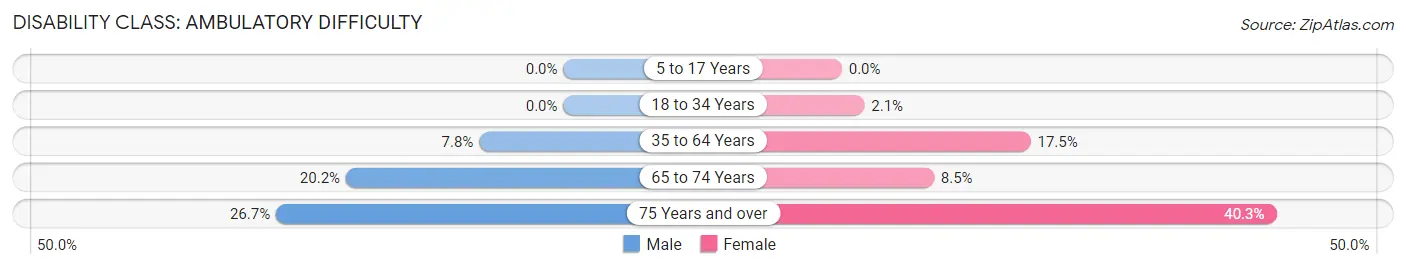
| Age Bracket | Male | Female |
| 5 to 17 Years | 0 (0.0%) | 0 (0.0%) |
| 18 to 34 Years | 0 (0.0%) | 4 (2.1%) |
| 35 to 64 Years | 26 (7.8%) | 75 (17.5%) |
| 65 to 74 Years | 23 (20.2%) | 14 (8.5%) |
| 75 Years and over | 8 (26.7%) | 25 (40.3%) |
Disability Class: Self-Care Difficulty
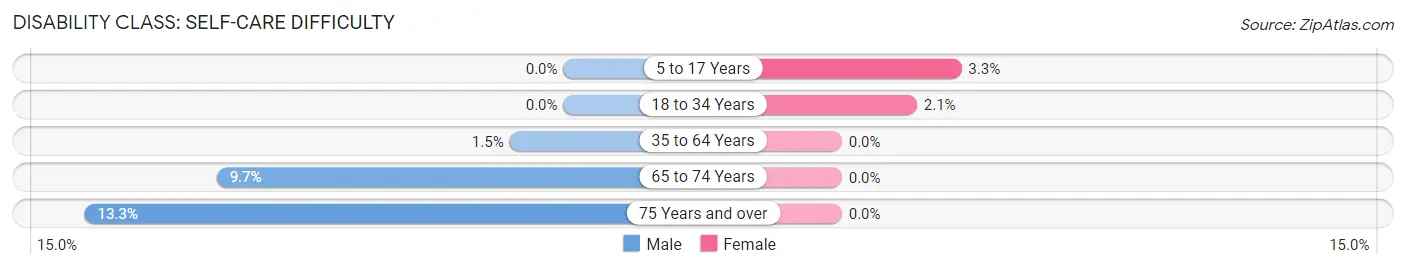
| Age Bracket | Male | Female |
| 5 to 17 Years | 0 (0.0%) | 6 (3.3%) |
| 18 to 34 Years | 0 (0.0%) | 4 (2.1%) |
| 35 to 64 Years | 5 (1.5%) | 0 (0.0%) |
| 65 to 74 Years | 11 (9.7%) | 0 (0.0%) |
| 75 Years and over | 4 (13.3%) | 0 (0.0%) |
Technology Access in St Charles
Computing Device Access in St Charles
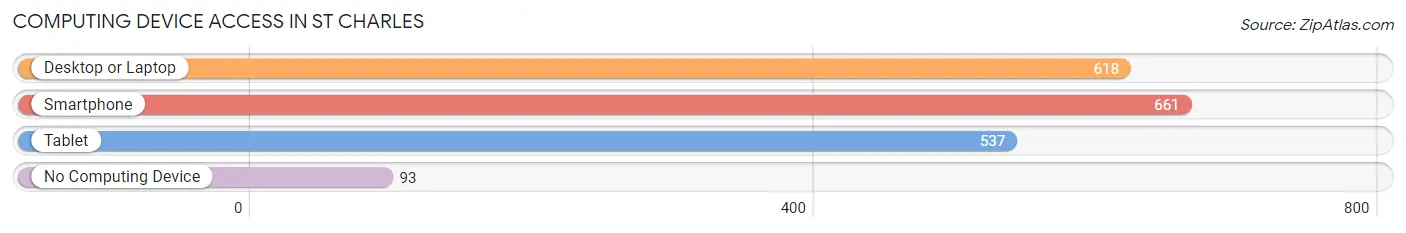
| Device Type | # Households | % Households |
| Desktop or Laptop | 618 | 76.1% |
| Smartphone | 661 | 81.4% |
| Tablet | 537 | 66.1% |
| No Computing Device | 93 | 11.5% |
| Total | 812 | 100.0% |
Internet Access in St Charles
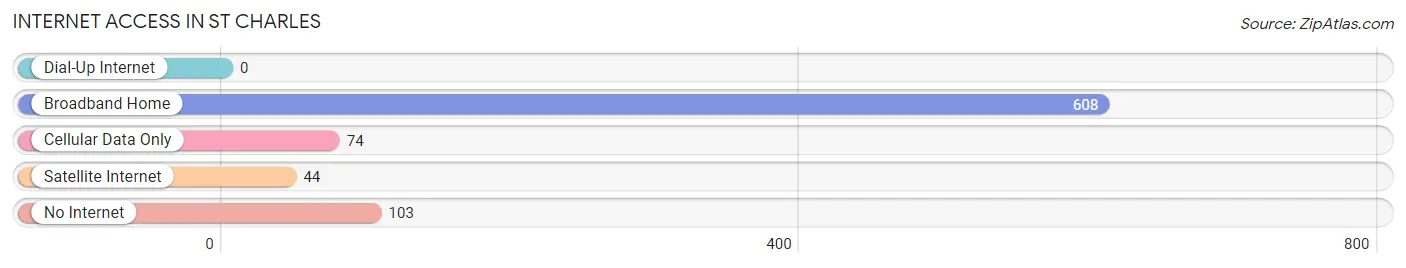
| Internet Type | # Households | % Households |
| Dial-Up Internet | 0 | 0.0% |
| Broadband Home | 608 | 74.9% |
| Cellular Data Only | 74 | 9.1% |
| Satellite Internet | 44 | 5.4% |
| No Internet | 103 | 12.7% |
| Total | 812 | 100.0% |
St Charles Summary
St. Charles is a small city located in Saginaw County, Michigan. It is situated on the banks of the Cass River, about 10 miles south of Saginaw. The city has a population of approximately 2,500 people and is part of the Saginaw Metropolitan Statistical Area.
History
St. Charles was first settled in 1837 by a group of German immigrants led by John and Mary Schmieder. The Schmieders named the settlement after their hometown of St. Charles, Germany. The settlement grew slowly, but by the late 19th century, it had become a thriving community. The city was incorporated in 1887 and was home to a variety of businesses, including a sawmill, a grist mill, a brickyard, and a furniture factory.
In the early 20th century, St. Charles experienced a period of growth and prosperity. The city was home to several large factories, including the St. Charles Foundry and Machine Company, which produced agricultural equipment. The city also had a thriving downtown area, with several stores and restaurants.
Geography
St. Charles is located in Saginaw County, Michigan. It is situated on the banks of the Cass River, about 10 miles south of Saginaw. The city has a total area of 1.7 square miles, all of which is land. The terrain is mostly flat, with some rolling hills in the northern part of the city.
The climate in St. Charles is humid continental, with cold winters and hot, humid summers. The average annual temperature is around 50°F, with an average high of around 70°F in the summer and an average low of around 30°F in the winter.
Economy
St. Charles is a small city with a limited economy. The city’s largest employer is the St. Charles Foundry and Machine Company, which produces agricultural equipment. Other major employers include the St. Charles Medical Center, the St. Charles School District, and several small businesses.
The city also has a small tourism industry, with several bed and breakfasts and a few restaurants. The city is also home to several parks and recreational areas, including the St. Charles Nature Preserve and the St. Charles State Park.
Demographics
As of the 2010 census, St. Charles had a population of 2,521 people. The racial makeup of the city was 95.2% White, 1.2% African American, 0.7% Native American, 0.4% Asian, 0.1% Pacific Islander, 0.7% from other races, and 1.7% from two or more races. Hispanic or Latino of any race were 2.2% of the population.
The median household income in St. Charles was $41,944, and the median family income was $50,938. The per capita income was $20,945. About 11.2% of the population was below the poverty line.
St. Charles is a small city with a rich history and a diverse population. The city has a limited economy, but it is home to several businesses and recreational areas. The city is also home to a variety of cultural and historical attractions, making it a great place to visit or live.
Common Questions
What is Per Capita Income in St Charles?
Per Capita income in St Charles is $28,581.
What is the Median Family Income in St Charles?
Median Family Income in St Charles is $71,375.
What is the Median Household income in St Charles?
Median Household Income in St Charles is $51,875.
What is Income or Wage Gap in St Charles?
Income or Wage Gap in St Charles is 29.6%.
Women in St Charles earn 70.4 cents for every dollar earned by a man.
What is Family Income Deficit in St Charles?
Family Income Deficit in St Charles is $5,863.
Families that are below poverty line in St Charles earn $5,863 less on average than the poverty threshold level.
What is Inequality or Gini Index in St Charles?
Inequality or Gini Index in St Charles is 0.48.
What is the Total Population of St Charles?
Total Population of St Charles is 2,020.
What is the Total Male Population of St Charles?
Total Male Population of St Charles is 955.
What is the Total Female Population of St Charles?
Total Female Population of St Charles is 1,065.
What is the Ratio of Males per 100 Females in St Charles?
There are 89.67 Males per 100 Females in St Charles.
What is the Ratio of Females per 100 Males in St Charles?
There are 111.52 Females per 100 Males in St Charles.
What is the Median Population Age in St Charles?
Median Population Age in St Charles is 45.4 Years.
What is the Average Family Size in St Charles
Average Family Size in St Charles is 3.0 People.
What is the Average Household Size in St Charles
Average Household Size in St Charles is 2.4 People.
How Large is the Labor Force in St Charles?
There are 879 People in the Labor Forcein in St Charles.
What is the Percentage of People in the Labor Force in St Charles?
55.1% of People are in the Labor Force in St Charles.
What is the Unemployment Rate in St Charles?
Unemployment Rate in St Charles is 4.7%.