Cities with the Highest Percentage of Immigrants from Thailand in Michigan
RELATED REPORTS & OPTIONS
Thailand
Michigan
Compare Cities
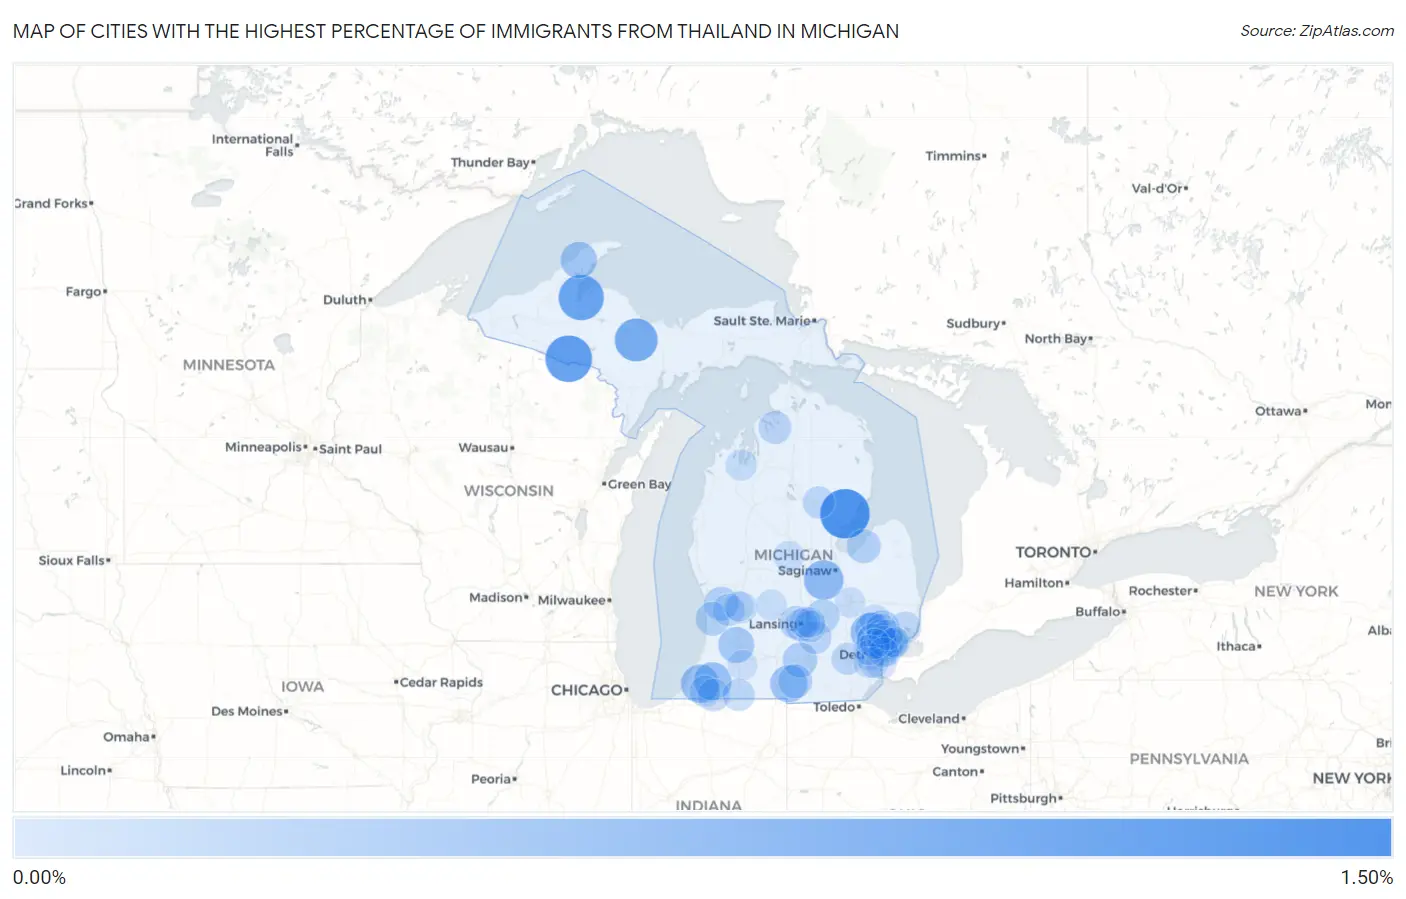
Map of Cities with the Highest Percentage of Immigrants from Thailand in Michigan
0.00%
1.50%
Cities with the Highest Percentage of Immigrants from Thailand in Michigan
| City | Thailand | vs State | vs National | |
| 1. | Turner | 1.35% | 0.031%(+1.32)#-1 | 0.077%(+1.27)#0 |
| 2. | Caspian | 1.15% | 0.031%(+1.12)#0 | 0.077%(+1.07)#1 |
| 3. | Zeba | 1.05% | 0.031%(+1.02)#1 | 0.077%(+0.970)#2 |
| 4. | Gwinn | 0.88% | 0.031%(+0.845)#2 | 0.077%(+0.798)#3 |
| 5. | St Charles | 0.64% | 0.031%(+0.613)#3 | 0.077%(+0.566)#4 |
| 6. | Sylvan Lake | 0.58% | 0.031%(+0.548)#4 | 0.077%(+0.501)#5 |
| 7. | Berrien Springs | 0.54% | 0.031%(+0.513)#5 | 0.077%(+0.467)#25 |
| 8. | Dowagiac | 0.53% | 0.031%(+0.498)#6 | 0.077%(+0.451)#26 |
| 9. | Allen | 0.47% | 0.031%(+0.439)#7 | 0.077%(+0.392)#27 |
| 10. | Calumet | 0.42% | 0.031%(+0.387)#8 | 0.077%(+0.340)#28 |
| 11. | Otsego | 0.39% | 0.031%(+0.361)#9 | 0.077%(+0.314)#29 |
| 12. | Pontiac | 0.34% | 0.031%(+0.307)#10 | 0.077%(+0.260)#30 |
| 13. | Hazel Park | 0.33% | 0.031%(+0.295)#11 | 0.077%(+0.248)#31 |
| 14. | Parma | 0.30% | 0.031%(+0.271)#12 | 0.077%(+0.224)#32 |
| 15. | Rochester | 0.28% | 0.031%(+0.247)#13 | 0.077%(+0.200)#33 |
| 16. | Allendale | 0.26% | 0.031%(+0.231)#14 | 0.077%(+0.184)#34 |
| 17. | Jonesville | 0.26% | 0.031%(+0.230)#15 | 0.077%(+0.183)#35 |
| 18. | Sebewaing | 0.26% | 0.031%(+0.226)#16 | 0.077%(+0.179)#36 |
| 19. | Beechwood | 0.25% | 0.031%(+0.219)#17 | 0.077%(+0.172)#37 |
| 20. | Bingham Farms | 0.25% | 0.031%(+0.216)#18 | 0.077%(+0.169)#38 |
| 21. | Morrice | 0.24% | 0.031%(+0.210)#19 | 0.077%(+0.163)#39 |
| 22. | Waverly | 0.20% | 0.031%(+0.167)#20 | 0.077%(+0.121)#40 |
| 23. | Dansville | 0.19% | 0.031%(+0.158)#21 | 0.077%(+0.111)#41 |
| 24. | Boyne City | 0.18% | 0.031%(+0.153)#22 | 0.077%(+0.106)#42 |
| 25. | Lansing | 0.18% | 0.031%(+0.148)#23 | 0.077%(+0.101)#730 |
| 26. | Edwardsburg | 0.16% | 0.031%(+0.127)#24 | 0.077%(+0.081)#731 |
| 27. | Huntington Woods | 0.16% | 0.031%(+0.126)#25 | 0.077%(+0.080)#732 |
| 28. | Franklin | 0.15% | 0.031%(+0.120)#26 | 0.077%(+0.073)#733 |
| 29. | Warren | 0.14% | 0.031%(+0.109)#27 | 0.077%(+0.062)#734 |
| 30. | Jenison | 0.14% | 0.031%(+0.108)#28 | 0.077%(+0.061)#735 |
| 31. | West Branch | 0.14% | 0.031%(+0.106)#29 | 0.077%(+0.059)#736 |
| 32. | White Pigeon | 0.13% | 0.031%(+0.099)#30 | 0.077%(+0.052)#737 |
| 33. | Ann Arbor | 0.13% | 0.031%(+0.095)#31 | 0.077%(+0.049)#738 |
| 34. | Hamtramck | 0.13% | 0.031%(+0.095)#32 | 0.077%(+0.048)#739 |
| 35. | Okemos | 0.11% | 0.031%(+0.083)#33 | 0.077%(+0.036)#740 |
| 36. | New Baltimore | 0.11% | 0.031%(+0.077)#34 | 0.077%(+0.030)#741 |
| 37. | Troy | 0.089% | 0.031%(+0.059)#35 | 0.077%(+0.012)#742 |
| 38. | East Grand Rapids | 0.088% | 0.031%(+0.057)#36 | 0.077%(+0.010)#743 |
| 39. | Niles | 0.084% | 0.031%(+0.054)#37 | 0.077%(+0.007)#744 |
| 40. | Traverse City | 0.078% | 0.031%(+0.047)#38 | 0.077%(+0.000)#745 |
| 41. | Roseville | 0.072% | 0.031%(+0.041)#39 | 0.077%(-0.006)#746 |
| 42. | Ferndale | 0.067% | 0.031%(+0.037)#40 | 0.077%(-0.010)#747 |
| 43. | East Lansing | 0.053% | 0.031%(+0.022)#41 | 0.077%(-0.025)#748 |
| 44. | Eastpointe | 0.047% | 0.031%(+0.016)#42 | 0.077%(-0.031)#749 |
| 45. | Garden City | 0.044% | 0.031%(+0.013)#43 | 0.077%(-0.033)#750 |
| 46. | Clawson | 0.044% | 0.031%(+0.013)#44 | 0.077%(-0.034)#751 |
| 47. | Romulus | 0.044% | 0.031%(+0.013)#45 | 0.077%(-0.034)#752 |
| 48. | Mount Pleasant | 0.041% | 0.031%(+0.011)#46 | 0.077%(-0.036)#753 |
| 49. | Ionia | 0.038% | 0.031%(+0.008)#47 | 0.077%(-0.039)#754 |
| 50. | Haslett | 0.037% | 0.031%(+0.006)#48 | 0.077%(-0.041)#755 |
| 51. | Wyandotte | 0.036% | 0.031%(+0.006)#49 | 0.077%(-0.041)#756 |
| 52. | Lake Orion | 0.034% | 0.031%(+0.004)#50 | 0.077%(-0.043)#757 |
| 53. | Madison Heights | 0.032% | 0.031%(+0.001)#51 | 0.077%(-0.046)#758 |
| 54. | Taylor | 0.029% | 0.031%(-0.002)#52 | 0.077%(-0.049)#759 |
| 55. | Flint | 0.027% | 0.031%(-0.004)#53 | 0.077%(-0.051)#760 |
| 56. | Sterling Heights | 0.025% | 0.031%(-0.005)#54 | 0.077%(-0.052)#761 |
| 57. | Livonia | 0.021% | 0.031%(-0.010)#55 | 0.077%(-0.056)#762 |
| 58. | Rochester Hills | 0.017% | 0.031%(-0.014)#56 | 0.077%(-0.060)#763 |
| 59. | St Clair Shores | 0.017% | 0.031%(-0.014)#57 | 0.077%(-0.060)#764 |
| 60. | Grand Rapids | 0.0081% | 0.031%(-0.023)#58 | 0.077%(-0.069)#765 |
| 61. | Detroit | 0.0033% | 0.031%(-0.027)#59 | 0.077%(-0.074)#766 |
| 62. | Southfield | 0.0026% | 0.031%(-0.028)#60 | 0.077%(-0.075)#767 |
| 63. | Portage | 0.0020% | 0.031%(-0.029)#61 | 0.077%(-0.075)#768 |
Common Questions
What are the Top 10 Cities with the Highest Percentage of Immigrants from Thailand in Michigan?
Top 10 Cities with the Highest Percentage of Immigrants from Thailand in Michigan are:
#1
1.35%
#2
1.15%
#3
1.05%
#4
0.88%
#5
0.64%
#6
0.58%
#7
0.54%
#8
0.53%
#9
0.47%
#10
0.42%
What city has the Highest Percentage of Immigrants from Thailand in Michigan?
Turner has the Highest Percentage of Immigrants from Thailand in Michigan with 1.35%.
What is the Percentage of Immigrants from Thailand in the State of Michigan?
Percentage of Immigrants from Thailand in Michigan is 0.031%.
What is the Percentage of Immigrants from Thailand in the United States?
Percentage of Immigrants from Thailand in the United States is 0.077%.