Midland, MI Map & Demographics
Midland Map
Midland Overview
$43,155
PER CAPITA INCOME
$95,170
AVG FAMILY INCOME
$71,809
AVG HOUSEHOLD INCOME
29.7%
WAGE / INCOME GAP [ % ]
70.3¢/ $1
WAGE / INCOME GAP [ $ ]
$11,964
FAMILY INCOME DEFICIT
0.47
INEQUALITY / GINI INDEX
42,404
TOTAL POPULATION
20,647
MALE POPULATION
21,757
FEMALE POPULATION
94.90
MALES / 100 FEMALES
105.38
FEMALES / 100 MALES
38.8
MEDIAN AGE
3.0
AVG FAMILY SIZE
2.3
AVG HOUSEHOLD SIZE
20,413
LABOR FORCE [ PEOPLE ]
59.3%
PERCENT IN LABOR FORCE
4.5%
UNEMPLOYMENT RATE
Midland Area Codes
Income in Midland
Income Overview in Midland
Per Capita Income in Midland is $43,155, while median incomes of families and households are $95,170 and $71,809 respectively.
| Characteristic | Number | Measure |
| Per Capita Income | 42,404 | $43,155 |
| Median Family Income | 10,762 | $95,170 |
| Mean Family Income | 10,762 | $128,004 |
| Median Household Income | 17,976 | $71,809 |
| Mean Household Income | 17,976 | $99,857 |
| Income Deficit | 10,762 | $11,964 |
| Wage / Income Gap (%) | 42,404 | 29.67% |
| Wage / Income Gap ($) | 42,404 | 70.33¢ per $1 |
| Gini / Inequality Index | 42,404 | 0.47 |
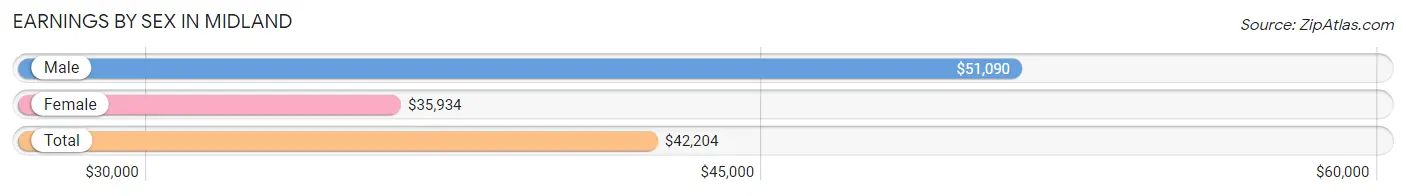
Earnings by Sex in Midland
Average Earnings in Midland are $42,204, $51,090 for men and $35,934 for women, a difference of 29.7%.
| Sex | Number | Average Earnings |
| Male | 11,066 (50.9%) | $51,090 |
| Female | 10,657 (49.1%) | $35,934 |
| Total | 21,723 (100.0%) | $42,204 |
Earnings by Sex by Income Bracket in Midland
The most common earnings brackets in Midland are $100,000+ for men (2,320 | 21.0%) and $100,000+ for women (987 | 9.3%).
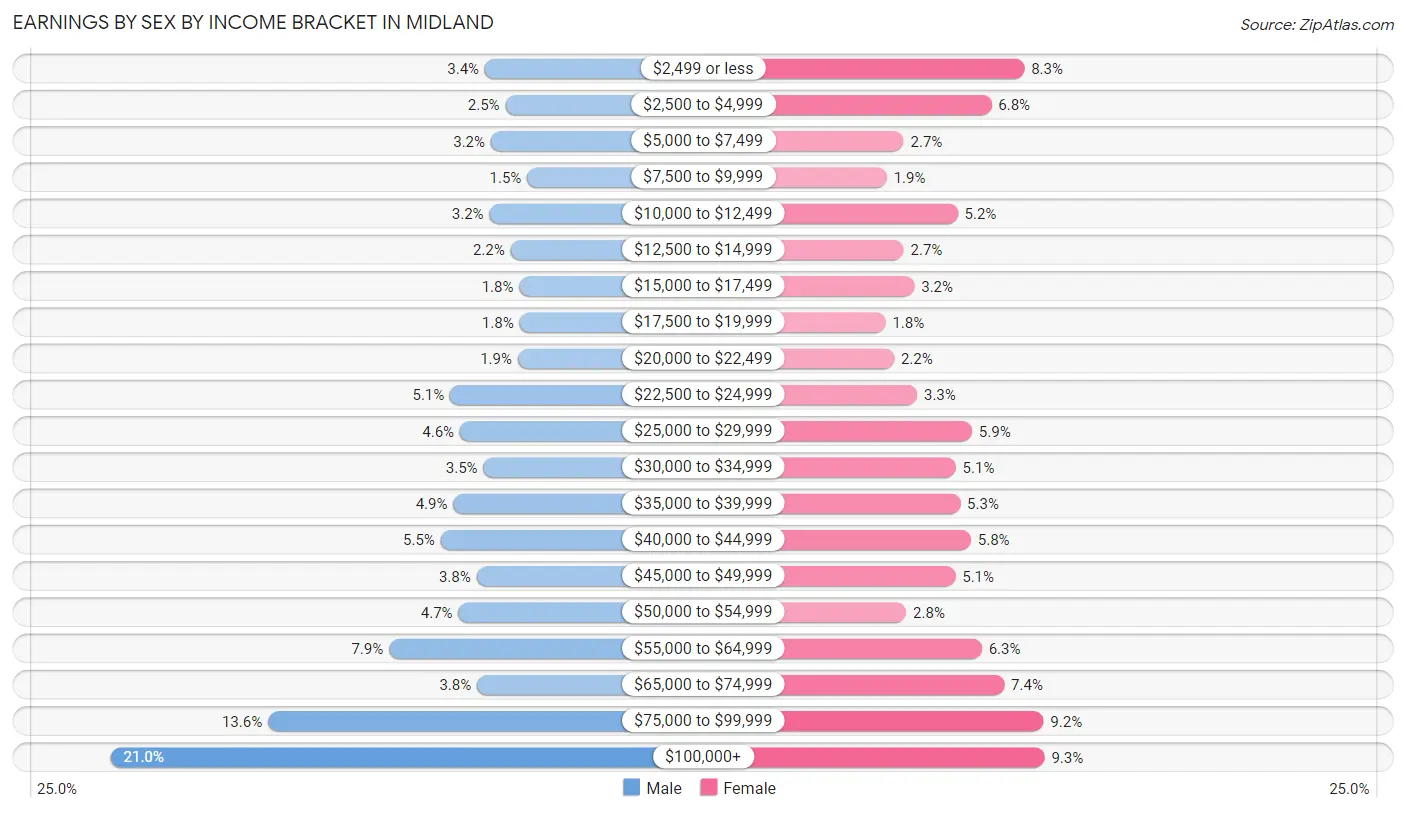
| Income | Male | Female |
| $2,499 or less | 381 (3.4%) | 886 (8.3%) |
| $2,500 to $4,999 | 274 (2.5%) | 721 (6.8%) |
| $5,000 to $7,499 | 350 (3.2%) | 283 (2.7%) |
| $7,500 to $9,999 | 162 (1.5%) | 199 (1.9%) |
| $10,000 to $12,499 | 357 (3.2%) | 553 (5.2%) |
| $12,500 to $14,999 | 248 (2.2%) | 283 (2.7%) |
| $15,000 to $17,499 | 203 (1.8%) | 337 (3.2%) |
| $17,500 to $19,999 | 201 (1.8%) | 193 (1.8%) |
| $20,000 to $22,499 | 210 (1.9%) | 236 (2.2%) |
| $22,500 to $24,999 | 561 (5.1%) | 351 (3.3%) |
| $25,000 to $29,999 | 510 (4.6%) | 624 (5.9%) |
| $30,000 to $34,999 | 388 (3.5%) | 543 (5.1%) |
| $35,000 to $39,999 | 545 (4.9%) | 566 (5.3%) |
| $40,000 to $44,999 | 610 (5.5%) | 619 (5.8%) |
| $45,000 to $49,999 | 424 (3.8%) | 541 (5.1%) |
| $50,000 to $54,999 | 518 (4.7%) | 296 (2.8%) |
| $55,000 to $64,999 | 877 (7.9%) | 673 (6.3%) |
| $65,000 to $74,999 | 422 (3.8%) | 785 (7.4%) |
| $75,000 to $99,999 | 1,505 (13.6%) | 981 (9.2%) |
| $100,000+ | 2,320 (21.0%) | 987 (9.3%) |
| Total | 11,066 (100.0%) | 10,657 (100.0%) |
Earnings by Sex by Educational Attainment in Midland
Average earnings in Midland are $58,549 for men and $42,818 for women, a difference of 26.9%. Men with an educational attainment of graduate degree enjoy the highest average annual earnings of $100,434, while those with less than high school education earn the least with $26,534. Women with an educational attainment of graduate degree earn the most with the average annual earnings of $67,460, while those with less than high school education have the smallest earnings of $12,100.
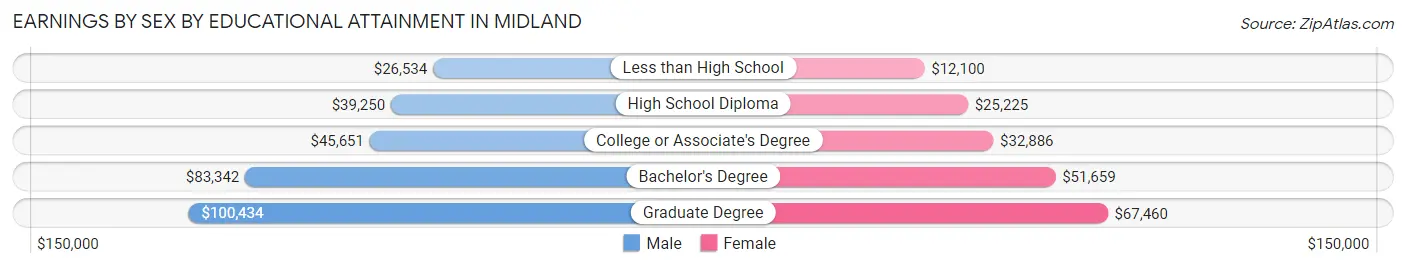
| Educational Attainment | Male Income | Female Income |
| Less than High School | $26,534 | $12,100 |
| High School Diploma | $39,250 | $25,225 |
| College or Associate's Degree | $45,651 | $32,886 |
| Bachelor's Degree | $83,342 | $51,659 |
| Graduate Degree | $100,434 | $67,460 |
| Total | $58,549 | $42,818 |
Family Income in Midland
Family Income Brackets in Midland
According to the Midland family income data, there are 2,023 families falling into the $100,000 to $149,999 income range, which is the most common income bracket and makes up 18.8% of all families. Conversely, the $10,000 to $14,999 income bracket is the least frequent group with only 140 families (1.3%) belonging to this category.
| Income Bracket | # Families | % Families |
| Less than $10,000 | 258 | 2.4% |
| $10,000 to $14,999 | 140 | 1.3% |
| $15,000 to $24,999 | 377 | 3.5% |
| $25,000 to $34,999 | 463 | 4.3% |
| $35,000 to $49,999 | 969 | 9.0% |
| $50,000 to $74,999 | 1,700 | 15.8% |
| $75,000 to $99,999 | 1,776 | 16.5% |
| $100,000 to $149,999 | 2,023 | 18.8% |
| $150,000 to $199,999 | 1,238 | 11.5% |
| $200,000+ | 1,808 | 16.8% |
Family Income by Famaliy Size in Midland
7+ person families (196 | 1.8%) account for the highest median family income in Midland with $215,179 per family, while 2-person families (4,976 | 46.2%) have the highest median income of $43,972 per family member.
| Income Bracket | # Families | Median Income |
| 2-Person Families | 4,976 (46.2%) | $87,943 |
| 3-Person Families | 2,480 (23.0%) | $104,375 |
| 4-Person Families | 1,887 (17.5%) | $109,137 |
| 5-Person Families | 827 (7.7%) | $103,068 |
| 6-Person Families | 396 (3.7%) | $79,262 |
| 7+ Person Families | 196 (1.8%) | $215,179 |
| Total | 10,762 (100.0%) | $95,170 |
Family Income by Number of Earners in Midland
The median family income in Midland is $95,170, with families comprising 3+ earners (1,067) having the highest median family income of $158,875, while families with no earners (2,123) have the lowest median family income of $72,313, accounting for 9.9% and 19.7% of families, respectively.
| Number of Earners | # Families | Median Income |
| No Earners | 2,123 (19.7%) | $72,313 |
| 1 Earner | 3,081 (28.6%) | $74,087 |
| 2 Earners | 4,491 (41.7%) | $115,625 |
| 3+ Earners | 1,067 (9.9%) | $158,875 |
| Total | 10,762 (100.0%) | $95,170 |
Household Income in Midland
Household Income Brackets in Midland
With 2,876 households falling in the category, the $50,000 to $74,999 income range is the most frequent in Midland, accounting for 16.0% of all households. In contrast, only 701 households (3.9%) fall into the $10,000 to $14,999 income bracket, making it the least populous group.
| Income Bracket | # Households | % Households |
| Less than $10,000 | 845 | 4.7% |
| $10,000 to $14,999 | 701 | 3.9% |
| $15,000 to $24,999 | 1,348 | 7.5% |
| $25,000 to $34,999 | 1,474 | 8.2% |
| $35,000 to $49,999 | 2,049 | 11.4% |
| $50,000 to $74,999 | 2,876 | 16.0% |
| $75,000 to $99,999 | 2,589 | 14.4% |
| $100,000 to $149,999 | 2,607 | 14.5% |
| $150,000 to $199,999 | 1,510 | 8.4% |
| $200,000+ | 1,941 | 10.8% |
Household Income by Householder Age in Midland
The median household income in Midland is $71,809, with the highest median household income of $83,762 found in the 45 to 64 years age bracket for the primary householder. A total of 5,989 households (33.3%) fall into this category. Meanwhile, the 15 to 24 years age bracket for the primary householder has the lowest median household income of $39,231, with 904 households (5.0%) in this group.
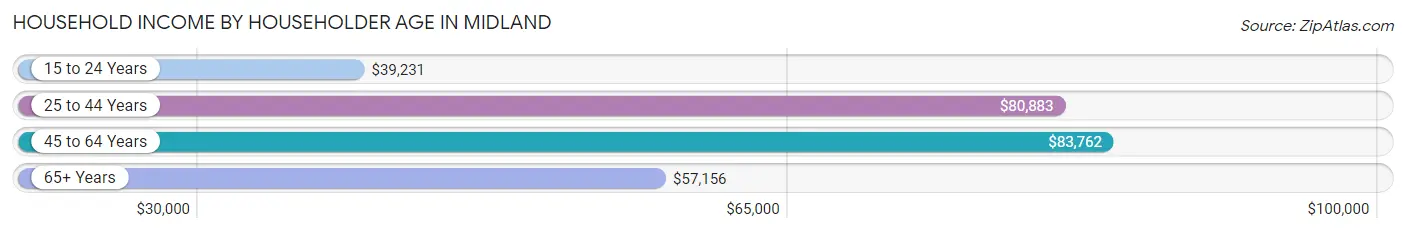
| Income Bracket | # Households | Median Income |
| 15 to 24 Years | 904 (5.0%) | $39,231 |
| 25 to 44 Years | 5,809 (32.3%) | $80,883 |
| 45 to 64 Years | 5,989 (33.3%) | $83,762 |
| 65+ Years | 5,274 (29.3%) | $57,156 |
| Total | 17,976 (100.0%) | $71,809 |
Poverty in Midland
Income Below Poverty by Sex and Age in Midland
With 9.0% poverty level for males and 9.4% for females among the residents of Midland, 18 to 24 year old males and under 5 year old females are the most vulnerable to poverty, with 386 males (20.5%) and 146 females (13.9%) in their respective age groups living below the poverty level.
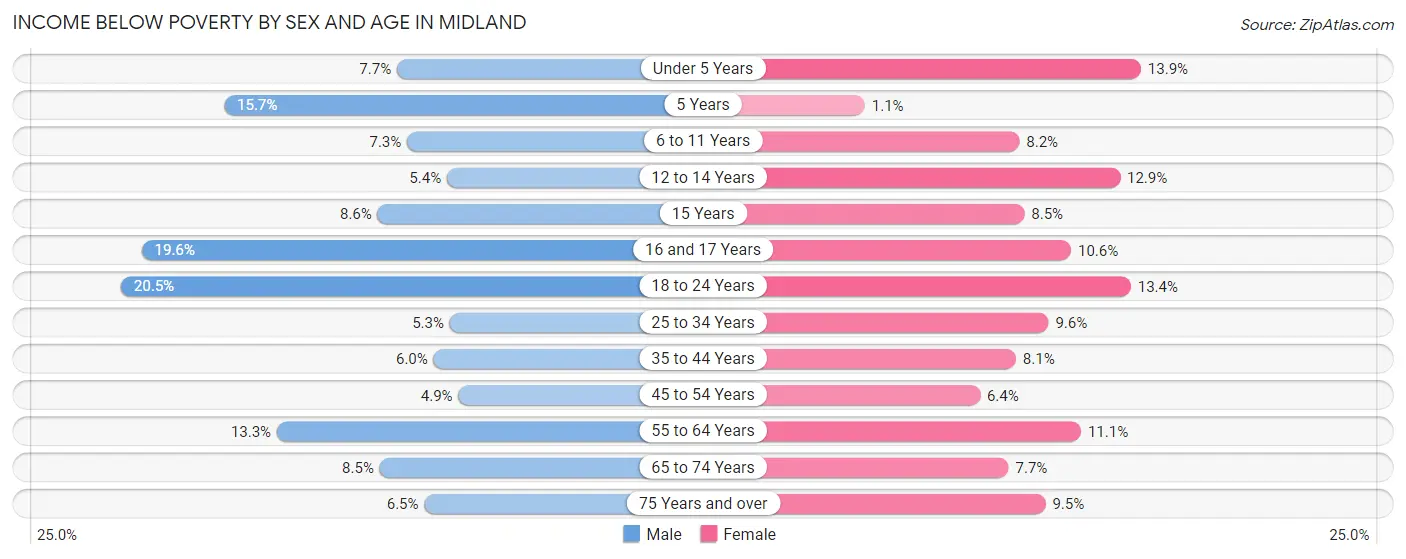
| Age Bracket | Male | Female |
| Under 5 Years | 97 (7.7%) | 146 (13.9%) |
| 5 Years | 37 (15.7%) | 4 (1.1%) |
| 6 to 11 Years | 112 (7.2%) | 129 (8.2%) |
| 12 to 14 Years | 39 (5.4%) | 87 (12.9%) |
| 15 Years | 20 (8.6%) | 25 (8.5%) |
| 16 and 17 Years | 100 (19.6%) | 55 (10.6%) |
| 18 to 24 Years | 386 (20.5%) | 228 (13.4%) |
| 25 to 34 Years | 150 (5.3%) | 290 (9.6%) |
| 35 to 44 Years | 165 (6.0%) | 206 (8.1%) |
| 45 to 54 Years | 103 (4.9%) | 146 (6.4%) |
| 55 to 64 Years | 346 (13.3%) | 298 (11.1%) |
| 65 to 74 Years | 159 (8.5%) | 170 (7.7%) |
| 75 Years and over | 99 (6.5%) | 229 (9.5%) |
| Total | 1,813 (9.0%) | 2,013 (9.4%) |
Income Above Poverty by Sex and Age in Midland
According to the poverty statistics in Midland, males aged 45 to 54 years and females aged 5 years are the age groups that are most secure financially, with 95.1% of males and 98.9% of females in these age groups living above the poverty line.
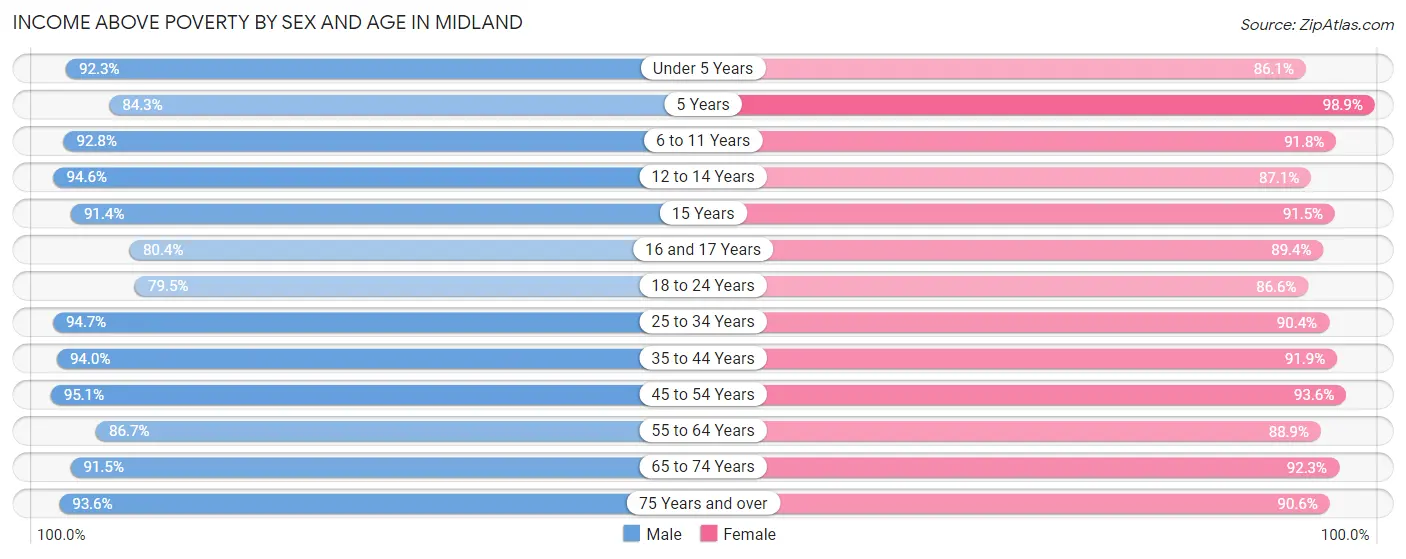
| Age Bracket | Male | Female |
| Under 5 Years | 1,160 (92.3%) | 906 (86.1%) |
| 5 Years | 198 (84.3%) | 371 (98.9%) |
| 6 to 11 Years | 1,432 (92.7%) | 1,436 (91.8%) |
| 12 to 14 Years | 683 (94.6%) | 587 (87.1%) |
| 15 Years | 212 (91.4%) | 270 (91.5%) |
| 16 and 17 Years | 411 (80.4%) | 462 (89.4%) |
| 18 to 24 Years | 1,494 (79.5%) | 1,472 (86.6%) |
| 25 to 34 Years | 2,697 (94.7%) | 2,734 (90.4%) |
| 35 to 44 Years | 2,577 (94.0%) | 2,345 (91.9%) |
| 45 to 54 Years | 2,012 (95.1%) | 2,131 (93.6%) |
| 55 to 64 Years | 2,257 (86.7%) | 2,387 (88.9%) |
| 65 to 74 Years | 1,707 (91.5%) | 2,027 (92.3%) |
| 75 Years and over | 1,435 (93.5%) | 2,193 (90.5%) |
| Total | 18,275 (91.0%) | 19,321 (90.6%) |
Income Below Poverty Among Married-Couple Families in Midland
The poverty statistics for married-couple families in Midland show that 3.6% or 315 of the total 8,656 families live below the poverty line. Families with 3 or 4 children have the highest poverty rate of 8.8%, comprising of 96 families. On the other hand, families with 5 or more children have the lowest poverty rate of 0.0%, which includes 0 families.
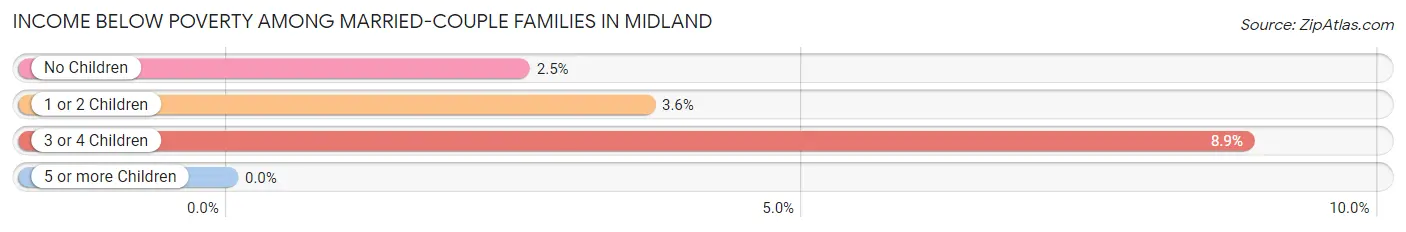
| Children | Above Poverty | Below Poverty |
| No Children | 4,718 (97.5%) | 123 (2.5%) |
| 1 or 2 Children | 2,545 (96.4%) | 96 (3.6%) |
| 3 or 4 Children | 989 (91.1%) | 96 (8.8%) |
| 5 or more Children | 89 (100.0%) | 0 (0.0%) |
| Total | 8,341 (96.4%) | 315 (3.6%) |
Income Below Poverty Among Single-Parent Households in Midland
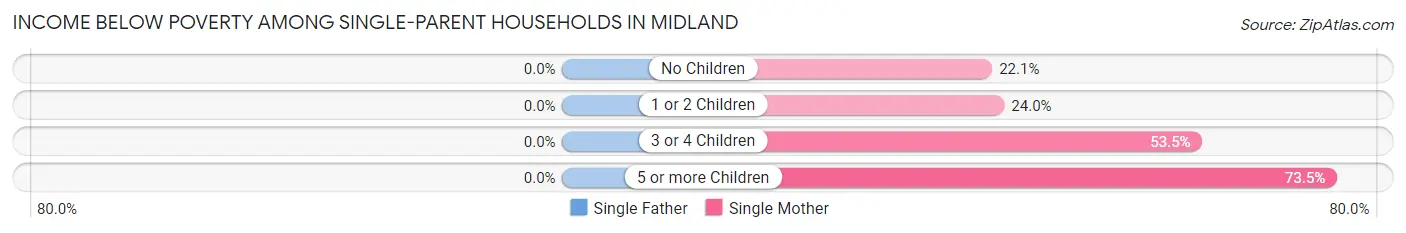
| Children | Single Father | Single Mother |
| No Children | 0 (0.0%) | 143 (22.1%) |
| 1 or 2 Children | 0 (0.0%) | 212 (23.9%) |
| 3 or 4 Children | 0 (0.0%) | 31 (53.4%) |
| 5 or more Children | 0 (0.0%) | 25 (73.5%) |
| Total | 0 (0.0%) | 411 (25.3%) |
Income Below Poverty Among Married-Couple vs Single-Parent Households in Midland
The poverty data for Midland shows that 315 of the married-couple family households (3.6%) and 411 of the single-parent households (19.5%) are living below the poverty level. Within the married-couple family households, those with 3 or 4 children have the highest poverty rate, with 96 households (8.8%) falling below the poverty line. Among the single-parent households, those with 5 or more children have the highest poverty rate, with 25 household (73.5%) living below poverty.
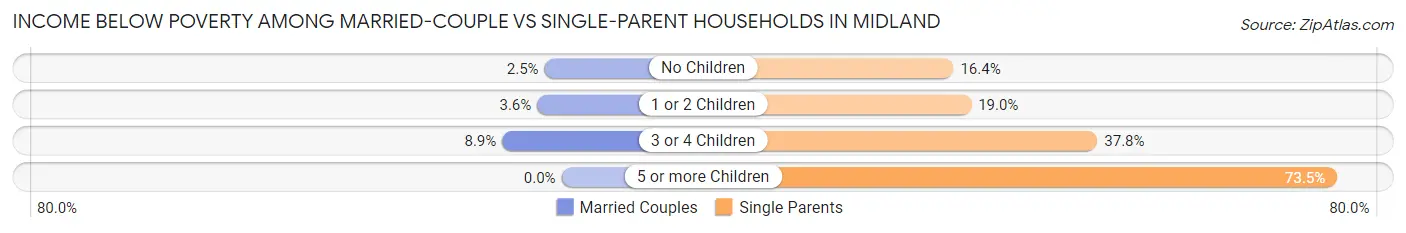
| Children | Married-Couple Families | Single-Parent Households |
| No Children | 123 (2.5%) | 143 (16.4%) |
| 1 or 2 Children | 96 (3.6%) | 212 (19.0%) |
| 3 or 4 Children | 96 (8.8%) | 31 (37.8%) |
| 5 or more Children | 0 (0.0%) | 25 (73.5%) |
| Total | 315 (3.6%) | 411 (19.5%) |
Race in Midland
The most populous races in Midland are White / Caucasian (37,924 | 89.4%), Hispanic or Latino (1,870 | 4.4%), and Two or more Races (1,288 | 3.0%).
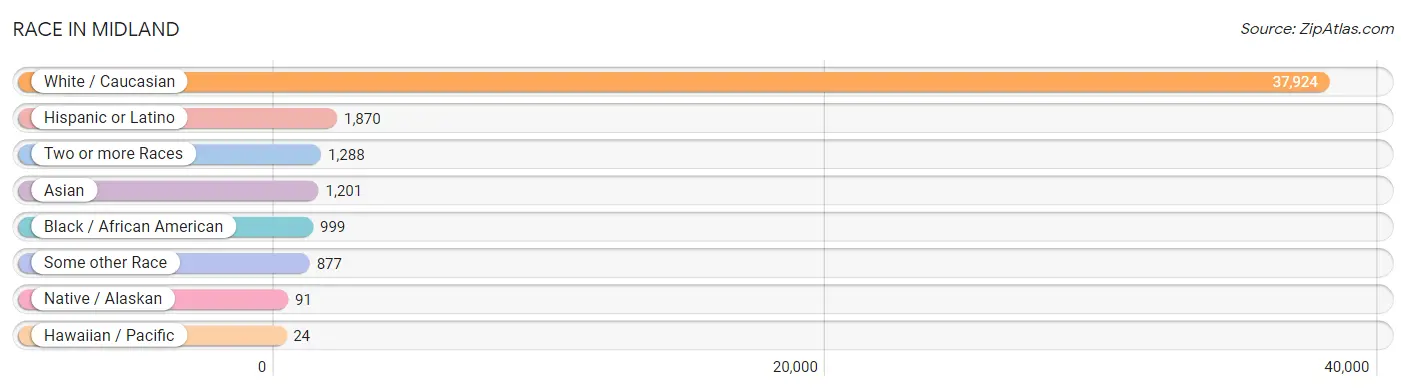
| Race | # Population | % Population |
| Asian | 1,201 | 2.8% |
| Black / African American | 999 | 2.4% |
| Hawaiian / Pacific | 24 | 0.1% |
| Hispanic or Latino | 1,870 | 4.4% |
| Native / Alaskan | 91 | 0.2% |
| White / Caucasian | 37,924 | 89.4% |
| Two or more Races | 1,288 | 3.0% |
| Some other Race | 877 | 2.1% |
| Total | 42,404 | 100.0% |
Ancestry in Midland
The most populous ancestries reported in Midland are German (10,160 | 24.0%), Irish (5,429 | 12.8%), English (5,263 | 12.4%), Polish (2,805 | 6.6%), and French (2,277 | 5.4%), together accounting for 61.2% of all Midland residents.
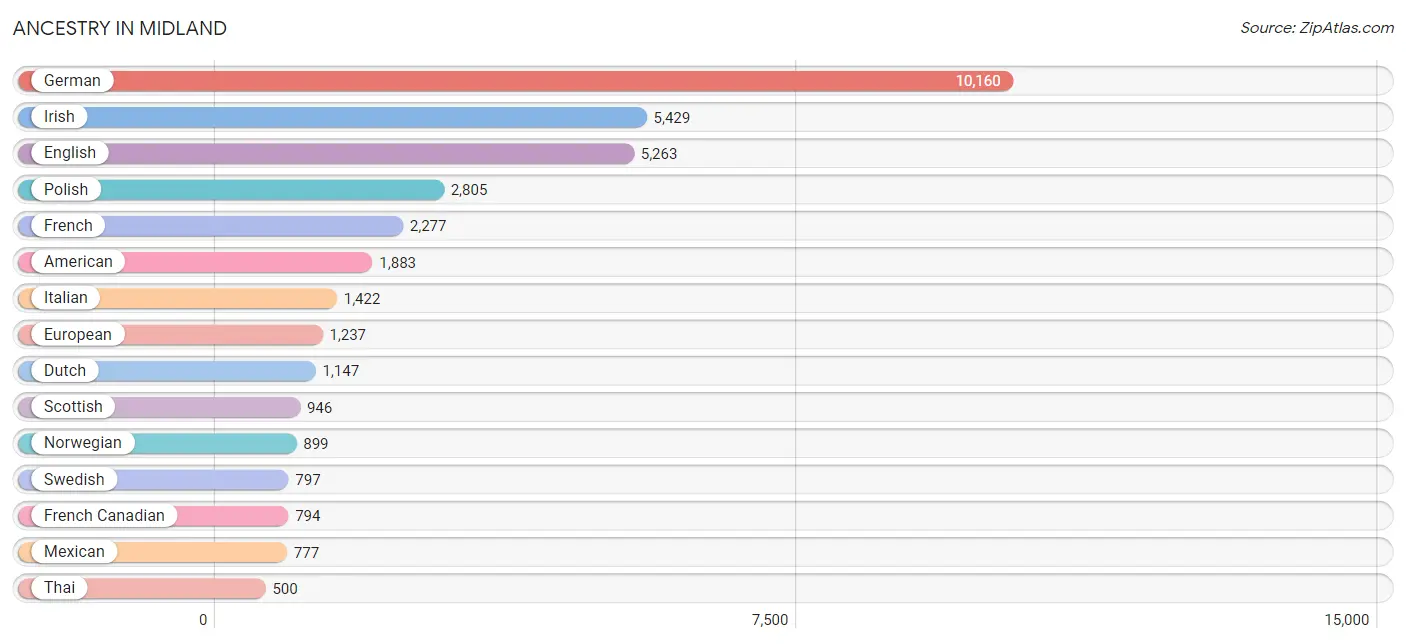
| Ancestry | # Population | % Population |
| African | 11 | 0.0% |
| Albanian | 13 | 0.0% |
| Aleut | 5 | 0.0% |
| American | 1,883 | 4.4% |
| Apache | 15 | 0.0% |
| Arab | 92 | 0.2% |
| Argentinean | 40 | 0.1% |
| Armenian | 18 | 0.0% |
| Assyrian / Chaldean / Syriac | 4 | 0.0% |
| Austrian | 44 | 0.1% |
| Belgian | 184 | 0.4% |
| Bhutanese | 227 | 0.5% |
| British | 384 | 0.9% |
| Burmese | 116 | 0.3% |
| Canadian | 159 | 0.4% |
| Central American | 90 | 0.2% |
| Cherokee | 14 | 0.0% |
| Chippewa | 81 | 0.2% |
| Choctaw | 12 | 0.0% |
| Colombian | 74 | 0.2% |
| Croatian | 31 | 0.1% |
| Cuban | 409 | 1.0% |
| Czech | 244 | 0.6% |
| Czechoslovakian | 9 | 0.0% |
| Danish | 230 | 0.5% |
| Dominican | 14 | 0.0% |
| Dutch | 1,147 | 2.7% |
| Eastern European | 181 | 0.4% |
| English | 5,263 | 12.4% |
| European | 1,237 | 2.9% |
| Filipino | 108 | 0.3% |
| Finnish | 400 | 0.9% |
| French | 2,277 | 5.4% |
| French Canadian | 794 | 1.9% |
| German | 10,160 | 24.0% |
| Ghanaian | 30 | 0.1% |
| Greek | 247 | 0.6% |
| Guamanian / Chamorro | 55 | 0.1% |
| Guatemalan | 29 | 0.1% |
| Honduran | 25 | 0.1% |
| Hungarian | 329 | 0.8% |
| Icelander | 15 | 0.0% |
| Indian (Asian) | 306 | 0.7% |
| Iranian | 14 | 0.0% |
| Iraqi | 4 | 0.0% |
| Irish | 5,429 | 12.8% |
| Italian | 1,422 | 3.4% |
| Jamaican | 63 | 0.2% |
| Japanese | 11 | 0.0% |
| Korean | 179 | 0.4% |
| Latvian | 24 | 0.1% |
| Lebanese | 58 | 0.1% |
| Lithuanian | 65 | 0.2% |
| Lumbee | 14 | 0.0% |
| Luxembourger | 12 | 0.0% |
| Macedonian | 13 | 0.0% |
| Mexican | 777 | 1.8% |
| Mongolian | 4 | 0.0% |
| Native Hawaiian | 80 | 0.2% |
| Northern European | 18 | 0.0% |
| Norwegian | 899 | 2.1% |
| Ottawa | 21 | 0.1% |
| Pennsylvania German | 49 | 0.1% |
| Polish | 2,805 | 6.6% |
| Portuguese | 18 | 0.0% |
| Puerto Rican | 117 | 0.3% |
| Puget Sound Salish | 1 | 0.0% |
| Romanian | 31 | 0.1% |
| Russian | 195 | 0.5% |
| Salvadoran | 36 | 0.1% |
| Scandinavian | 122 | 0.3% |
| Scotch-Irish | 340 | 0.8% |
| Scottish | 946 | 2.2% |
| Sierra Leonean | 45 | 0.1% |
| Sioux | 7 | 0.0% |
| Slavic | 18 | 0.0% |
| Slovak | 106 | 0.3% |
| Slovene | 14 | 0.0% |
| South American | 126 | 0.3% |
| Spaniard | 86 | 0.2% |
| Spanish | 221 | 0.5% |
| Sri Lankan | 99 | 0.2% |
| Subsaharan African | 114 | 0.3% |
| Swedish | 797 | 1.9% |
| Swiss | 208 | 0.5% |
| Syrian | 22 | 0.1% |
| Thai | 500 | 1.2% |
| Ukrainian | 127 | 0.3% |
| Venezuelan | 12 | 0.0% |
| Welsh | 283 | 0.7% | View All 90 Rows |
Immigrants in Midland
The most numerous immigrant groups reported in Midland came from Asia (938 | 2.2%), South Central Asia (415 | 1.0%), Eastern Asia (396 | 0.9%), Europe (343 | 0.8%), and India (314 | 0.7%), together accounting for 5.7% of all Midland residents.
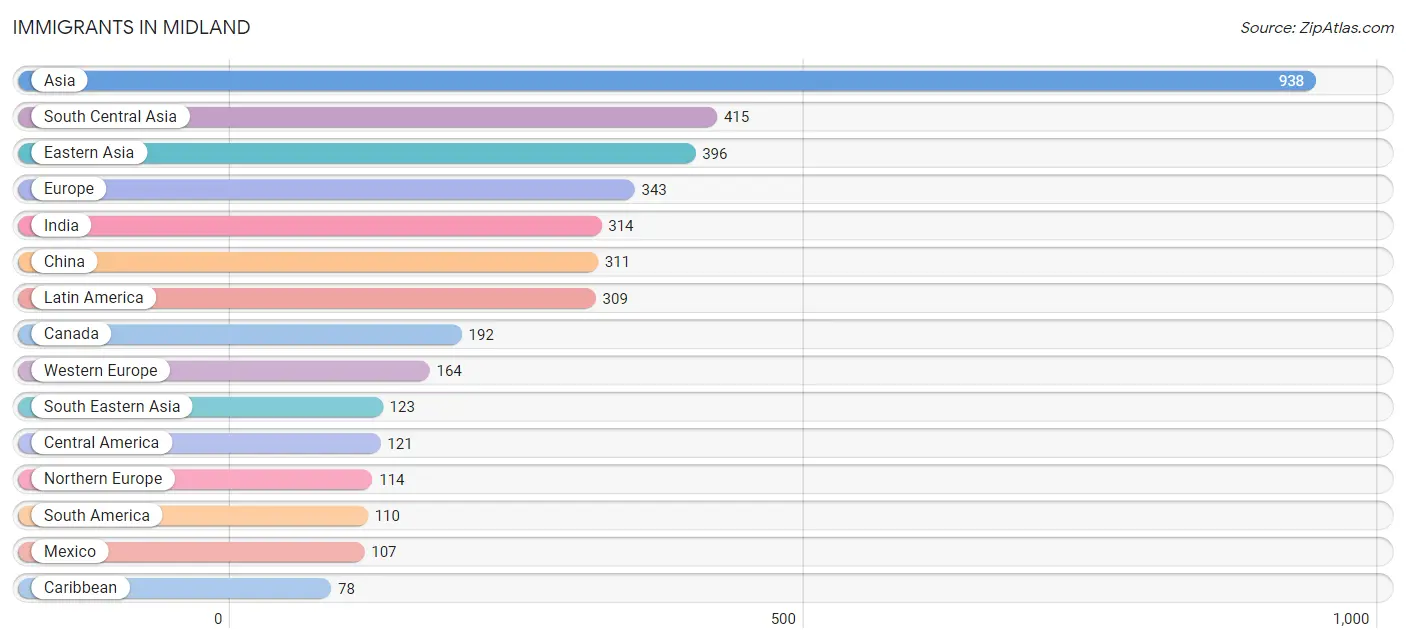
| Immigration Origin | # Population | % Population |
| Africa | 70 | 0.2% |
| Argentina | 40 | 0.1% |
| Asia | 938 | 2.2% |
| Brazil | 28 | 0.1% |
| Canada | 192 | 0.4% |
| Caribbean | 78 | 0.2% |
| Central America | 121 | 0.3% |
| China | 311 | 0.7% |
| Colombia | 30 | 0.1% |
| Cuba | 40 | 0.1% |
| Denmark | 20 | 0.1% |
| Dominican Republic | 38 | 0.1% |
| Eastern Africa | 10 | 0.0% |
| Eastern Asia | 396 | 0.9% |
| Eastern Europe | 52 | 0.1% |
| England | 48 | 0.1% |
| Europe | 343 | 0.8% |
| France | 58 | 0.1% |
| Germany | 64 | 0.2% |
| Ghana | 30 | 0.1% |
| Honduras | 14 | 0.0% |
| Hong Kong | 23 | 0.1% |
| Hungary | 12 | 0.0% |
| India | 314 | 0.7% |
| Iran | 9 | 0.0% |
| Iraq | 4 | 0.0% |
| Ireland | 6 | 0.0% |
| Japan | 7 | 0.0% |
| Korea | 78 | 0.2% |
| Latin America | 309 | 0.7% |
| Mexico | 107 | 0.3% |
| Nepal | 28 | 0.1% |
| Netherlands | 32 | 0.1% |
| Nigeria | 8 | 0.0% |
| Northern Europe | 114 | 0.3% |
| Pakistan | 53 | 0.1% |
| Philippines | 54 | 0.1% |
| Poland | 31 | 0.1% |
| Scotland | 8 | 0.0% |
| Sierra Leone | 9 | 0.0% |
| South Africa | 13 | 0.0% |
| South America | 110 | 0.3% |
| South Central Asia | 415 | 1.0% |
| South Eastern Asia | 123 | 0.3% |
| Southern Europe | 13 | 0.0% |
| Spain | 13 | 0.0% |
| Switzerland | 10 | 0.0% |
| Taiwan | 75 | 0.2% |
| Ukraine | 1 | 0.0% |
| Venezuela | 12 | 0.0% |
| Vietnam | 69 | 0.2% |
| Western Africa | 47 | 0.1% |
| Western Asia | 4 | 0.0% |
| Western Europe | 164 | 0.4% | View All 54 Rows |
Sex and Age in Midland
Sex and Age in Midland
The most populous age groups in Midland are 35 to 39 Years (1,721 | 8.3%) for men and 30 to 34 Years (1,598 | 7.3%) for women.
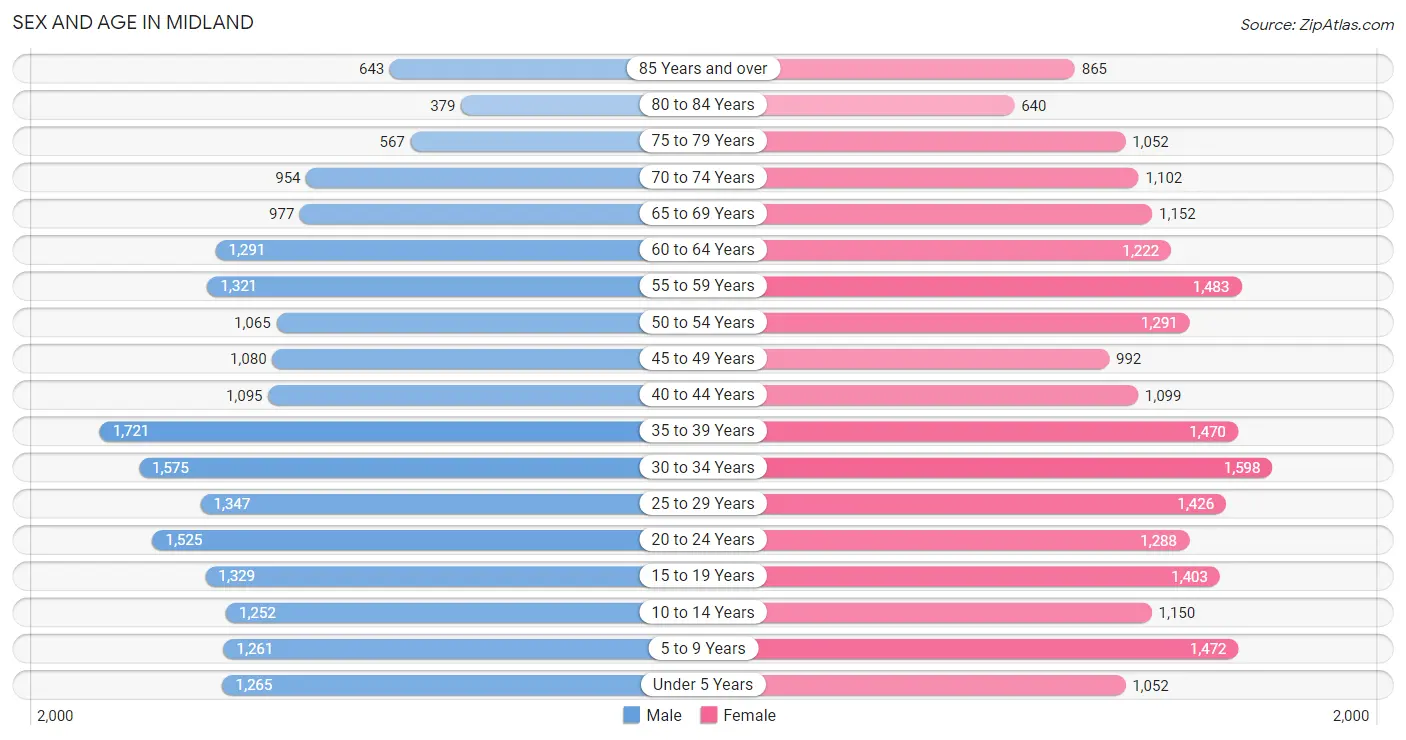
| Age Bracket | Male | Female |
| Under 5 Years | 1,265 (6.1%) | 1,052 (4.8%) |
| 5 to 9 Years | 1,261 (6.1%) | 1,472 (6.8%) |
| 10 to 14 Years | 1,252 (6.1%) | 1,150 (5.3%) |
| 15 to 19 Years | 1,329 (6.4%) | 1,403 (6.5%) |
| 20 to 24 Years | 1,525 (7.4%) | 1,288 (5.9%) |
| 25 to 29 Years | 1,347 (6.5%) | 1,426 (6.6%) |
| 30 to 34 Years | 1,575 (7.6%) | 1,598 (7.3%) |
| 35 to 39 Years | 1,721 (8.3%) | 1,470 (6.8%) |
| 40 to 44 Years | 1,095 (5.3%) | 1,099 (5.1%) |
| 45 to 49 Years | 1,080 (5.2%) | 992 (4.6%) |
| 50 to 54 Years | 1,065 (5.2%) | 1,291 (5.9%) |
| 55 to 59 Years | 1,321 (6.4%) | 1,483 (6.8%) |
| 60 to 64 Years | 1,291 (6.2%) | 1,222 (5.6%) |
| 65 to 69 Years | 977 (4.7%) | 1,152 (5.3%) |
| 70 to 74 Years | 954 (4.6%) | 1,102 (5.1%) |
| 75 to 79 Years | 567 (2.8%) | 1,052 (4.8%) |
| 80 to 84 Years | 379 (1.8%) | 640 (2.9%) |
| 85 Years and over | 643 (3.1%) | 865 (4.0%) |
| Total | 20,647 (100.0%) | 21,757 (100.0%) |
Families and Households in Midland
Median Family Size in Midland
The median family size in Midland is 3.00 persons per family, with married-couple families (8,656 | 80.4%) accounting for the largest median family size of 3.08 persons per family. On the other hand, single male/father families (483 | 4.5%) represent the smallest median family size with 2.61 persons per family.
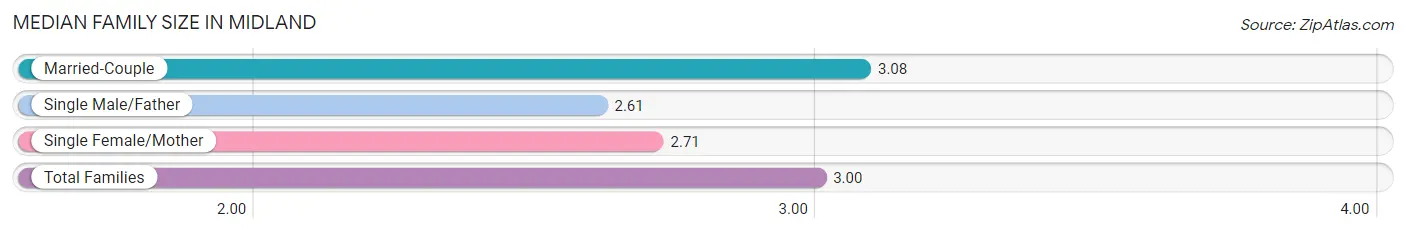
| Family Type | # Families | Family Size |
| Married-Couple | 8,656 (80.4%) | 3.08 |
| Single Male/Father | 483 (4.5%) | 2.61 |
| Single Female/Mother | 1,623 (15.1%) | 2.71 |
| Total Families | 10,762 (100.0%) | 3.00 |
Median Household Size in Midland
The median household size in Midland is 2.30 persons per household, with married-couple households (8,656 | 48.1%) accounting for the largest median household size of 3.1 persons per household. non-family households (7,214 | 40.1%) represent the smallest median household size with 1.19 persons per household.
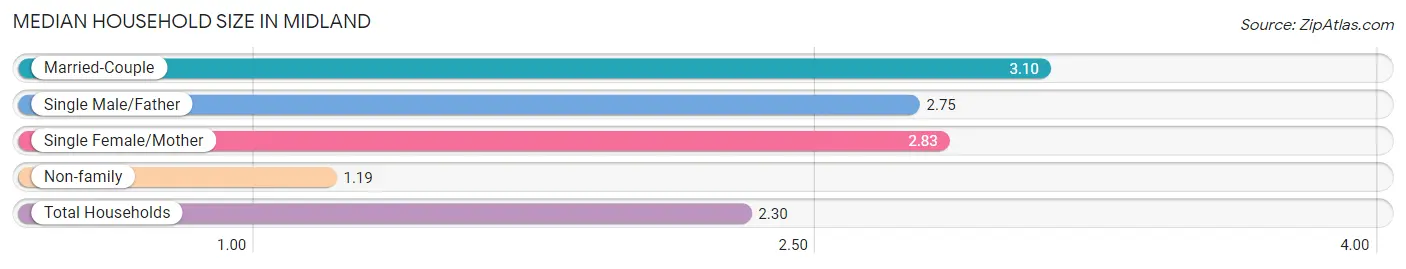
| Household Type | # Households | Household Size |
| Married-Couple | 8,656 (48.1%) | 3.10 |
| Single Male/Father | 483 (2.7%) | 2.75 |
| Single Female/Mother | 1,623 (9.0%) | 2.83 |
| Non-family | 7,214 (40.1%) | 1.19 |
| Total Households | 17,976 (100.0%) | 2.30 |
Household Size by Marriage Status in Midland
Out of a total of 17,976 households in Midland, 10,762 (59.9%) are family households, while 7,214 (40.1%) are nonfamily households. The most numerous type of family households are 2-person households, comprising 4,796, and the most common type of nonfamily households are 1-person households, comprising 6,123.
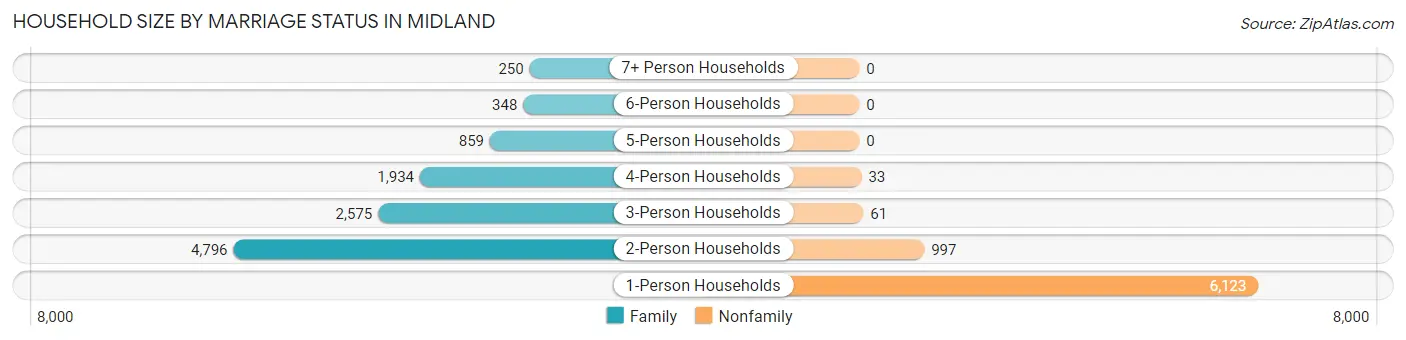
| Household Size | Family Households | Nonfamily Households |
| 1-Person Households | - | 6,123 (34.1%) |
| 2-Person Households | 4,796 (26.7%) | 997 (5.6%) |
| 3-Person Households | 2,575 (14.3%) | 61 (0.3%) |
| 4-Person Households | 1,934 (10.8%) | 33 (0.2%) |
| 5-Person Households | 859 (4.8%) | 0 (0.0%) |
| 6-Person Households | 348 (1.9%) | 0 (0.0%) |
| 7+ Person Households | 250 (1.4%) | 0 (0.0%) |
| Total | 10,762 (59.9%) | 7,214 (40.1%) |
Female Fertility in Midland
Fertility by Age in Midland
Average fertility rate in Midland is 60.0 births per 1,000 women. Women in the age bracket of 20 to 34 years have the highest fertility rate with 102.0 births per 1,000 women. Women in the age bracket of 20 to 34 years acount for 77.0% of all women with births.
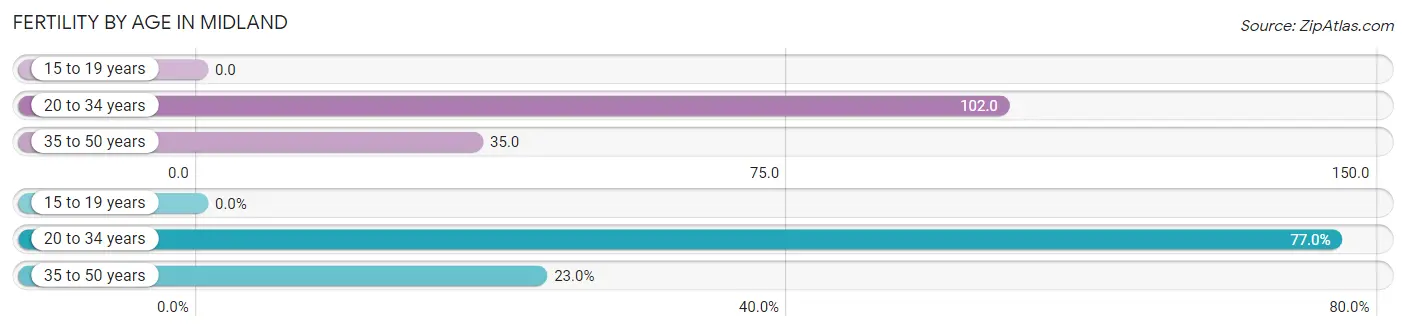
| Age Bracket | Women with Births | Births / 1,000 Women |
| 15 to 19 years | 0 (0.0%) | 0.0 |
| 20 to 34 years | 438 (77.0%) | 102.0 |
| 35 to 50 years | 131 (23.0%) | 35.0 |
| Total | 569 (100.0%) | 60.0 |
Fertility by Age by Marriage Status in Midland
93.5% of women with births (569) in Midland are married. The highest percentage of unmarried women with births falls into 20 to 34 years age bracket with 8.5% of them unmarried at the time of birth, while the lowest percentage of unmarried women with births belong to 35 to 50 years age bracket with 0.0% of them unmarried.
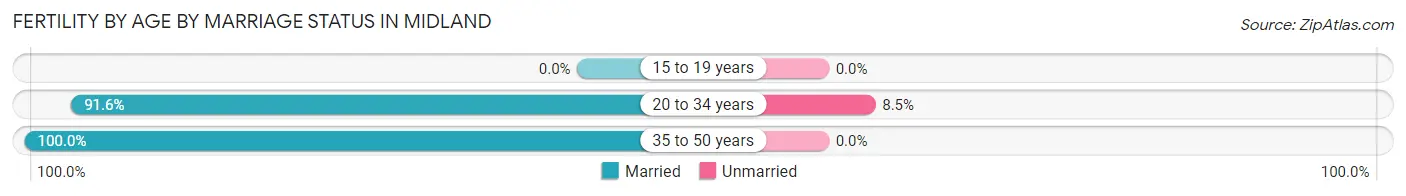
| Age Bracket | Married | Unmarried |
| 15 to 19 years | 0 (0.0%) | 0 (0.0%) |
| 20 to 34 years | 401 (91.5%) | 37 (8.5%) |
| 35 to 50 years | 131 (100.0%) | 0 (0.0%) |
| Total | 532 (93.5%) | 37 (6.5%) |
Fertility by Education in Midland
| Educational Attainment | Women with Births | Births / 1,000 Women |
| Less than High School | 0 (0.0%) | 0.0 |
| High School Diploma | 29 (5.1%) | 23.0 |
| College or Associate's Degree | 194 (34.1%) | 61.0 |
| Bachelor's Degree | 174 (30.6%) | 73.0 |
| Graduate Degree | 172 (30.2%) | 116.0 |
| Total | 569 (100.0%) | 60.0 |
Fertility by Education by Marriage Status in Midland
6.5% of women with births in Midland are unmarried. Women with the educational attainment of graduate degree are most likely to be married with 100.0% of them married at childbirth, while women with the educational attainment of high school diploma are least likely to be married with 79.3% of them unmarried at childbirth.
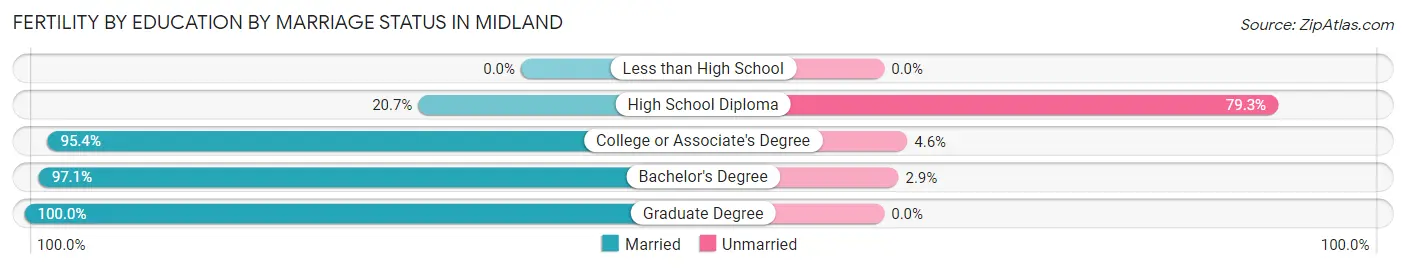
| Educational Attainment | Married | Unmarried |
| Less than High School | 0 (0.0%) | 0 (0.0%) |
| High School Diploma | 6 (20.7%) | 23 (79.3%) |
| College or Associate's Degree | 185 (95.4%) | 9 (4.6%) |
| Bachelor's Degree | 169 (97.1%) | 5 (2.9%) |
| Graduate Degree | 172 (100.0%) | 0 (0.0%) |
| Total | 532 (93.5%) | 37 (6.5%) |
Employment Characteristics in Midland
Employment by Class of Employer in Midland
Among the 19,063 employed individuals in Midland, private company employees (13,179 | 69.1%), not-for-profit organizations (2,324 | 12.2%), and local government employees (1,130 | 5.9%) make up the most common classes of employment.
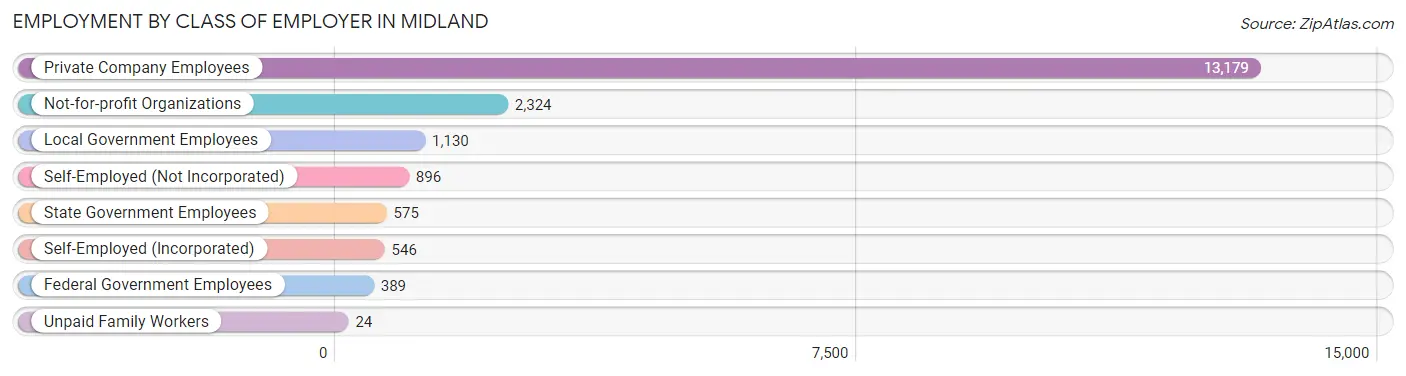
| Employer Class | # Employees | % Employees |
| Private Company Employees | 13,179 | 69.1% |
| Self-Employed (Incorporated) | 546 | 2.9% |
| Self-Employed (Not Incorporated) | 896 | 4.7% |
| Not-for-profit Organizations | 2,324 | 12.2% |
| Local Government Employees | 1,130 | 5.9% |
| State Government Employees | 575 | 3.0% |
| Federal Government Employees | 389 | 2.0% |
| Unpaid Family Workers | 24 | 0.1% |
| Total | 19,063 | 100.0% |
Employment Status by Age in Midland
According to the labor force statistics for Midland, out of the total population over 16 years of age (34,423), 59.3% or 20,413 individuals are in the labor force, with 4.5% or 919 of them unemployed. The age group with the highest labor force participation rate is 30 to 34 years, with 86.0% or 2,729 individuals in the labor force. Within the labor force, the 16 to 19 years age range has the highest percentage of unemployed individuals, with 14.2% or 118 of them being unemployed.
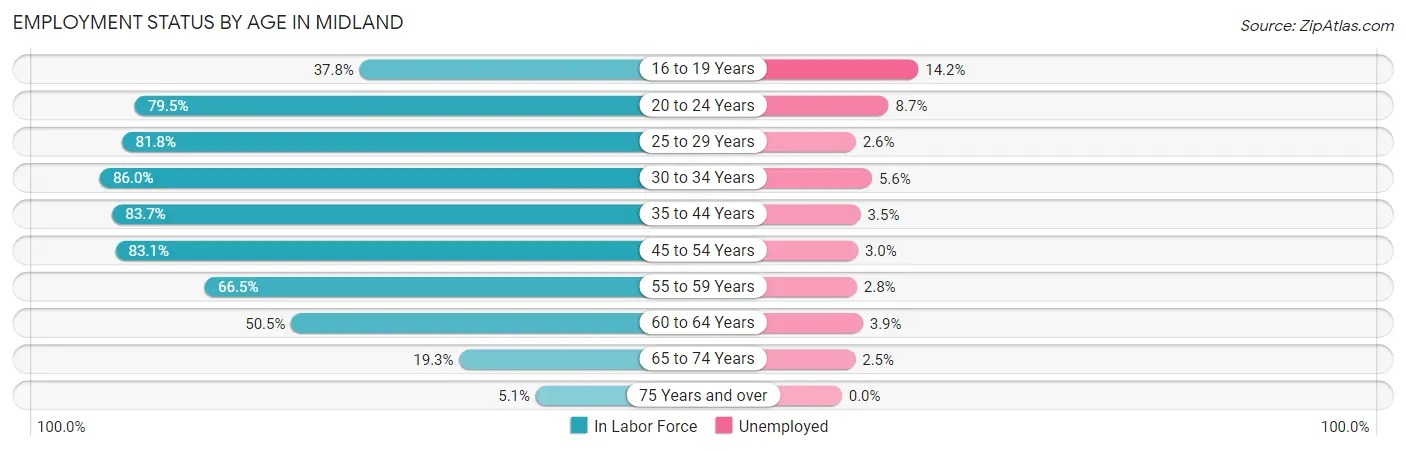
| Age Bracket | In Labor Force | Unemployed |
| 16 to 19 Years | 833 (37.8%) | 118 (14.2%) |
| 20 to 24 Years | 2,236 (79.5%) | 195 (8.7%) |
| 25 to 29 Years | 2,268 (81.8%) | 59 (2.6%) |
| 30 to 34 Years | 2,729 (86.0%) | 153 (5.6%) |
| 35 to 44 Years | 4,507 (83.7%) | 158 (3.5%) |
| 45 to 54 Years | 3,680 (83.1%) | 110 (3.0%) |
| 55 to 59 Years | 1,865 (66.5%) | 52 (2.8%) |
| 60 to 64 Years | 1,269 (50.5%) | 49 (3.9%) |
| 65 to 74 Years | 808 (19.3%) | 20 (2.5%) |
| 75 Years and over | 211 (5.1%) | 0 (0.0%) |
| Total | 20,413 (59.3%) | 919 (4.5%) |
Employment Status by Educational Attainment in Midland
According to labor force statistics for Midland, 77.4% of individuals (16,313) out of the total population between 25 and 64 years of age (21,076) are in the labor force, with 3.6% or 587 of them being unemployed. The group with the highest labor force participation rate are those with the educational attainment of bachelor's degree or higher, with 85.5% or 8,372 individuals in the labor force. Within the labor force, individuals with less than high school education have the highest percentage of unemployment, with 8.5% or 46 of them being unemployed.
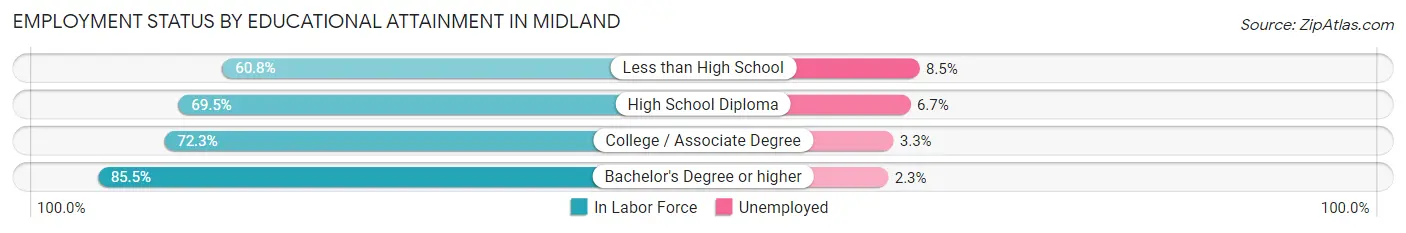
| Educational Attainment | In Labor Force | Unemployed |
| Less than High School | 542 (60.8%) | 76 (8.5%) |
| High School Diploma | 2,761 (69.5%) | 266 (6.7%) |
| College / Associate Degree | 4,641 (72.3%) | 212 (3.3%) |
| Bachelor's Degree or higher | 8,372 (85.5%) | 225 (2.3%) |
| Total | 16,313 (77.4%) | 759 (3.6%) |
Employment Occupations by Sex in Midland
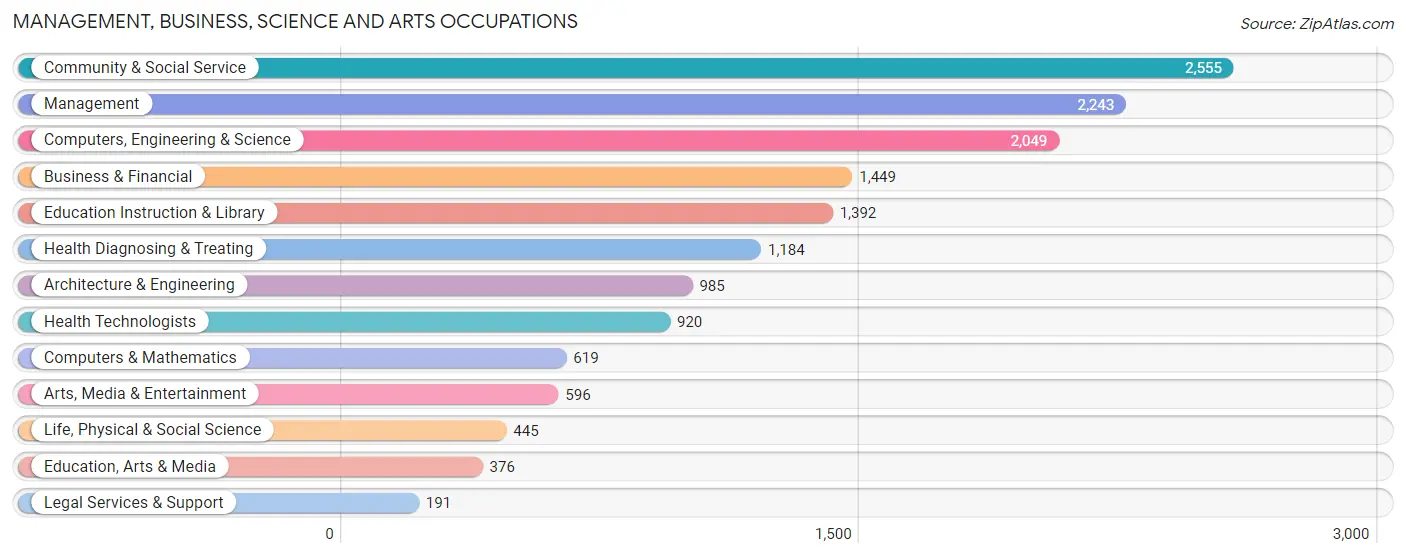
Management, Business, Science and Arts Occupations
The most common Management, Business, Science and Arts occupations in Midland are Community & Social Service (2,555 | 13.2%), Management (2,243 | 11.6%), Computers, Engineering & Science (2,049 | 10.5%), Business & Financial (1,449 | 7.5%), and Education Instruction & Library (1,392 | 7.2%).
Management, Business, Science and Arts Occupations by Sex
Within the Management, Business, Science and Arts occupations in Midland, the most male-oriented occupations are Architecture & Engineering (80.1%), Computers & Mathematics (77.7%), and Computers, Engineering & Science (76.8%), while the most female-oriented occupations are Health Diagnosing & Treating (76.9%), Health Technologists (74.5%), and Education Instruction & Library (68.7%).
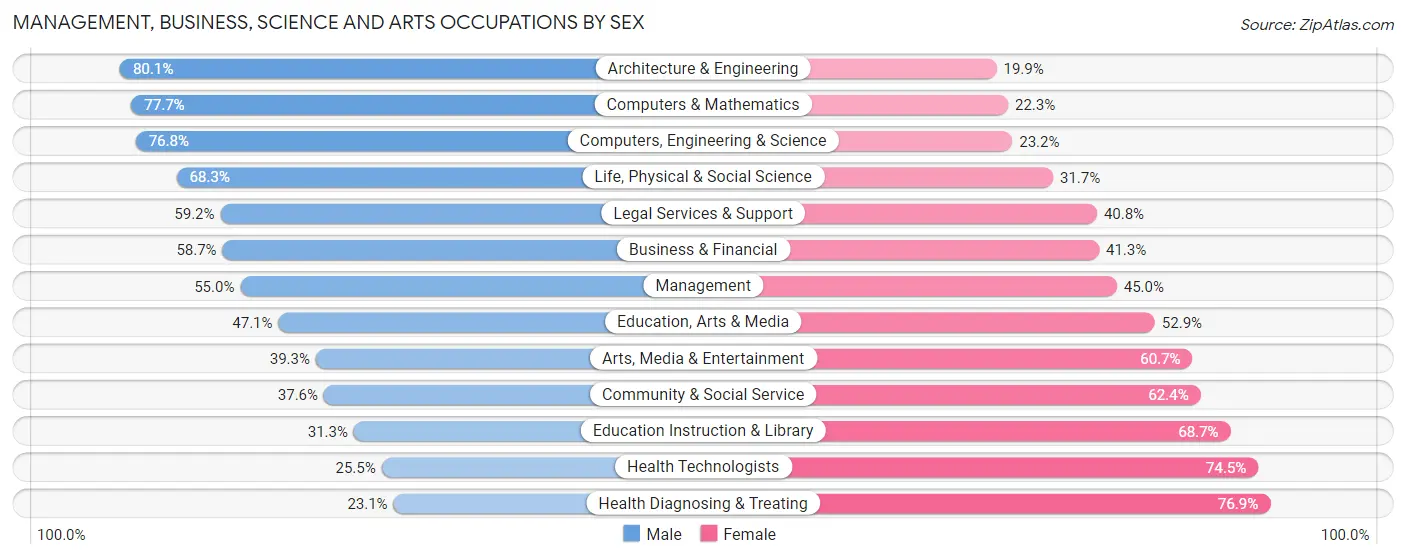
| Occupation | Male | Female |
| Management | 1,234 (55.0%) | 1,009 (45.0%) |
| Business & Financial | 851 (58.7%) | 598 (41.3%) |
| Computers, Engineering & Science | 1,574 (76.8%) | 475 (23.2%) |
| Computers & Mathematics | 481 (77.7%) | 138 (22.3%) |
| Architecture & Engineering | 789 (80.1%) | 196 (19.9%) |
| Life, Physical & Social Science | 304 (68.3%) | 141 (31.7%) |
| Community & Social Service | 960 (37.6%) | 1,595 (62.4%) |
| Education, Arts & Media | 177 (47.1%) | 199 (52.9%) |
| Legal Services & Support | 113 (59.2%) | 78 (40.8%) |
| Education Instruction & Library | 436 (31.3%) | 956 (68.7%) |
| Arts, Media & Entertainment | 234 (39.3%) | 362 (60.7%) |
| Health Diagnosing & Treating | 273 (23.1%) | 911 (76.9%) |
| Health Technologists | 235 (25.5%) | 685 (74.5%) |
| Total (Category) | 4,892 (51.6%) | 4,588 (48.4%) |
| Total (Overall) | 10,092 (52.0%) | 9,322 (48.0%) |
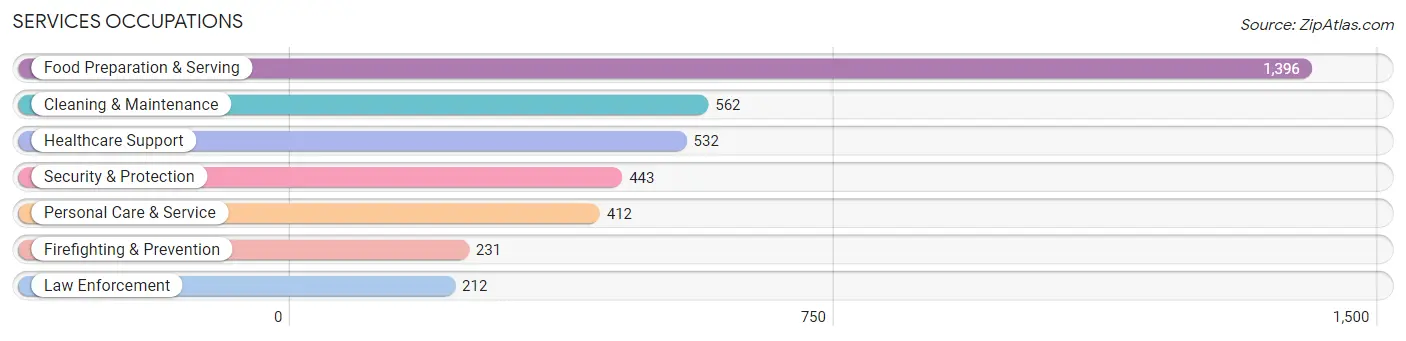
Services Occupations
The most common Services occupations in Midland are Food Preparation & Serving (1,396 | 7.2%), Cleaning & Maintenance (562 | 2.9%), Healthcare Support (532 | 2.7%), Security & Protection (443 | 2.3%), and Personal Care & Service (412 | 2.1%).
Services Occupations by Sex
Within the Services occupations in Midland, the most male-oriented occupations are Law Enforcement (91.0%), Security & Protection (72.2%), and Cleaning & Maintenance (59.3%), while the most female-oriented occupations are Healthcare Support (82.0%), Personal Care & Service (76.0%), and Food Preparation & Serving (62.2%).
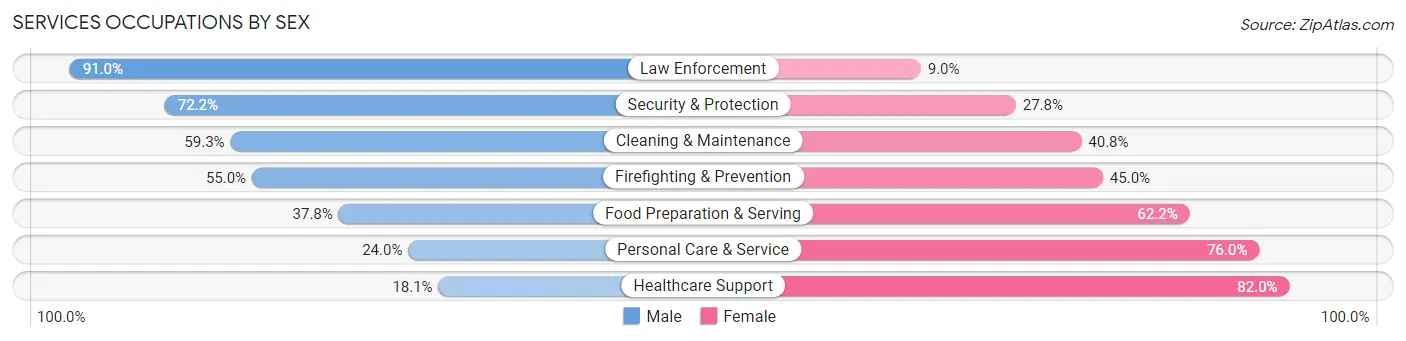
| Occupation | Male | Female |
| Healthcare Support | 96 (18.0%) | 436 (82.0%) |
| Security & Protection | 320 (72.2%) | 123 (27.8%) |
| Firefighting & Prevention | 127 (55.0%) | 104 (45.0%) |
| Law Enforcement | 193 (91.0%) | 19 (9.0%) |
| Food Preparation & Serving | 528 (37.8%) | 868 (62.2%) |
| Cleaning & Maintenance | 333 (59.3%) | 229 (40.7%) |
| Personal Care & Service | 99 (24.0%) | 313 (76.0%) |
| Total (Category) | 1,376 (41.1%) | 1,969 (58.9%) |
| Total (Overall) | 10,092 (52.0%) | 9,322 (48.0%) |
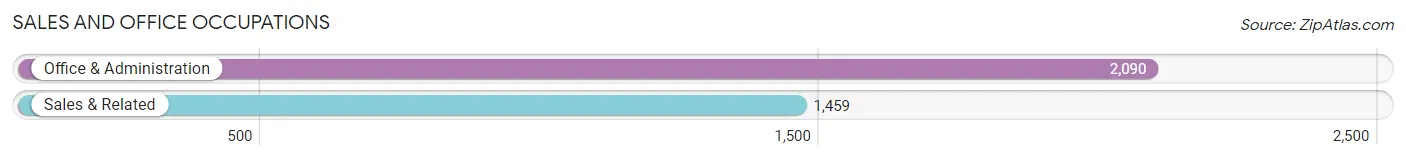
Sales and Office Occupations
The most common Sales and Office occupations in Midland are Office & Administration (2,090 | 10.8%), and Sales & Related (1,459 | 7.5%).
Sales and Office Occupations by Sex
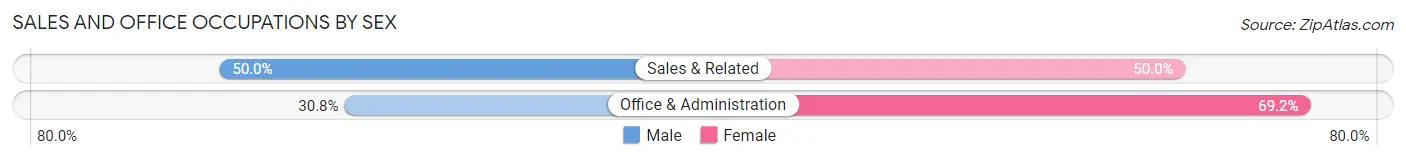
| Occupation | Male | Female |
| Sales & Related | 730 (50.0%) | 729 (50.0%) |
| Office & Administration | 644 (30.8%) | 1,446 (69.2%) |
| Total (Category) | 1,374 (38.7%) | 2,175 (61.3%) |
| Total (Overall) | 10,092 (52.0%) | 9,322 (48.0%) |
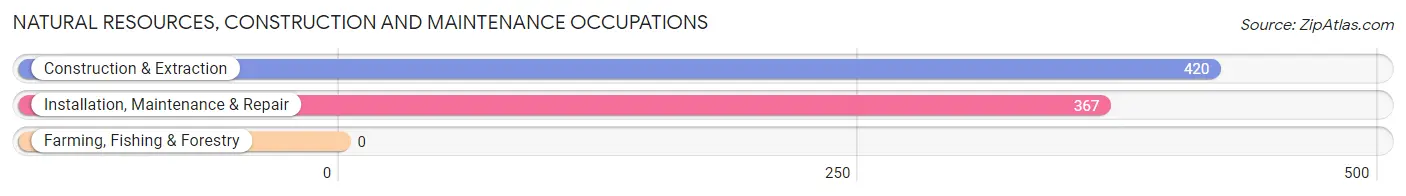
Natural Resources, Construction and Maintenance Occupations
The most common Natural Resources, Construction and Maintenance occupations in Midland are Construction & Extraction (420 | 2.2%), and Installation, Maintenance & Repair (367 | 1.9%).
Natural Resources, Construction and Maintenance Occupations by Sex
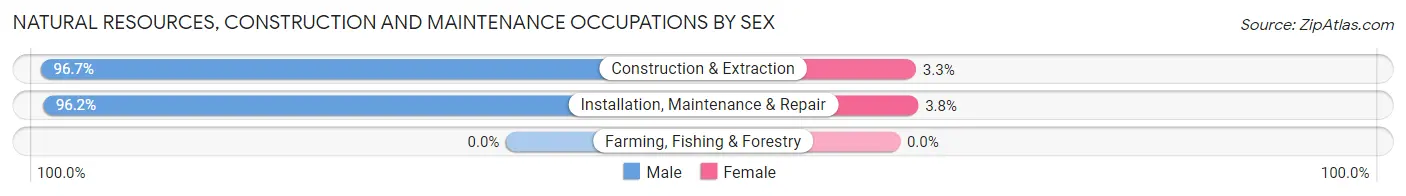
| Occupation | Male | Female |
| Farming, Fishing & Forestry | 0 (0.0%) | 0 (0.0%) |
| Construction & Extraction | 406 (96.7%) | 14 (3.3%) |
| Installation, Maintenance & Repair | 353 (96.2%) | 14 (3.8%) |
| Total (Category) | 759 (96.4%) | 28 (3.6%) |
| Total (Overall) | 10,092 (52.0%) | 9,322 (48.0%) |
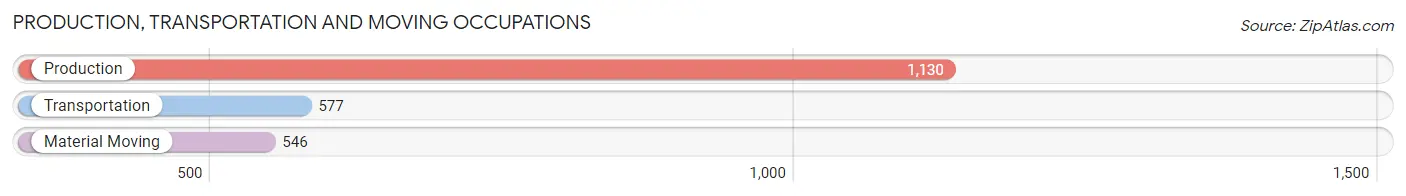
Production, Transportation and Moving Occupations
The most common Production, Transportation and Moving occupations in Midland are Production (1,130 | 5.8%), Transportation (577 | 3.0%), and Material Moving (546 | 2.8%).
Production, Transportation and Moving Occupations by Sex
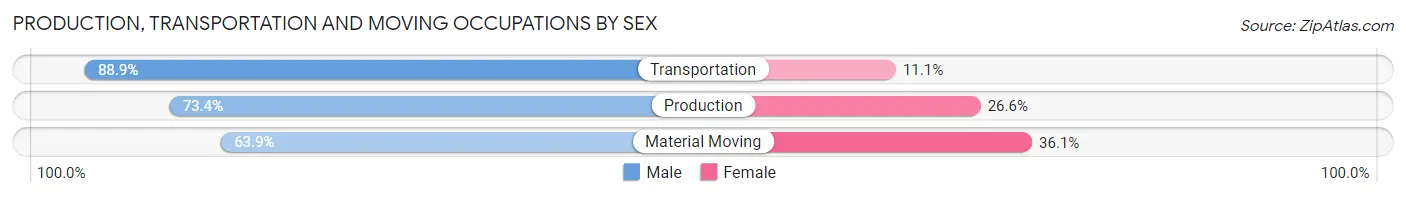
| Occupation | Male | Female |
| Production | 829 (73.4%) | 301 (26.6%) |
| Transportation | 513 (88.9%) | 64 (11.1%) |
| Material Moving | 349 (63.9%) | 197 (36.1%) |
| Total (Category) | 1,691 (75.1%) | 562 (24.9%) |
| Total (Overall) | 10,092 (52.0%) | 9,322 (48.0%) |
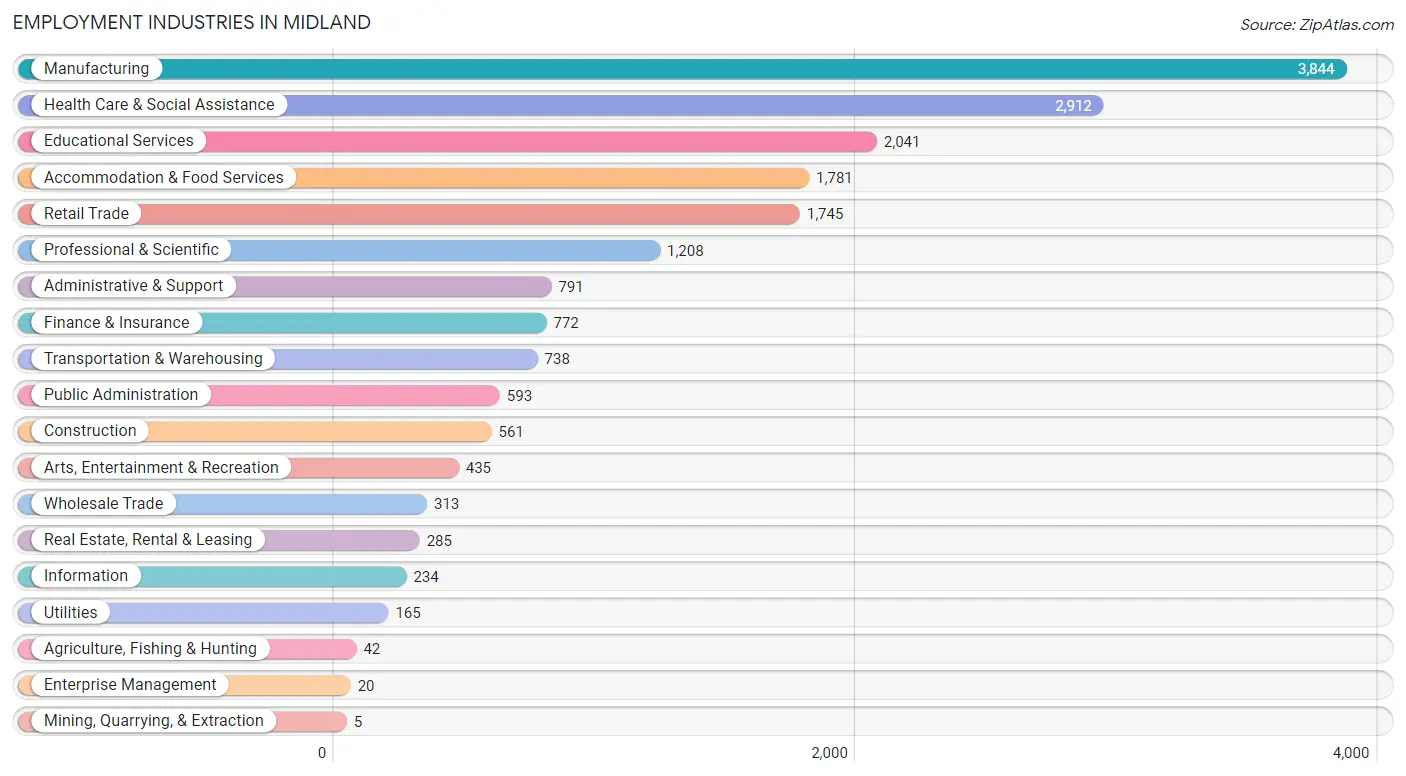
Employment Industries by Sex in Midland
Employment Industries in Midland
The major employment industries in Midland include Manufacturing (3,844 | 19.8%), Health Care & Social Assistance (2,912 | 15.0%), Educational Services (2,041 | 10.5%), Accommodation & Food Services (1,781 | 9.2%), and Retail Trade (1,745 | 9.0%).
Employment Industries by Sex in Midland
The Midland industries that see more men than women are Mining, Quarrying, & Extraction (100.0%), Construction (94.7%), and Agriculture, Fishing & Hunting (88.1%), whereas the industries that tend to have a higher number of women are Enterprise Management (100.0%), Health Care & Social Assistance (77.0%), and Information (67.5%).
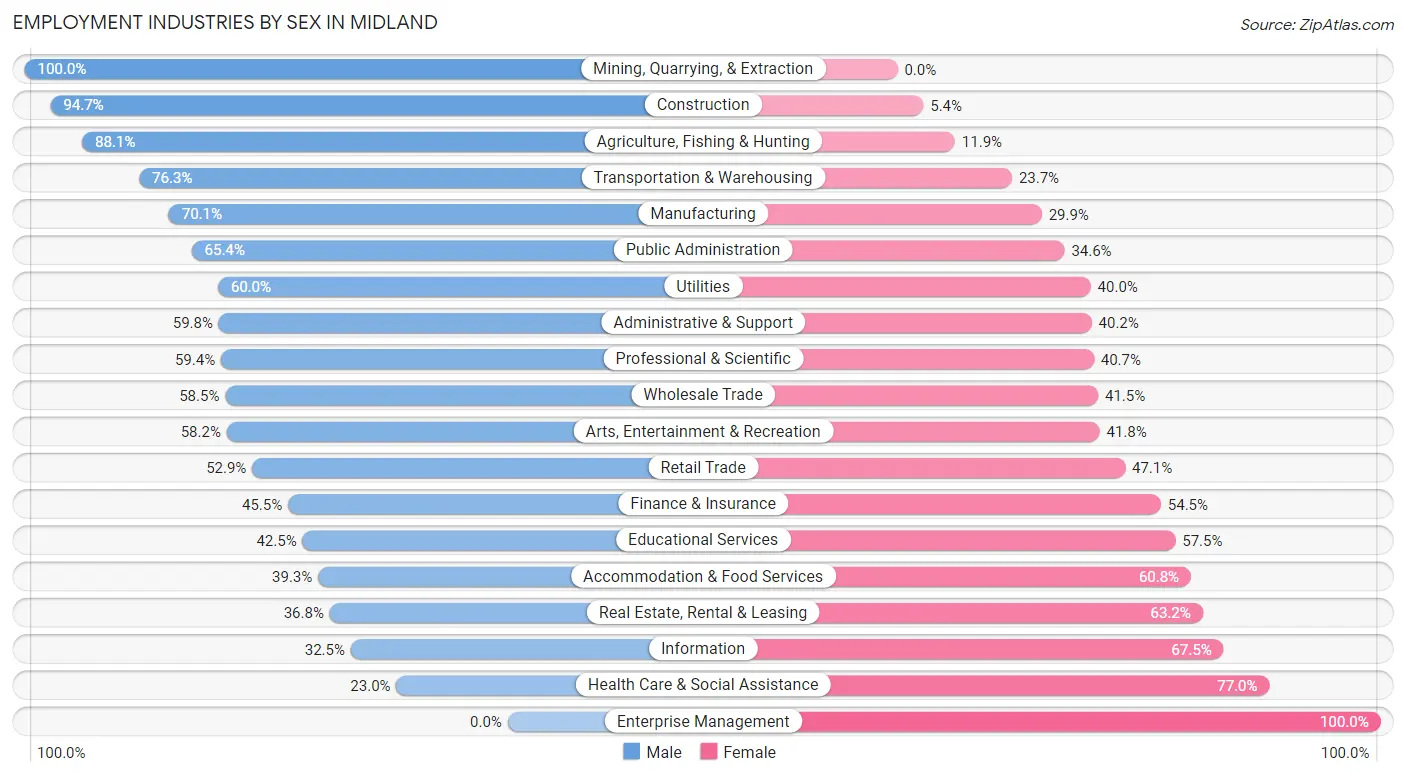
| Industry | Male | Female |
| Agriculture, Fishing & Hunting | 37 (88.1%) | 5 (11.9%) |
| Mining, Quarrying, & Extraction | 5 (100.0%) | 0 (0.0%) |
| Construction | 531 (94.7%) | 30 (5.3%) |
| Manufacturing | 2,696 (70.1%) | 1,148 (29.9%) |
| Wholesale Trade | 183 (58.5%) | 130 (41.5%) |
| Retail Trade | 923 (52.9%) | 822 (47.1%) |
| Transportation & Warehousing | 563 (76.3%) | 175 (23.7%) |
| Utilities | 99 (60.0%) | 66 (40.0%) |
| Information | 76 (32.5%) | 158 (67.5%) |
| Finance & Insurance | 351 (45.5%) | 421 (54.5%) |
| Real Estate, Rental & Leasing | 105 (36.8%) | 180 (63.2%) |
| Professional & Scientific | 717 (59.4%) | 491 (40.6%) |
| Enterprise Management | 0 (0.0%) | 20 (100.0%) |
| Administrative & Support | 473 (59.8%) | 318 (40.2%) |
| Educational Services | 867 (42.5%) | 1,174 (57.5%) |
| Health Care & Social Assistance | 671 (23.0%) | 2,241 (77.0%) |
| Arts, Entertainment & Recreation | 253 (58.2%) | 182 (41.8%) |
| Accommodation & Food Services | 699 (39.3%) | 1,082 (60.8%) |
| Public Administration | 388 (65.4%) | 205 (34.6%) |
| Total | 10,092 (52.0%) | 9,322 (48.0%) |
Education in Midland
School Enrollment in Midland
The most common levels of schooling among the 10,408 students in Midland are college / undergraduate (2,467 | 23.7%), elementary school (2,143 | 20.6%), and middle school (2,062 | 19.8%).
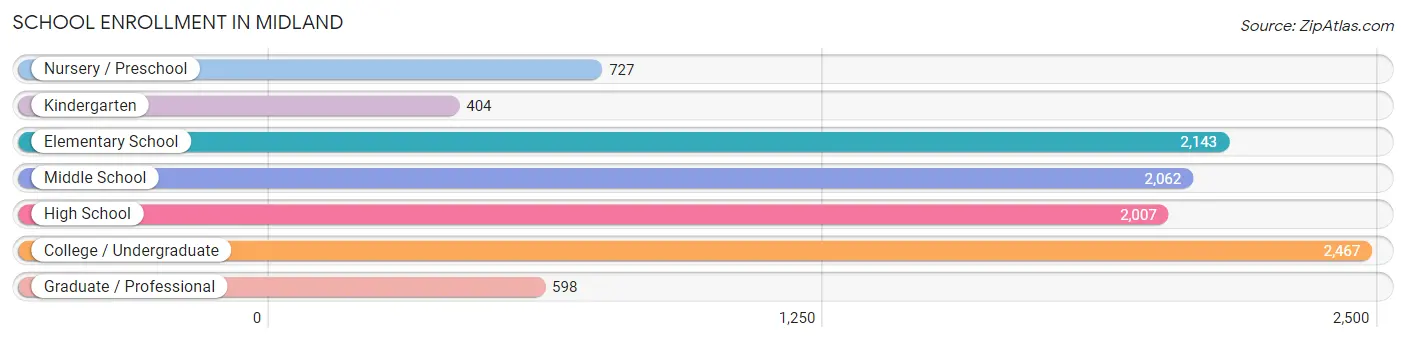
| School Level | # Students | % Students |
| Nursery / Preschool | 727 | 7.0% |
| Kindergarten | 404 | 3.9% |
| Elementary School | 2,143 | 20.6% |
| Middle School | 2,062 | 19.8% |
| High School | 2,007 | 19.3% |
| College / Undergraduate | 2,467 | 23.7% |
| Graduate / Professional | 598 | 5.8% |
| Total | 10,408 | 100.0% |
School Enrollment by Age by Funding Source in Midland
Out of a total of 10,408 students who are enrolled in schools in Midland, 1,801 (17.3%) attend a private institution, while the remaining 8,607 (82.7%) are enrolled in public schools. The age group of 3 to 4 year olds has the highest likelihood of being enrolled in private schools, with 237 (47.2% in the age bracket) enrolled. Conversely, the age group of 15 to 17 year olds has the lowest likelihood of being enrolled in a private school, with 1,452 (96.5% in the age bracket) attending a public institution.
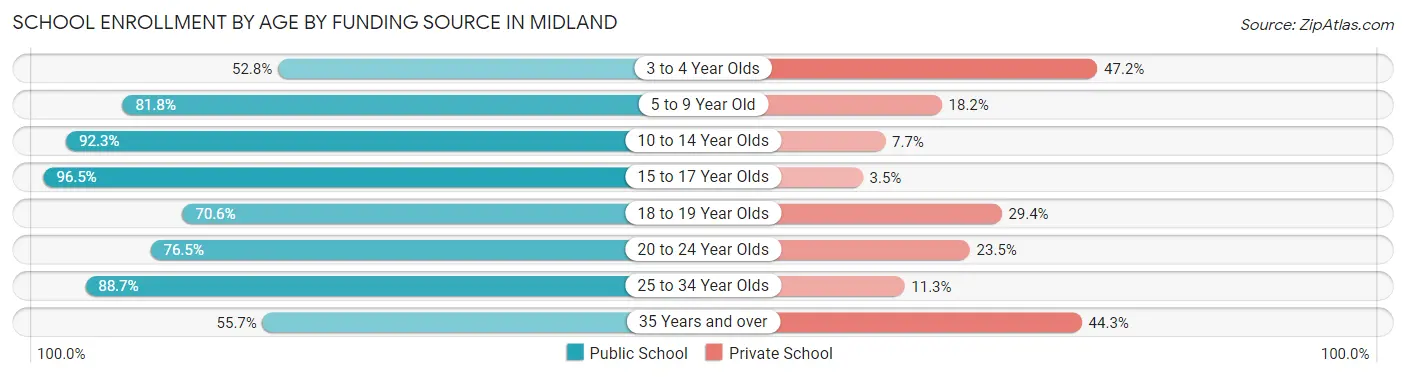
| Age Bracket | Public School | Private School |
| 3 to 4 Year Olds | 265 (52.8%) | 237 (47.2%) |
| 5 to 9 Year Old | 2,085 (81.8%) | 465 (18.2%) |
| 10 to 14 Year Olds | 2,200 (92.3%) | 184 (7.7%) |
| 15 to 17 Year Olds | 1,452 (96.5%) | 53 (3.5%) |
| 18 to 19 Year Olds | 699 (70.6%) | 291 (29.4%) |
| 20 to 24 Year Olds | 1,037 (76.5%) | 318 (23.5%) |
| 25 to 34 Year Olds | 659 (88.7%) | 84 (11.3%) |
| 35 Years and over | 211 (55.7%) | 168 (44.3%) |
| Total | 8,607 (82.7%) | 1,801 (17.3%) |
Educational Attainment by Field of Study in Midland
Business (2,890 | 20.5%), engineering (1,860 | 13.2%), education (1,763 | 12.5%), science & technology (1,365 | 9.7%), and arts & humanities (873 | 6.2%) are the most common fields of study among 14,087 individuals in Midland who have obtained a bachelor's degree or higher.
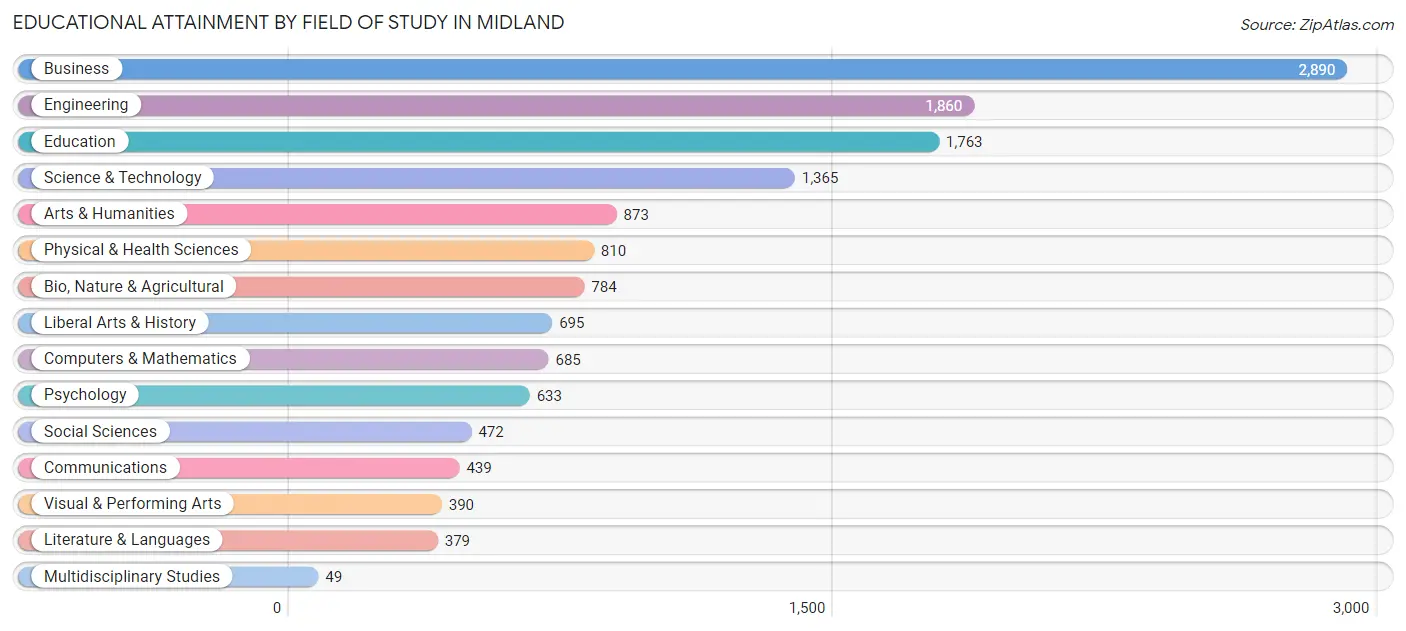
| Field of Study | # Graduates | % Graduates |
| Computers & Mathematics | 685 | 4.9% |
| Bio, Nature & Agricultural | 784 | 5.6% |
| Physical & Health Sciences | 810 | 5.8% |
| Psychology | 633 | 4.5% |
| Social Sciences | 472 | 3.4% |
| Engineering | 1,860 | 13.2% |
| Multidisciplinary Studies | 49 | 0.4% |
| Science & Technology | 1,365 | 9.7% |
| Business | 2,890 | 20.5% |
| Education | 1,763 | 12.5% |
| Literature & Languages | 379 | 2.7% |
| Liberal Arts & History | 695 | 4.9% |
| Visual & Performing Arts | 390 | 2.8% |
| Communications | 439 | 3.1% |
| Arts & Humanities | 873 | 6.2% |
| Total | 14,087 | 100.0% |
Transportation & Commute in Midland
Vehicle Availability by Sex in Midland
The most prevalent vehicle ownership categories in Midland are males with 2 vehicles (5,451, accounting for 54.8%) and females with 2 vehicles (4,300, making up 60.7%).
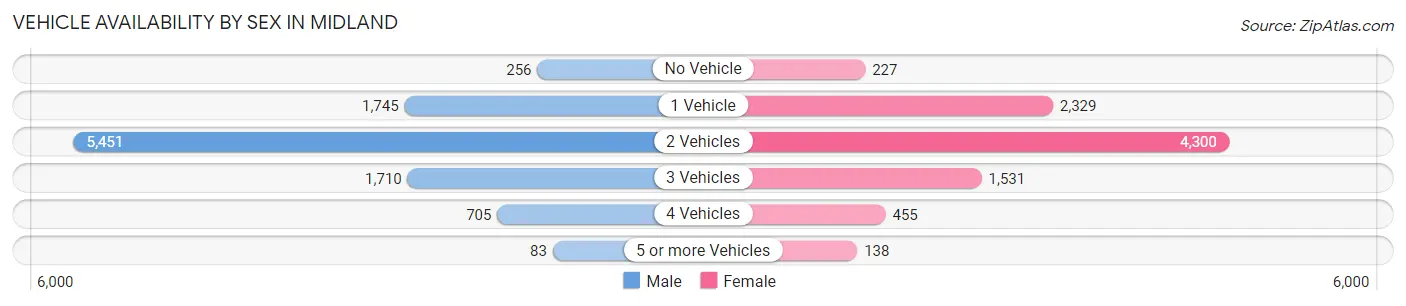
| Vehicles Available | Male | Female |
| No Vehicle | 256 (2.6%) | 227 (2.5%) |
| 1 Vehicle | 1,745 (17.5%) | 2,329 (25.9%) |
| 2 Vehicles | 5,451 (54.8%) | 4,300 (47.9%) |
| 3 Vehicles | 1,710 (17.2%) | 1,531 (17.1%) |
| 4 Vehicles | 705 (7.1%) | 455 (5.1%) |
| 5 or more Vehicles | 83 (0.8%) | 138 (1.5%) |
| Total | 9,950 (100.0%) | 8,980 (100.0%) |
Commute Time in Midland
The most frequently occuring commute durations in Midland are 10 to 14 minutes (4,152 commuters, 24.1%), 5 to 9 minutes (3,844 commuters, 22.3%), and 15 to 19 minutes (2,520 commuters, 14.6%).
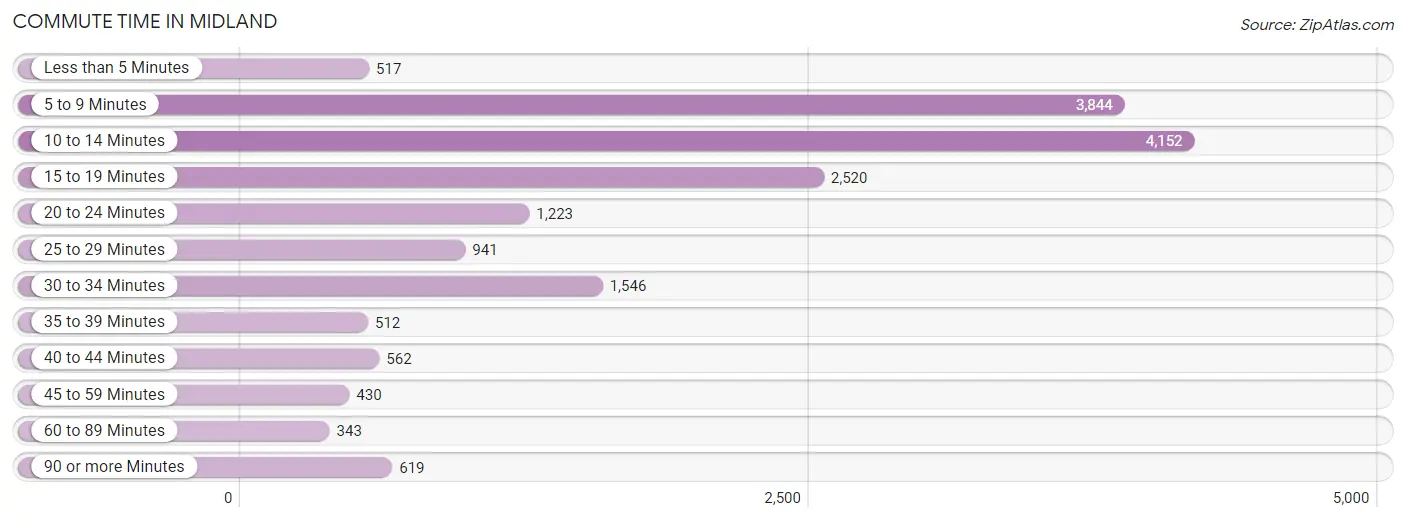
| Commute Time | # Commuters | % Commuters |
| Less than 5 Minutes | 517 | 3.0% |
| 5 to 9 Minutes | 3,844 | 22.3% |
| 10 to 14 Minutes | 4,152 | 24.1% |
| 15 to 19 Minutes | 2,520 | 14.6% |
| 20 to 24 Minutes | 1,223 | 7.1% |
| 25 to 29 Minutes | 941 | 5.5% |
| 30 to 34 Minutes | 1,546 | 9.0% |
| 35 to 39 Minutes | 512 | 3.0% |
| 40 to 44 Minutes | 562 | 3.3% |
| 45 to 59 Minutes | 430 | 2.5% |
| 60 to 89 Minutes | 343 | 2.0% |
| 90 or more Minutes | 619 | 3.6% |
Commute Time by Sex in Midland
The most common commute times in Midland are 10 to 14 minutes (2,341 commuters, 25.5%) for males and 5 to 9 minutes (2,120 commuters, 26.4%) for females.
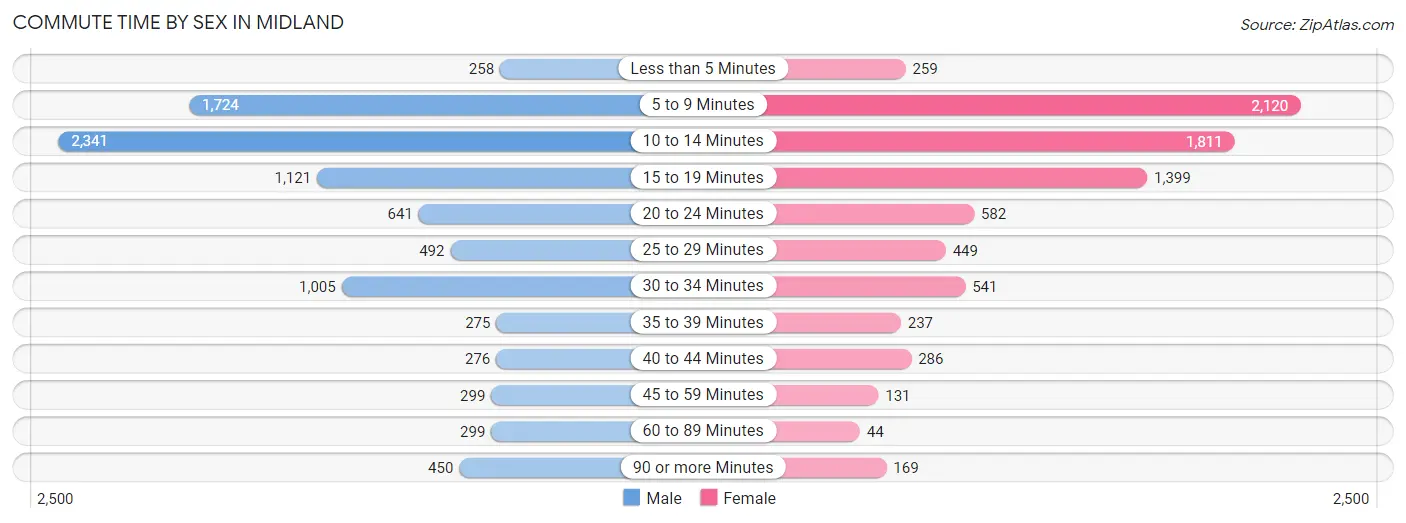
| Commute Time | Male | Female |
| Less than 5 Minutes | 258 (2.8%) | 259 (3.2%) |
| 5 to 9 Minutes | 1,724 (18.8%) | 2,120 (26.4%) |
| 10 to 14 Minutes | 2,341 (25.5%) | 1,811 (22.6%) |
| 15 to 19 Minutes | 1,121 (12.2%) | 1,399 (17.4%) |
| 20 to 24 Minutes | 641 (7.0%) | 582 (7.2%) |
| 25 to 29 Minutes | 492 (5.4%) | 449 (5.6%) |
| 30 to 34 Minutes | 1,005 (11.0%) | 541 (6.7%) |
| 35 to 39 Minutes | 275 (3.0%) | 237 (2.9%) |
| 40 to 44 Minutes | 276 (3.0%) | 286 (3.6%) |
| 45 to 59 Minutes | 299 (3.3%) | 131 (1.6%) |
| 60 to 89 Minutes | 299 (3.3%) | 44 (0.5%) |
| 90 or more Minutes | 450 (4.9%) | 169 (2.1%) |
Time of Departure to Work by Sex in Midland
The most frequent times of departure to work in Midland are 7:30 AM to 7:59 AM (1,699, 18.5%) for males and 7:30 AM to 7:59 AM (1,899, 23.6%) for females.
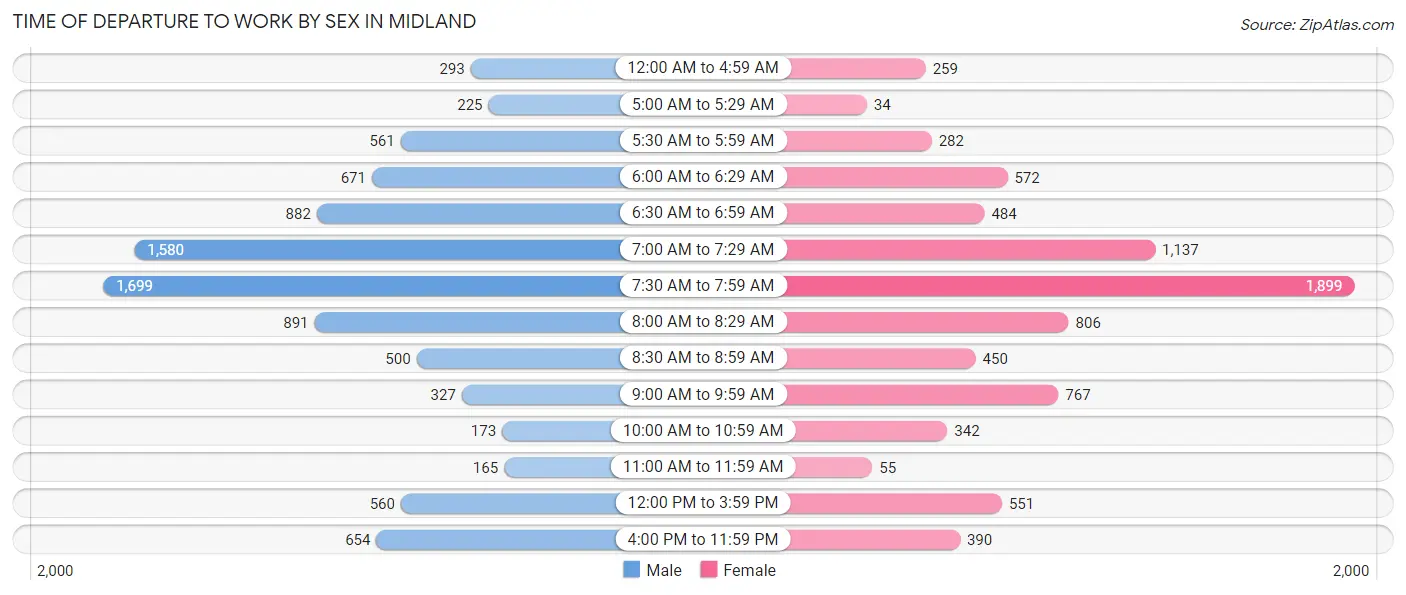
| Time of Departure | Male | Female |
| 12:00 AM to 4:59 AM | 293 (3.2%) | 259 (3.2%) |
| 5:00 AM to 5:29 AM | 225 (2.5%) | 34 (0.4%) |
| 5:30 AM to 5:59 AM | 561 (6.1%) | 282 (3.5%) |
| 6:00 AM to 6:29 AM | 671 (7.3%) | 572 (7.1%) |
| 6:30 AM to 6:59 AM | 882 (9.6%) | 484 (6.0%) |
| 7:00 AM to 7:29 AM | 1,580 (17.2%) | 1,137 (14.2%) |
| 7:30 AM to 7:59 AM | 1,699 (18.5%) | 1,899 (23.6%) |
| 8:00 AM to 8:29 AM | 891 (9.7%) | 806 (10.0%) |
| 8:30 AM to 8:59 AM | 500 (5.4%) | 450 (5.6%) |
| 9:00 AM to 9:59 AM | 327 (3.6%) | 767 (9.6%) |
| 10:00 AM to 10:59 AM | 173 (1.9%) | 342 (4.3%) |
| 11:00 AM to 11:59 AM | 165 (1.8%) | 55 (0.7%) |
| 12:00 PM to 3:59 PM | 560 (6.1%) | 551 (6.9%) |
| 4:00 PM to 11:59 PM | 654 (7.1%) | 390 (4.9%) |
| Total | 9,181 (100.0%) | 8,028 (100.0%) |
Housing Occupancy in Midland
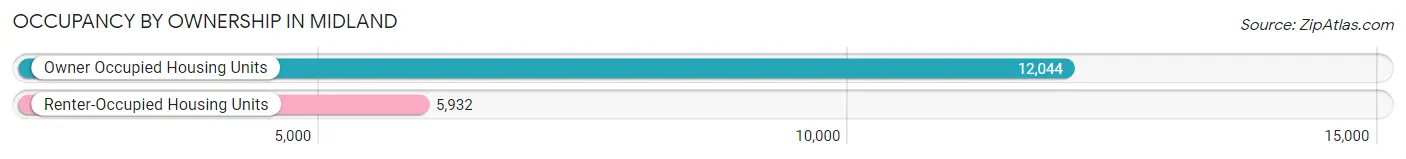
Occupancy by Ownership in Midland
Of the total 17,976 dwellings in Midland, owner-occupied units account for 12,044 (67.0%), while renter-occupied units make up 5,932 (33.0%).
| Occupancy | # Housing Units | % Housing Units |
| Owner Occupied Housing Units | 12,044 | 67.0% |
| Renter-Occupied Housing Units | 5,932 | 33.0% |
| Total Occupied Housing Units | 17,976 | 100.0% |
Occupancy by Household Size in Midland
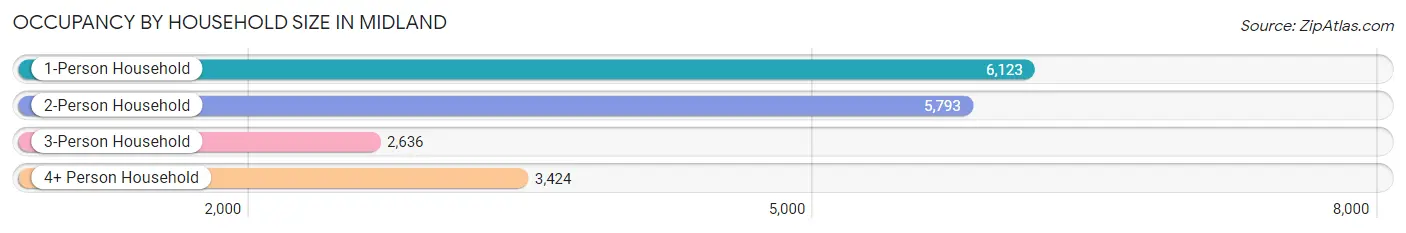
| Household Size | # Housing Units | % Housing Units |
| 1-Person Household | 6,123 | 34.1% |
| 2-Person Household | 5,793 | 32.2% |
| 3-Person Household | 2,636 | 14.7% |
| 4+ Person Household | 3,424 | 19.1% |
| Total Housing Units | 17,976 | 100.0% |
Occupancy by Ownership by Household Size in Midland
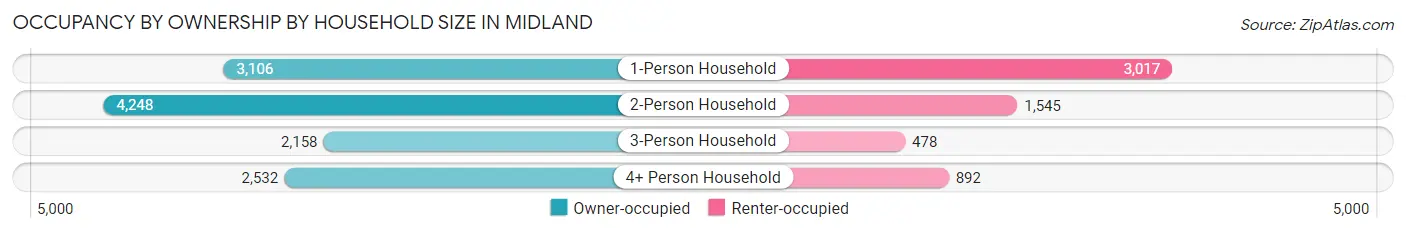
| Household Size | Owner-occupied | Renter-occupied |
| 1-Person Household | 3,106 (50.7%) | 3,017 (49.3%) |
| 2-Person Household | 4,248 (73.3%) | 1,545 (26.7%) |
| 3-Person Household | 2,158 (81.9%) | 478 (18.1%) |
| 4+ Person Household | 2,532 (74.0%) | 892 (26.1%) |
| Total Housing Units | 12,044 (67.0%) | 5,932 (33.0%) |
Occupancy by Educational Attainment in Midland
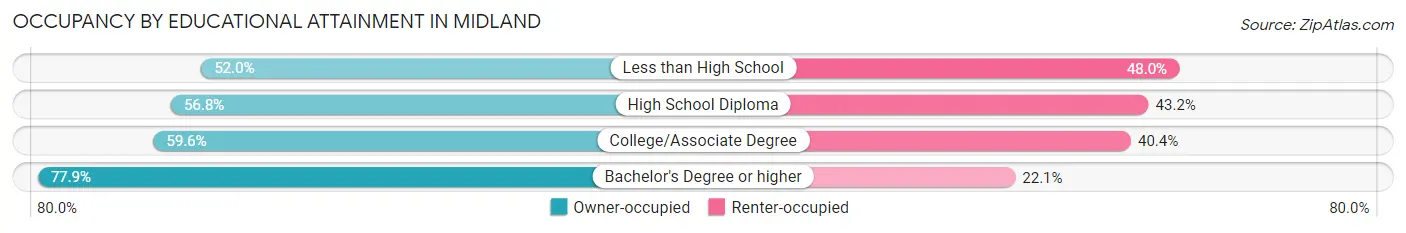
| Household Size | Owner-occupied | Renter-occupied |
| Less than High School | 315 (52.0%) | 291 (48.0%) |
| High School Diploma | 2,183 (56.8%) | 1,662 (43.2%) |
| College/Associate Degree | 3,222 (59.6%) | 2,187 (40.4%) |
| Bachelor's Degree or higher | 6,324 (77.9%) | 1,792 (22.1%) |
Occupancy by Age of Householder in Midland
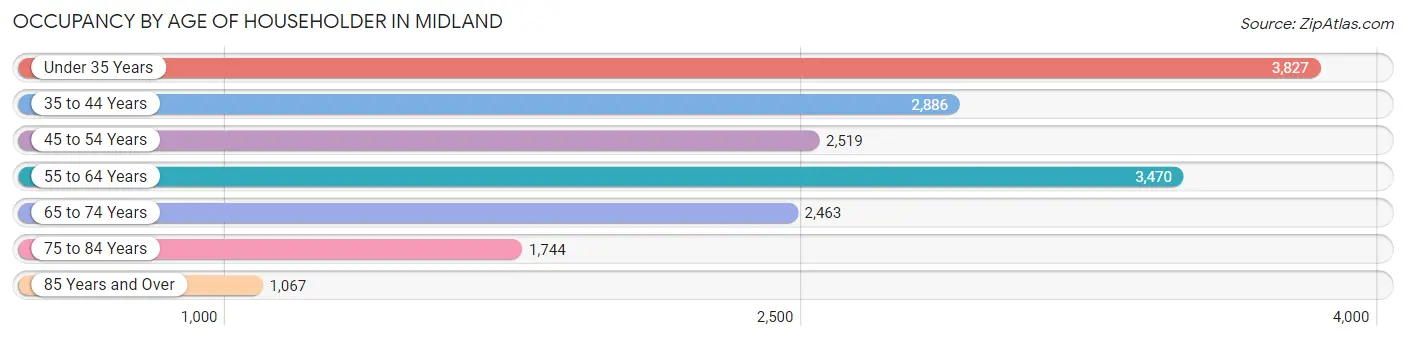
| Age Bracket | # Households | % Households |
| Under 35 Years | 3,827 | 21.3% |
| 35 to 44 Years | 2,886 | 16.1% |
| 45 to 54 Years | 2,519 | 14.0% |
| 55 to 64 Years | 3,470 | 19.3% |
| 65 to 74 Years | 2,463 | 13.7% |
| 75 to 84 Years | 1,744 | 9.7% |
| 85 Years and Over | 1,067 | 5.9% |
| Total | 17,976 | 100.0% |
Housing Finances in Midland
Median Income by Occupancy in Midland
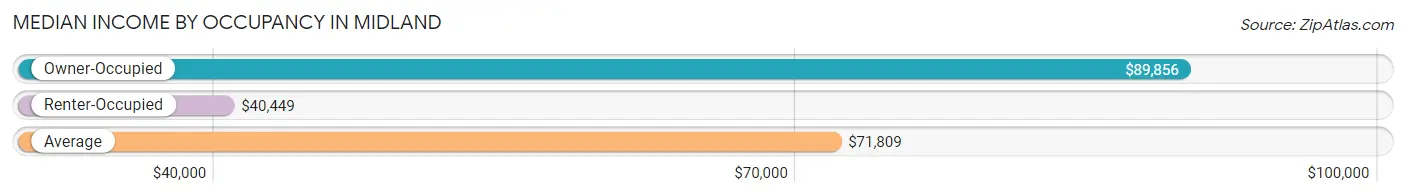
| Occupancy Type | # Households | Median Income |
| Owner-Occupied | 12,044 (67.0%) | $89,856 |
| Renter-Occupied | 5,932 (33.0%) | $40,449 |
| Average | 17,976 (100.0%) | $71,809 |
Occupancy by Householder Income Bracket in Midland
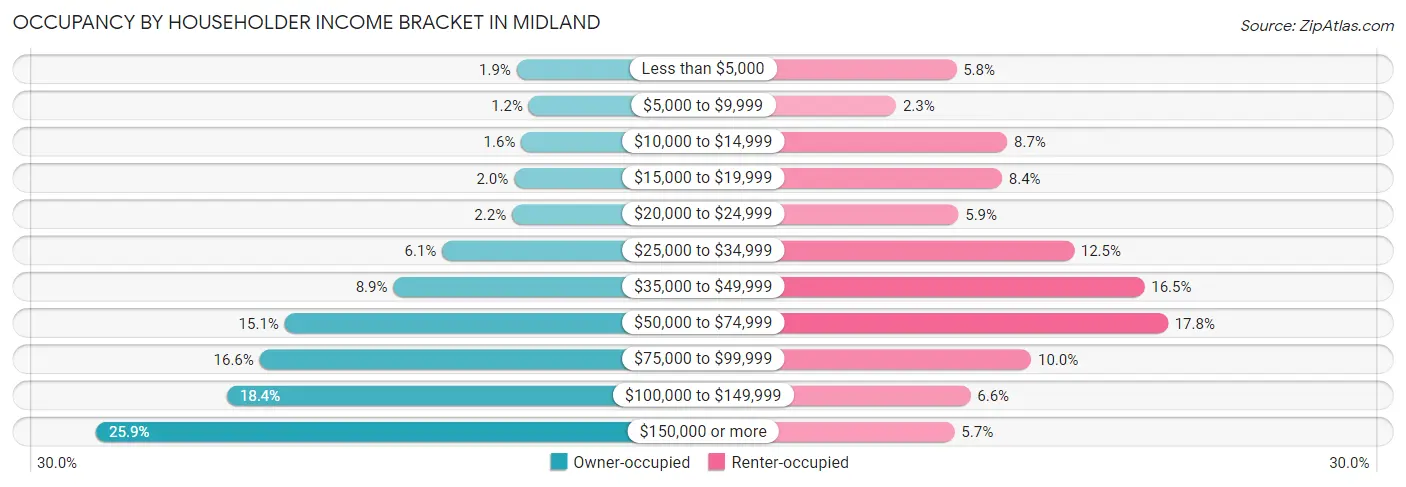
| Income Bracket | Owner-occupied | Renter-occupied |
| Less than $5,000 | 227 (1.9%) | 341 (5.8%) |
| $5,000 to $9,999 | 143 (1.2%) | 137 (2.3%) |
| $10,000 to $14,999 | 195 (1.6%) | 514 (8.7%) |
| $15,000 to $19,999 | 245 (2.0%) | 496 (8.4%) |
| $20,000 to $24,999 | 259 (2.1%) | 348 (5.9%) |
| $25,000 to $34,999 | 739 (6.1%) | 740 (12.5%) |
| $35,000 to $49,999 | 1,075 (8.9%) | 979 (16.5%) |
| $50,000 to $74,999 | 1,823 (15.1%) | 1,058 (17.8%) |
| $75,000 to $99,999 | 1,996 (16.6%) | 595 (10.0%) |
| $100,000 to $149,999 | 2,221 (18.4%) | 389 (6.6%) |
| $150,000 or more | 3,121 (25.9%) | 335 (5.7%) |
| Total | 12,044 (100.0%) | 5,932 (100.0%) |
Monthly Housing Cost Tiers in Midland
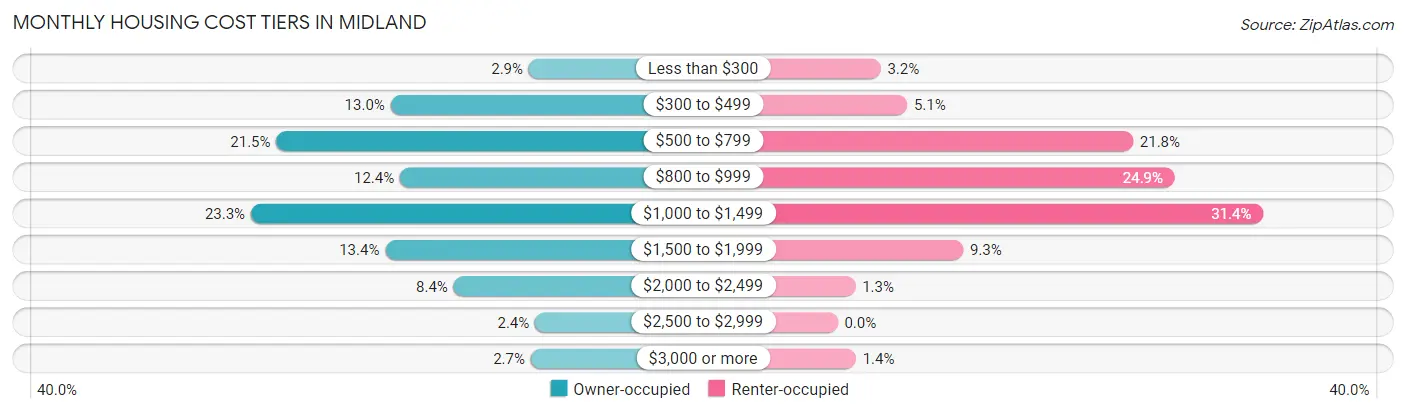
| Monthly Cost | Owner-occupied | Renter-occupied |
| Less than $300 | 344 (2.9%) | 188 (3.2%) |
| $300 to $499 | 1,571 (13.0%) | 304 (5.1%) |
| $500 to $799 | 2,585 (21.5%) | 1,291 (21.8%) |
| $800 to $999 | 1,487 (12.3%) | 1,474 (24.8%) |
| $1,000 to $1,499 | 2,810 (23.3%) | 1,860 (31.4%) |
| $1,500 to $1,999 | 1,619 (13.4%) | 549 (9.2%) |
| $2,000 to $2,499 | 1,012 (8.4%) | 78 (1.3%) |
| $2,500 to $2,999 | 289 (2.4%) | 0 (0.0%) |
| $3,000 or more | 327 (2.7%) | 80 (1.3%) |
| Total | 12,044 (100.0%) | 5,932 (100.0%) |
Physical Housing Characteristics in Midland
Housing Structures in Midland
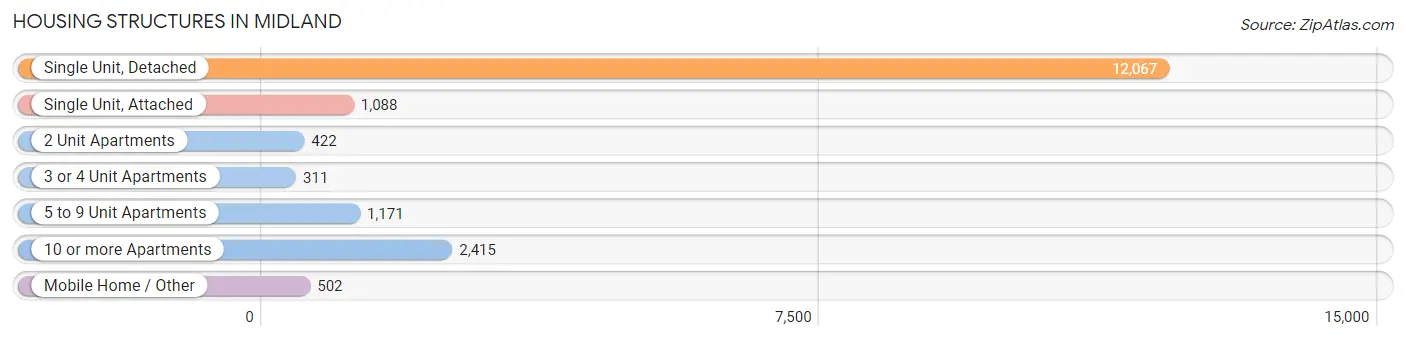
| Structure Type | # Housing Units | % Housing Units |
| Single Unit, Detached | 12,067 | 67.1% |
| Single Unit, Attached | 1,088 | 6.0% |
| 2 Unit Apartments | 422 | 2.4% |
| 3 or 4 Unit Apartments | 311 | 1.7% |
| 5 to 9 Unit Apartments | 1,171 | 6.5% |
| 10 or more Apartments | 2,415 | 13.4% |
| Mobile Home / Other | 502 | 2.8% |
| Total | 17,976 | 100.0% |
Housing Structures by Occupancy in Midland
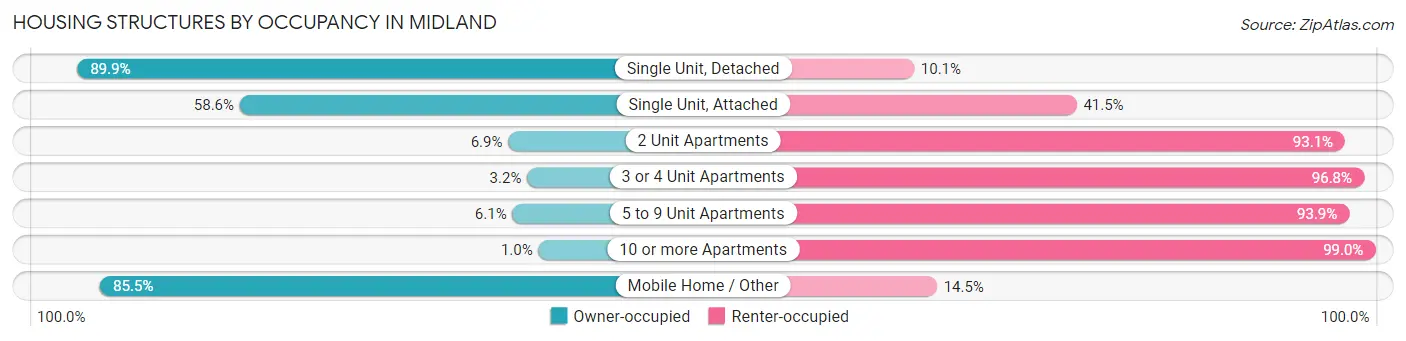
| Structure Type | Owner-occupied | Renter-occupied |
| Single Unit, Detached | 10,843 (89.9%) | 1,224 (10.1%) |
| Single Unit, Attached | 637 (58.6%) | 451 (41.4%) |
| 2 Unit Apartments | 29 (6.9%) | 393 (93.1%) |
| 3 or 4 Unit Apartments | 10 (3.2%) | 301 (96.8%) |
| 5 to 9 Unit Apartments | 71 (6.1%) | 1,100 (93.9%) |
| 10 or more Apartments | 25 (1.0%) | 2,390 (99.0%) |
| Mobile Home / Other | 429 (85.5%) | 73 (14.5%) |
| Total | 12,044 (67.0%) | 5,932 (33.0%) |
Housing Structures by Number of Rooms in Midland
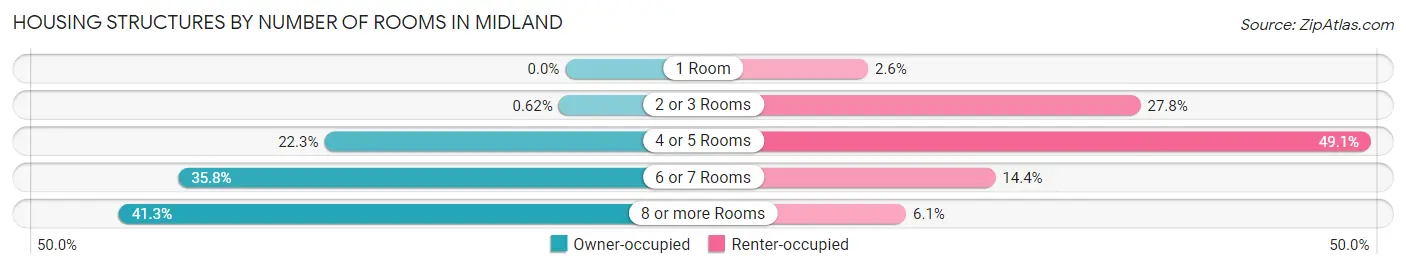
| Number of Rooms | Owner-occupied | Renter-occupied |
| 1 Room | 0 (0.0%) | 154 (2.6%) |
| 2 or 3 Rooms | 75 (0.6%) | 1,649 (27.8%) |
| 4 or 5 Rooms | 2,685 (22.3%) | 2,913 (49.1%) |
| 6 or 7 Rooms | 4,311 (35.8%) | 853 (14.4%) |
| 8 or more Rooms | 4,973 (41.3%) | 363 (6.1%) |
| Total | 12,044 (100.0%) | 5,932 (100.0%) |
Housing Structure by Heating Type in Midland
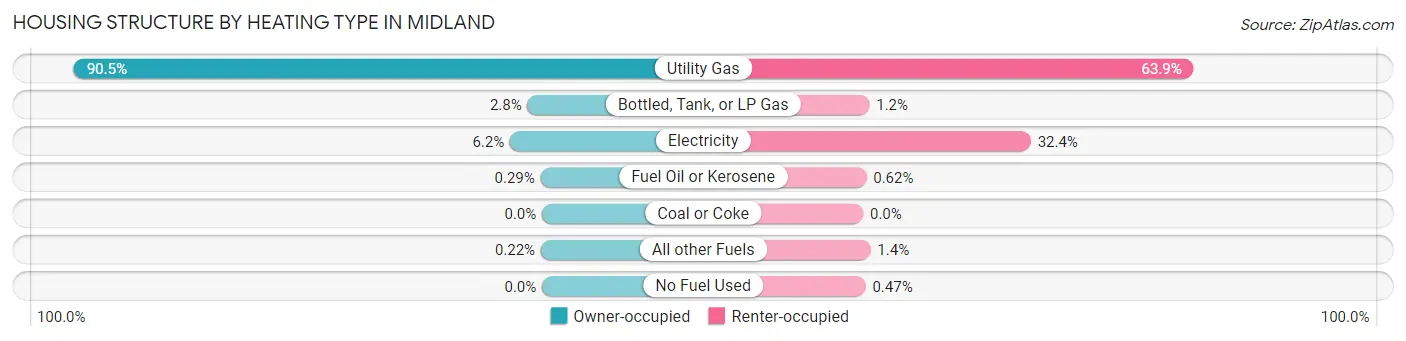
| Heating Type | Owner-occupied | Renter-occupied |
| Utility Gas | 10,900 (90.5%) | 3,789 (63.9%) |
| Bottled, Tank, or LP Gas | 338 (2.8%) | 72 (1.2%) |
| Electricity | 745 (6.2%) | 1,922 (32.4%) |
| Fuel Oil or Kerosene | 35 (0.3%) | 37 (0.6%) |
| Coal or Coke | 0 (0.0%) | 0 (0.0%) |
| All other Fuels | 26 (0.2%) | 84 (1.4%) |
| No Fuel Used | 0 (0.0%) | 28 (0.5%) |
| Total | 12,044 (100.0%) | 5,932 (100.0%) |
Household Vehicle Usage in Midland
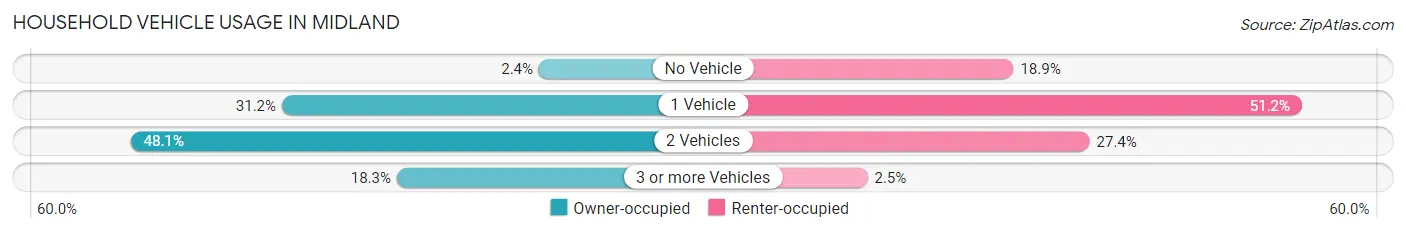
| Vehicles per Household | Owner-occupied | Renter-occupied |
| No Vehicle | 288 (2.4%) | 1,120 (18.9%) |
| 1 Vehicle | 3,755 (31.2%) | 3,036 (51.2%) |
| 2 Vehicles | 5,796 (48.1%) | 1,626 (27.4%) |
| 3 or more Vehicles | 2,205 (18.3%) | 150 (2.5%) |
| Total | 12,044 (100.0%) | 5,932 (100.0%) |
Real Estate & Mortgages in Midland
Real Estate and Mortgage Overview in Midland
| Characteristic | Without Mortgage | With Mortgage |
| Housing Units | 5,144 | 6,900 |
| Median Property Value | $163,700 | $189,500 |
| Median Household Income | $70,821 | $1,944 |
| Monthly Housing Costs | $590 | $316 |
| Real Estate Taxes | $3,097 | $127 |
Property Value by Mortgage Status in Midland
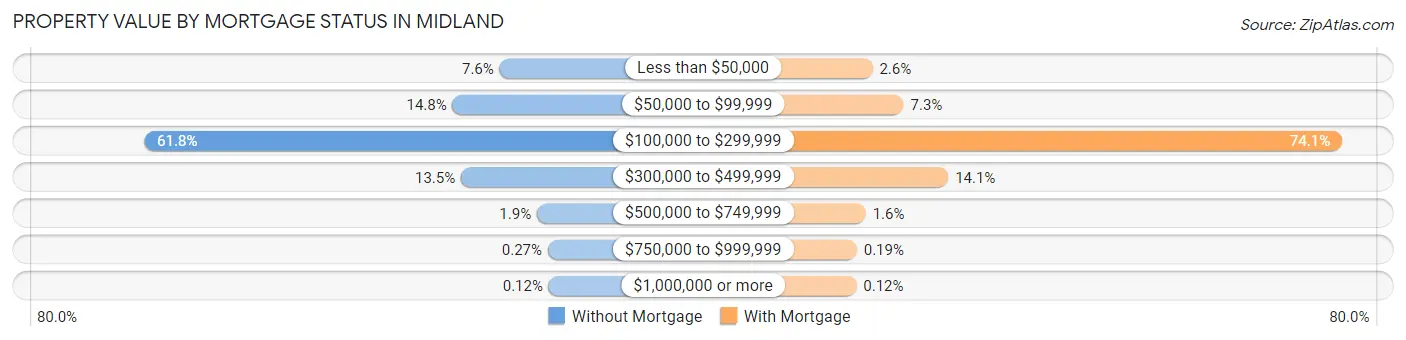
| Property Value | Without Mortgage | With Mortgage |
| Less than $50,000 | 392 (7.6%) | 178 (2.6%) |
| $50,000 to $99,999 | 761 (14.8%) | 505 (7.3%) |
| $100,000 to $299,999 | 3,178 (61.8%) | 5,115 (74.1%) |
| $300,000 to $499,999 | 694 (13.5%) | 974 (14.1%) |
| $500,000 to $749,999 | 99 (1.9%) | 107 (1.5%) |
| $750,000 to $999,999 | 14 (0.3%) | 13 (0.2%) |
| $1,000,000 or more | 6 (0.1%) | 8 (0.1%) |
| Total | 5,144 (100.0%) | 6,900 (100.0%) |
Household Income by Mortgage Status in Midland
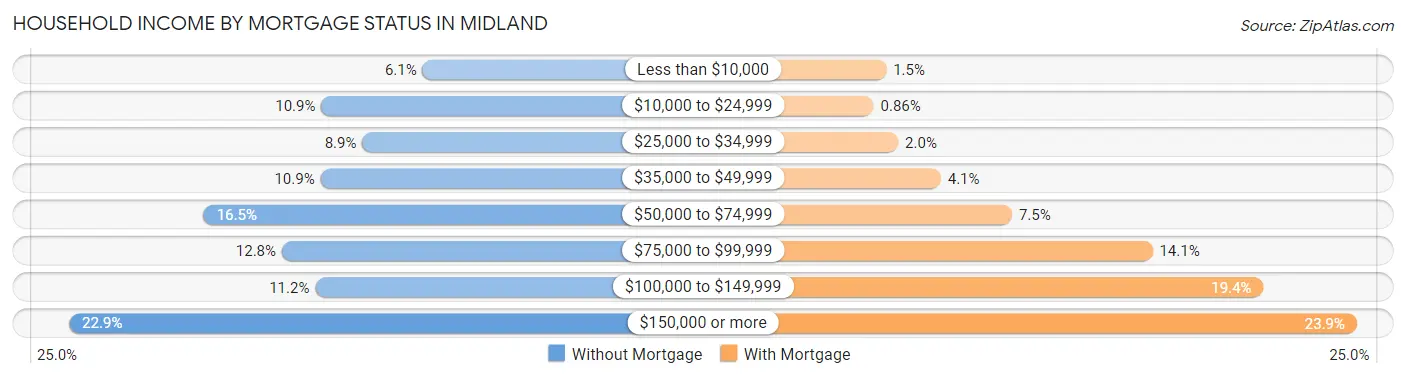
| Household Income | Without Mortgage | With Mortgage |
| Less than $10,000 | 311 (6.0%) | 101 (1.5%) |
| $10,000 to $24,999 | 559 (10.9%) | 59 (0.9%) |
| $25,000 to $34,999 | 459 (8.9%) | 140 (2.0%) |
| $35,000 to $49,999 | 561 (10.9%) | 280 (4.1%) |
| $50,000 to $74,999 | 847 (16.5%) | 514 (7.4%) |
| $75,000 to $99,999 | 656 (12.8%) | 976 (14.1%) |
| $100,000 to $149,999 | 574 (11.2%) | 1,340 (19.4%) |
| $150,000 or more | 1,177 (22.9%) | 1,647 (23.9%) |
| Total | 5,144 (100.0%) | 6,900 (100.0%) |
Property Value to Household Income Ratio in Midland
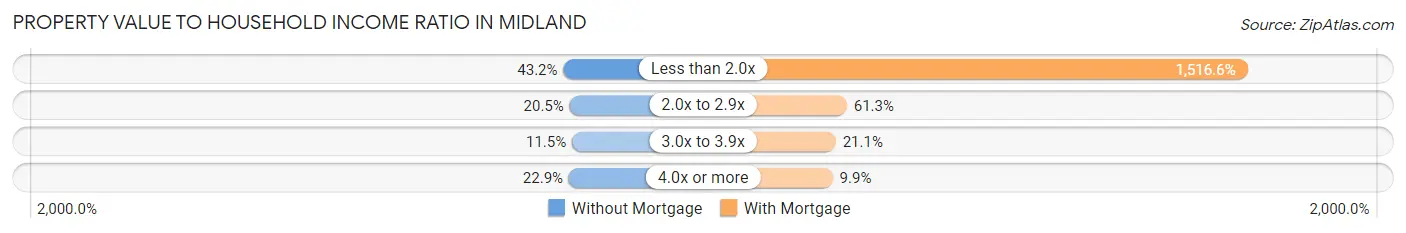
| Value-to-Income Ratio | Without Mortgage | With Mortgage |
| Less than 2.0x | 2,221 (43.2%) | 104,643 (1,516.6%) |
| 2.0x to 2.9x | 1,052 (20.4%) | 4,227 (61.3%) |
| 3.0x to 3.9x | 592 (11.5%) | 1,457 (21.1%) |
| 4.0x or more | 1,176 (22.9%) | 683 (9.9%) |
| Total | 5,144 (100.0%) | 6,900 (100.0%) |
Real Estate Taxes by Mortgage Status in Midland
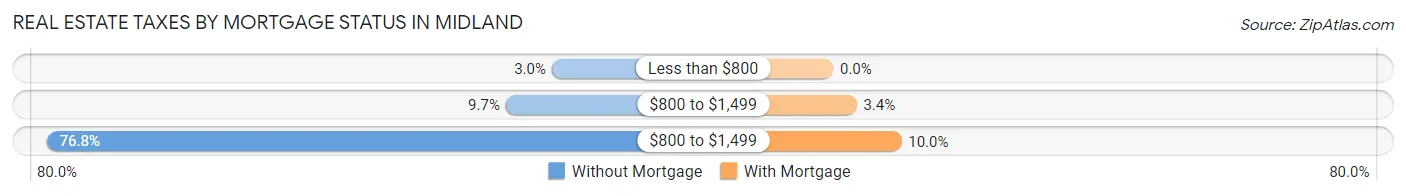
| Property Taxes | Without Mortgage | With Mortgage |
| Less than $800 | 153 (3.0%) | 0 (0.0%) |
| $800 to $1,499 | 499 (9.7%) | 236 (3.4%) |
| $800 to $1,499 | 3,949 (76.8%) | 688 (10.0%) |
| Total | 5,144 (100.0%) | 6,900 (100.0%) |
Health & Disability in Midland
Health Insurance Coverage by Age in Midland
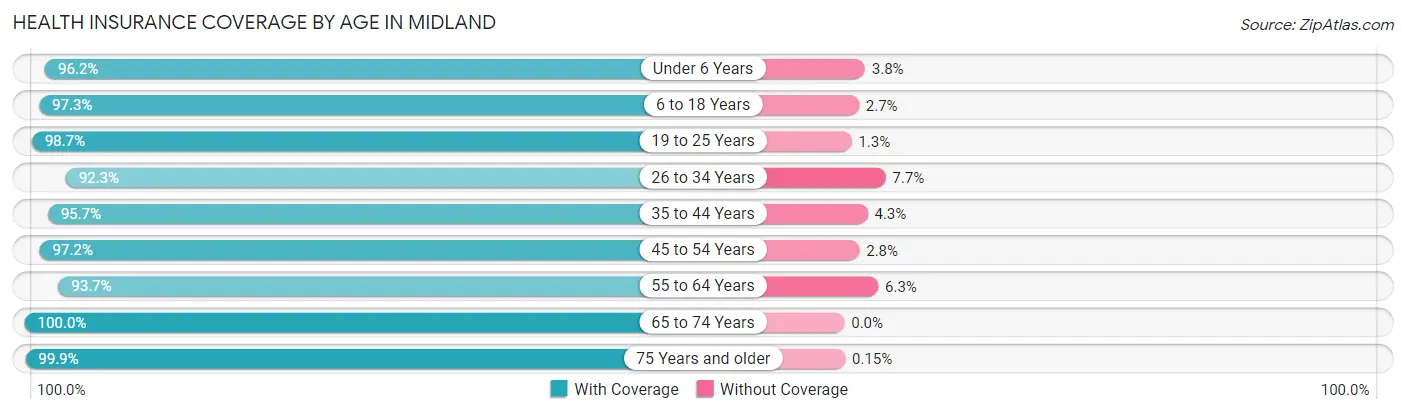
| Age Bracket | With Coverage | Without Coverage |
| Under 6 Years | 2,815 (96.2%) | 112 (3.8%) |
| 6 to 18 Years | 6,530 (97.3%) | 182 (2.7%) |
| 19 to 25 Years | 3,835 (98.7%) | 52 (1.3%) |
| 26 to 34 Years | 4,827 (92.3%) | 401 (7.7%) |
| 35 to 44 Years | 5,069 (95.7%) | 229 (4.3%) |
| 45 to 54 Years | 4,277 (97.2%) | 123 (2.8%) |
| 55 to 64 Years | 4,955 (93.7%) | 333 (6.3%) |
| 65 to 74 Years | 4,063 (100.0%) | 0 (0.0%) |
| 75 Years and older | 3,950 (99.9%) | 6 (0.2%) |
| Total | 40,321 (96.6%) | 1,438 (3.4%) |
Health Insurance Coverage by Citizenship Status in Midland
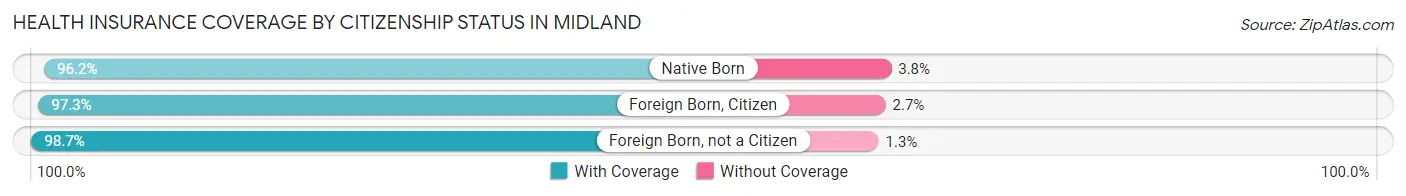
| Citizenship Status | With Coverage | Without Coverage |
| Native Born | 2,815 (96.2%) | 112 (3.8%) |
| Foreign Born, Citizen | 6,530 (97.3%) | 182 (2.7%) |
| Foreign Born, not a Citizen | 3,835 (98.7%) | 52 (1.3%) |
Health Insurance Coverage by Household Income in Midland
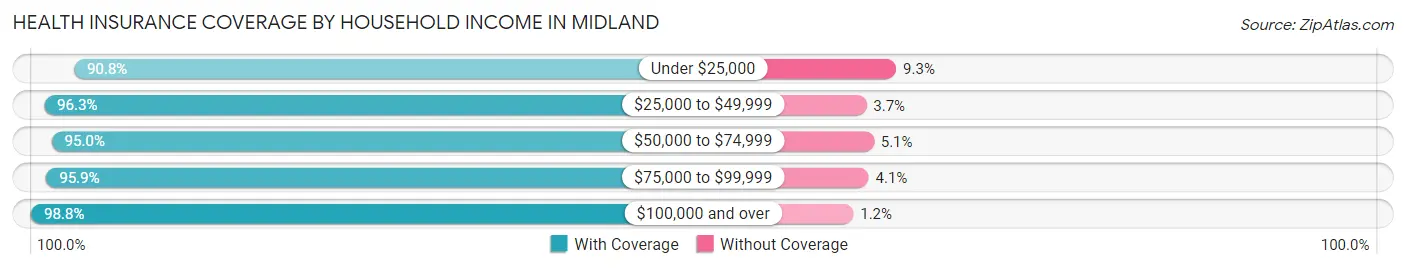
| Household Income | With Coverage | Without Coverage |
| Under $25,000 | 3,726 (90.7%) | 380 (9.2%) |
| $25,000 to $49,999 | 6,269 (96.3%) | 239 (3.7%) |
| $50,000 to $74,999 | 6,031 (95.0%) | 321 (5.1%) |
| $75,000 to $99,999 | 6,089 (95.9%) | 259 (4.1%) |
| $100,000 and over | 17,717 (98.8%) | 219 (1.2%) |
Public vs Private Health Insurance Coverage by Age in Midland
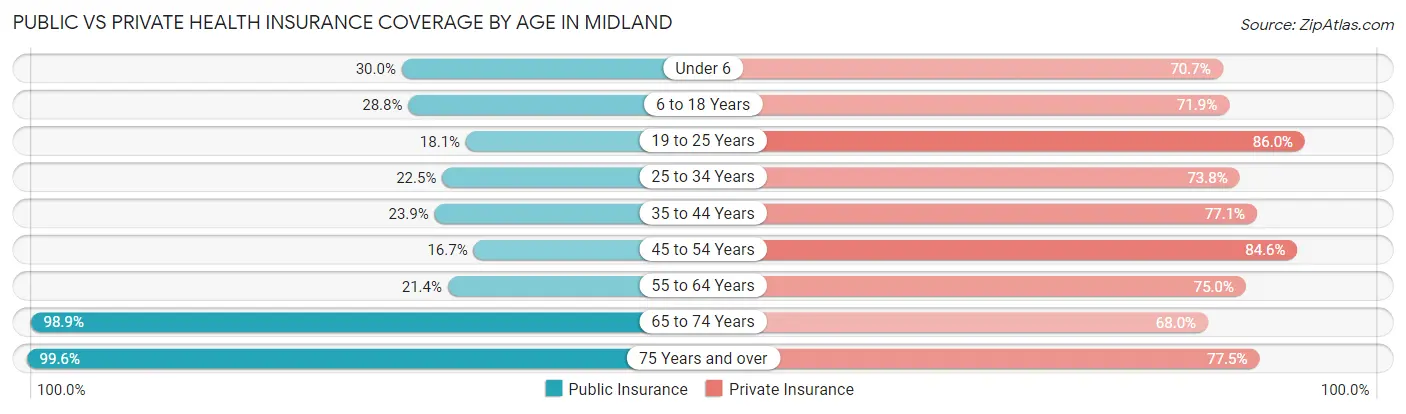
| Age Bracket | Public Insurance | Private Insurance |
| Under 6 | 878 (30.0%) | 2,068 (70.7%) |
| 6 to 18 Years | 1,932 (28.8%) | 4,824 (71.9%) |
| 19 to 25 Years | 703 (18.1%) | 3,341 (86.0%) |
| 25 to 34 Years | 1,175 (22.5%) | 3,859 (73.8%) |
| 35 to 44 Years | 1,267 (23.9%) | 4,082 (77.0%) |
| 45 to 54 Years | 734 (16.7%) | 3,720 (84.6%) |
| 55 to 64 Years | 1,134 (21.4%) | 3,965 (75.0%) |
| 65 to 74 Years | 4,018 (98.9%) | 2,761 (67.9%) |
| 75 Years and over | 3,941 (99.6%) | 3,065 (77.5%) |
| Total | 15,782 (37.8%) | 31,685 (75.9%) |
Disability Status by Sex by Age in Midland
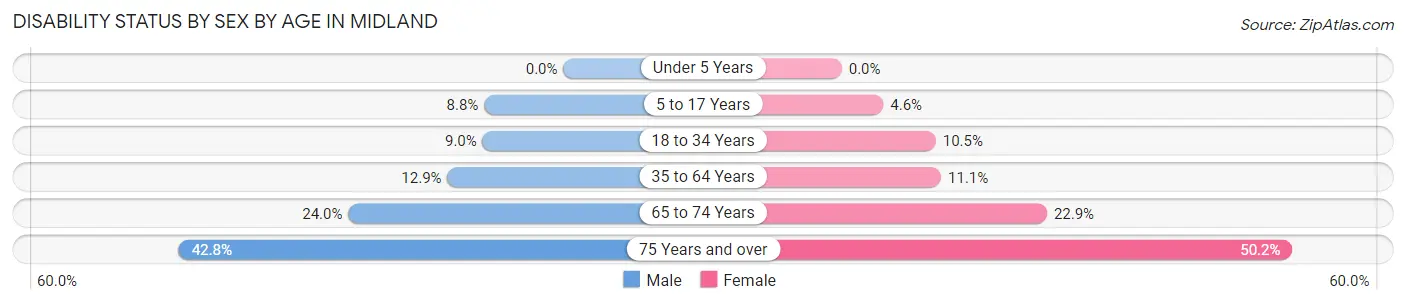
| Age Bracket | Male | Female |
| Under 5 Years | 0 (0.0%) | 0 (0.0%) |
| 5 to 17 Years | 287 (8.8%) | 159 (4.6%) |
| 18 to 34 Years | 436 (9.0%) | 513 (10.5%) |
| 35 to 64 Years | 965 (12.9%) | 831 (11.1%) |
| 65 to 74 Years | 447 (23.9%) | 502 (22.9%) |
| 75 Years and over | 657 (42.8%) | 1,215 (50.2%) |
Disability Class by Sex by Age in Midland
Disability Class: Hearing Difficulty
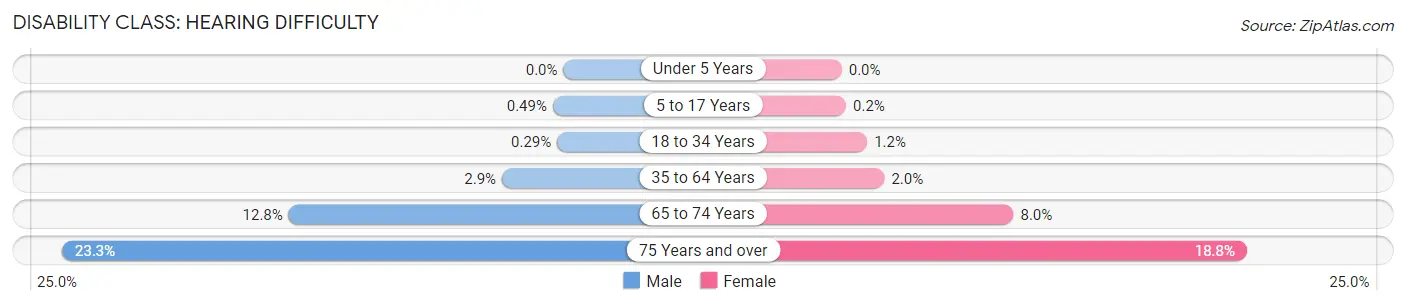
| Age Bracket | Male | Female |
| Under 5 Years | 0 (0.0%) | 0 (0.0%) |
| 5 to 17 Years | 16 (0.5%) | 7 (0.2%) |
| 18 to 34 Years | 14 (0.3%) | 58 (1.2%) |
| 35 to 64 Years | 213 (2.9%) | 149 (2.0%) |
| 65 to 74 Years | 238 (12.8%) | 175 (8.0%) |
| 75 Years and over | 357 (23.3%) | 455 (18.8%) |
Disability Class: Vision Difficulty
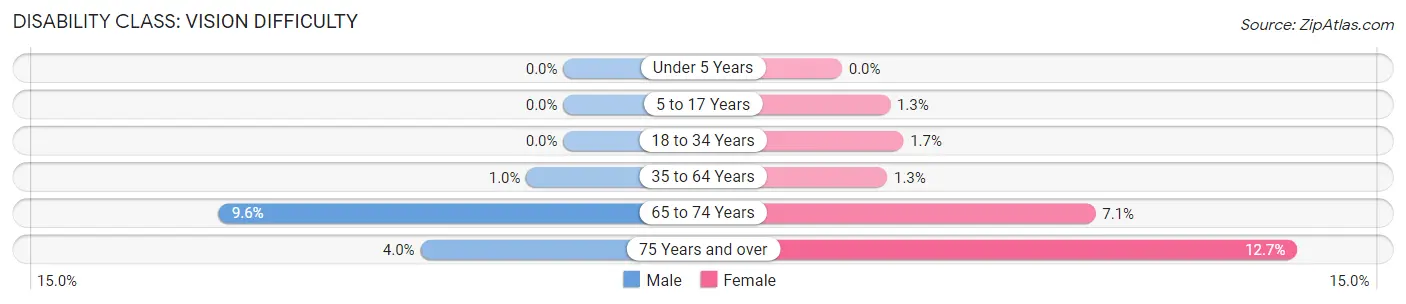
| Age Bracket | Male | Female |
| Under 5 Years | 0 (0.0%) | 0 (0.0%) |
| 5 to 17 Years | 0 (0.0%) | 46 (1.3%) |
| 18 to 34 Years | 0 (0.0%) | 84 (1.7%) |
| 35 to 64 Years | 77 (1.0%) | 95 (1.3%) |
| 65 to 74 Years | 179 (9.6%) | 155 (7.1%) |
| 75 Years and over | 61 (4.0%) | 307 (12.7%) |
Disability Class: Cognitive Difficulty
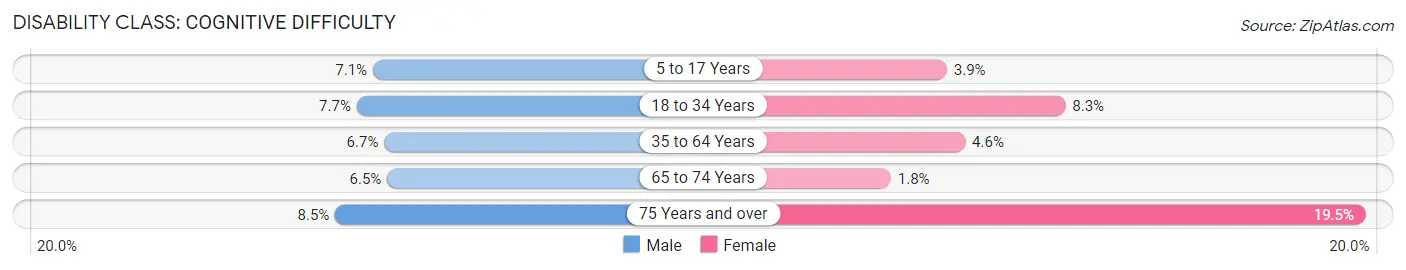
| Age Bracket | Male | Female |
| 5 to 17 Years | 230 (7.1%) | 134 (3.9%) |
| 18 to 34 Years | 372 (7.7%) | 407 (8.3%) |
| 35 to 64 Years | 497 (6.7%) | 344 (4.6%) |
| 65 to 74 Years | 122 (6.5%) | 40 (1.8%) |
| 75 Years and over | 130 (8.5%) | 471 (19.5%) |
Disability Class: Ambulatory Difficulty
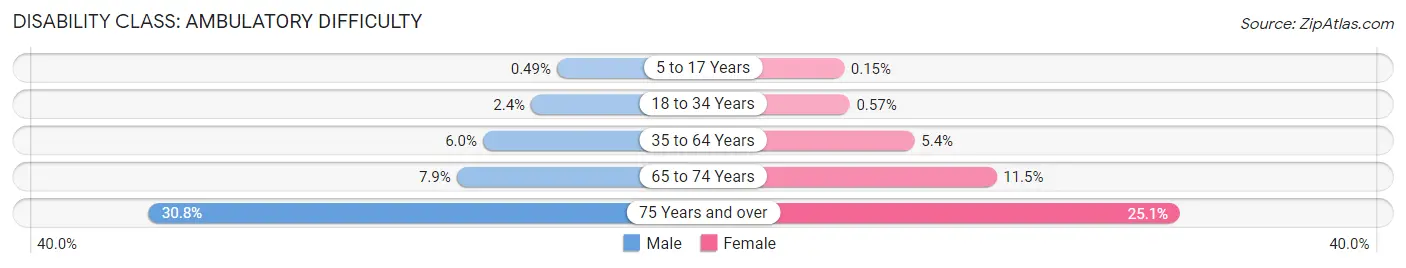
| Age Bracket | Male | Female |
| 5 to 17 Years | 16 (0.5%) | 5 (0.2%) |
| 18 to 34 Years | 117 (2.4%) | 28 (0.6%) |
| 35 to 64 Years | 447 (6.0%) | 405 (5.4%) |
| 65 to 74 Years | 148 (7.9%) | 252 (11.5%) |
| 75 Years and over | 472 (30.8%) | 608 (25.1%) |
Disability Class: Self-Care Difficulty
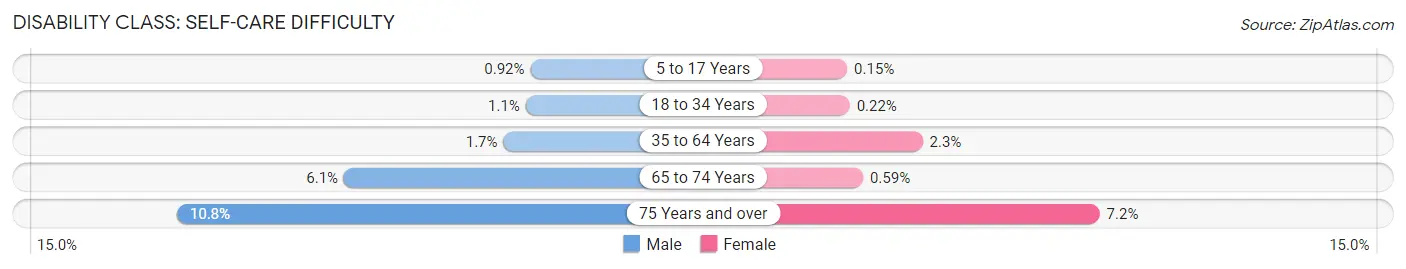
| Age Bracket | Male | Female |
| 5 to 17 Years | 30 (0.9%) | 5 (0.2%) |
| 18 to 34 Years | 51 (1.1%) | 11 (0.2%) |
| 35 to 64 Years | 125 (1.7%) | 169 (2.2%) |
| 65 to 74 Years | 114 (6.1%) | 13 (0.6%) |
| 75 Years and over | 165 (10.8%) | 174 (7.2%) |
Technology Access in Midland
Computing Device Access in Midland
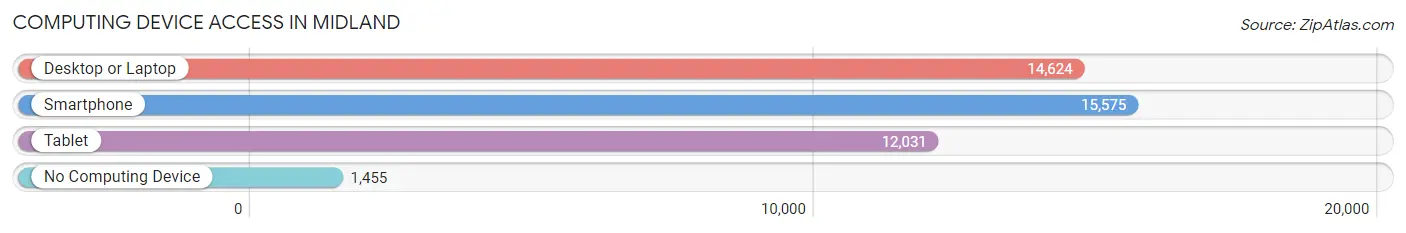
| Device Type | # Households | % Households |
| Desktop or Laptop | 14,624 | 81.4% |
| Smartphone | 15,575 | 86.6% |
| Tablet | 12,031 | 66.9% |
| No Computing Device | 1,455 | 8.1% |
| Total | 17,976 | 100.0% |
Internet Access in Midland
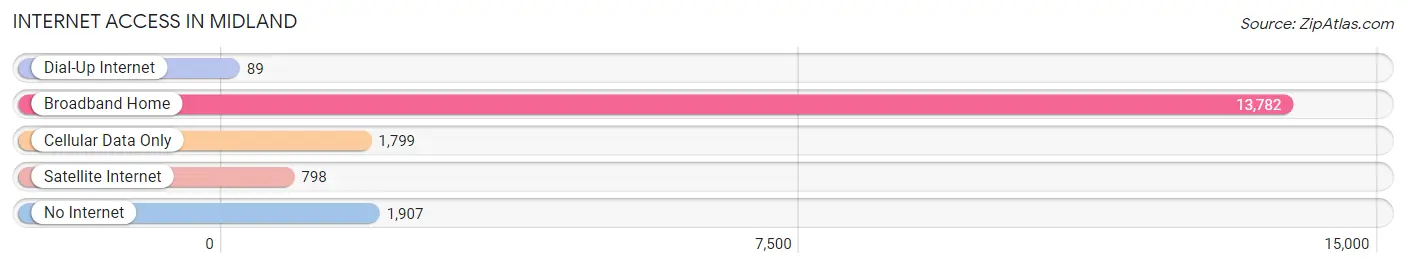
| Internet Type | # Households | % Households |
| Dial-Up Internet | 89 | 0.5% |
| Broadband Home | 13,782 | 76.7% |
| Cellular Data Only | 1,799 | 10.0% |
| Satellite Internet | 798 | 4.4% |
| No Internet | 1,907 | 10.6% |
| Total | 17,976 | 100.0% |
Midland Summary
Midland, Michigan is a city located in the Tri-Cities region of Michigan, along the Tittabawassee River. It is the county seat of Midland County and is located in the center of the state, about halfway between Detroit and Saginaw. The city has a population of 42,000 and is the principal city of the Midland Metropolitan Statistical Area, which has a population of 83,000.
History
Midland was founded in 1858 by John B. Midland, a lumberman from New York. He purchased the land from the Chippewa Indians and named the settlement after himself. The city was incorporated in 1887 and quickly became a center for the lumber industry. The city was also home to a number of other industries, including a sugar beet factory, a paper mill, and a canning factory.
In the early 20th century, Midland was a popular tourist destination, with many people coming to the city to enjoy the natural beauty of the area. The city was also home to a number of resorts, including the Midland Hotel, which was built in 1906.
In the 1950s, Midland began to experience a period of growth and development. The city was home to Dow Chemical Company, which was founded in 1897 and is still headquartered in Midland. The company has been a major employer in the city and has helped to drive the economy.
Geography
Midland is located in the Tri-Cities region of Michigan, along the Tittabawassee River. The city is situated in the center of the state, about halfway between Detroit and Saginaw. The city has a total area of 16.3 square miles, of which 16.2 square miles is land and 0.1 square miles is water.
The city is located in a flat, low-lying area, with the highest point in the city being only about 500 feet above sea level. The city is surrounded by farmland and is home to a number of parks and recreational areas, including the Chippewa Nature Center and the Midland City Forest.
Economy
Midland’s economy is largely driven by the presence of Dow Chemical Company, which is the city’s largest employer. The company has a number of facilities in the city, including a research and development center, a manufacturing plant, and a corporate headquarters.
The city is also home to a number of other industries, including healthcare, retail, and education. The city is home to a number of hospitals, including MidMichigan Medical Center and MidMichigan Health. The city is also home to a number of retail stores, including Walmart, Target, and Meijer.
Demographics
As of the 2010 census, Midland had a population of 41,863. The racial makeup of the city was 87.3% White, 5.7% African American, 0.7% Native American, 1.7% Asian, 0.1% Pacific Islander, and 3.5% from other races. Hispanic or Latino of any race were 5.2% of the population.
The median household income in Midland was $50,867, and the median family income was $63,945. The per capita income in the city was $27,945. About 8.3% of the population was below the poverty line.
Midland is a diverse city, with a variety of cultures and backgrounds represented. The city is home to a number of churches, including Catholic, Protestant, and non-denominational. The city is also home to a number of cultural events, including the Midland County Fair and the Midland Summer Festival.
Common Questions
What is Per Capita Income in Midland?
Per Capita income in Midland is $43,155.
What is the Median Family Income in Midland?
Median Family Income in Midland is $95,170.
What is the Median Household income in Midland?
Median Household Income in Midland is $71,809.
What is Income or Wage Gap in Midland?
Income or Wage Gap in Midland is 29.7%.
Women in Midland earn 70.3 cents for every dollar earned by a man.
What is Family Income Deficit in Midland?
Family Income Deficit in Midland is $11,964.
Families that are below poverty line in Midland earn $11,964 less on average than the poverty threshold level.
What is Inequality or Gini Index in Midland?
Inequality or Gini Index in Midland is 0.47.
What is the Total Population of Midland?
Total Population of Midland is 42,404.
What is the Total Male Population of Midland?
Total Male Population of Midland is 20,647.
What is the Total Female Population of Midland?
Total Female Population of Midland is 21,757.
What is the Ratio of Males per 100 Females in Midland?
There are 94.90 Males per 100 Females in Midland.
What is the Ratio of Females per 100 Males in Midland?
There are 105.38 Females per 100 Males in Midland.
What is the Median Population Age in Midland?
Median Population Age in Midland is 38.8 Years.
What is the Average Family Size in Midland
Average Family Size in Midland is 3.0 People.
What is the Average Household Size in Midland
Average Household Size in Midland is 2.3 People.
How Large is the Labor Force in Midland?
There are 20,413 People in the Labor Forcein in Midland.
What is the Percentage of People in the Labor Force in Midland?
59.3% of People are in the Labor Force in Midland.
What is the Unemployment Rate in Midland?
Unemployment Rate in Midland is 4.5%.