Zip Codes with the Highest Percentage of Population Employed in Architecture & Engineering in Brighton, MI
RELATED REPORTS & OPTIONS
Architecture & Engineering
Brighton
Compare Zip Codes
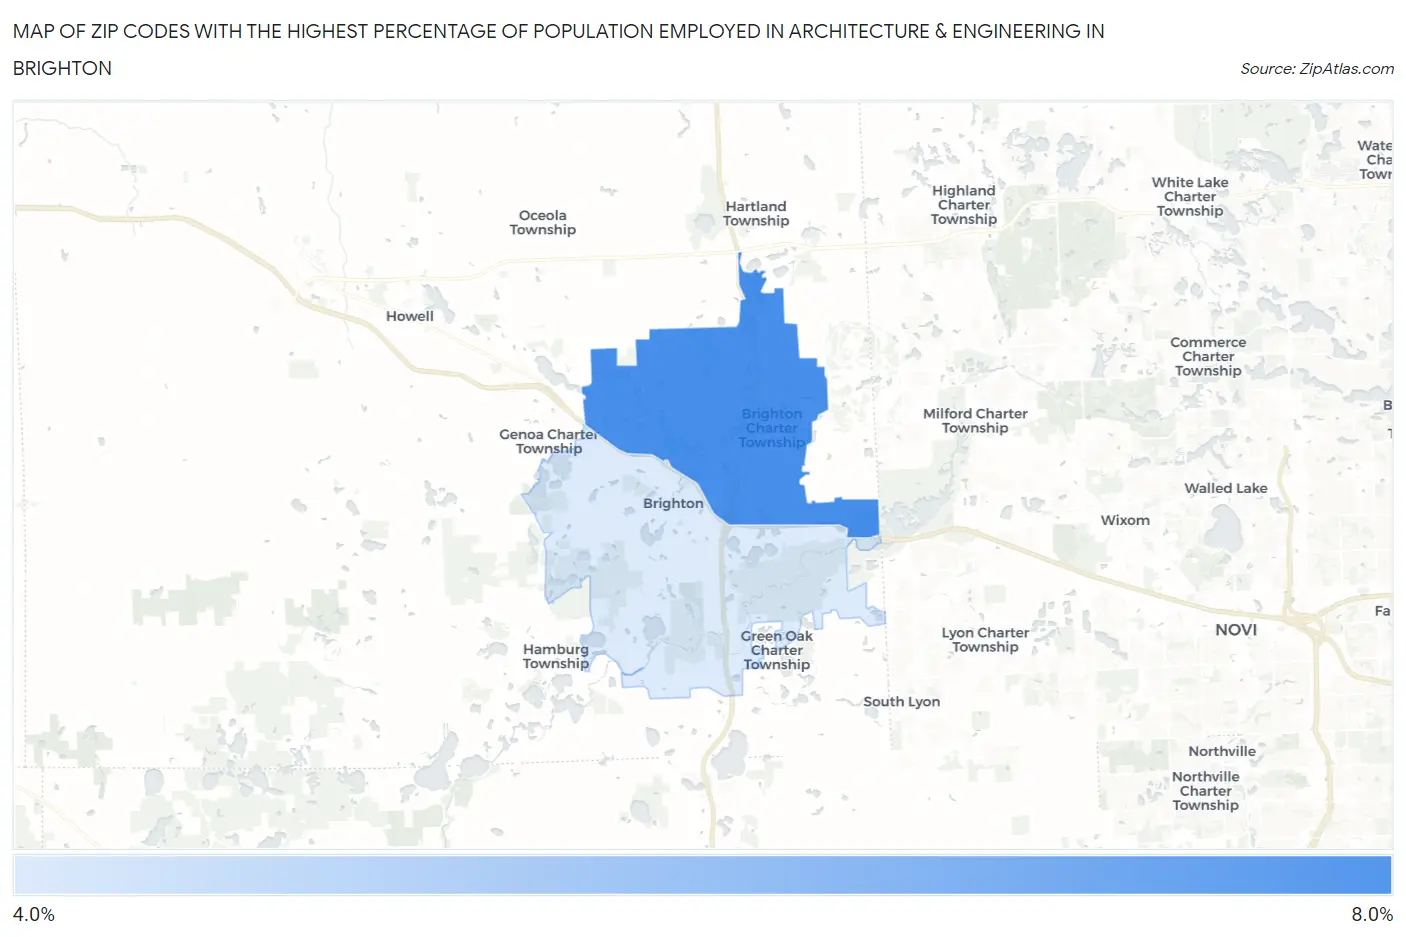
Map of Zip Codes with the Highest Percentage of Population Employed in Architecture & Engineering in Brighton
4.9%
6.5%
Zip Codes with the Highest Percentage of Population Employed in Architecture & Engineering in Brighton, MI
| Zip Code | % Employed | vs State | vs National | |
| 1. | 48114 | 6.5% | 3.4%(+3.16)#57 | 2.1%(+4.38)#880 |
| 2. | 48116 | 4.9% | 3.4%(+1.56)#120 | 2.1%(+2.77)#1,712 |
1
Common Questions
What are the Top Zip Codes with the Highest Percentage of Population Employed in Architecture & Engineering in Brighton, MI?
Top Zip Codes with the Highest Percentage of Population Employed in Architecture & Engineering in Brighton, MI are:
What zip code has the Highest Percentage of Population Employed in Architecture & Engineering in Brighton, MI?
48114 has the Highest Percentage of Population Employed in Architecture & Engineering in Brighton, MI with 6.5%.
What is the Percentage of Population Employed in Architecture & Engineering in Brighton, MI?
Percentage of Population Employed in Architecture & Engineering in Brighton is 6.9%.
What is the Percentage of Population Employed in Architecture & Engineering in Michigan?
Percentage of Population Employed in Architecture & Engineering in Michigan is 3.4%.
What is the Percentage of Population Employed in Architecture & Engineering in the United States?
Percentage of Population Employed in Architecture & Engineering in the United States is 2.1%.