Sterling Heights, MI Map & Demographics
Sterling Heights Map
Sterling Heights Overview
$35,615
PER CAPITA INCOME
$90,488
AVG FAMILY INCOME
$75,381
AVG HOUSEHOLD INCOME
36.4%
WAGE / INCOME GAP [ % ]
63.6¢/ $1
WAGE / INCOME GAP [ $ ]
$8,456
FAMILY INCOME DEFICIT
0.41
INEQUALITY / GINI INDEX
133,744
TOTAL POPULATION
65,238
MALE POPULATION
68,506
FEMALE POPULATION
95.23
MALES / 100 FEMALES
105.01
FEMALES / 100 MALES
41.2
MEDIAN AGE
3.2
AVG FAMILY SIZE
2.6
AVG HOUSEHOLD SIZE
68,659
LABOR FORCE [ PEOPLE ]
62.3%
PERCENT IN LABOR FORCE
5.9%
UNEMPLOYMENT RATE
Sterling Heights Area Codes
Income in Sterling Heights
Income Overview in Sterling Heights
Per Capita Income in Sterling Heights is $35,615, while median incomes of families and households are $90,488 and $75,381 respectively.
| Characteristic | Number | Measure |
| Per Capita Income | 133,744 | $35,615 |
| Median Family Income | 35,080 | $90,488 |
| Mean Family Income | 35,080 | $106,152 |
| Median Household Income | 50,989 | $75,381 |
| Mean Household Income | 50,989 | $92,261 |
| Income Deficit | 35,080 | $8,456 |
| Wage / Income Gap (%) | 133,744 | 36.39% |
| Wage / Income Gap ($) | 133,744 | 63.61¢ per $1 |
| Gini / Inequality Index | 133,744 | 0.41 |
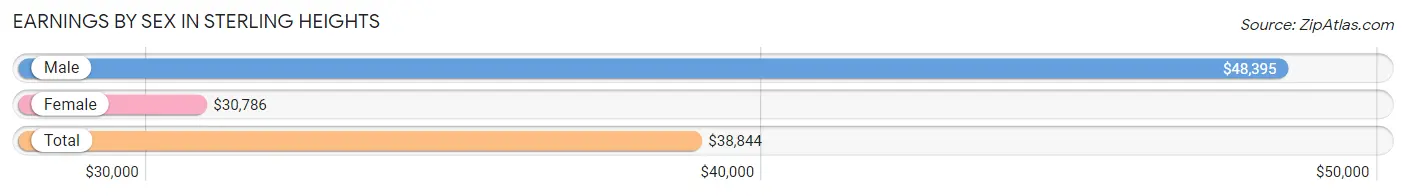
Earnings by Sex in Sterling Heights
Average Earnings in Sterling Heights are $38,844, $48,395 for men and $30,786 for women, a difference of 36.4%.
| Sex | Number | Average Earnings |
| Male | 38,782 (54.3%) | $48,395 |
| Female | 32,648 (45.7%) | $30,786 |
| Total | 71,430 (100.0%) | $38,844 |
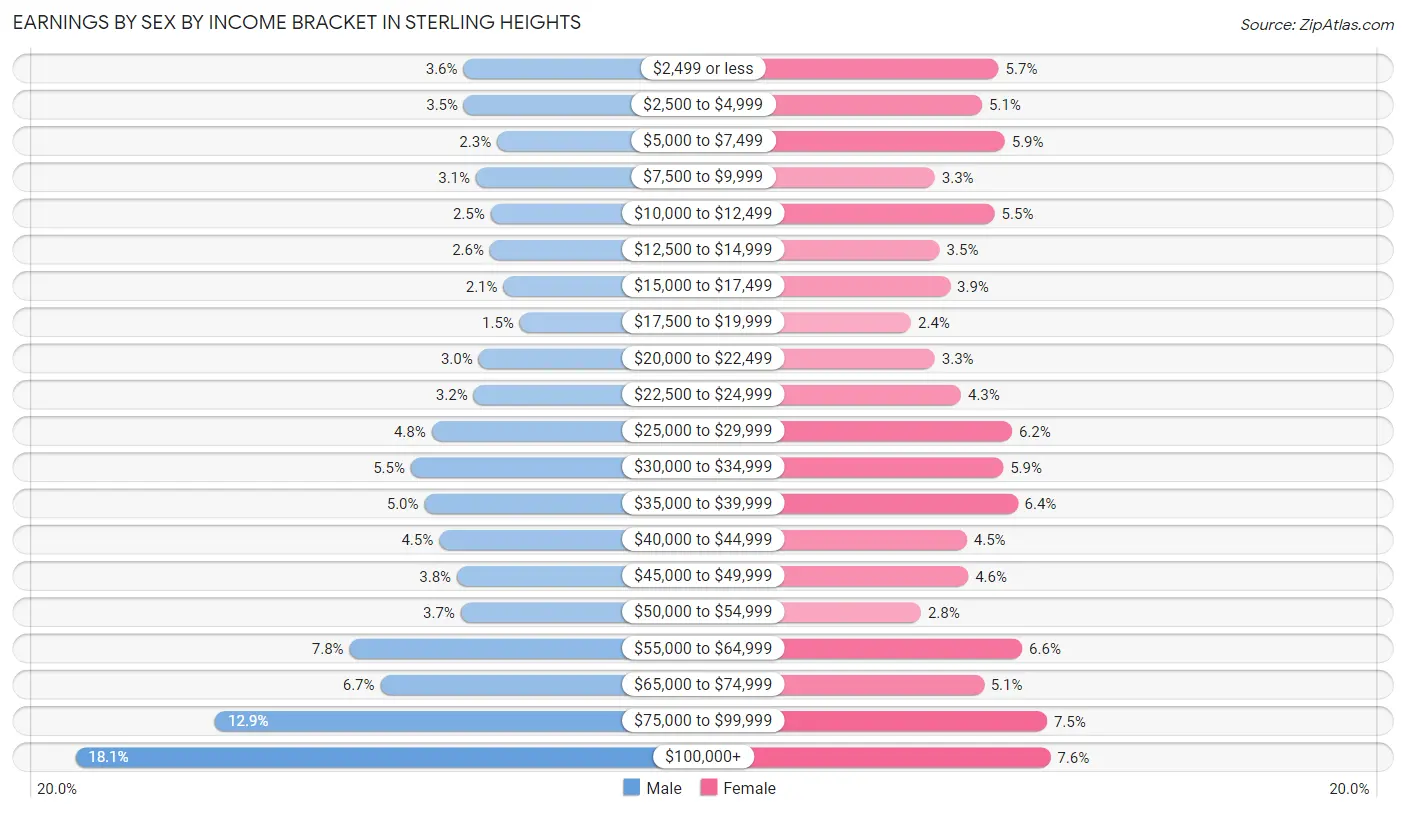
Earnings by Sex by Income Bracket in Sterling Heights
The most common earnings brackets in Sterling Heights are $100,000+ for men (7,018 | 18.1%) and $100,000+ for women (2,492 | 7.6%).
| Income | Male | Female |
| $2,499 or less | 1,381 (3.6%) | 1,859 (5.7%) |
| $2,500 to $4,999 | 1,374 (3.5%) | 1,655 (5.1%) |
| $5,000 to $7,499 | 893 (2.3%) | 1,933 (5.9%) |
| $7,500 to $9,999 | 1,200 (3.1%) | 1,076 (3.3%) |
| $10,000 to $12,499 | 986 (2.5%) | 1,810 (5.5%) |
| $12,500 to $14,999 | 998 (2.6%) | 1,137 (3.5%) |
| $15,000 to $17,499 | 800 (2.1%) | 1,264 (3.9%) |
| $17,500 to $19,999 | 561 (1.5%) | 788 (2.4%) |
| $20,000 to $22,499 | 1,160 (3.0%) | 1,077 (3.3%) |
| $22,500 to $24,999 | 1,234 (3.2%) | 1,396 (4.3%) |
| $25,000 to $29,999 | 1,843 (4.8%) | 2,022 (6.2%) |
| $30,000 to $34,999 | 2,145 (5.5%) | 1,914 (5.9%) |
| $35,000 to $39,999 | 1,948 (5.0%) | 2,088 (6.4%) |
| $40,000 to $44,999 | 1,734 (4.5%) | 1,470 (4.5%) |
| $45,000 to $49,999 | 1,475 (3.8%) | 1,487 (4.5%) |
| $50,000 to $54,999 | 1,421 (3.7%) | 909 (2.8%) |
| $55,000 to $64,999 | 3,036 (7.8%) | 2,145 (6.6%) |
| $65,000 to $74,999 | 2,586 (6.7%) | 1,676 (5.1%) |
| $75,000 to $99,999 | 4,989 (12.9%) | 2,450 (7.5%) |
| $100,000+ | 7,018 (18.1%) | 2,492 (7.6%) |
| Total | 38,782 (100.0%) | 32,648 (100.0%) |
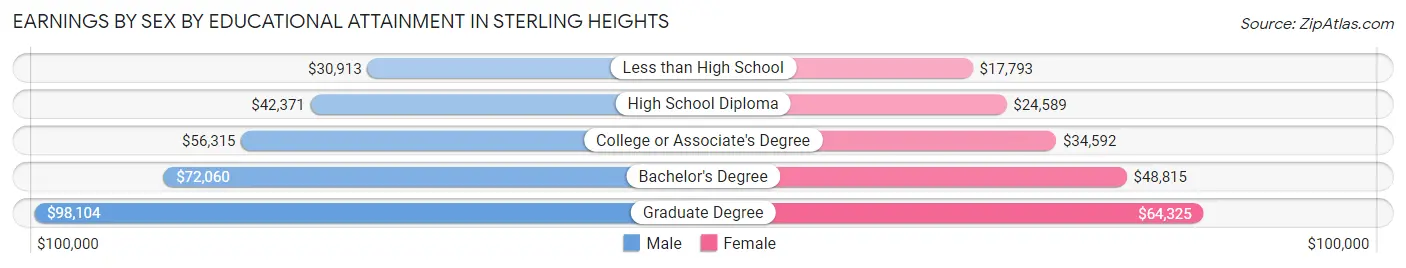
Earnings by Sex by Educational Attainment in Sterling Heights
Average earnings in Sterling Heights are $56,005 for men and $35,902 for women, a difference of 35.9%. Men with an educational attainment of graduate degree enjoy the highest average annual earnings of $98,104, while those with less than high school education earn the least with $30,913. Women with an educational attainment of graduate degree earn the most with the average annual earnings of $64,325, while those with less than high school education have the smallest earnings of $17,793.
| Educational Attainment | Male Income | Female Income |
| Less than High School | $30,913 | $17,793 |
| High School Diploma | $42,371 | $24,589 |
| College or Associate's Degree | $56,315 | $34,592 |
| Bachelor's Degree | $72,060 | $48,815 |
| Graduate Degree | $98,104 | $64,325 |
| Total | $56,005 | $35,902 |
Family Income in Sterling Heights
Family Income Brackets in Sterling Heights
According to the Sterling Heights family income data, there are 8,033 families falling into the $100,000 to $149,999 income range, which is the most common income bracket and makes up 22.9% of all families. Conversely, the less than $10,000 income bracket is the least frequent group with only 561 families (1.6%) belonging to this category.
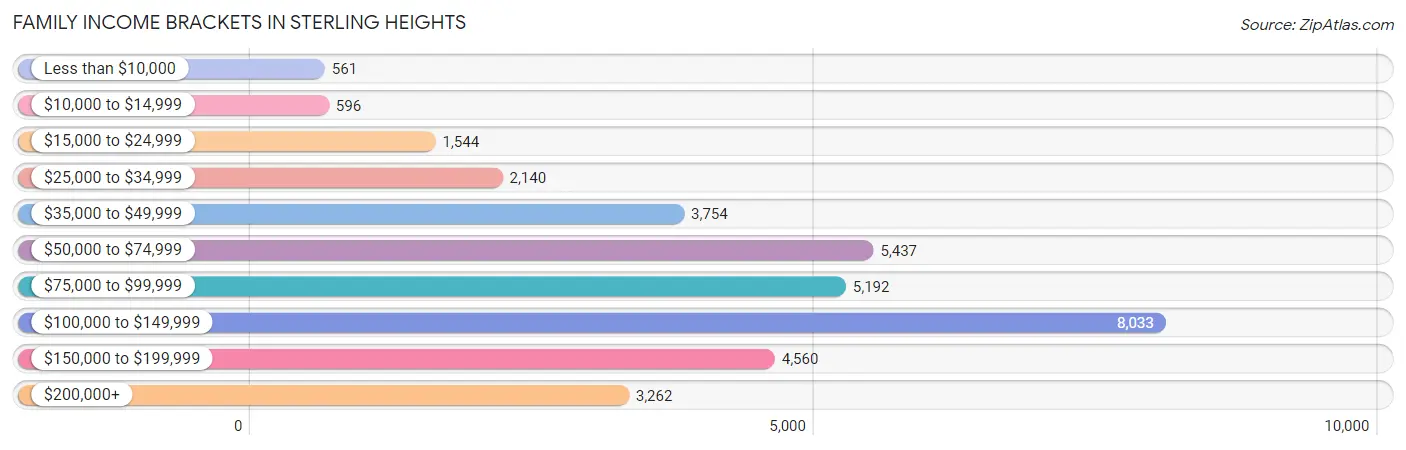
| Income Bracket | # Families | % Families |
| Less than $10,000 | 561 | 1.6% |
| $10,000 to $14,999 | 596 | 1.7% |
| $15,000 to $24,999 | 1,544 | 4.4% |
| $25,000 to $34,999 | 2,140 | 6.1% |
| $35,000 to $49,999 | 3,754 | 10.7% |
| $50,000 to $74,999 | 5,437 | 15.5% |
| $75,000 to $99,999 | 5,192 | 14.8% |
| $100,000 to $149,999 | 8,033 | 22.9% |
| $150,000 to $199,999 | 4,560 | 13.0% |
| $200,000+ | 3,262 | 9.3% |
Family Income by Famaliy Size in Sterling Heights
5-person families (3,701 | 10.5%) account for the highest median family income in Sterling Heights with $114,323 per family, while 2-person families (15,351 | 43.8%) have the highest median income of $39,535 per family member.
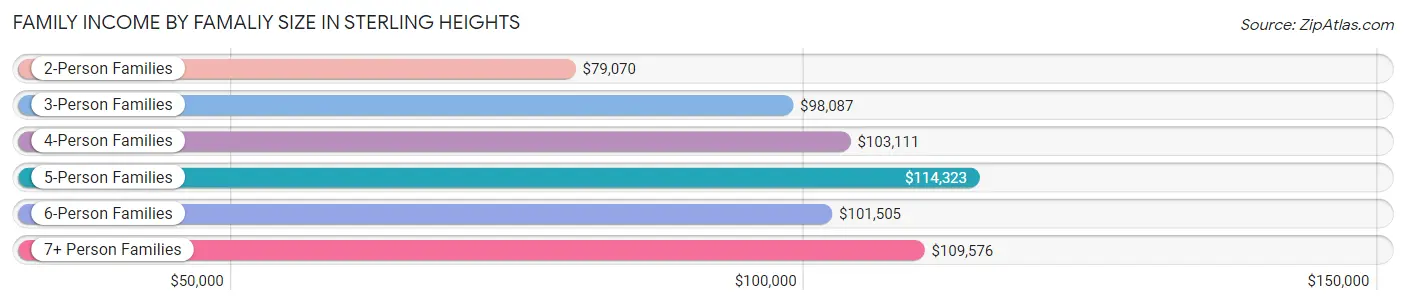
| Income Bracket | # Families | Median Income |
| 2-Person Families | 15,351 (43.8%) | $79,070 |
| 3-Person Families | 7,866 (22.4%) | $98,087 |
| 4-Person Families | 6,406 (18.3%) | $103,111 |
| 5-Person Families | 3,701 (10.5%) | $114,323 |
| 6-Person Families | 1,217 (3.5%) | $101,505 |
| 7+ Person Families | 539 (1.5%) | $109,576 |
| Total | 35,080 (100.0%) | $90,488 |
Family Income by Number of Earners in Sterling Heights
The median family income in Sterling Heights is $90,488, with families comprising 3+ earners (5,726) having the highest median family income of $146,990, while families with no earners (5,133) have the lowest median family income of $56,201, accounting for 16.3% and 14.6% of families, respectively.
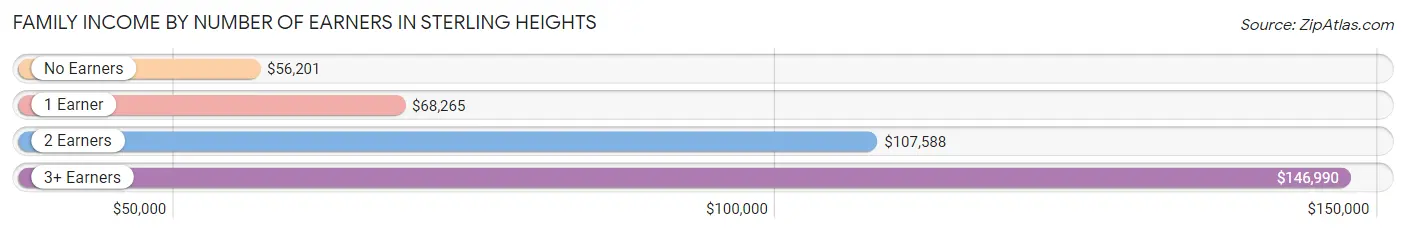
| Number of Earners | # Families | Median Income |
| No Earners | 5,133 (14.6%) | $56,201 |
| 1 Earner | 10,569 (30.1%) | $68,265 |
| 2 Earners | 13,652 (38.9%) | $107,588 |
| 3+ Earners | 5,726 (16.3%) | $146,990 |
| Total | 35,080 (100.0%) | $90,488 |
Household Income in Sterling Heights
Household Income Brackets in Sterling Heights
With 10,147 households falling in the category, the $100,000 to $149,999 income range is the most frequent in Sterling Heights, accounting for 19.9% of all households. In contrast, only 1,581 households (3.1%) fall into the $10,000 to $14,999 income bracket, making it the least populous group.
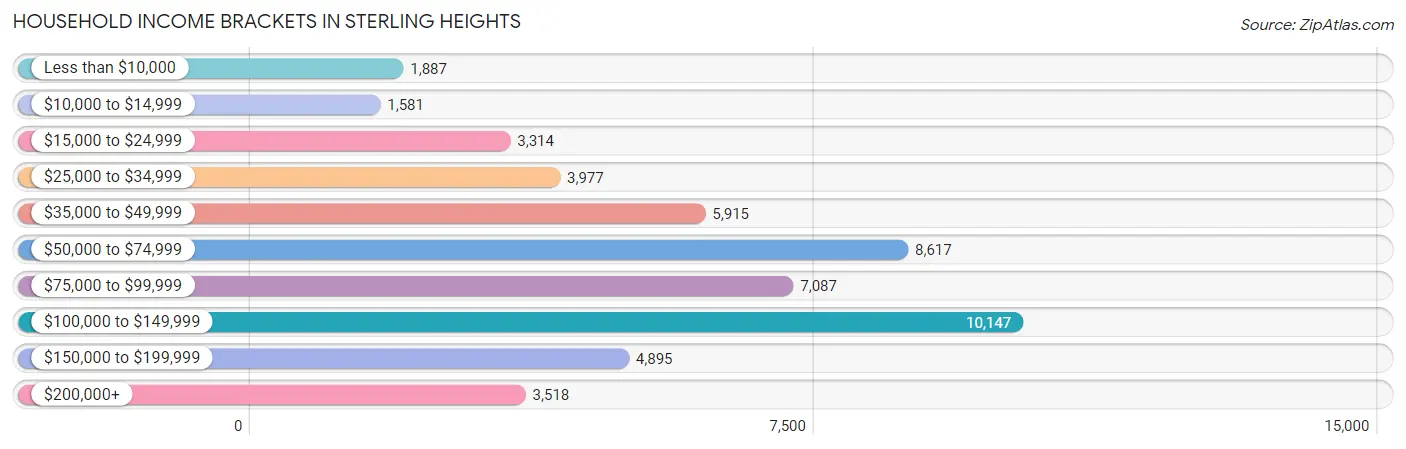
| Income Bracket | # Households | % Households |
| Less than $10,000 | 1,887 | 3.7% |
| $10,000 to $14,999 | 1,581 | 3.1% |
| $15,000 to $24,999 | 3,314 | 6.5% |
| $25,000 to $34,999 | 3,977 | 7.8% |
| $35,000 to $49,999 | 5,915 | 11.6% |
| $50,000 to $74,999 | 8,617 | 16.9% |
| $75,000 to $99,999 | 7,087 | 13.9% |
| $100,000 to $149,999 | 10,147 | 19.9% |
| $150,000 to $199,999 | 4,895 | 9.6% |
| $200,000+ | 3,518 | 6.9% |
Household Income by Householder Age in Sterling Heights
The median household income in Sterling Heights is $75,381, with the highest median household income of $91,188 found in the 45 to 64 years age bracket for the primary householder. A total of 20,455 households (40.1%) fall into this category. Meanwhile, the 65+ years age bracket for the primary householder has the lowest median household income of $55,428, with 14,268 households (28.0%) in this group.
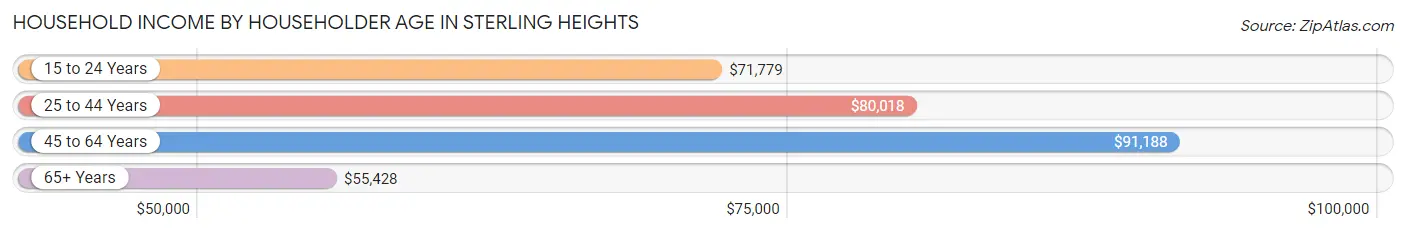
| Income Bracket | # Households | Median Income |
| 15 to 24 Years | 1,162 (2.3%) | $71,779 |
| 25 to 44 Years | 15,104 (29.6%) | $80,018 |
| 45 to 64 Years | 20,455 (40.1%) | $91,188 |
| 65+ Years | 14,268 (28.0%) | $55,428 |
| Total | 50,989 (100.0%) | $75,381 |
Poverty in Sterling Heights
Income Below Poverty by Sex and Age in Sterling Heights
With 9.0% poverty level for males and 11.6% for females among the residents of Sterling Heights, 6 to 11 year old males and 5 year old females are the most vulnerable to poverty, with 950 males (20.8%) and 144 females (24.1%) in their respective age groups living below the poverty level.
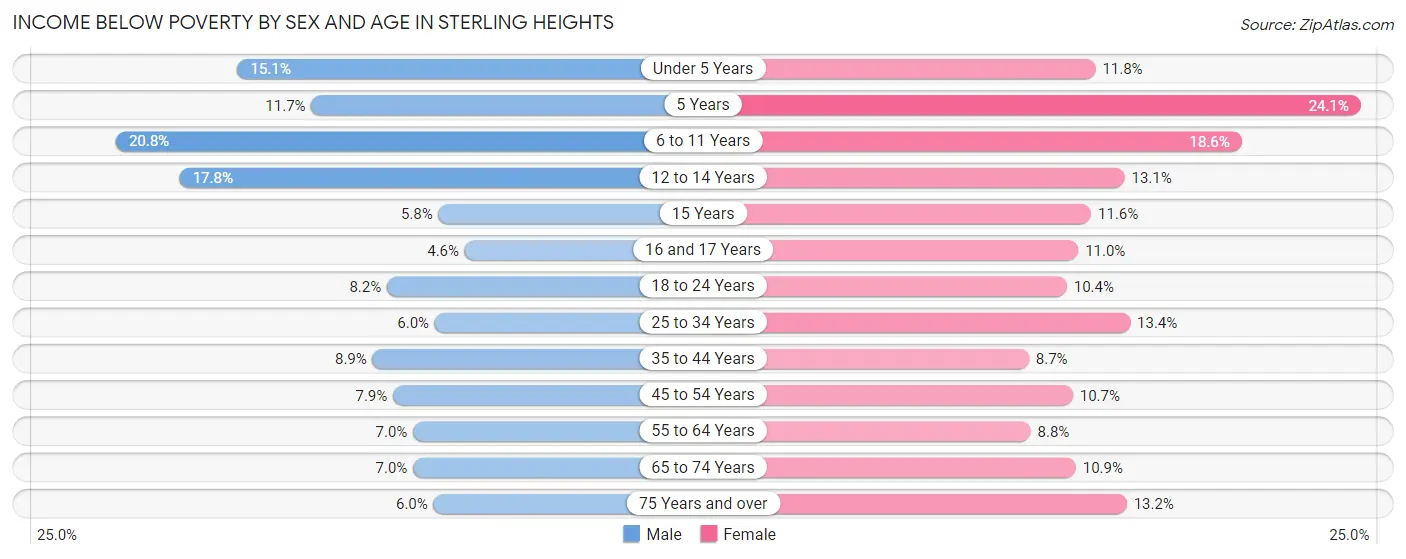
| Age Bracket | Male | Female |
| Under 5 Years | 484 (15.1%) | 462 (11.8%) |
| 5 Years | 83 (11.7%) | 144 (24.1%) |
| 6 to 11 Years | 950 (20.8%) | 769 (18.5%) |
| 12 to 14 Years | 458 (17.8%) | 273 (13.1%) |
| 15 Years | 30 (5.8%) | 104 (11.6%) |
| 16 and 17 Years | 76 (4.6%) | 206 (11.0%) |
| 18 to 24 Years | 450 (8.2%) | 569 (10.4%) |
| 25 to 34 Years | 565 (6.0%) | 1,299 (13.4%) |
| 35 to 44 Years | 660 (8.8%) | 660 (8.7%) |
| 45 to 54 Years | 725 (7.9%) | 992 (10.7%) |
| 55 to 64 Years | 667 (7.0%) | 822 (8.8%) |
| 65 to 74 Years | 455 (7.0%) | 760 (10.9%) |
| 75 Years and over | 234 (6.0%) | 805 (13.2%) |
| Total | 5,837 (9.0%) | 7,865 (11.6%) |
Income Above Poverty by Sex and Age in Sterling Heights
According to the poverty statistics in Sterling Heights, males aged 16 and 17 years and females aged 35 to 44 years are the age groups that are most secure financially, with 95.4% of males and 91.3% of females in these age groups living above the poverty line.
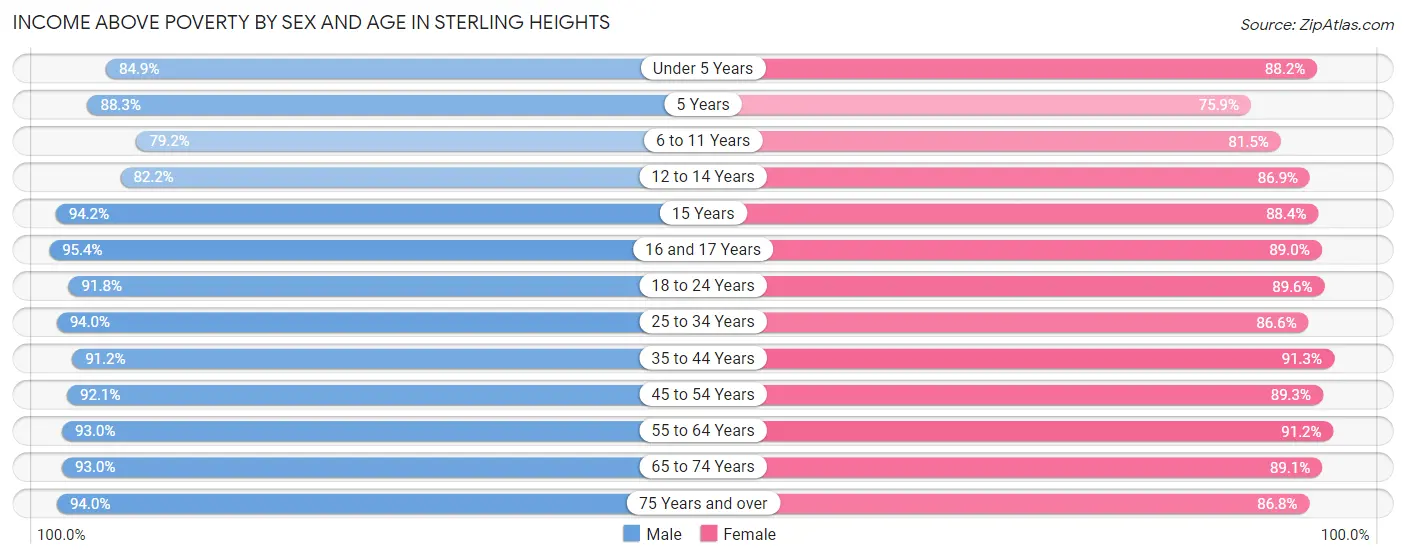
| Age Bracket | Male | Female |
| Under 5 Years | 2,716 (84.9%) | 3,464 (88.2%) |
| 5 Years | 627 (88.3%) | 454 (75.9%) |
| 6 to 11 Years | 3,627 (79.2%) | 3,376 (81.5%) |
| 12 to 14 Years | 2,115 (82.2%) | 1,808 (86.9%) |
| 15 Years | 488 (94.2%) | 795 (88.4%) |
| 16 and 17 Years | 1,586 (95.4%) | 1,672 (89.0%) |
| 18 to 24 Years | 5,049 (91.8%) | 4,882 (89.6%) |
| 25 to 34 Years | 8,912 (94.0%) | 8,408 (86.6%) |
| 35 to 44 Years | 6,800 (91.1%) | 6,942 (91.3%) |
| 45 to 54 Years | 8,455 (92.1%) | 8,266 (89.3%) |
| 55 to 64 Years | 8,907 (93.0%) | 8,565 (91.2%) |
| 65 to 74 Years | 6,070 (93.0%) | 6,239 (89.1%) |
| 75 Years and over | 3,656 (94.0%) | 5,285 (86.8%) |
| Total | 59,008 (91.0%) | 60,156 (88.4%) |
Income Below Poverty Among Married-Couple Families in Sterling Heights
The poverty statistics for married-couple families in Sterling Heights show that 5.6% or 1,513 of the total 27,080 families live below the poverty line. Families with 3 or 4 children have the highest poverty rate of 27.1%, comprising of 522 families. On the other hand, families with no children have the lowest poverty rate of 3.6%, which includes 591 families.
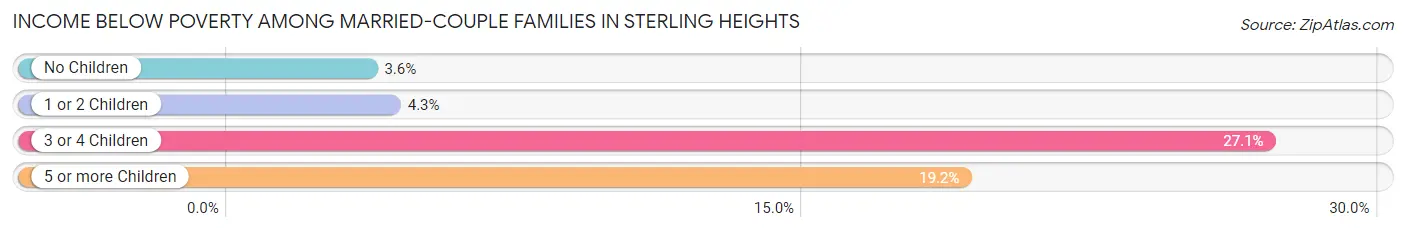
| Children | Above Poverty | Below Poverty |
| No Children | 15,639 (96.4%) | 591 (3.6%) |
| 1 or 2 Children | 8,409 (95.8%) | 373 (4.3%) |
| 3 or 4 Children | 1,405 (72.9%) | 522 (27.1%) |
| 5 or more Children | 114 (80.8%) | 27 (19.2%) |
| Total | 25,567 (94.4%) | 1,513 (5.6%) |
Income Below Poverty Among Single-Parent Households in Sterling Heights
According to the poverty data in Sterling Heights, 8.6% or 255 single-father households and 19.6% or 992 single-mother households are living below the poverty line. Among single-father households, those with 3 or 4 children have the highest poverty rate, with 24 households (75.0%) experiencing poverty. Likewise, among single-mother households, those with 5 or more children have the highest poverty rate, with 28 households (100.0%) falling below the poverty line.
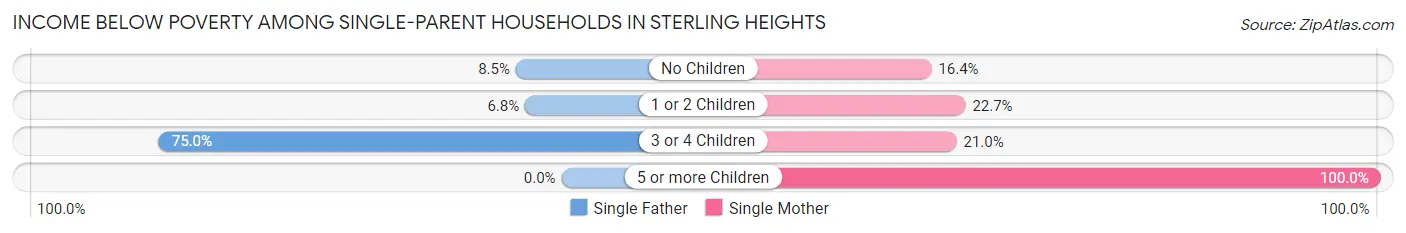
| Children | Single Father | Single Mother |
| No Children | 164 (8.5%) | 445 (16.4%) |
| 1 or 2 Children | 67 (6.8%) | 474 (22.7%) |
| 3 or 4 Children | 24 (75.0%) | 45 (21.0%) |
| 5 or more Children | 0 (0.0%) | 28 (100.0%) |
| Total | 255 (8.6%) | 992 (19.6%) |
Income Below Poverty Among Married-Couple vs Single-Parent Households in Sterling Heights
The poverty data for Sterling Heights shows that 1,513 of the married-couple family households (5.6%) and 1,247 of the single-parent households (15.6%) are living below the poverty level. Within the married-couple family households, those with 3 or 4 children have the highest poverty rate, with 522 households (27.1%) falling below the poverty line. Among the single-parent households, those with 5 or more children have the highest poverty rate, with 28 household (100.0%) living below poverty.
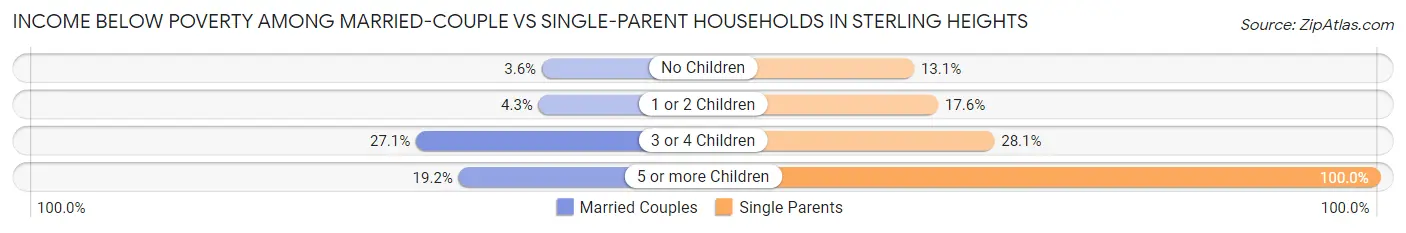
| Children | Married-Couple Families | Single-Parent Households |
| No Children | 591 (3.6%) | 609 (13.1%) |
| 1 or 2 Children | 373 (4.3%) | 541 (17.6%) |
| 3 or 4 Children | 522 (27.1%) | 69 (28.1%) |
| 5 or more Children | 27 (19.2%) | 28 (100.0%) |
| Total | 1,513 (5.6%) | 1,247 (15.6%) |
Race in Sterling Heights
The most populous races in Sterling Heights are White / Caucasian (108,005 | 80.8%), Asian (11,850 | 8.9%), and Black / African American (7,873 | 5.9%).
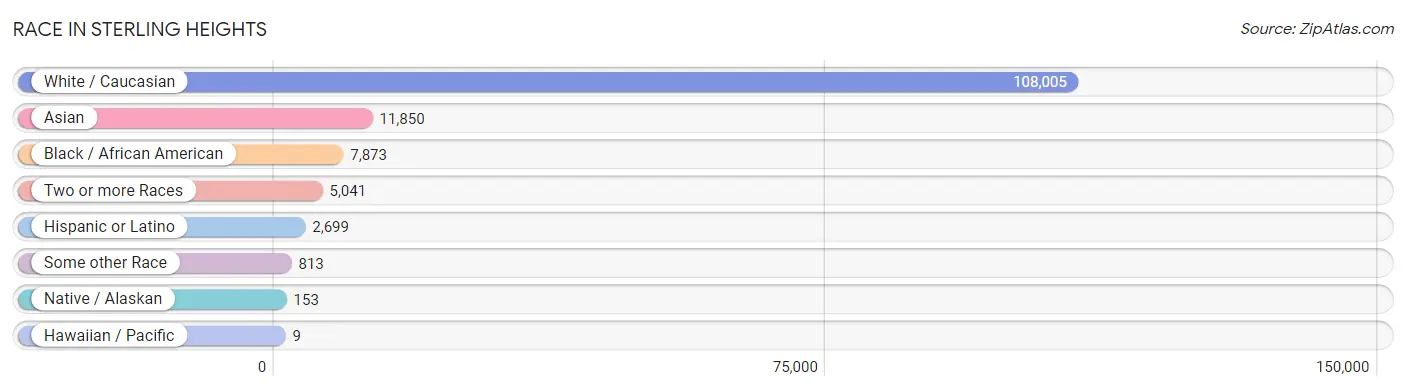
| Race | # Population | % Population |
| Asian | 11,850 | 8.9% |
| Black / African American | 7,873 | 5.9% |
| Hawaiian / Pacific | 9 | 0.0% |
| Hispanic or Latino | 2,699 | 2.0% |
| Native / Alaskan | 153 | 0.1% |
| White / Caucasian | 108,005 | 80.8% |
| Two or more Races | 5,041 | 3.8% |
| Some other Race | 813 | 0.6% |
| Total | 133,744 | 100.0% |
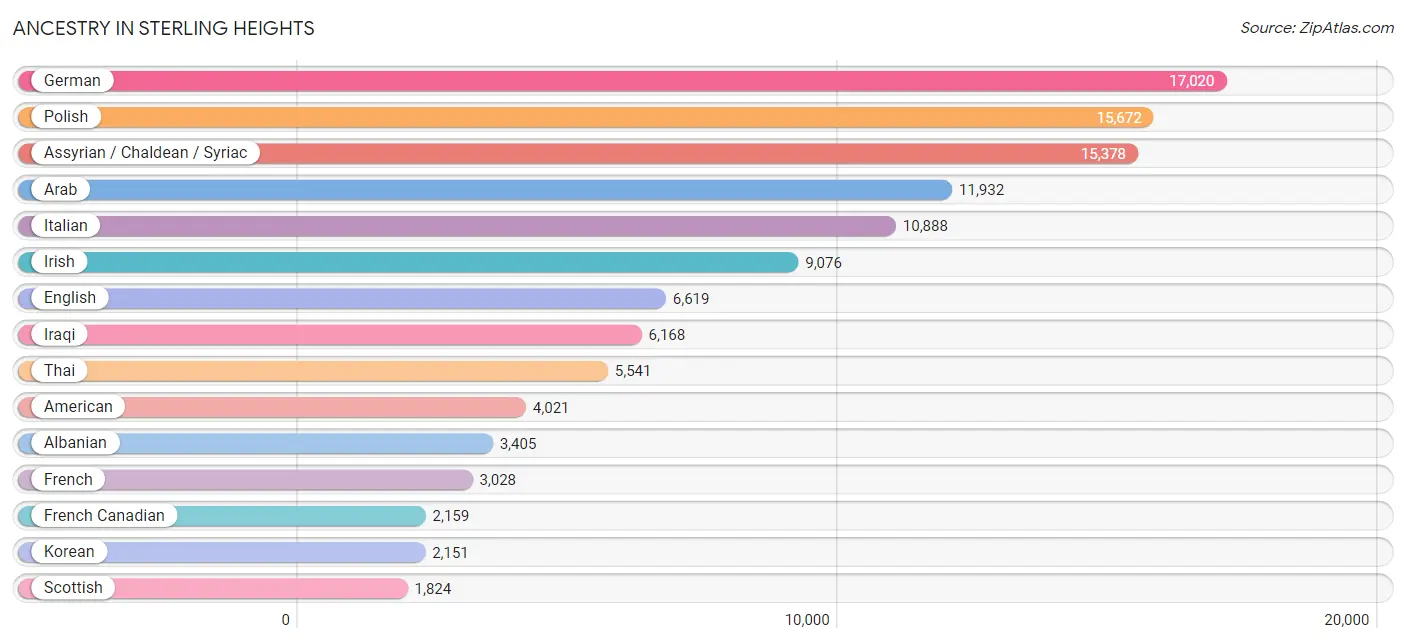
Ancestry in Sterling Heights
The most populous ancestries reported in Sterling Heights are German (17,020 | 12.7%), Polish (15,672 | 11.7%), Assyrian / Chaldean / Syriac (15,378 | 11.5%), Arab (11,932 | 8.9%), and Italian (10,888 | 8.1%), together accounting for 53.0% of all Sterling Heights residents.
| Ancestry | # Population | % Population |
| African | 434 | 0.3% |
| Albanian | 3,405 | 2.5% |
| Alsatian | 53 | 0.0% |
| American | 4,021 | 3.0% |
| Arab | 11,932 | 8.9% |
| Argentinean | 13 | 0.0% |
| Armenian | 398 | 0.3% |
| Assyrian / Chaldean / Syriac | 15,378 | 11.5% |
| Austrian | 271 | 0.2% |
| Bangladeshi | 309 | 0.2% |
| Belgian | 905 | 0.7% |
| Bhutanese | 165 | 0.1% |
| Blackfeet | 18 | 0.0% |
| Brazilian | 84 | 0.1% |
| British | 579 | 0.4% |
| Bulgarian | 24 | 0.0% |
| Burmese | 579 | 0.4% |
| Canadian | 954 | 0.7% |
| Central American | 32 | 0.0% |
| Cherokee | 136 | 0.1% |
| Chippewa | 82 | 0.1% |
| Choctaw | 8 | 0.0% |
| Colombian | 30 | 0.0% |
| Comanche | 35 | 0.0% |
| Cree | 16 | 0.0% |
| Croatian | 167 | 0.1% |
| Cuban | 122 | 0.1% |
| Czech | 409 | 0.3% |
| Czechoslovakian | 213 | 0.2% |
| Danish | 218 | 0.2% |
| Delaware | 7 | 0.0% |
| Dominican | 137 | 0.1% |
| Dutch | 1,062 | 0.8% |
| Eastern European | 100 | 0.1% |
| Egyptian | 323 | 0.2% |
| English | 6,619 | 5.0% |
| European | 744 | 0.6% |
| Filipino | 135 | 0.1% |
| Finnish | 557 | 0.4% |
| French | 3,028 | 2.3% |
| French American Indian | 53 | 0.0% |
| French Canadian | 2,159 | 1.6% |
| German | 17,020 | 12.7% |
| Ghanaian | 224 | 0.2% |
| Greek | 1,165 | 0.9% |
| Guatemalan | 32 | 0.0% |
| Haitian | 30 | 0.0% |
| Hungarian | 598 | 0.4% |
| Indian (Asian) | 1,506 | 1.1% |
| Iranian | 70 | 0.1% |
| Iraqi | 6,168 | 4.6% |
| Irish | 9,076 | 6.8% |
| Iroquois | 21 | 0.0% |
| Israeli | 112 | 0.1% |
| Italian | 10,888 | 8.1% |
| Jamaican | 134 | 0.1% |
| Japanese | 16 | 0.0% |
| Jordanian | 295 | 0.2% |
| Kenyan | 73 | 0.1% |
| Korean | 2,151 | 1.6% |
| Latvian | 8 | 0.0% |
| Lebanese | 1,588 | 1.2% |
| Lithuanian | 253 | 0.2% |
| Macedonian | 1,119 | 0.8% |
| Malaysian | 110 | 0.1% |
| Maltese | 164 | 0.1% |
| Mexican | 1,740 | 1.3% |
| Native Hawaiian | 2 | 0.0% |
| Nigerian | 27 | 0.0% |
| Northern European | 21 | 0.0% |
| Norwegian | 696 | 0.5% |
| Ottawa | 4 | 0.0% |
| Pakistani | 62 | 0.1% |
| Palestinian | 26 | 0.0% |
| Pennsylvania German | 45 | 0.0% |
| Peruvian | 19 | 0.0% |
| Polish | 15,672 | 11.7% |
| Portuguese | 106 | 0.1% |
| Potawatomi | 11 | 0.0% |
| Puerto Rican | 371 | 0.3% |
| Romanian | 1,332 | 1.0% |
| Russian | 842 | 0.6% |
| Samoan | 7 | 0.0% |
| Scandinavian | 43 | 0.0% |
| Scotch-Irish | 674 | 0.5% |
| Scottish | 1,824 | 1.4% |
| Seminole | 51 | 0.0% |
| Serbian | 459 | 0.3% |
| Sioux | 81 | 0.1% |
| Slavic | 141 | 0.1% |
| Slovak | 652 | 0.5% |
| Slovene | 241 | 0.2% |
| South American | 76 | 0.1% |
| Soviet Union | 16 | 0.0% |
| Spaniard | 46 | 0.0% |
| Spanish | 44 | 0.0% |
| Sri Lankan | 869 | 0.6% |
| Subsaharan African | 883 | 0.7% |
| Swedish | 852 | 0.6% |
| Swiss | 67 | 0.1% |
| Syrian | 483 | 0.4% |
| Thai | 5,541 | 4.1% |
| Turkish | 130 | 0.1% |
| Ukrainian | 940 | 0.7% |
| Venezuelan | 14 | 0.0% |
| Vietnamese | 538 | 0.4% |
| Welsh | 215 | 0.2% |
| Yugoslavian | 872 | 0.6% | View All 108 Rows |
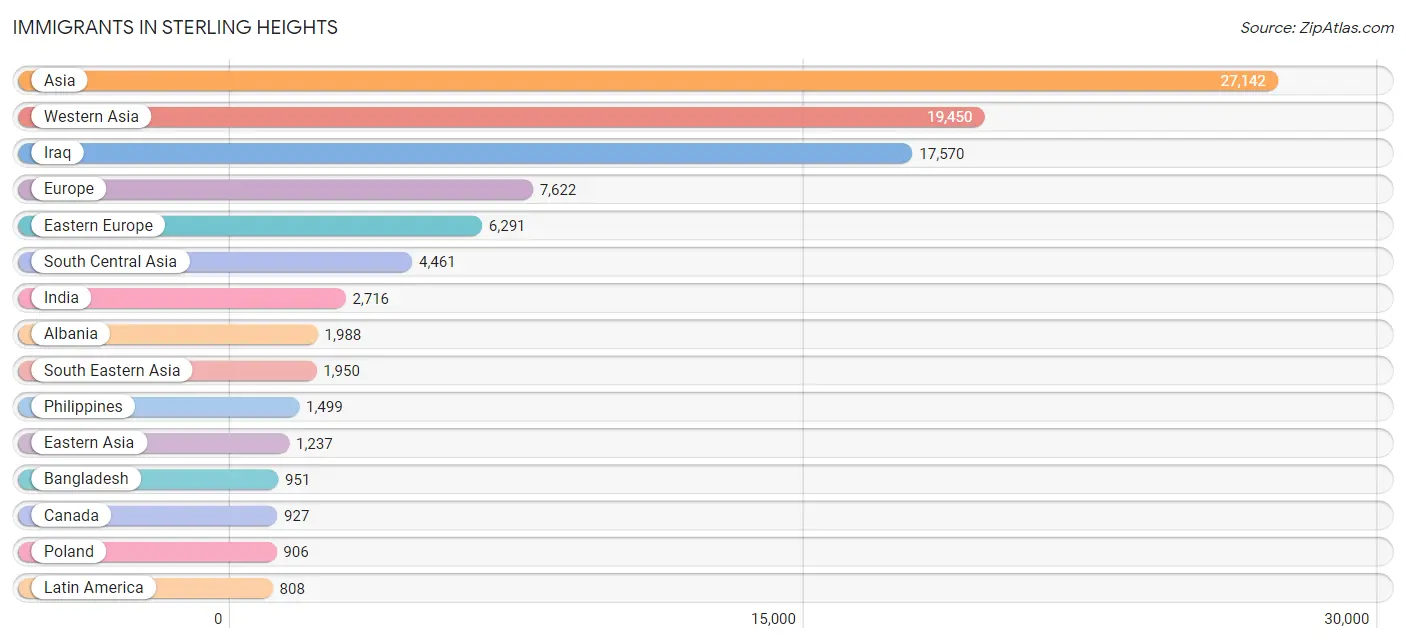
Immigrants in Sterling Heights
The most numerous immigrant groups reported in Sterling Heights came from Asia (27,142 | 20.3%), Western Asia (19,450 | 14.5%), Iraq (17,570 | 13.1%), Europe (7,622 | 5.7%), and Eastern Europe (6,291 | 4.7%), together accounting for 58.4% of all Sterling Heights residents.
| Immigration Origin | # Population | % Population |
| Africa | 666 | 0.5% |
| Albania | 1,988 | 1.5% |
| Argentina | 24 | 0.0% |
| Armenia | 28 | 0.0% |
| Asia | 27,142 | 20.3% |
| Austria | 57 | 0.0% |
| Bangladesh | 951 | 0.7% |
| Belgium | 11 | 0.0% |
| Bosnia and Herzegovina | 585 | 0.4% |
| Brazil | 130 | 0.1% |
| Bulgaria | 14 | 0.0% |
| Cambodia | 1 | 0.0% |
| Cameroon | 23 | 0.0% |
| Canada | 927 | 0.7% |
| Caribbean | 123 | 0.1% |
| Central America | 464 | 0.4% |
| China | 648 | 0.5% |
| Costa Rica | 19 | 0.0% |
| Croatia | 40 | 0.0% |
| Cuba | 65 | 0.1% |
| Czechoslovakia | 65 | 0.1% |
| Dominican Republic | 40 | 0.0% |
| Eastern Africa | 91 | 0.1% |
| Eastern Asia | 1,237 | 0.9% |
| Eastern Europe | 6,291 | 4.7% |
| Egypt | 250 | 0.2% |
| El Salvador | 11 | 0.0% |
| England | 25 | 0.0% |
| Europe | 7,622 | 5.7% |
| France | 20 | 0.0% |
| Germany | 380 | 0.3% |
| Ghana | 5 | 0.0% |
| Greece | 105 | 0.1% |
| Guatemala | 1 | 0.0% |
| Haiti | 10 | 0.0% |
| Hong Kong | 55 | 0.0% |
| Hungary | 73 | 0.1% |
| India | 2,716 | 2.0% |
| Iran | 62 | 0.1% |
| Iraq | 17,570 | 13.1% |
| Ireland | 44 | 0.0% |
| Italy | 473 | 0.4% |
| Jamaica | 8 | 0.0% |
| Japan | 95 | 0.1% |
| Jordan | 408 | 0.3% |
| Kenya | 91 | 0.1% |
| Korea | 494 | 0.4% |
| Kuwait | 17 | 0.0% |
| Laos | 99 | 0.1% |
| Latin America | 808 | 0.6% |
| Latvia | 9 | 0.0% |
| Lebanon | 744 | 0.6% |
| Lithuania | 8 | 0.0% |
| Mexico | 410 | 0.3% |
| Middle Africa | 23 | 0.0% |
| Moldova | 7 | 0.0% |
| Netherlands | 5 | 0.0% |
| Nigeria | 26 | 0.0% |
| North Macedonia | 479 | 0.4% |
| Northern Africa | 293 | 0.2% |
| Northern Europe | 236 | 0.2% |
| Oceania | 7 | 0.0% |
| Pakistan | 698 | 0.5% |
| Panama | 23 | 0.0% |
| Philippines | 1,499 | 1.1% |
| Poland | 906 | 0.7% |
| Romania | 686 | 0.5% |
| Russia | 83 | 0.1% |
| Saudi Arabia | 29 | 0.0% |
| Scotland | 17 | 0.0% |
| Senegal | 62 | 0.1% |
| Serbia | 67 | 0.1% |
| South Africa | 9 | 0.0% |
| South America | 221 | 0.2% |
| South Central Asia | 4,461 | 3.3% |
| South Eastern Asia | 1,950 | 1.5% |
| Southern Europe | 594 | 0.4% |
| Spain | 11 | 0.0% |
| Sri Lanka | 31 | 0.0% |
| Sweden | 7 | 0.0% |
| Syria | 380 | 0.3% |
| Taiwan | 22 | 0.0% |
| Thailand | 34 | 0.0% |
| Turkey | 187 | 0.1% |
| Ukraine | 289 | 0.2% |
| Uzbekistan | 3 | 0.0% |
| Venezuela | 67 | 0.1% |
| Vietnam | 317 | 0.2% |
| Western Africa | 93 | 0.1% |
| Western Asia | 19,450 | 14.5% |
| Western Europe | 473 | 0.4% |
| Yemen | 62 | 0.1% | View All 92 Rows |
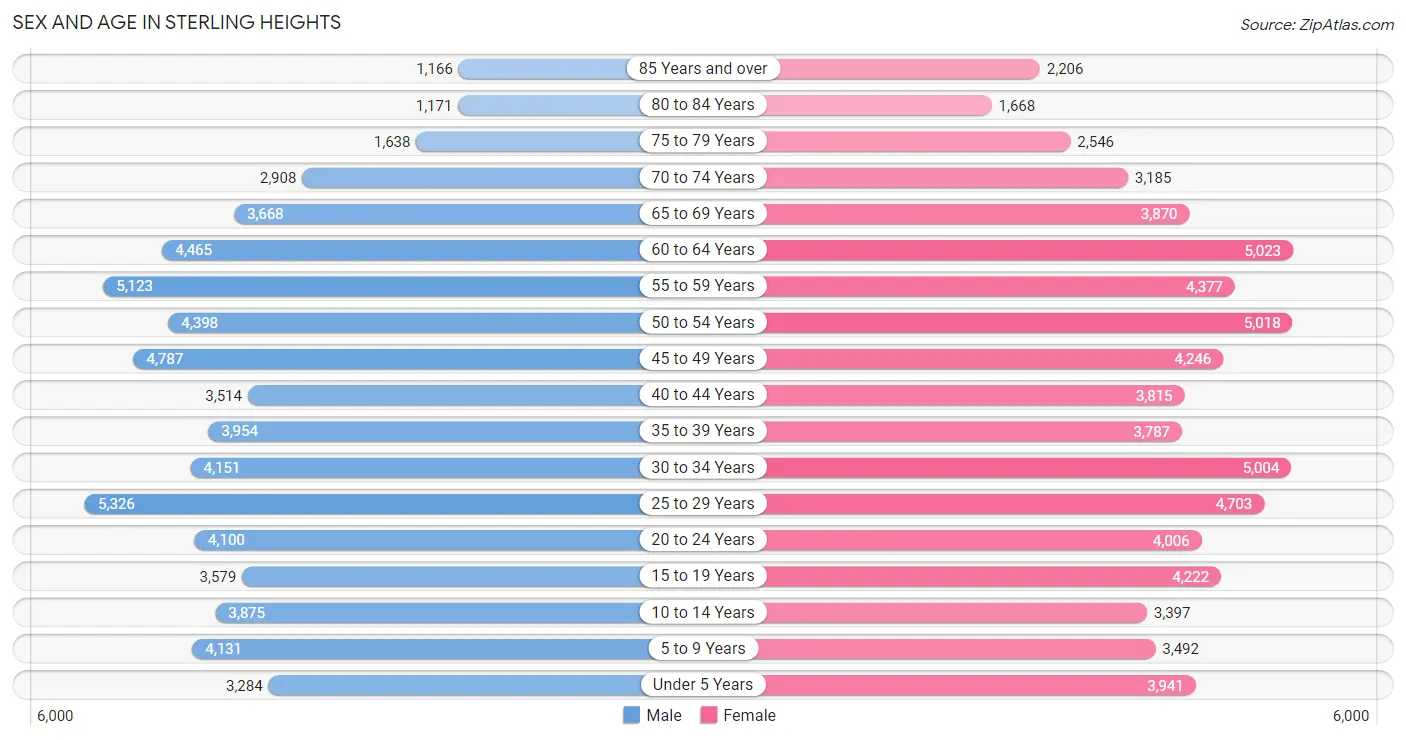
Sex and Age in Sterling Heights
Sex and Age in Sterling Heights
The most populous age groups in Sterling Heights are 25 to 29 Years (5,326 | 8.2%) for men and 60 to 64 Years (5,023 | 7.3%) for women.
| Age Bracket | Male | Female |
| Under 5 Years | 3,284 (5.0%) | 3,941 (5.8%) |
| 5 to 9 Years | 4,131 (6.3%) | 3,492 (5.1%) |
| 10 to 14 Years | 3,875 (5.9%) | 3,397 (5.0%) |
| 15 to 19 Years | 3,579 (5.5%) | 4,222 (6.2%) |
| 20 to 24 Years | 4,100 (6.3%) | 4,006 (5.9%) |
| 25 to 29 Years | 5,326 (8.2%) | 4,703 (6.9%) |
| 30 to 34 Years | 4,151 (6.4%) | 5,004 (7.3%) |
| 35 to 39 Years | 3,954 (6.1%) | 3,787 (5.5%) |
| 40 to 44 Years | 3,514 (5.4%) | 3,815 (5.6%) |
| 45 to 49 Years | 4,787 (7.3%) | 4,246 (6.2%) |
| 50 to 54 Years | 4,398 (6.7%) | 5,018 (7.3%) |
| 55 to 59 Years | 5,123 (7.9%) | 4,377 (6.4%) |
| 60 to 64 Years | 4,465 (6.8%) | 5,023 (7.3%) |
| 65 to 69 Years | 3,668 (5.6%) | 3,870 (5.7%) |
| 70 to 74 Years | 2,908 (4.5%) | 3,185 (4.6%) |
| 75 to 79 Years | 1,638 (2.5%) | 2,546 (3.7%) |
| 80 to 84 Years | 1,171 (1.8%) | 1,668 (2.4%) |
| 85 Years and over | 1,166 (1.8%) | 2,206 (3.2%) |
| Total | 65,238 (100.0%) | 68,506 (100.0%) |
Families and Households in Sterling Heights
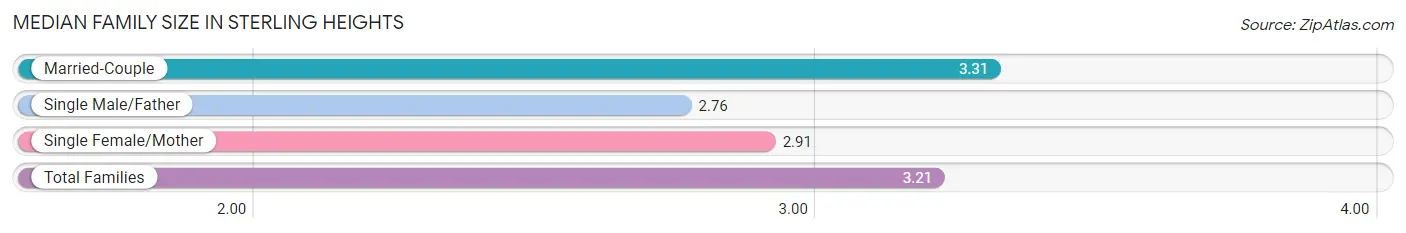
Median Family Size in Sterling Heights
The median family size in Sterling Heights is 3.21 persons per family, with married-couple families (27,080 | 77.2%) accounting for the largest median family size of 3.31 persons per family. On the other hand, single male/father families (2,947 | 8.4%) represent the smallest median family size with 2.76 persons per family.
| Family Type | # Families | Family Size |
| Married-Couple | 27,080 (77.2%) | 3.31 |
| Single Male/Father | 2,947 (8.4%) | 2.76 |
| Single Female/Mother | 5,053 (14.4%) | 2.91 |
| Total Families | 35,080 (100.0%) | 3.21 |
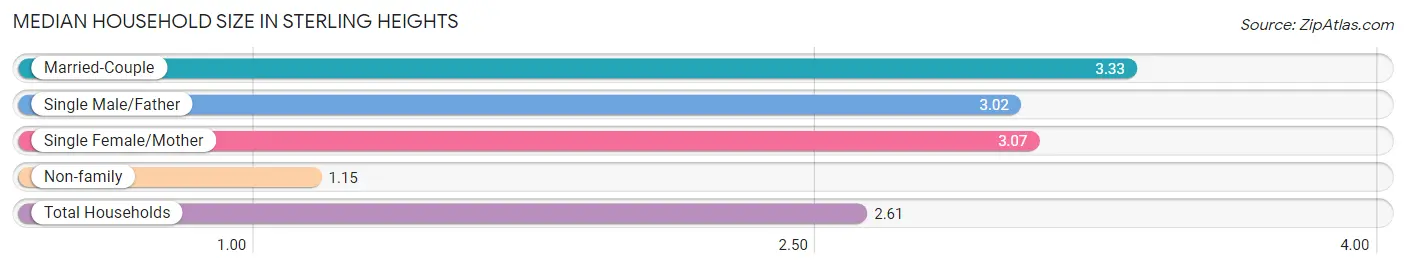
Median Household Size in Sterling Heights
The median household size in Sterling Heights is 2.61 persons per household, with married-couple households (27,080 | 53.1%) accounting for the largest median household size of 3.33 persons per household. non-family households (15,909 | 31.2%) represent the smallest median household size with 1.15 persons per household.
| Household Type | # Households | Household Size |
| Married-Couple | 27,080 (53.1%) | 3.33 |
| Single Male/Father | 2,947 (5.8%) | 3.02 |
| Single Female/Mother | 5,053 (9.9%) | 3.07 |
| Non-family | 15,909 (31.2%) | 1.15 |
| Total Households | 50,989 (100.0%) | 2.61 |
Household Size by Marriage Status in Sterling Heights
Out of a total of 50,989 households in Sterling Heights, 35,080 (68.8%) are family households, while 15,909 (31.2%) are nonfamily households. The most numerous type of family households are 2-person households, comprising 14,556, and the most common type of nonfamily households are 1-person households, comprising 13,974.
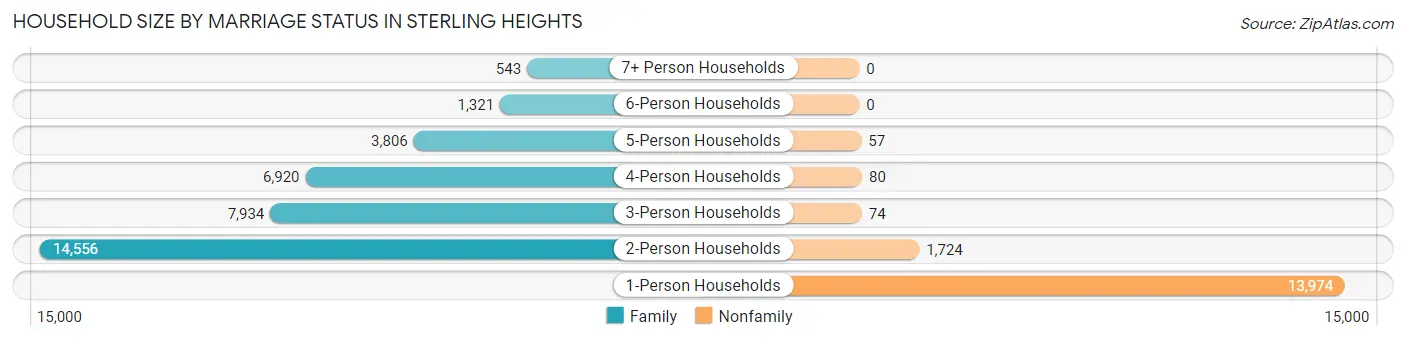
| Household Size | Family Households | Nonfamily Households |
| 1-Person Households | - | 13,974 (27.4%) |
| 2-Person Households | 14,556 (28.5%) | 1,724 (3.4%) |
| 3-Person Households | 7,934 (15.6%) | 74 (0.2%) |
| 4-Person Households | 6,920 (13.6%) | 80 (0.2%) |
| 5-Person Households | 3,806 (7.5%) | 57 (0.1%) |
| 6-Person Households | 1,321 (2.6%) | 0 (0.0%) |
| 7+ Person Households | 543 (1.1%) | 0 (0.0%) |
| Total | 35,080 (68.8%) | 15,909 (31.2%) |
Female Fertility in Sterling Heights
Fertility by Age in Sterling Heights
Average fertility rate in Sterling Heights is 46.0 births per 1,000 women. Women in the age bracket of 20 to 34 years have the highest fertility rate with 72.0 births per 1,000 women. Women in the age bracket of 20 to 34 years acount for 69.3% of all women with births.
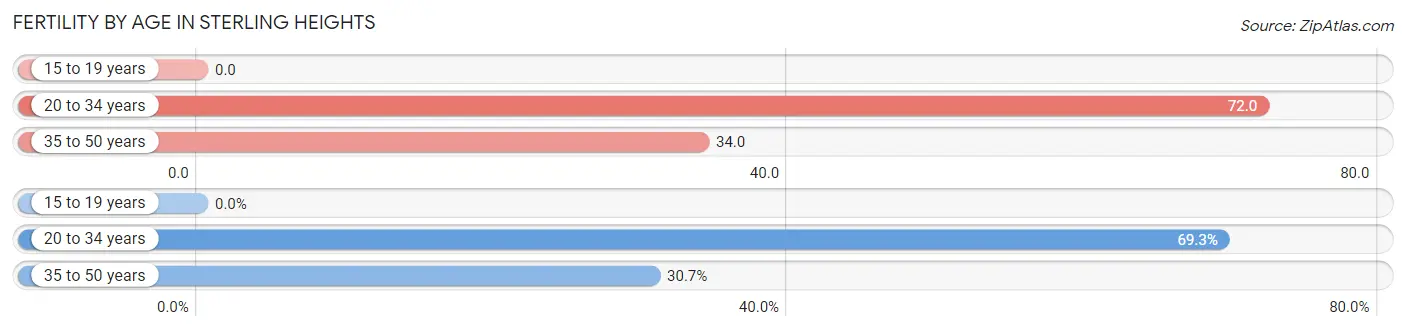
| Age Bracket | Women with Births | Births / 1,000 Women |
| 15 to 19 years | 0 (0.0%) | 0.0 |
| 20 to 34 years | 985 (69.3%) | 72.0 |
| 35 to 50 years | 436 (30.7%) | 34.0 |
| Total | 1,421 (100.0%) | 46.0 |
Fertility by Age by Marriage Status in Sterling Heights
85.7% of women with births (1,421) in Sterling Heights are married. The highest percentage of unmarried women with births falls into 20 to 34 years age bracket with 15.8% of them unmarried at the time of birth, while the lowest percentage of unmarried women with births belong to 35 to 50 years age bracket with 10.8% of them unmarried.
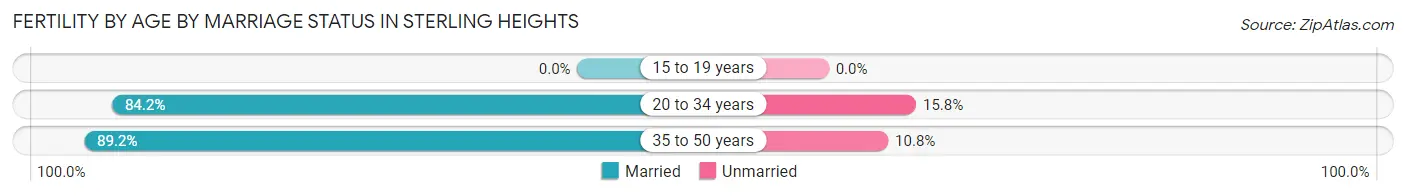
| Age Bracket | Married | Unmarried |
| 15 to 19 years | 0 (0.0%) | 0 (0.0%) |
| 20 to 34 years | 829 (84.2%) | 156 (15.8%) |
| 35 to 50 years | 389 (89.2%) | 47 (10.8%) |
| Total | 1,218 (85.7%) | 203 (14.3%) |
Fertility by Education in Sterling Heights
Average fertility rate in Sterling Heights is 46.0 births per 1,000 women. Women with the education attainment of graduate degree have the highest fertility rate of 90.0 births per 1,000 women, while women with the education attainment of less than high school have the lowest fertility at 21.0 births per 1,000 women. Women with the education attainment of college or associate's degree represent 24.8% of all women with births.
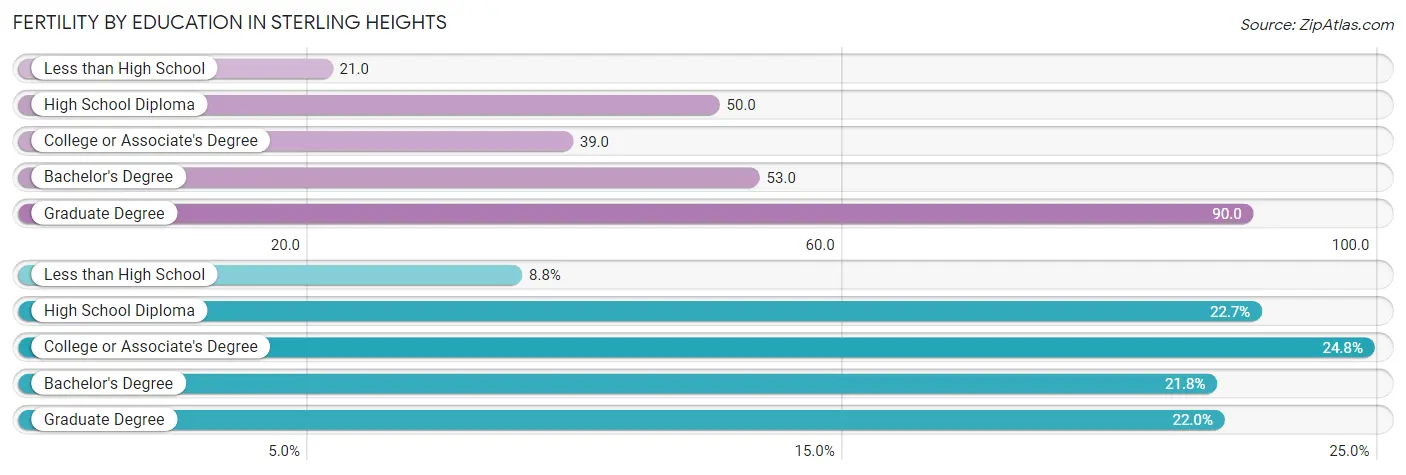
| Educational Attainment | Women with Births | Births / 1,000 Women |
| Less than High School | 125 (8.8%) | 21.0 |
| High School Diploma | 322 (22.7%) | 50.0 |
| College or Associate's Degree | 352 (24.8%) | 39.0 |
| Bachelor's Degree | 310 (21.8%) | 53.0 |
| Graduate Degree | 312 (22.0%) | 90.0 |
| Total | 1,421 (100.0%) | 46.0 |
Fertility by Education by Marriage Status in Sterling Heights
14.3% of women with births in Sterling Heights are unmarried. Women with the educational attainment of graduate degree are most likely to be married with 90.7% of them married at childbirth, while women with the educational attainment of high school diploma are least likely to be married with 18.9% of them unmarried at childbirth.
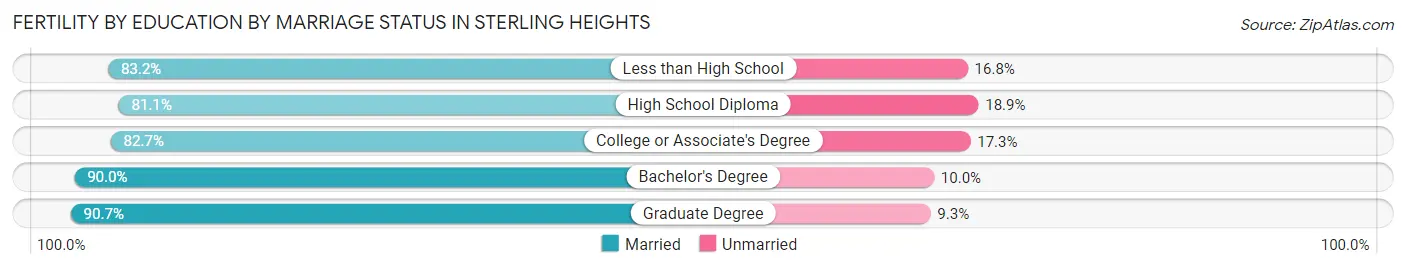
| Educational Attainment | Married | Unmarried |
| Less than High School | 104 (83.2%) | 21 (16.8%) |
| High School Diploma | 261 (81.1%) | 61 (18.9%) |
| College or Associate's Degree | 291 (82.7%) | 61 (17.3%) |
| Bachelor's Degree | 279 (90.0%) | 31 (10.0%) |
| Graduate Degree | 283 (90.7%) | 29 (9.3%) |
| Total | 1,218 (85.7%) | 203 (14.3%) |
Employment Characteristics in Sterling Heights
Employment by Class of Employer in Sterling Heights
Among the 62,470 employed individuals in Sterling Heights, private company employees (46,189 | 73.9%), not-for-profit organizations (6,032 | 9.7%), and self-employed (not incorporated) (2,925 | 4.7%) make up the most common classes of employment.
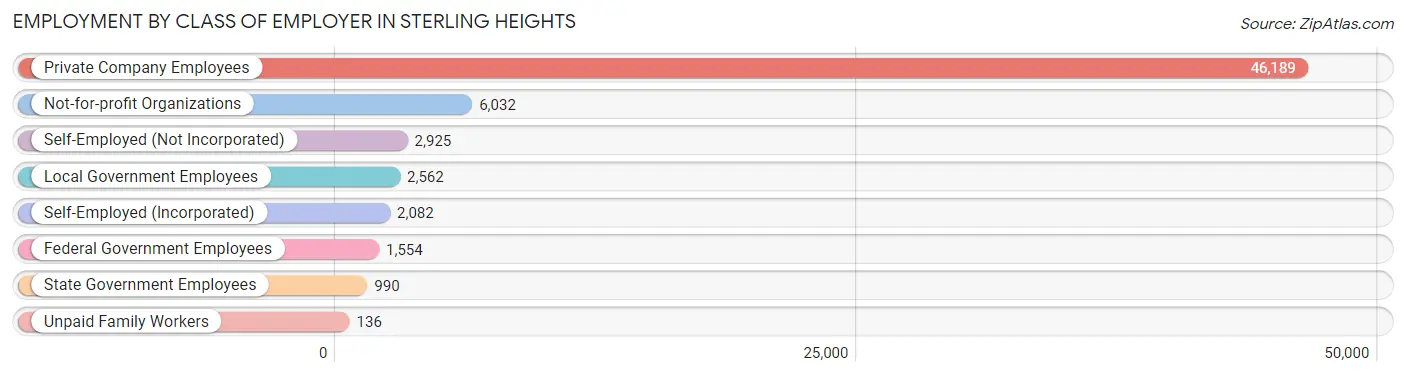
| Employer Class | # Employees | % Employees |
| Private Company Employees | 46,189 | 73.9% |
| Self-Employed (Incorporated) | 2,082 | 3.3% |
| Self-Employed (Not Incorporated) | 2,925 | 4.7% |
| Not-for-profit Organizations | 6,032 | 9.7% |
| Local Government Employees | 2,562 | 4.1% |
| State Government Employees | 990 | 1.6% |
| Federal Government Employees | 1,554 | 2.5% |
| Unpaid Family Workers | 136 | 0.2% |
| Total | 62,470 | 100.0% |
Employment Status by Age in Sterling Heights
According to the labor force statistics for Sterling Heights, out of the total population over 16 years of age (110,207), 62.3% or 68,659 individuals are in the labor force, with 5.9% or 4,051 of them unemployed. The age group with the highest labor force participation rate is 35 to 44 years, with 84.0% or 12,659 individuals in the labor force. Within the labor force, the 16 to 19 years age range has the highest percentage of unemployed individuals, with 15.4% or 455 of them being unemployed.
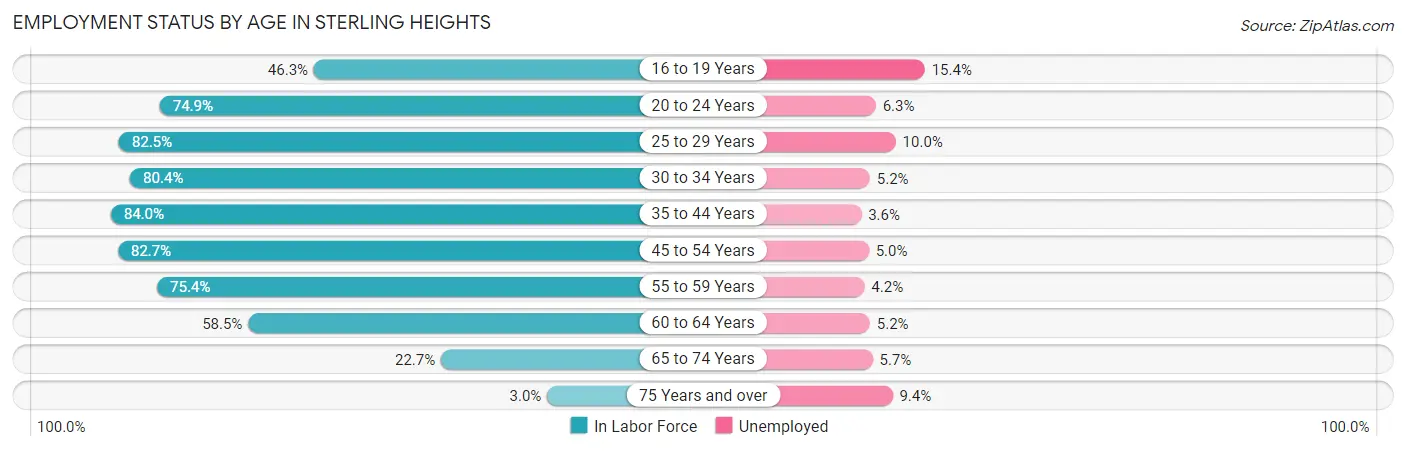
| Age Bracket | In Labor Force | Unemployed |
| 16 to 19 Years | 2,956 (46.3%) | 455 (15.4%) |
| 20 to 24 Years | 6,071 (74.9%) | 382 (6.3%) |
| 25 to 29 Years | 8,274 (82.5%) | 827 (10.0%) |
| 30 to 34 Years | 7,361 (80.4%) | 383 (5.2%) |
| 35 to 44 Years | 12,659 (84.0%) | 456 (3.6%) |
| 45 to 54 Years | 15,257 (82.7%) | 763 (5.0%) |
| 55 to 59 Years | 7,163 (75.4%) | 301 (4.2%) |
| 60 to 64 Years | 5,550 (58.5%) | 289 (5.2%) |
| 65 to 74 Years | 3,094 (22.7%) | 176 (5.7%) |
| 75 Years and over | 312 (3.0%) | 29 (9.4%) |
| Total | 68,659 (62.3%) | 4,051 (5.9%) |
Employment Status by Educational Attainment in Sterling Heights
According to labor force statistics for Sterling Heights, 78.5% of individuals (56,277) out of the total population between 25 and 64 years of age (71,691) are in the labor force, with 5.3% or 2,983 of them being unemployed. The group with the highest labor force participation rate are those with the educational attainment of bachelor's degree or higher, with 86.8% or 20,898 individuals in the labor force. Within the labor force, individuals with high school diploma education have the highest percentage of unemployment, with 6.7% or 930 of them being unemployed.
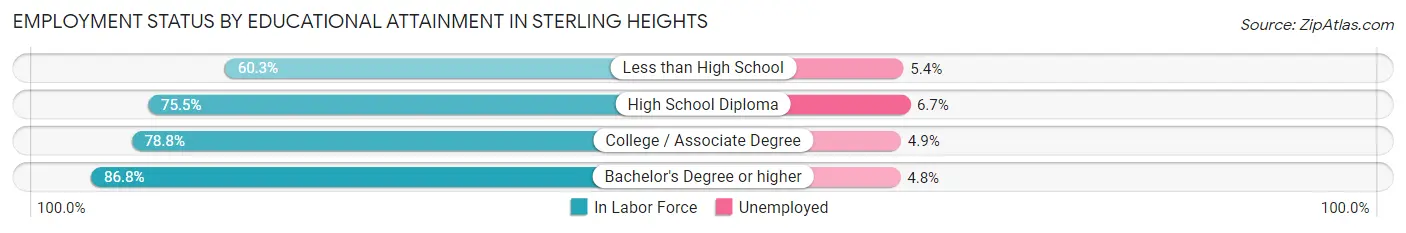
| Educational Attainment | In Labor Force | Unemployed |
| Less than High School | 4,986 (60.3%) | 447 (5.4%) |
| High School Diploma | 13,881 (75.5%) | 1,232 (6.7%) |
| College / Associate Degree | 16,516 (78.8%) | 1,027 (4.9%) |
| Bachelor's Degree or higher | 20,898 (86.8%) | 1,156 (4.8%) |
| Total | 56,277 (78.5%) | 3,800 (5.3%) |
Employment Occupations by Sex in Sterling Heights
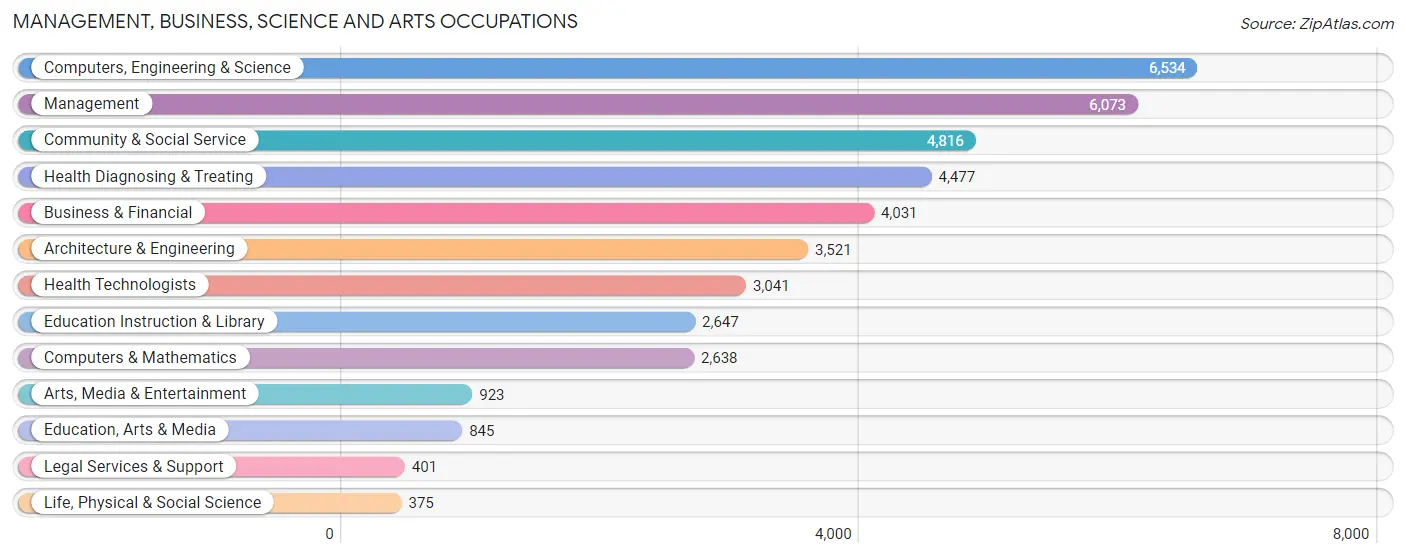
Management, Business, Science and Arts Occupations
The most common Management, Business, Science and Arts occupations in Sterling Heights are Computers, Engineering & Science (6,534 | 10.1%), Management (6,073 | 9.4%), Community & Social Service (4,816 | 7.5%), Health Diagnosing & Treating (4,477 | 6.9%), and Business & Financial (4,031 | 6.2%).
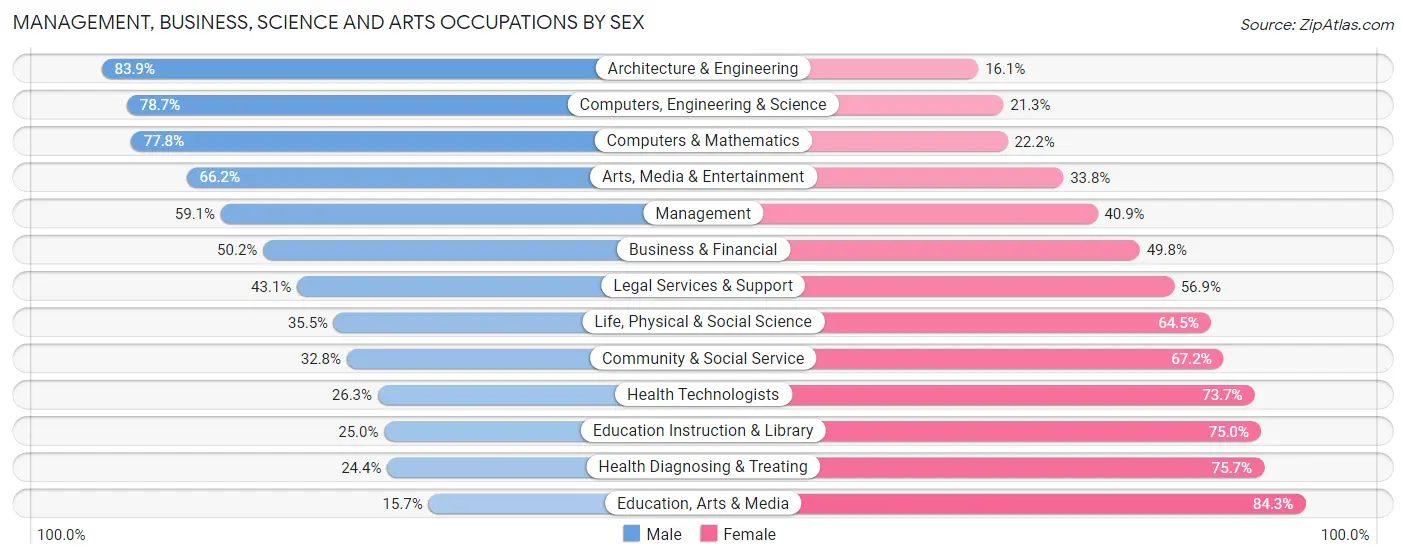
Management, Business, Science and Arts Occupations by Sex
Within the Management, Business, Science and Arts occupations in Sterling Heights, the most male-oriented occupations are Architecture & Engineering (83.9%), Computers, Engineering & Science (78.7%), and Computers & Mathematics (77.8%), while the most female-oriented occupations are Education, Arts & Media (84.3%), Health Diagnosing & Treating (75.6%), and Education Instruction & Library (75.0%).
| Occupation | Male | Female |
| Management | 3,587 (59.1%) | 2,486 (40.9%) |
| Business & Financial | 2,025 (50.2%) | 2,006 (49.8%) |
| Computers, Engineering & Science | 5,141 (78.7%) | 1,393 (21.3%) |
| Computers & Mathematics | 2,053 (77.8%) | 585 (22.2%) |
| Architecture & Engineering | 2,955 (83.9%) | 566 (16.1%) |
| Life, Physical & Social Science | 133 (35.5%) | 242 (64.5%) |
| Community & Social Service | 1,578 (32.8%) | 3,238 (67.2%) |
| Education, Arts & Media | 133 (15.7%) | 712 (84.3%) |
| Legal Services & Support | 173 (43.1%) | 228 (56.9%) |
| Education Instruction & Library | 661 (25.0%) | 1,986 (75.0%) |
| Arts, Media & Entertainment | 611 (66.2%) | 312 (33.8%) |
| Health Diagnosing & Treating | 1,090 (24.3%) | 3,387 (75.6%) |
| Health Technologists | 800 (26.3%) | 2,241 (73.7%) |
| Total (Category) | 13,421 (51.8%) | 12,510 (48.2%) |
| Total (Overall) | 35,487 (55.0%) | 29,061 (45.0%) |
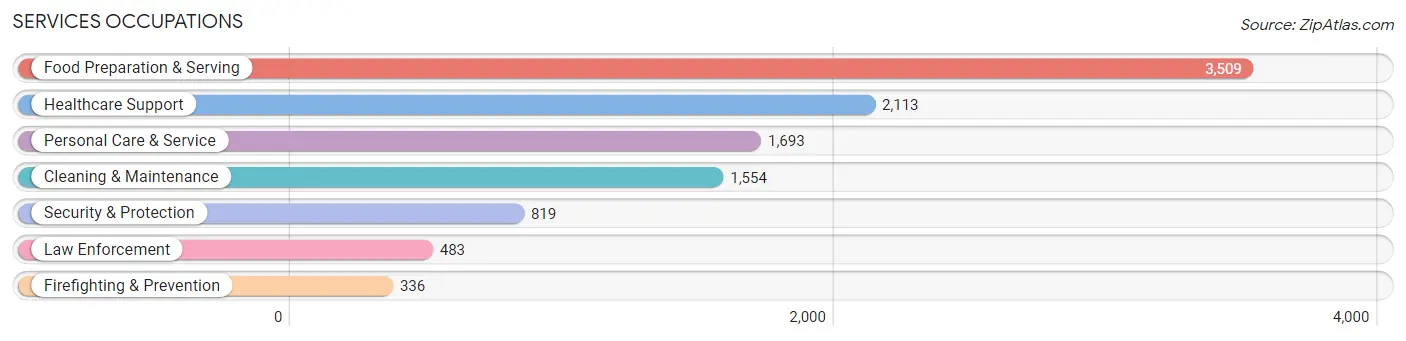
Services Occupations
The most common Services occupations in Sterling Heights are Food Preparation & Serving (3,509 | 5.4%), Healthcare Support (2,113 | 3.3%), Personal Care & Service (1,693 | 2.6%), Cleaning & Maintenance (1,554 | 2.4%), and Security & Protection (819 | 1.3%).
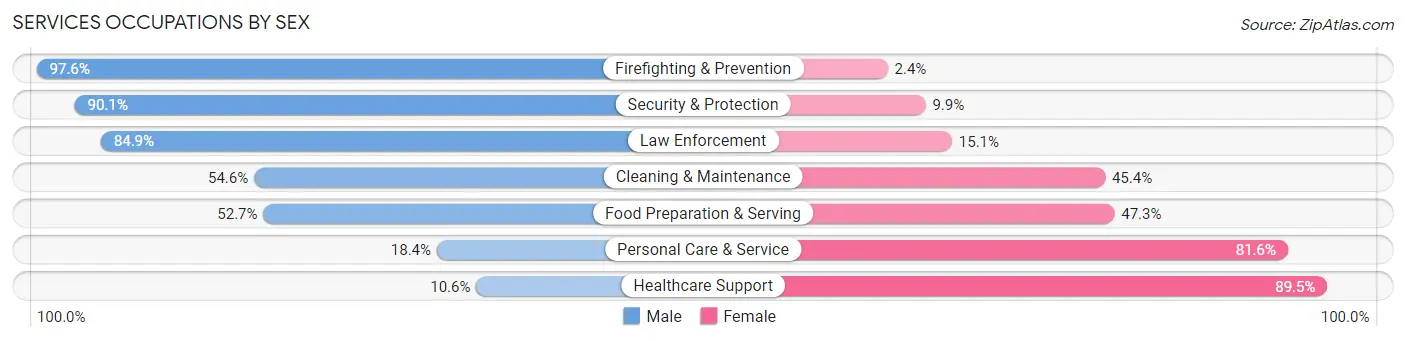
Services Occupations by Sex
Within the Services occupations in Sterling Heights, the most male-oriented occupations are Firefighting & Prevention (97.6%), Security & Protection (90.1%), and Law Enforcement (84.9%), while the most female-oriented occupations are Healthcare Support (89.4%), Personal Care & Service (81.6%), and Food Preparation & Serving (47.3%).
| Occupation | Male | Female |
| Healthcare Support | 223 (10.5%) | 1,890 (89.4%) |
| Security & Protection | 738 (90.1%) | 81 (9.9%) |
| Firefighting & Prevention | 328 (97.6%) | 8 (2.4%) |
| Law Enforcement | 410 (84.9%) | 73 (15.1%) |
| Food Preparation & Serving | 1,850 (52.7%) | 1,659 (47.3%) |
| Cleaning & Maintenance | 848 (54.6%) | 706 (45.4%) |
| Personal Care & Service | 311 (18.4%) | 1,382 (81.6%) |
| Total (Category) | 3,970 (41.0%) | 5,718 (59.0%) |
| Total (Overall) | 35,487 (55.0%) | 29,061 (45.0%) |
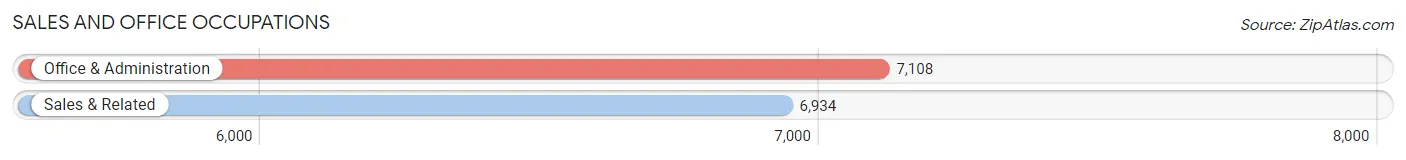
Sales and Office Occupations
The most common Sales and Office occupations in Sterling Heights are Office & Administration (7,108 | 11.0%), and Sales & Related (6,934 | 10.7%).
Sales and Office Occupations by Sex
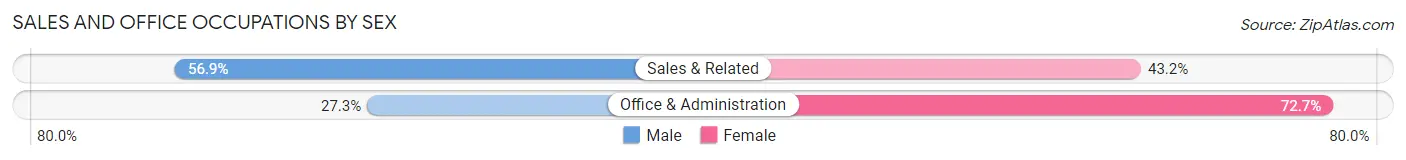
| Occupation | Male | Female |
| Sales & Related | 3,942 (56.9%) | 2,992 (43.1%) |
| Office & Administration | 1,942 (27.3%) | 5,166 (72.7%) |
| Total (Category) | 5,884 (41.9%) | 8,158 (58.1%) |
| Total (Overall) | 35,487 (55.0%) | 29,061 (45.0%) |
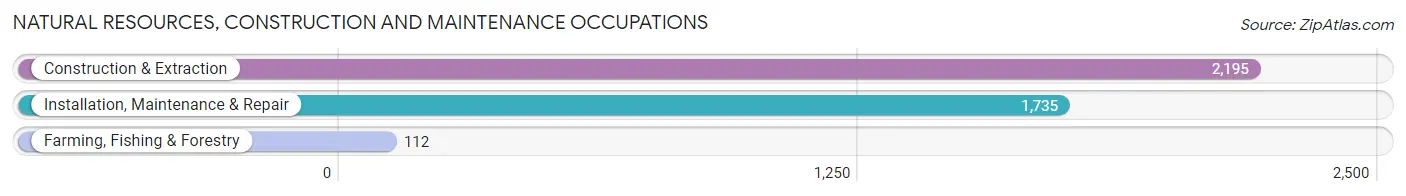
Natural Resources, Construction and Maintenance Occupations
The most common Natural Resources, Construction and Maintenance occupations in Sterling Heights are Construction & Extraction (2,195 | 3.4%), Installation, Maintenance & Repair (1,735 | 2.7%), and Farming, Fishing & Forestry (112 | 0.2%).
Natural Resources, Construction and Maintenance Occupations by Sex
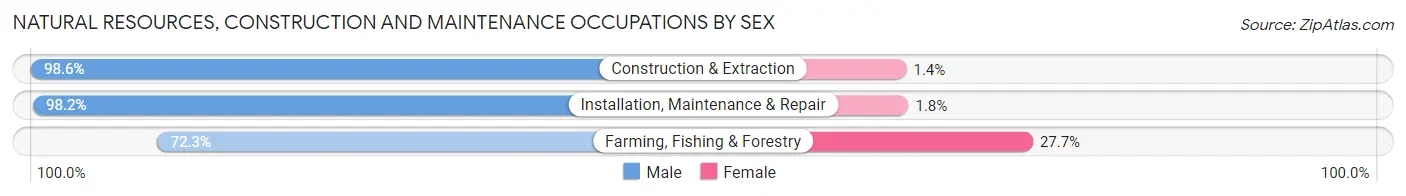
| Occupation | Male | Female |
| Farming, Fishing & Forestry | 81 (72.3%) | 31 (27.7%) |
| Construction & Extraction | 2,165 (98.6%) | 30 (1.4%) |
| Installation, Maintenance & Repair | 1,704 (98.2%) | 31 (1.8%) |
| Total (Category) | 3,950 (97.7%) | 92 (2.3%) |
| Total (Overall) | 35,487 (55.0%) | 29,061 (45.0%) |
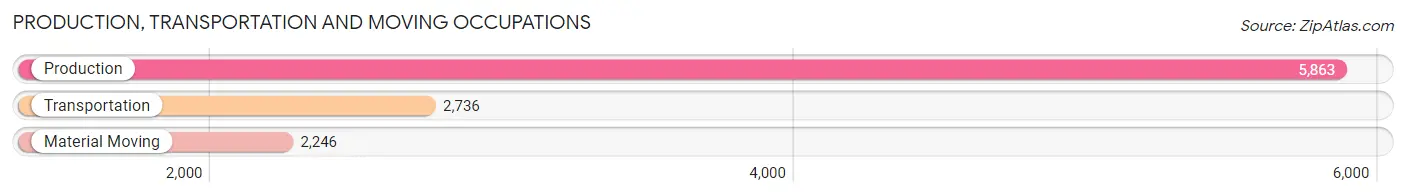
Production, Transportation and Moving Occupations
The most common Production, Transportation and Moving occupations in Sterling Heights are Production (5,863 | 9.1%), Transportation (2,736 | 4.2%), and Material Moving (2,246 | 3.5%).
Production, Transportation and Moving Occupations by Sex
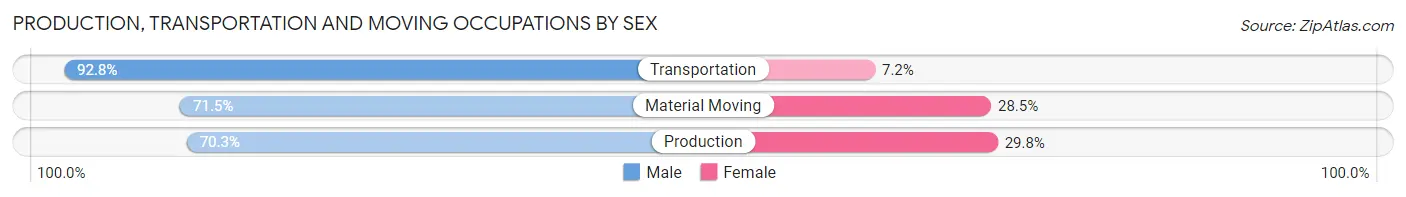
| Occupation | Male | Female |
| Production | 4,119 (70.3%) | 1,744 (29.7%) |
| Transportation | 2,538 (92.8%) | 198 (7.2%) |
| Material Moving | 1,605 (71.5%) | 641 (28.5%) |
| Total (Category) | 8,262 (76.2%) | 2,583 (23.8%) |
| Total (Overall) | 35,487 (55.0%) | 29,061 (45.0%) |
Employment Industries by Sex in Sterling Heights
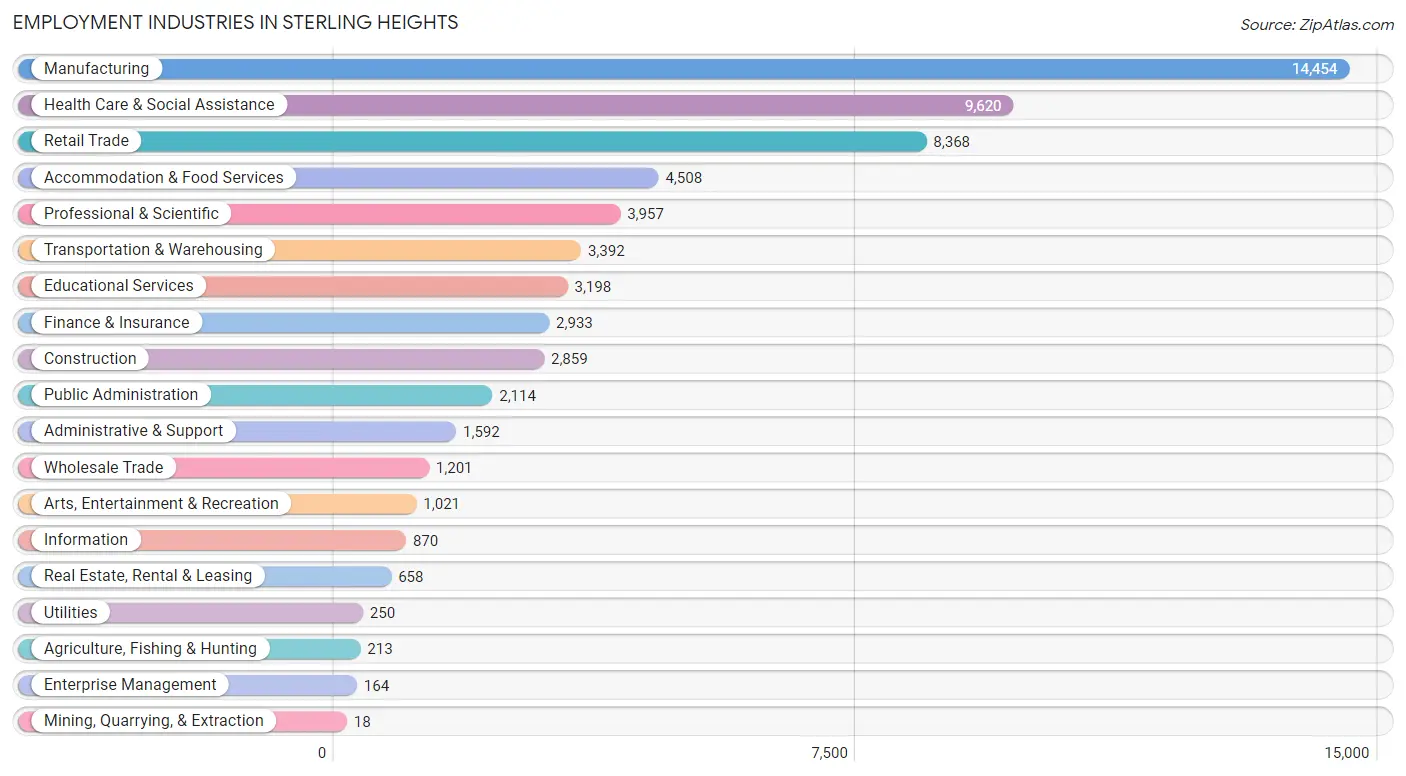
Employment Industries in Sterling Heights
The major employment industries in Sterling Heights include Manufacturing (14,454 | 22.4%), Health Care & Social Assistance (9,620 | 14.9%), Retail Trade (8,368 | 13.0%), Accommodation & Food Services (4,508 | 7.0%), and Professional & Scientific (3,957 | 6.1%).
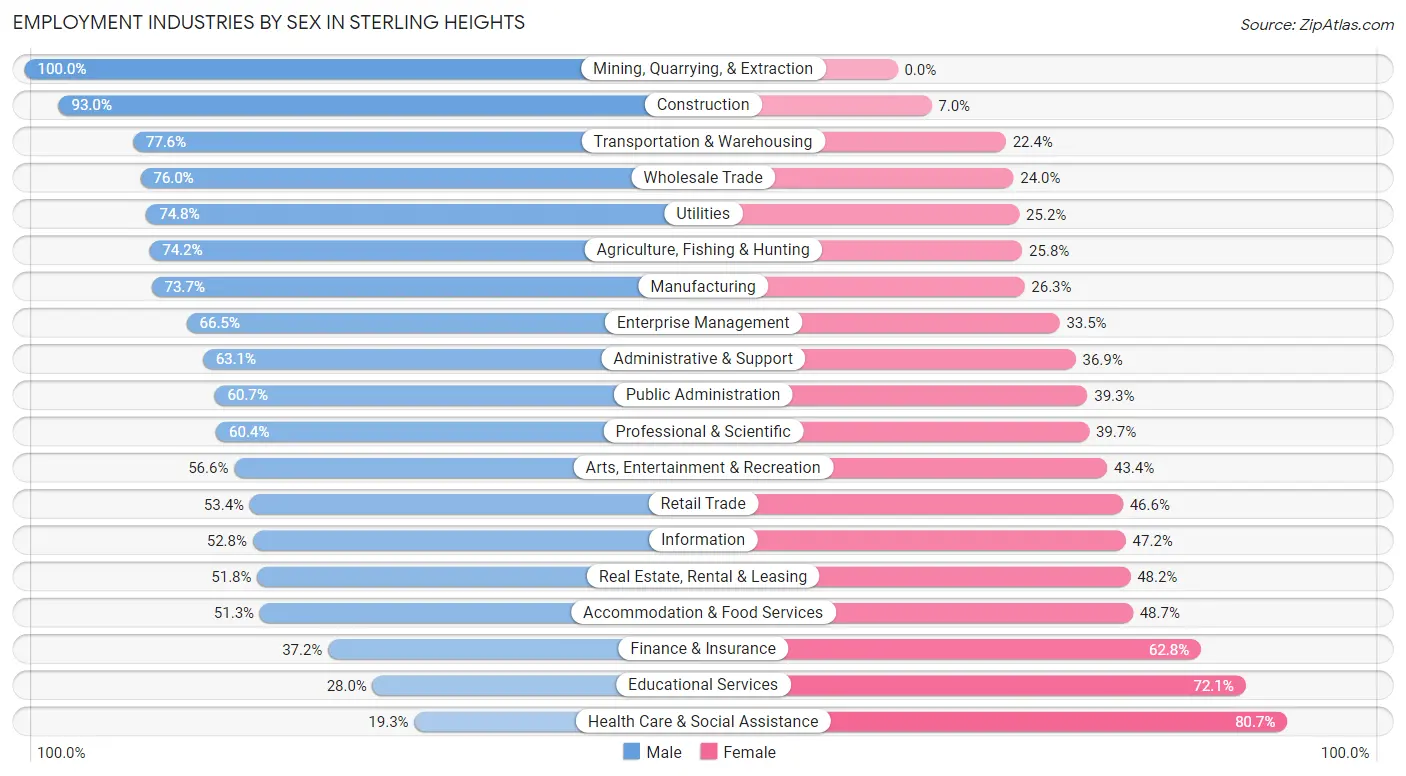
Employment Industries by Sex in Sterling Heights
The Sterling Heights industries that see more men than women are Mining, Quarrying, & Extraction (100.0%), Construction (93.0%), and Transportation & Warehousing (77.6%), whereas the industries that tend to have a higher number of women are Health Care & Social Assistance (80.7%), Educational Services (72.1%), and Finance & Insurance (62.8%).
| Industry | Male | Female |
| Agriculture, Fishing & Hunting | 158 (74.2%) | 55 (25.8%) |
| Mining, Quarrying, & Extraction | 18 (100.0%) | 0 (0.0%) |
| Construction | 2,658 (93.0%) | 201 (7.0%) |
| Manufacturing | 10,656 (73.7%) | 3,798 (26.3%) |
| Wholesale Trade | 913 (76.0%) | 288 (24.0%) |
| Retail Trade | 4,465 (53.4%) | 3,903 (46.6%) |
| Transportation & Warehousing | 2,632 (77.6%) | 760 (22.4%) |
| Utilities | 187 (74.8%) | 63 (25.2%) |
| Information | 459 (52.8%) | 411 (47.2%) |
| Finance & Insurance | 1,090 (37.2%) | 1,843 (62.8%) |
| Real Estate, Rental & Leasing | 341 (51.8%) | 317 (48.2%) |
| Professional & Scientific | 2,388 (60.4%) | 1,569 (39.7%) |
| Enterprise Management | 109 (66.5%) | 55 (33.5%) |
| Administrative & Support | 1,005 (63.1%) | 587 (36.9%) |
| Educational Services | 894 (28.0%) | 2,304 (72.1%) |
| Health Care & Social Assistance | 1,859 (19.3%) | 7,761 (80.7%) |
| Arts, Entertainment & Recreation | 578 (56.6%) | 443 (43.4%) |
| Accommodation & Food Services | 2,312 (51.3%) | 2,196 (48.7%) |
| Public Administration | 1,283 (60.7%) | 831 (39.3%) |
| Total | 35,487 (55.0%) | 29,061 (45.0%) |
Education in Sterling Heights
School Enrollment in Sterling Heights
The most common levels of schooling among the 30,721 students in Sterling Heights are college / undergraduate (7,490 | 24.4%), high school (6,815 | 22.2%), and elementary school (5,667 | 18.4%).
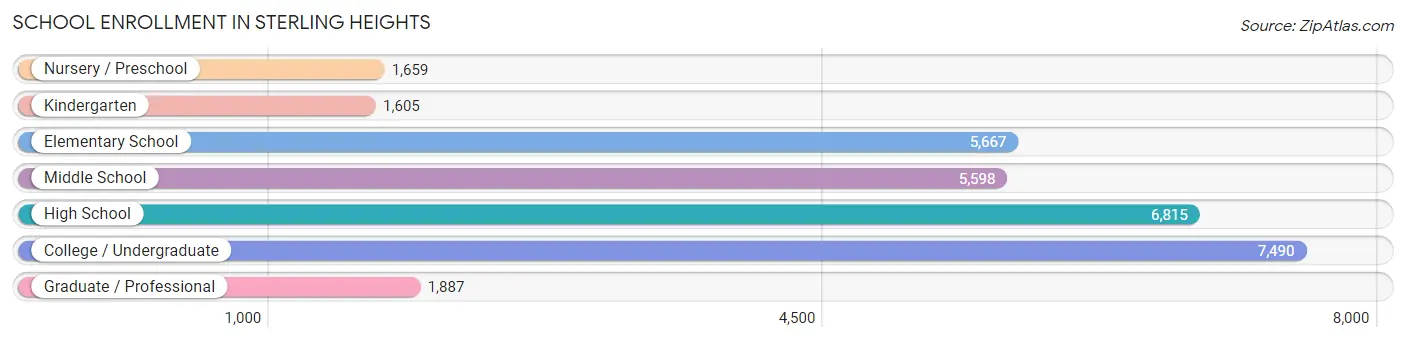
| School Level | # Students | % Students |
| Nursery / Preschool | 1,659 | 5.4% |
| Kindergarten | 1,605 | 5.2% |
| Elementary School | 5,667 | 18.4% |
| Middle School | 5,598 | 18.2% |
| High School | 6,815 | 22.2% |
| College / Undergraduate | 7,490 | 24.4% |
| Graduate / Professional | 1,887 | 6.1% |
| Total | 30,721 | 100.0% |
School Enrollment by Age by Funding Source in Sterling Heights
Out of a total of 30,721 students who are enrolled in schools in Sterling Heights, 4,117 (13.4%) attend a private institution, while the remaining 26,604 (86.6%) are enrolled in public schools. The age group of 35 years and over has the highest likelihood of being enrolled in private schools, with 478 (31.4% in the age bracket) enrolled. Conversely, the age group of 18 to 19 year olds has the lowest likelihood of being enrolled in a private school, with 2,205 (93.4% in the age bracket) attending a public institution.
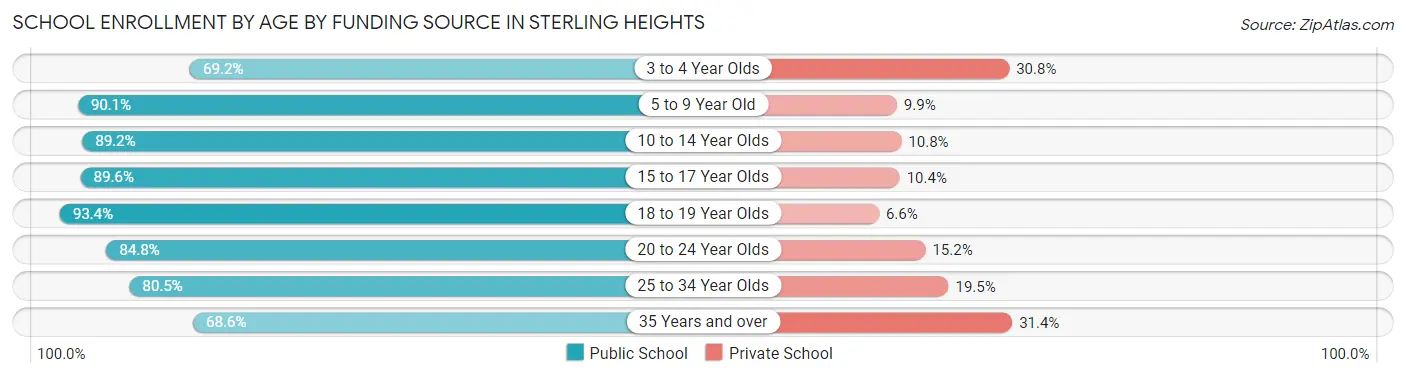
| Age Bracket | Public School | Private School |
| 3 to 4 Year Olds | 859 (69.2%) | 383 (30.8%) |
| 5 to 9 Year Old | 6,518 (90.1%) | 718 (9.9%) |
| 10 to 14 Year Olds | 6,368 (89.2%) | 768 (10.8%) |
| 15 to 17 Year Olds | 4,271 (89.6%) | 498 (10.4%) |
| 18 to 19 Year Olds | 2,205 (93.4%) | 155 (6.6%) |
| 20 to 24 Year Olds | 2,958 (84.8%) | 532 (15.2%) |
| 25 to 34 Year Olds | 2,386 (80.5%) | 579 (19.5%) |
| 35 Years and over | 1,045 (68.6%) | 478 (31.4%) |
| Total | 26,604 (86.6%) | 4,117 (13.4%) |
Educational Attainment by Field of Study in Sterling Heights
Business (7,108 | 22.7%), engineering (4,926 | 15.7%), science & technology (4,329 | 13.8%), education (2,776 | 8.9%), and arts & humanities (1,680 | 5.4%) are the most common fields of study among 31,295 individuals in Sterling Heights who have obtained a bachelor's degree or higher.
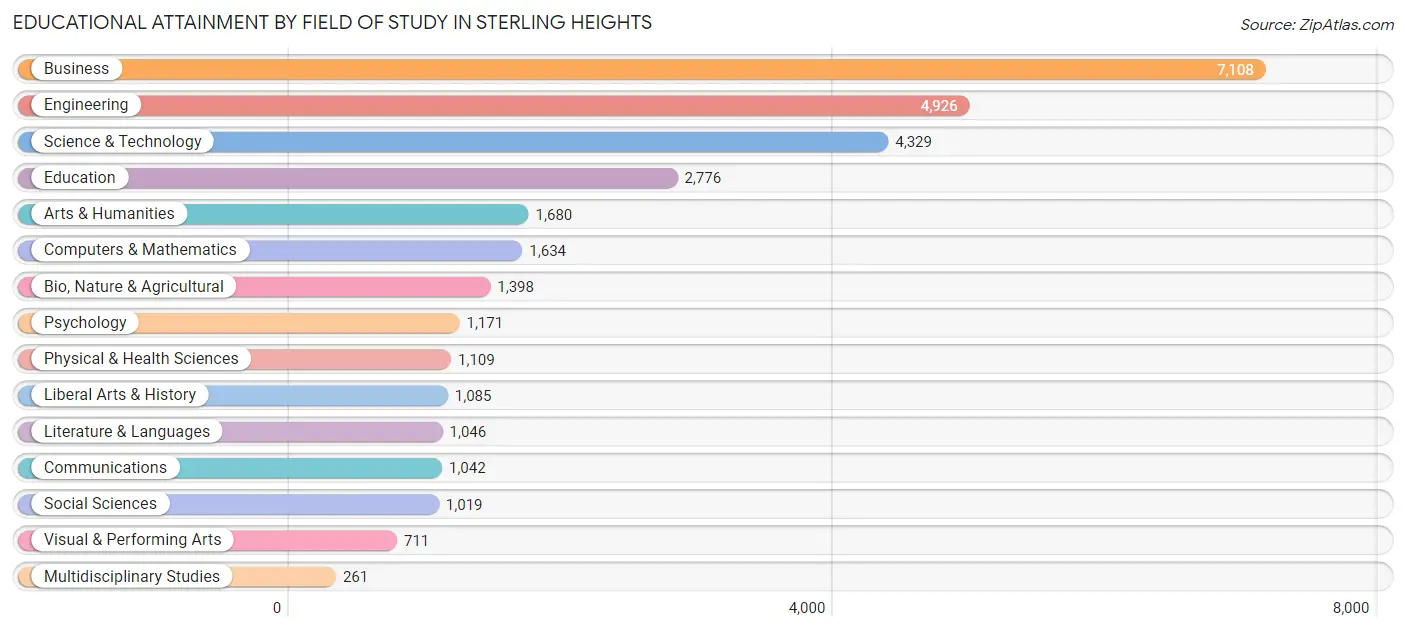
| Field of Study | # Graduates | % Graduates |
| Computers & Mathematics | 1,634 | 5.2% |
| Bio, Nature & Agricultural | 1,398 | 4.5% |
| Physical & Health Sciences | 1,109 | 3.5% |
| Psychology | 1,171 | 3.7% |
| Social Sciences | 1,019 | 3.3% |
| Engineering | 4,926 | 15.7% |
| Multidisciplinary Studies | 261 | 0.8% |
| Science & Technology | 4,329 | 13.8% |
| Business | 7,108 | 22.7% |
| Education | 2,776 | 8.9% |
| Literature & Languages | 1,046 | 3.3% |
| Liberal Arts & History | 1,085 | 3.5% |
| Visual & Performing Arts | 711 | 2.3% |
| Communications | 1,042 | 3.3% |
| Arts & Humanities | 1,680 | 5.4% |
| Total | 31,295 | 100.0% |
Transportation & Commute in Sterling Heights
Vehicle Availability by Sex in Sterling Heights
The most prevalent vehicle ownership categories in Sterling Heights are males with 2 vehicles (14,895, accounting for 43.2%) and females with 2 vehicles (12,004, making up 53.4%).
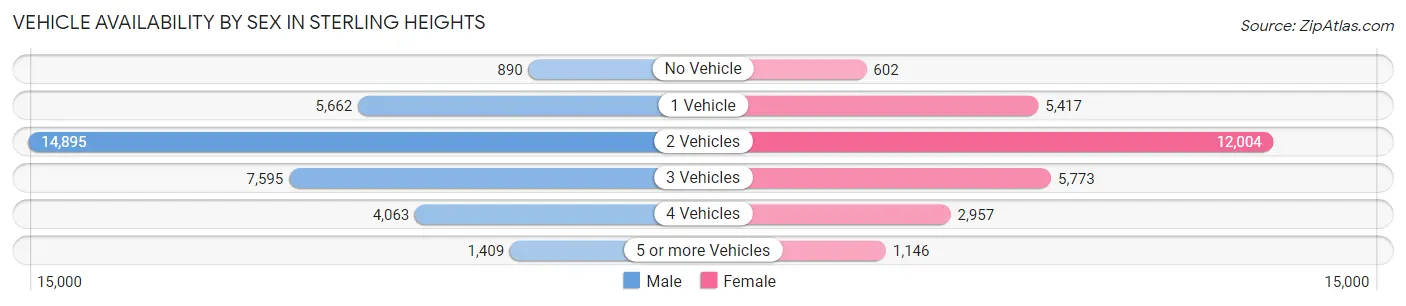
| Vehicles Available | Male | Female |
| No Vehicle | 890 (2.6%) | 602 (2.2%) |
| 1 Vehicle | 5,662 (16.4%) | 5,417 (19.4%) |
| 2 Vehicles | 14,895 (43.2%) | 12,004 (43.0%) |
| 3 Vehicles | 7,595 (22.0%) | 5,773 (20.7%) |
| 4 Vehicles | 4,063 (11.8%) | 2,957 (10.6%) |
| 5 or more Vehicles | 1,409 (4.1%) | 1,146 (4.1%) |
| Total | 34,514 (100.0%) | 27,899 (100.0%) |
Commute Time in Sterling Heights
The most frequently occuring commute durations in Sterling Heights are 15 to 19 minutes (9,699 commuters, 17.5%), 20 to 24 minutes (9,336 commuters, 16.9%), and 30 to 34 minutes (8,055 commuters, 14.6%).
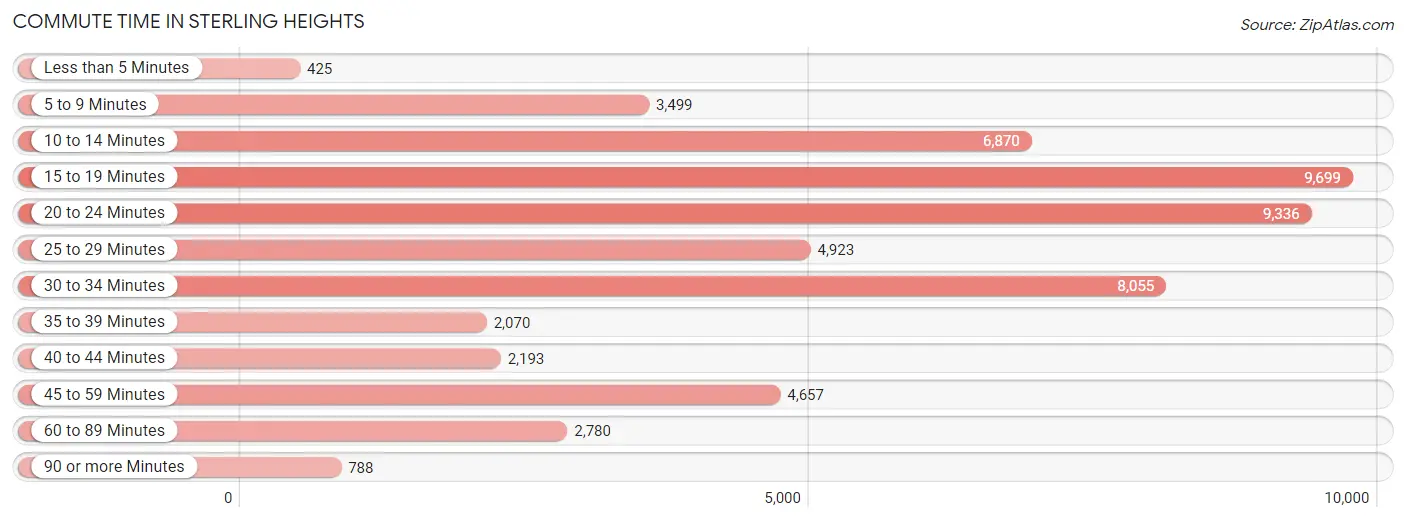
| Commute Time | # Commuters | % Commuters |
| Less than 5 Minutes | 425 | 0.8% |
| 5 to 9 Minutes | 3,499 | 6.3% |
| 10 to 14 Minutes | 6,870 | 12.4% |
| 15 to 19 Minutes | 9,699 | 17.5% |
| 20 to 24 Minutes | 9,336 | 16.9% |
| 25 to 29 Minutes | 4,923 | 8.9% |
| 30 to 34 Minutes | 8,055 | 14.6% |
| 35 to 39 Minutes | 2,070 | 3.7% |
| 40 to 44 Minutes | 2,193 | 4.0% |
| 45 to 59 Minutes | 4,657 | 8.4% |
| 60 to 89 Minutes | 2,780 | 5.0% |
| 90 or more Minutes | 788 | 1.4% |
Commute Time by Sex in Sterling Heights
The most common commute times in Sterling Heights are 20 to 24 minutes (5,342 commuters, 17.3%) for males and 15 to 19 minutes (4,688 commuters, 19.2%) for females.
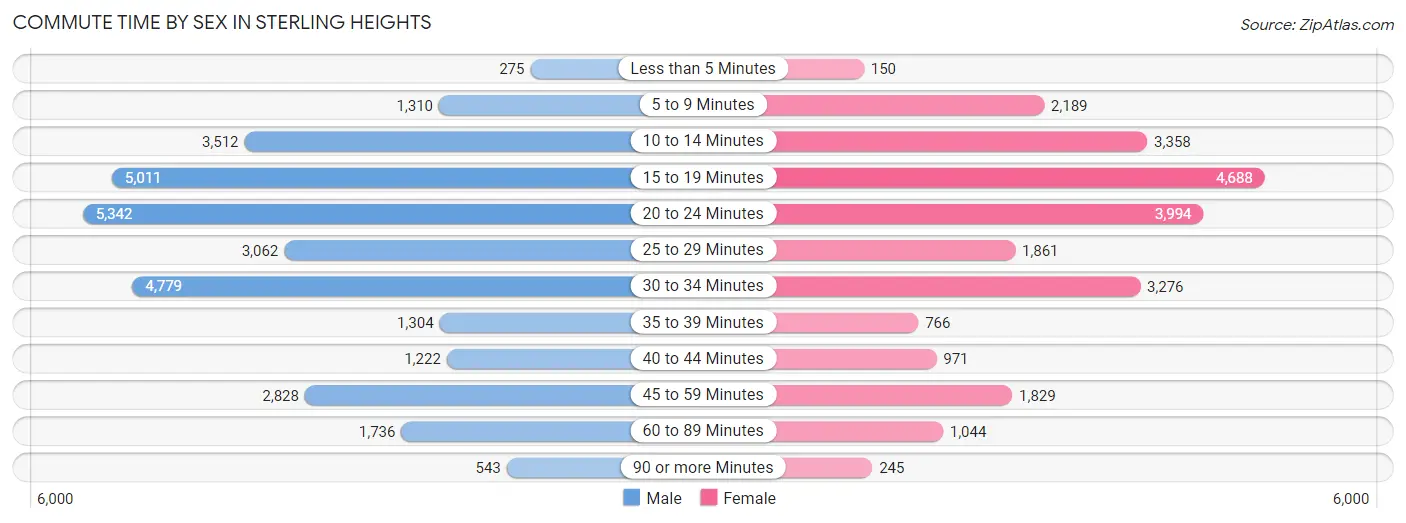
| Commute Time | Male | Female |
| Less than 5 Minutes | 275 (0.9%) | 150 (0.6%) |
| 5 to 9 Minutes | 1,310 (4.2%) | 2,189 (9.0%) |
| 10 to 14 Minutes | 3,512 (11.4%) | 3,358 (13.8%) |
| 15 to 19 Minutes | 5,011 (16.2%) | 4,688 (19.2%) |
| 20 to 24 Minutes | 5,342 (17.3%) | 3,994 (16.4%) |
| 25 to 29 Minutes | 3,062 (9.9%) | 1,861 (7.6%) |
| 30 to 34 Minutes | 4,779 (15.4%) | 3,276 (13.4%) |
| 35 to 39 Minutes | 1,304 (4.2%) | 766 (3.1%) |
| 40 to 44 Minutes | 1,222 (4.0%) | 971 (4.0%) |
| 45 to 59 Minutes | 2,828 (9.1%) | 1,829 (7.5%) |
| 60 to 89 Minutes | 1,736 (5.6%) | 1,044 (4.3%) |
| 90 or more Minutes | 543 (1.8%) | 245 (1.0%) |
Time of Departure to Work by Sex in Sterling Heights
The most frequent times of departure to work in Sterling Heights are 7:00 AM to 7:29 AM (3,946, 12.8%) for males and 7:00 AM to 7:29 AM (3,104, 12.7%) for females.
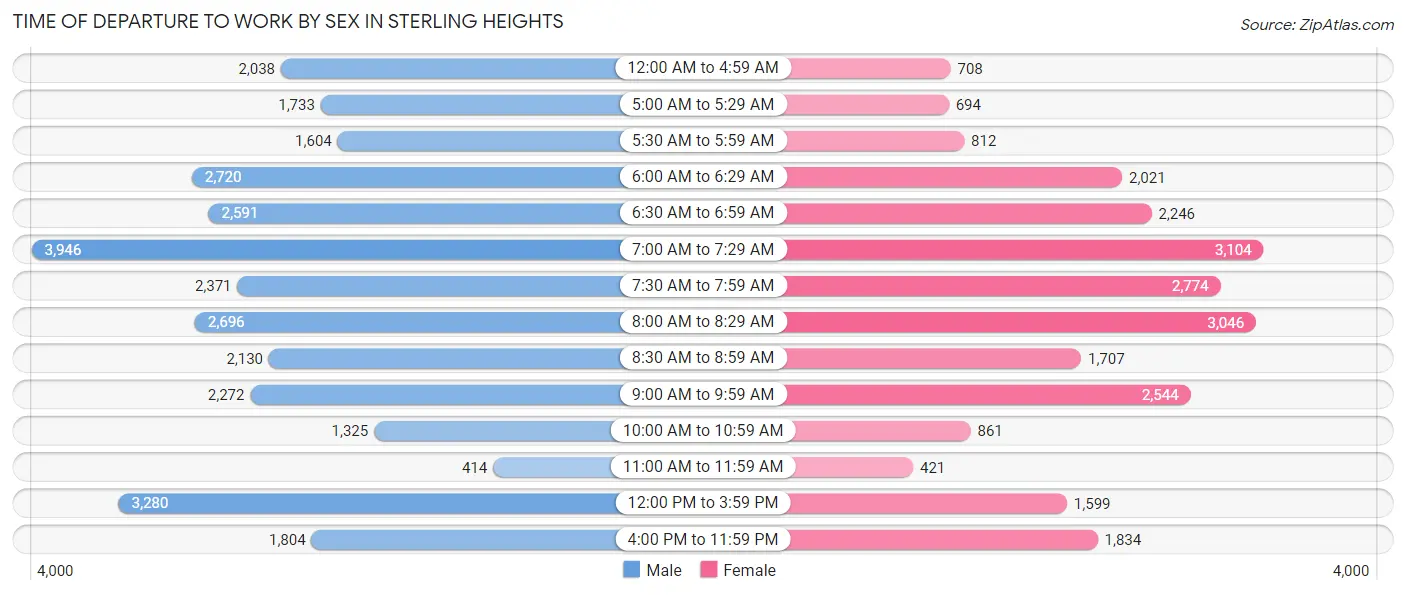
| Time of Departure | Male | Female |
| 12:00 AM to 4:59 AM | 2,038 (6.6%) | 708 (2.9%) |
| 5:00 AM to 5:29 AM | 1,733 (5.6%) | 694 (2.9%) |
| 5:30 AM to 5:59 AM | 1,604 (5.2%) | 812 (3.3%) |
| 6:00 AM to 6:29 AM | 2,720 (8.8%) | 2,021 (8.3%) |
| 6:30 AM to 6:59 AM | 2,591 (8.4%) | 2,246 (9.2%) |
| 7:00 AM to 7:29 AM | 3,946 (12.8%) | 3,104 (12.7%) |
| 7:30 AM to 7:59 AM | 2,371 (7.7%) | 2,774 (11.4%) |
| 8:00 AM to 8:29 AM | 2,696 (8.7%) | 3,046 (12.5%) |
| 8:30 AM to 8:59 AM | 2,130 (6.9%) | 1,707 (7.0%) |
| 9:00 AM to 9:59 AM | 2,272 (7.3%) | 2,544 (10.4%) |
| 10:00 AM to 10:59 AM | 1,325 (4.3%) | 861 (3.5%) |
| 11:00 AM to 11:59 AM | 414 (1.3%) | 421 (1.7%) |
| 12:00 PM to 3:59 PM | 3,280 (10.6%) | 1,599 (6.6%) |
| 4:00 PM to 11:59 PM | 1,804 (5.8%) | 1,834 (7.5%) |
| Total | 30,924 (100.0%) | 24,371 (100.0%) |
Housing Occupancy in Sterling Heights
Occupancy by Ownership in Sterling Heights
Of the total 50,989 dwellings in Sterling Heights, owner-occupied units account for 38,733 (76.0%), while renter-occupied units make up 12,256 (24.0%).
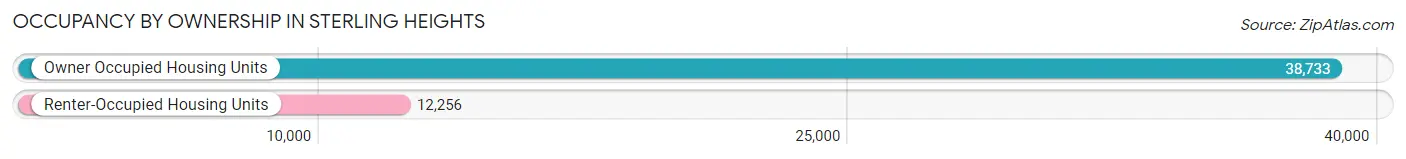
| Occupancy | # Housing Units | % Housing Units |
| Owner Occupied Housing Units | 38,733 | 76.0% |
| Renter-Occupied Housing Units | 12,256 | 24.0% |
| Total Occupied Housing Units | 50,989 | 100.0% |
Occupancy by Household Size in Sterling Heights
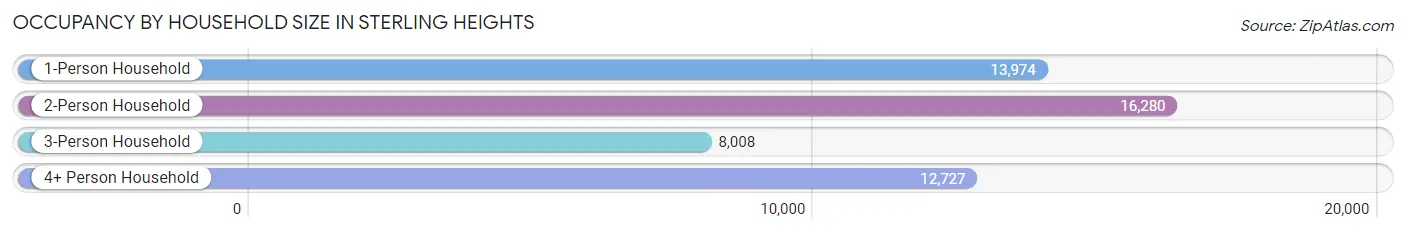
| Household Size | # Housing Units | % Housing Units |
| 1-Person Household | 13,974 | 27.4% |
| 2-Person Household | 16,280 | 31.9% |
| 3-Person Household | 8,008 | 15.7% |
| 4+ Person Household | 12,727 | 25.0% |
| Total Housing Units | 50,989 | 100.0% |
Occupancy by Ownership by Household Size in Sterling Heights
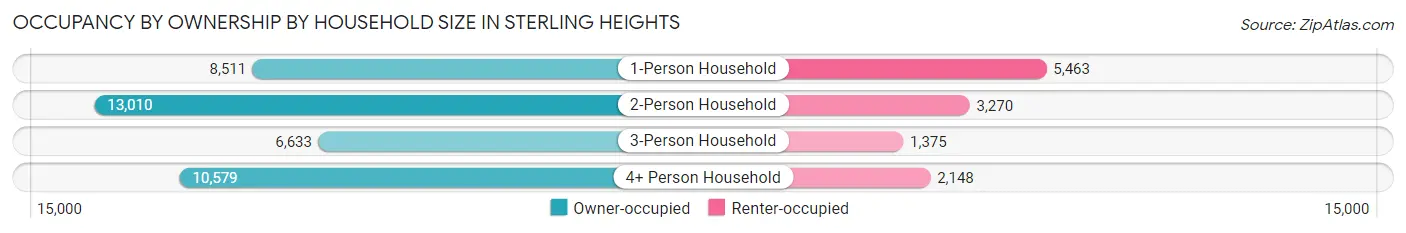
| Household Size | Owner-occupied | Renter-occupied |
| 1-Person Household | 8,511 (60.9%) | 5,463 (39.1%) |
| 2-Person Household | 13,010 (79.9%) | 3,270 (20.1%) |
| 3-Person Household | 6,633 (82.8%) | 1,375 (17.2%) |
| 4+ Person Household | 10,579 (83.1%) | 2,148 (16.9%) |
| Total Housing Units | 38,733 (76.0%) | 12,256 (24.0%) |
Occupancy by Educational Attainment in Sterling Heights
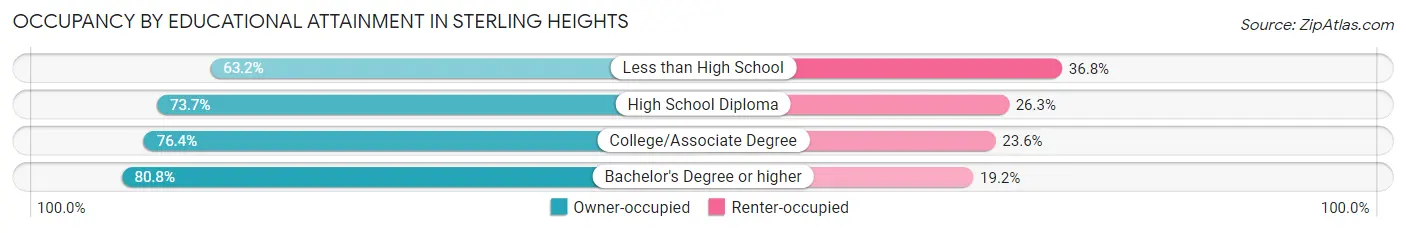
| Household Size | Owner-occupied | Renter-occupied |
| Less than High School | 3,073 (63.2%) | 1,792 (36.8%) |
| High School Diploma | 9,579 (73.7%) | 3,415 (26.3%) |
| College/Associate Degree | 11,779 (76.4%) | 3,647 (23.6%) |
| Bachelor's Degree or higher | 14,302 (80.8%) | 3,402 (19.2%) |
Occupancy by Age of Householder in Sterling Heights
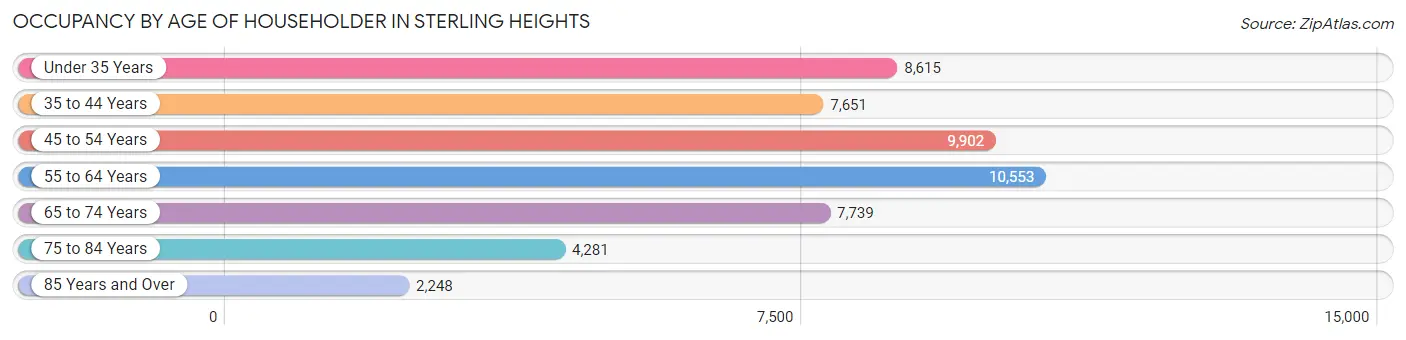
| Age Bracket | # Households | % Households |
| Under 35 Years | 8,615 | 16.9% |
| 35 to 44 Years | 7,651 | 15.0% |
| 45 to 54 Years | 9,902 | 19.4% |
| 55 to 64 Years | 10,553 | 20.7% |
| 65 to 74 Years | 7,739 | 15.2% |
| 75 to 84 Years | 4,281 | 8.4% |
| 85 Years and Over | 2,248 | 4.4% |
| Total | 50,989 | 100.0% |
Housing Finances in Sterling Heights
Median Income by Occupancy in Sterling Heights
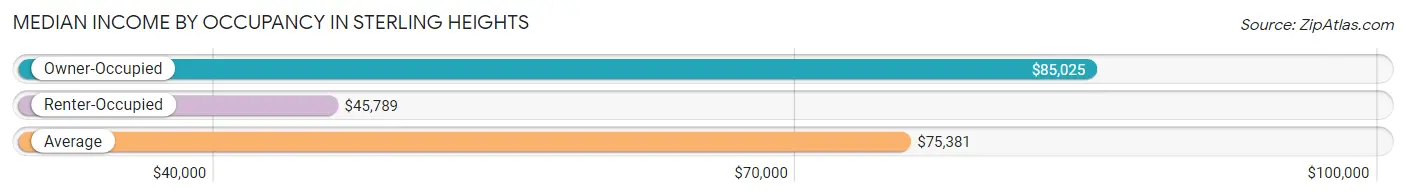
| Occupancy Type | # Households | Median Income |
| Owner-Occupied | 38,733 (76.0%) | $85,025 |
| Renter-Occupied | 12,256 (24.0%) | $45,789 |
| Average | 50,989 (100.0%) | $75,381 |
Occupancy by Householder Income Bracket in Sterling Heights
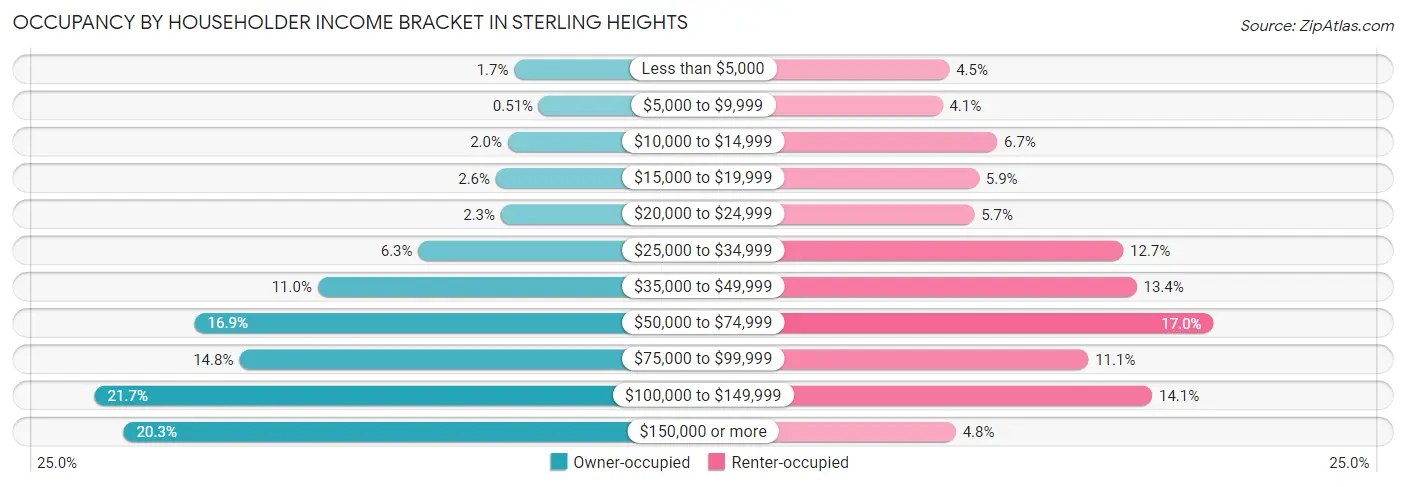
| Income Bracket | Owner-occupied | Renter-occupied |
| Less than $5,000 | 649 (1.7%) | 547 (4.5%) |
| $5,000 to $9,999 | 199 (0.5%) | 508 (4.1%) |
| $10,000 to $14,999 | 770 (2.0%) | 826 (6.7%) |
| $15,000 to $19,999 | 993 (2.6%) | 719 (5.9%) |
| $20,000 to $24,999 | 900 (2.3%) | 693 (5.7%) |
| $25,000 to $34,999 | 2,422 (6.2%) | 1,562 (12.7%) |
| $35,000 to $49,999 | 4,278 (11.0%) | 1,640 (13.4%) |
| $50,000 to $74,999 | 6,547 (16.9%) | 2,088 (17.0%) |
| $75,000 to $99,999 | 5,723 (14.8%) | 1,358 (11.1%) |
| $100,000 to $149,999 | 8,393 (21.7%) | 1,730 (14.1%) |
| $150,000 or more | 7,859 (20.3%) | 585 (4.8%) |
| Total | 38,733 (100.0%) | 12,256 (100.0%) |
Monthly Housing Cost Tiers in Sterling Heights
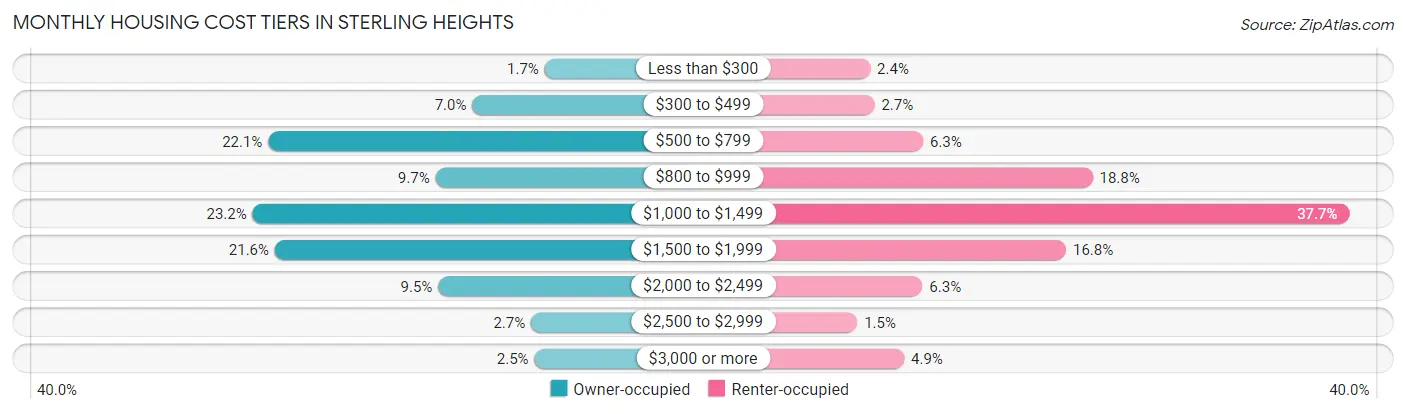
| Monthly Cost | Owner-occupied | Renter-occupied |
| Less than $300 | 660 (1.7%) | 295 (2.4%) |
| $300 to $499 | 2,721 (7.0%) | 335 (2.7%) |
| $500 to $799 | 8,543 (22.1%) | 772 (6.3%) |
| $800 to $999 | 3,773 (9.7%) | 2,303 (18.8%) |
| $1,000 to $1,499 | 8,989 (23.2%) | 4,619 (37.7%) |
| $1,500 to $1,999 | 8,356 (21.6%) | 2,064 (16.8%) |
| $2,000 to $2,499 | 3,697 (9.5%) | 767 (6.3%) |
| $2,500 to $2,999 | 1,044 (2.7%) | 179 (1.5%) |
| $3,000 or more | 950 (2.5%) | 602 (4.9%) |
| Total | 38,733 (100.0%) | 12,256 (100.0%) |
Physical Housing Characteristics in Sterling Heights
Housing Structures in Sterling Heights

| Structure Type | # Housing Units | % Housing Units |
| Single Unit, Detached | 34,319 | 67.3% |
| Single Unit, Attached | 4,821 | 9.5% |
| 2 Unit Apartments | 289 | 0.6% |
| 3 or 4 Unit Apartments | 1,876 | 3.7% |
| 5 to 9 Unit Apartments | 3,903 | 7.6% |
| 10 or more Apartments | 4,252 | 8.3% |
| Mobile Home / Other | 1,529 | 3.0% |
| Total | 50,989 | 100.0% |
Housing Structures by Occupancy in Sterling Heights
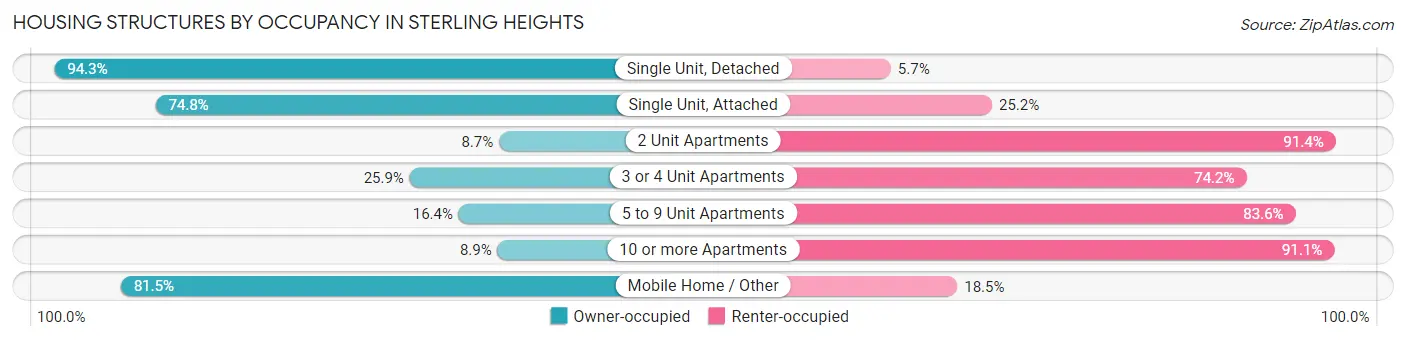
| Structure Type | Owner-occupied | Renter-occupied |
| Single Unit, Detached | 32,351 (94.3%) | 1,968 (5.7%) |
| Single Unit, Attached | 3,606 (74.8%) | 1,215 (25.2%) |
| 2 Unit Apartments | 25 (8.6%) | 264 (91.3%) |
| 3 or 4 Unit Apartments | 485 (25.9%) | 1,391 (74.2%) |
| 5 to 9 Unit Apartments | 640 (16.4%) | 3,263 (83.6%) |
| 10 or more Apartments | 380 (8.9%) | 3,872 (91.1%) |
| Mobile Home / Other | 1,246 (81.5%) | 283 (18.5%) |
| Total | 38,733 (76.0%) | 12,256 (24.0%) |
Housing Structures by Number of Rooms in Sterling Heights
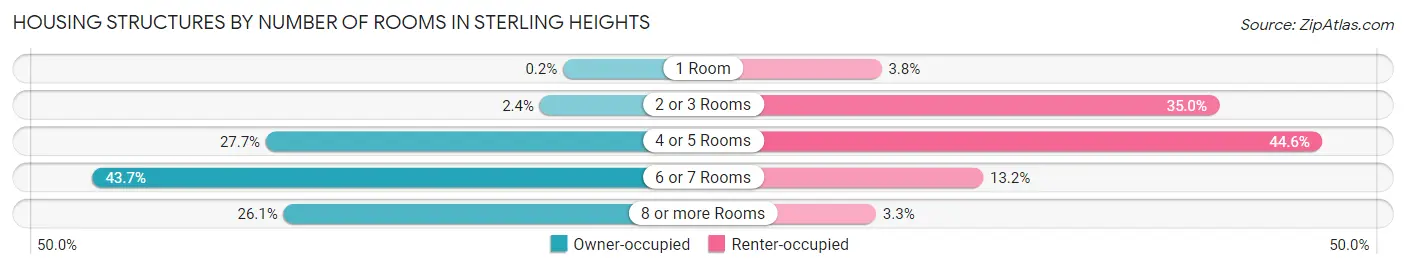
| Number of Rooms | Owner-occupied | Renter-occupied |
| 1 Room | 76 (0.2%) | 471 (3.8%) |
| 2 or 3 Rooms | 911 (2.4%) | 4,294 (35.0%) |
| 4 or 5 Rooms | 10,723 (27.7%) | 5,460 (44.6%) |
| 6 or 7 Rooms | 16,934 (43.7%) | 1,623 (13.2%) |
| 8 or more Rooms | 10,089 (26.1%) | 408 (3.3%) |
| Total | 38,733 (100.0%) | 12,256 (100.0%) |
Housing Structure by Heating Type in Sterling Heights
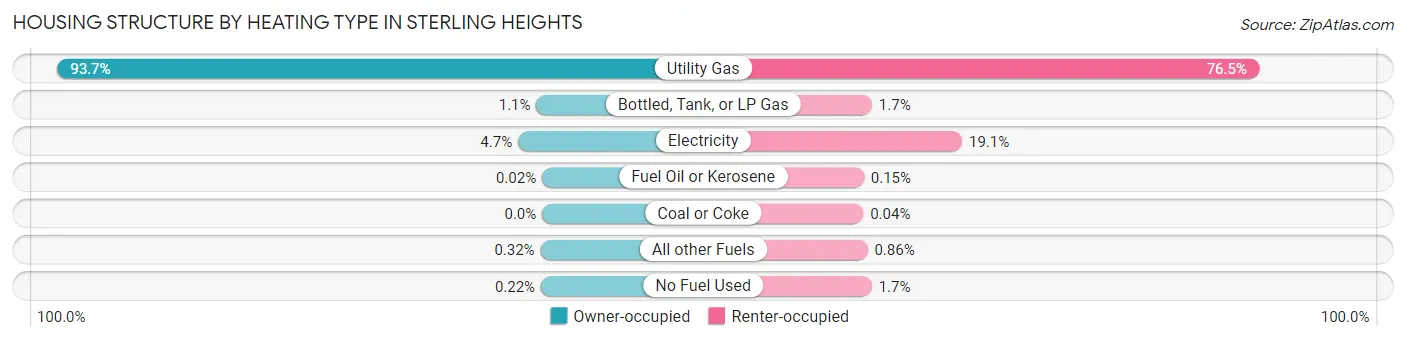
| Heating Type | Owner-occupied | Renter-occupied |
| Utility Gas | 36,281 (93.7%) | 9,370 (76.4%) |
| Bottled, Tank, or LP Gas | 431 (1.1%) | 209 (1.7%) |
| Electricity | 1,805 (4.7%) | 2,344 (19.1%) |
| Fuel Oil or Kerosene | 6 (0.0%) | 18 (0.2%) |
| Coal or Coke | 0 (0.0%) | 5 (0.0%) |
| All other Fuels | 124 (0.3%) | 105 (0.9%) |
| No Fuel Used | 86 (0.2%) | 205 (1.7%) |
| Total | 38,733 (100.0%) | 12,256 (100.0%) |
Household Vehicle Usage in Sterling Heights
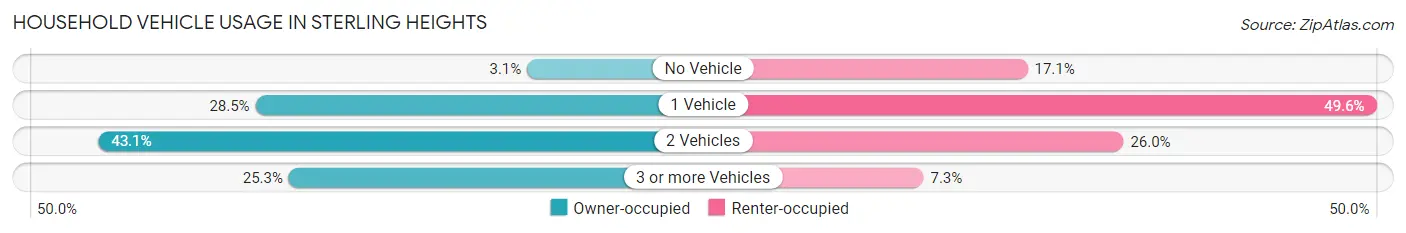
| Vehicles per Household | Owner-occupied | Renter-occupied |
| No Vehicle | 1,197 (3.1%) | 2,090 (17.1%) |
| 1 Vehicle | 11,019 (28.4%) | 6,080 (49.6%) |
| 2 Vehicles | 16,702 (43.1%) | 3,186 (26.0%) |
| 3 or more Vehicles | 9,815 (25.3%) | 900 (7.3%) |
| Total | 38,733 (100.0%) | 12,256 (100.0%) |
Real Estate & Mortgages in Sterling Heights
Real Estate and Mortgage Overview in Sterling Heights
| Characteristic | Without Mortgage | With Mortgage |
| Housing Units | 14,367 | 24,366 |
| Median Property Value | $231,300 | $250,900 |
| Median Household Income | $66,408 | $5,928 |
| Monthly Housing Costs | $643 | $921 |
| Real Estate Taxes | $3,293 | $938 |
Property Value by Mortgage Status in Sterling Heights
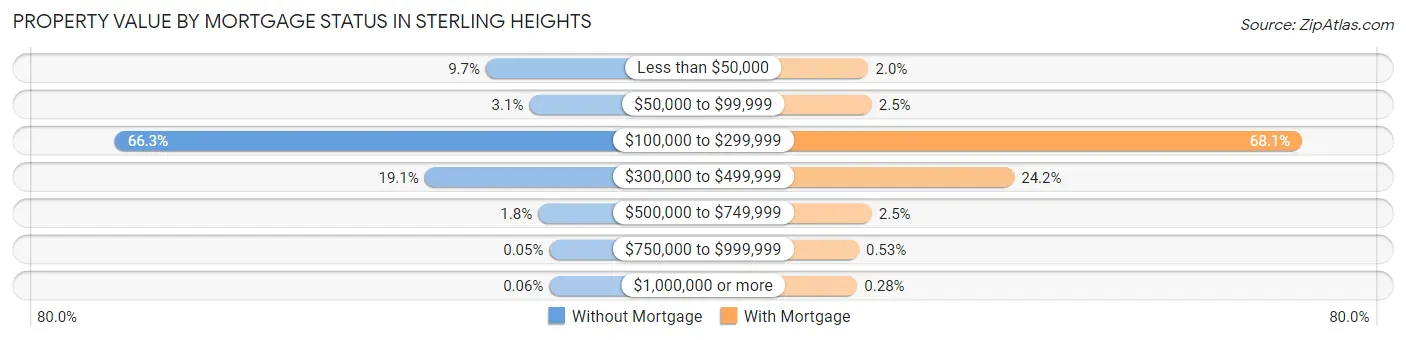
| Property Value | Without Mortgage | With Mortgage |
| Less than $50,000 | 1,396 (9.7%) | 486 (2.0%) |
| $50,000 to $99,999 | 445 (3.1%) | 604 (2.5%) |
| $100,000 to $299,999 | 9,518 (66.2%) | 16,580 (68.0%) |
| $300,000 to $499,999 | 2,738 (19.1%) | 5,895 (24.2%) |
| $500,000 to $749,999 | 254 (1.8%) | 605 (2.5%) |
| $750,000 to $999,999 | 7 (0.1%) | 128 (0.5%) |
| $1,000,000 or more | 9 (0.1%) | 68 (0.3%) |
| Total | 14,367 (100.0%) | 24,366 (100.0%) |
Household Income by Mortgage Status in Sterling Heights
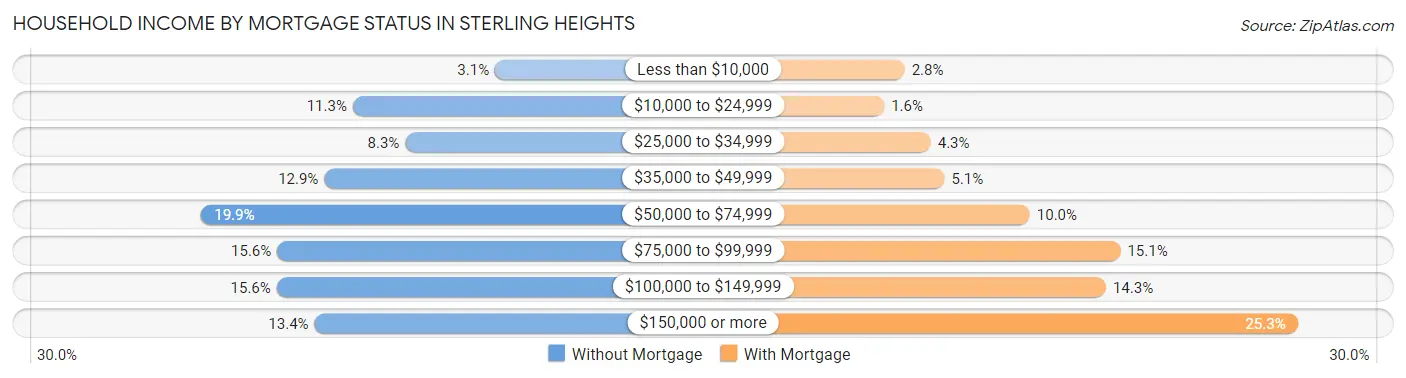
| Household Income | Without Mortgage | With Mortgage |
| Less than $10,000 | 448 (3.1%) | 685 (2.8%) |
| $10,000 to $24,999 | 1,616 (11.3%) | 400 (1.6%) |
| $25,000 to $34,999 | 1,185 (8.3%) | 1,047 (4.3%) |
| $35,000 to $49,999 | 1,850 (12.9%) | 1,237 (5.1%) |
| $50,000 to $74,999 | 2,859 (19.9%) | 2,428 (10.0%) |
| $75,000 to $99,999 | 2,237 (15.6%) | 3,688 (15.1%) |
| $100,000 to $149,999 | 2,241 (15.6%) | 3,486 (14.3%) |
| $150,000 or more | 1,931 (13.4%) | 6,152 (25.3%) |
| Total | 14,367 (100.0%) | 24,366 (100.0%) |
Property Value to Household Income Ratio in Sterling Heights
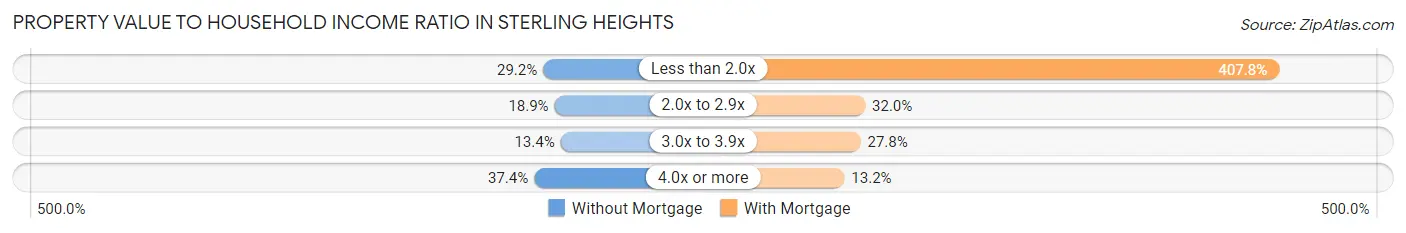
| Value-to-Income Ratio | Without Mortgage | With Mortgage |
| Less than 2.0x | 4,195 (29.2%) | 99,363 (407.8%) |
| 2.0x to 2.9x | 2,712 (18.9%) | 7,784 (32.0%) |
| 3.0x to 3.9x | 1,925 (13.4%) | 6,778 (27.8%) |
| 4.0x or more | 5,376 (37.4%) | 3,203 (13.2%) |
| Total | 14,367 (100.0%) | 24,366 (100.0%) |
Real Estate Taxes by Mortgage Status in Sterling Heights
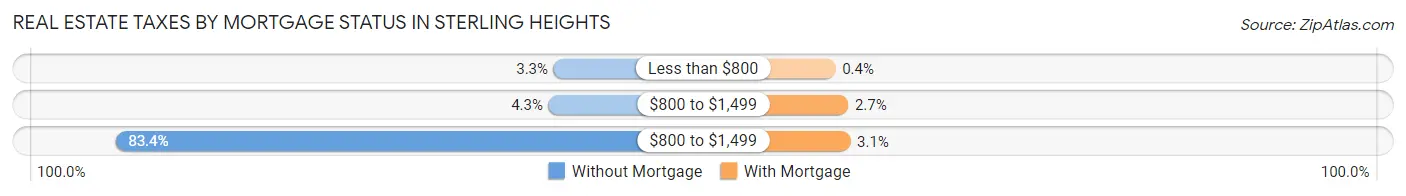
| Property Taxes | Without Mortgage | With Mortgage |
| Less than $800 | 478 (3.3%) | 97 (0.4%) |
| $800 to $1,499 | 612 (4.3%) | 666 (2.7%) |
| $800 to $1,499 | 11,987 (83.4%) | 758 (3.1%) |
| Total | 14,367 (100.0%) | 24,366 (100.0%) |
Health & Disability in Sterling Heights
Health Insurance Coverage by Age in Sterling Heights
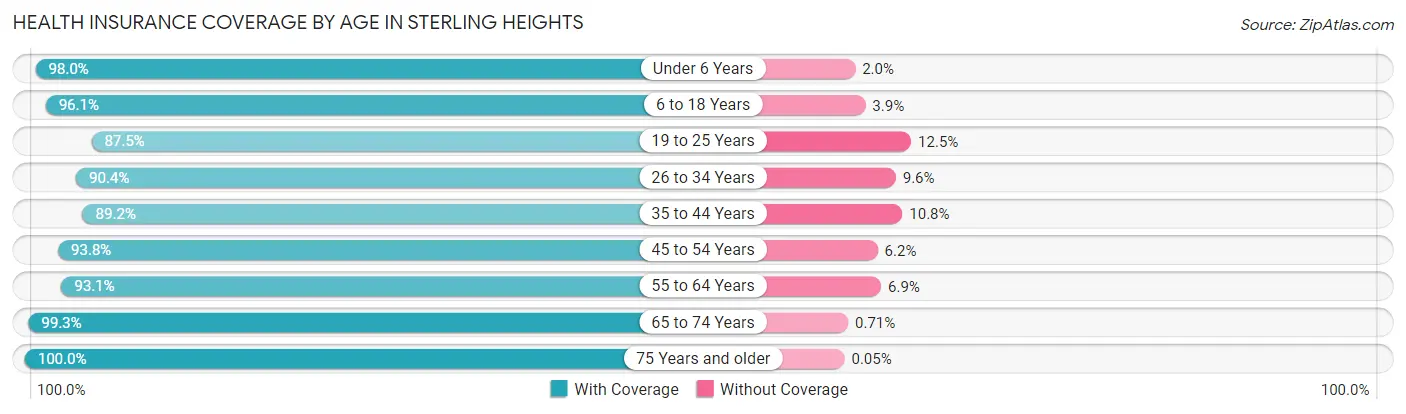
| Age Bracket | With Coverage | Without Coverage |
| Under 6 Years | 8,360 (98.0%) | 173 (2.0%) |
| 6 to 18 Years | 19,345 (96.1%) | 794 (3.9%) |
| 19 to 25 Years | 10,252 (87.5%) | 1,460 (12.5%) |
| 26 to 34 Years | 15,168 (90.4%) | 1,610 (9.6%) |
| 35 to 44 Years | 13,386 (89.2%) | 1,626 (10.8%) |
| 45 to 54 Years | 17,284 (93.8%) | 1,147 (6.2%) |
| 55 to 64 Years | 17,661 (93.1%) | 1,300 (6.9%) |
| 65 to 74 Years | 13,428 (99.3%) | 96 (0.7%) |
| 75 Years and older | 9,975 (100.0%) | 5 (0.1%) |
| Total | 124,859 (93.8%) | 8,211 (6.2%) |
Health Insurance Coverage by Citizenship Status in Sterling Heights
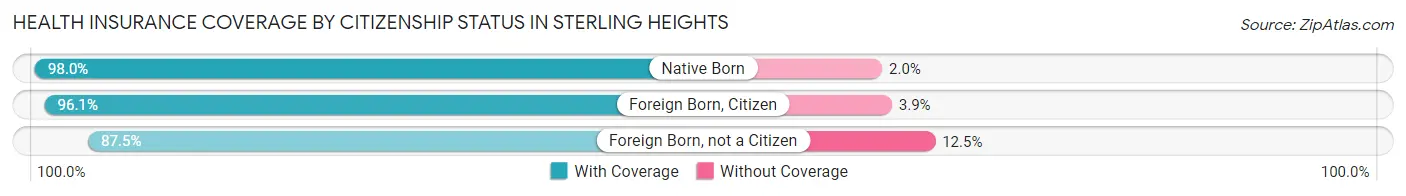
| Citizenship Status | With Coverage | Without Coverage |
| Native Born | 8,360 (98.0%) | 173 (2.0%) |
| Foreign Born, Citizen | 19,345 (96.1%) | 794 (3.9%) |
| Foreign Born, not a Citizen | 10,252 (87.5%) | 1,460 (12.5%) |
Health Insurance Coverage by Household Income in Sterling Heights
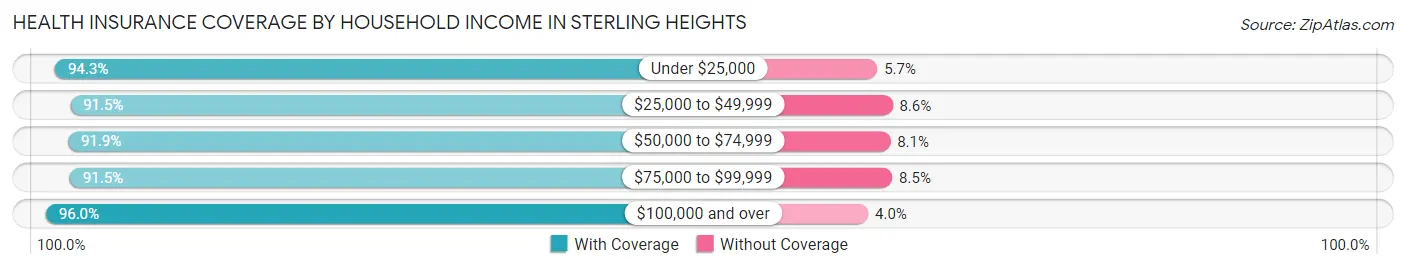
| Household Income | With Coverage | Without Coverage |
| Under $25,000 | 11,017 (94.3%) | 666 (5.7%) |
| $25,000 to $49,999 | 20,714 (91.4%) | 1,936 (8.6%) |
| $50,000 to $74,999 | 18,064 (91.9%) | 1,600 (8.1%) |
| $75,000 to $99,999 | 17,148 (91.5%) | 1,592 (8.5%) |
| $100,000 and over | 57,689 (96.0%) | 2,400 (4.0%) |
Public vs Private Health Insurance Coverage by Age in Sterling Heights
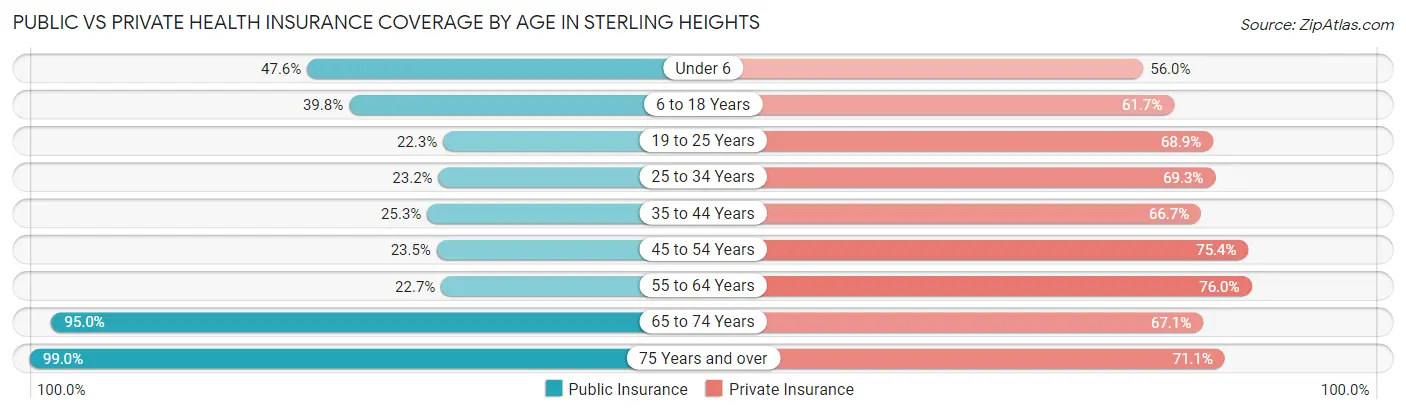
| Age Bracket | Public Insurance | Private Insurance |
| Under 6 | 4,058 (47.6%) | 4,775 (56.0%) |
| 6 to 18 Years | 8,014 (39.8%) | 12,417 (61.7%) |
| 19 to 25 Years | 2,617 (22.3%) | 8,069 (68.9%) |
| 25 to 34 Years | 3,891 (23.2%) | 11,627 (69.3%) |
| 35 to 44 Years | 3,795 (25.3%) | 10,008 (66.7%) |
| 45 to 54 Years | 4,334 (23.5%) | 13,905 (75.4%) |
| 55 to 64 Years | 4,301 (22.7%) | 14,412 (76.0%) |
| 65 to 74 Years | 12,851 (95.0%) | 9,068 (67.0%) |
| 75 Years and over | 9,882 (99.0%) | 7,095 (71.1%) |
| Total | 53,743 (40.4%) | 91,376 (68.7%) |
Disability Status by Sex by Age in Sterling Heights
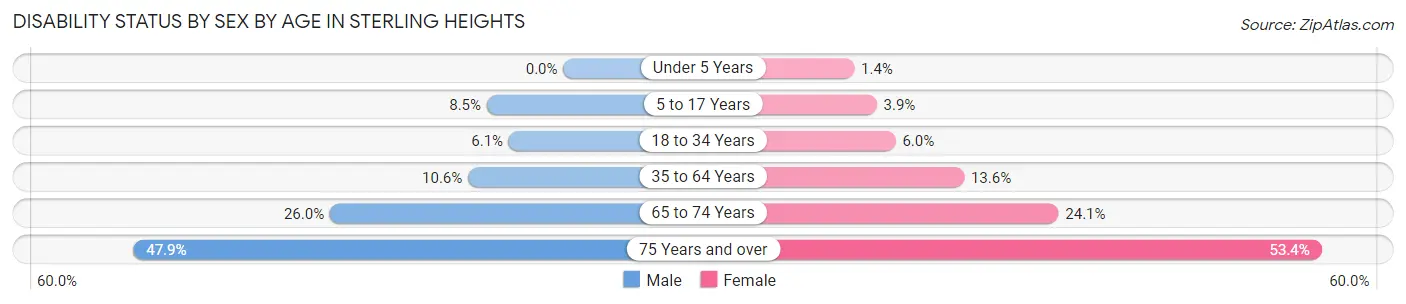
| Age Bracket | Male | Female |
| Under 5 Years | 0 (0.0%) | 54 (1.4%) |
| 5 to 17 Years | 868 (8.5%) | 375 (3.9%) |
| 18 to 34 Years | 905 (6.1%) | 906 (6.0%) |
| 35 to 64 Years | 2,775 (10.6%) | 3,572 (13.6%) |
| 65 to 74 Years | 1,696 (26.0%) | 1,688 (24.1%) |
| 75 Years and over | 1,863 (47.9%) | 3,254 (53.4%) |
Disability Class by Sex by Age in Sterling Heights
Disability Class: Hearing Difficulty
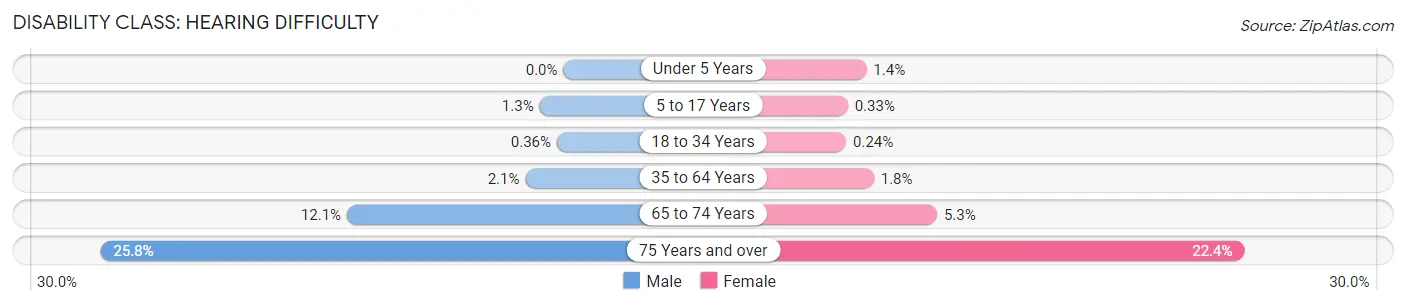
| Age Bracket | Male | Female |
| Under 5 Years | 0 (0.0%) | 54 (1.4%) |
| 5 to 17 Years | 135 (1.3%) | 32 (0.3%) |
| 18 to 34 Years | 53 (0.4%) | 37 (0.2%) |
| 35 to 64 Years | 554 (2.1%) | 467 (1.8%) |
| 65 to 74 Years | 786 (12.0%) | 371 (5.3%) |
| 75 Years and over | 1,003 (25.8%) | 1,365 (22.4%) |
Disability Class: Vision Difficulty
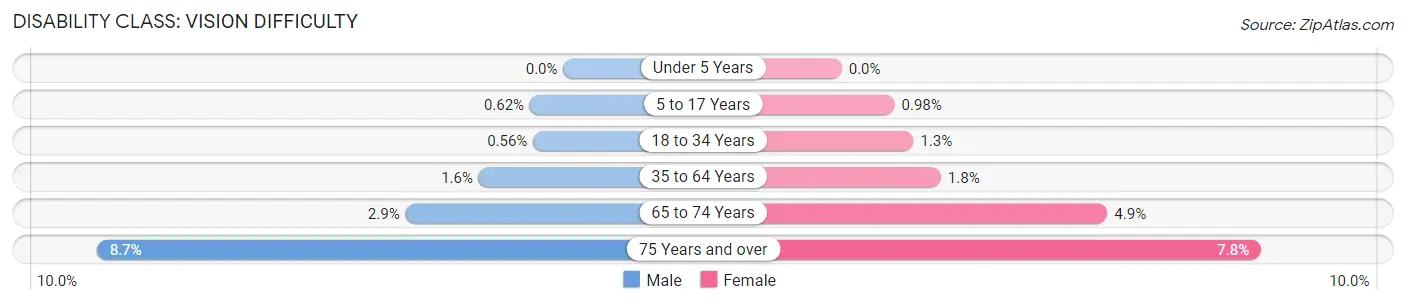
| Age Bracket | Male | Female |
| Under 5 Years | 0 (0.0%) | 0 (0.0%) |
| 5 to 17 Years | 63 (0.6%) | 95 (1.0%) |
| 18 to 34 Years | 83 (0.6%) | 202 (1.3%) |
| 35 to 64 Years | 411 (1.6%) | 482 (1.8%) |
| 65 to 74 Years | 191 (2.9%) | 345 (4.9%) |
| 75 Years and over | 337 (8.7%) | 474 (7.8%) |
Disability Class: Cognitive Difficulty
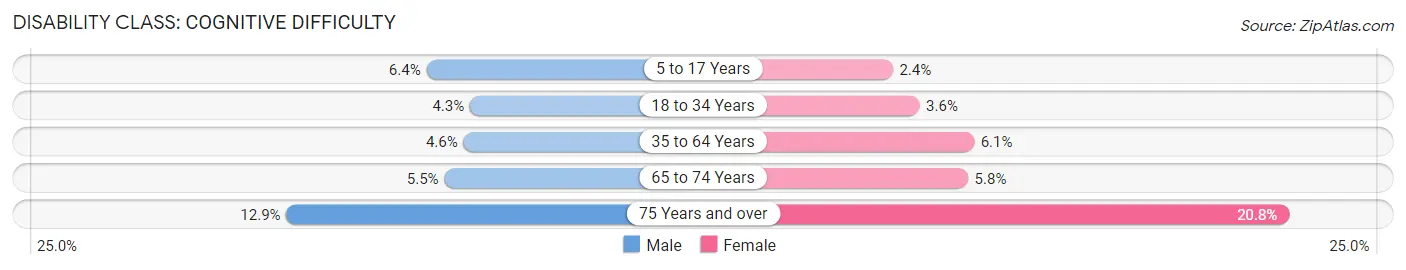
| Age Bracket | Male | Female |
| 5 to 17 Years | 647 (6.4%) | 227 (2.4%) |
| 18 to 34 Years | 646 (4.3%) | 544 (3.6%) |
| 35 to 64 Years | 1,211 (4.6%) | 1,607 (6.1%) |
| 65 to 74 Years | 360 (5.5%) | 409 (5.8%) |
| 75 Years and over | 500 (12.9%) | 1,264 (20.8%) |
Disability Class: Ambulatory Difficulty
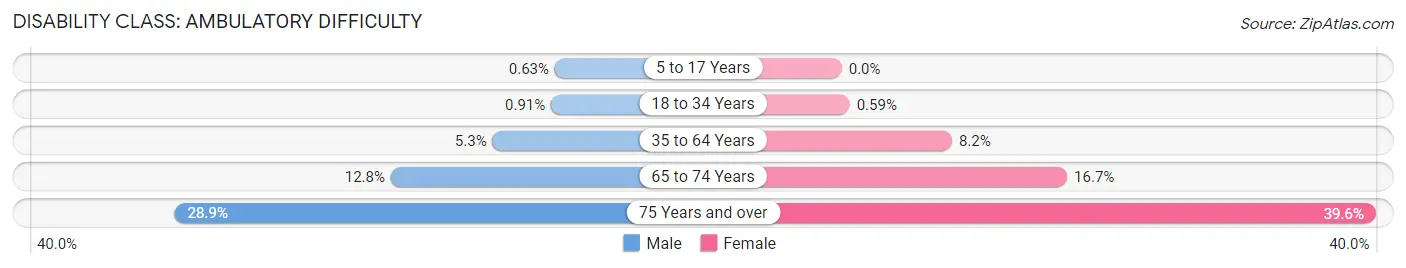
| Age Bracket | Male | Female |
| 5 to 17 Years | 64 (0.6%) | 0 (0.0%) |
| 18 to 34 Years | 136 (0.9%) | 89 (0.6%) |
| 35 to 64 Years | 1,377 (5.3%) | 2,147 (8.2%) |
| 65 to 74 Years | 836 (12.8%) | 1,171 (16.7%) |
| 75 Years and over | 1,123 (28.9%) | 2,414 (39.6%) |
Disability Class: Self-Care Difficulty
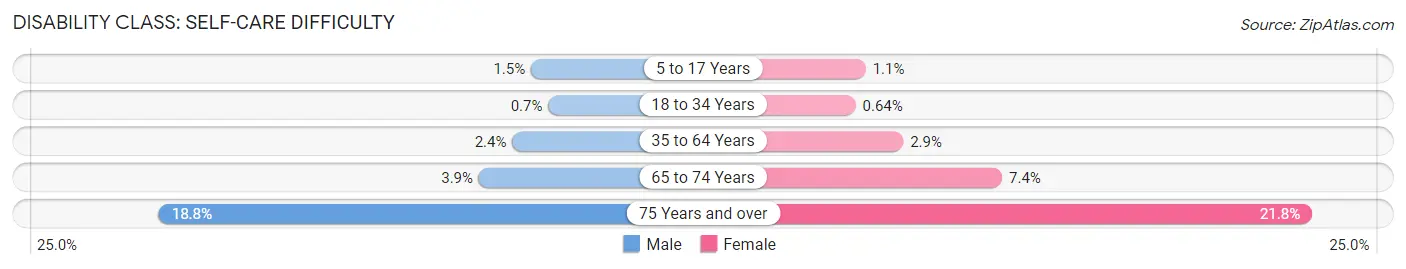
| Age Bracket | Male | Female |
| 5 to 17 Years | 153 (1.5%) | 107 (1.1%) |
| 18 to 34 Years | 104 (0.7%) | 97 (0.6%) |
| 35 to 64 Years | 619 (2.4%) | 749 (2.9%) |
| 65 to 74 Years | 256 (3.9%) | 521 (7.4%) |
| 75 Years and over | 730 (18.8%) | 1,329 (21.8%) |
Technology Access in Sterling Heights
Computing Device Access in Sterling Heights
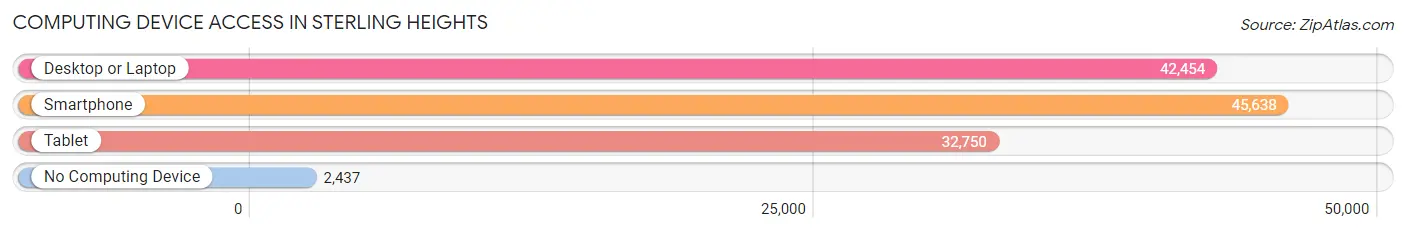
| Device Type | # Households | % Households |
| Desktop or Laptop | 42,454 | 83.3% |
| Smartphone | 45,638 | 89.5% |
| Tablet | 32,750 | 64.2% |
| No Computing Device | 2,437 | 4.8% |
| Total | 50,989 | 100.0% |
Internet Access in Sterling Heights
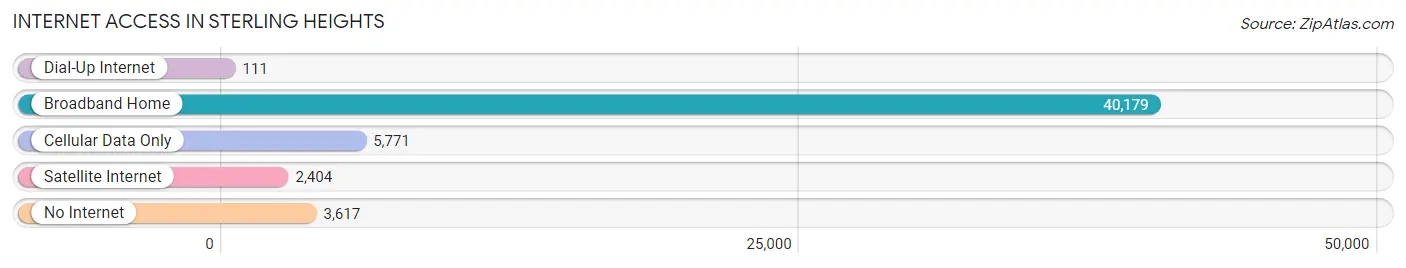
| Internet Type | # Households | % Households |
| Dial-Up Internet | 111 | 0.2% |
| Broadband Home | 40,179 | 78.8% |
| Cellular Data Only | 5,771 | 11.3% |
| Satellite Internet | 2,404 | 4.7% |
| No Internet | 3,617 | 7.1% |
| Total | 50,989 | 100.0% |
Sterling Heights Summary
Sterling Heights is a city located in Macomb County, Michigan, United States. As of the 2010 census, the city had a total population of 129,699, making it the third largest city in Michigan and the fourth largest city in the Metro Detroit area. Sterling Heights is the second largest city in Macomb County, after Warren.
History
Sterling Heights was first settled in 1836 by a man named John B. Sterling. He purchased a large tract of land from the local Native Americans and began to develop the area. The city was incorporated in 1968 and has since grown to become one of the largest cities in the Metro Detroit area.
Geography
Sterling Heights is located in southeastern Michigan, approximately 20 miles north of Detroit. The city is situated on the Clinton River and is bordered by the cities of Warren, Troy, and Utica. The city covers an area of 36.2 square miles and has a population density of 3,567 people per square mile.
Economy
Sterling Heights is home to a variety of businesses and industries. The city is home to several automotive suppliers, including Magna International, Lear Corporation, and American Axle & Manufacturing. The city is also home to several retail stores, including Walmart, Target, and Meijer. The city is also home to several medical facilities, including St. John Macomb-Oakland Hospital and Henry Ford Macomb Hospital.
Demographics
As of the 2010 census, the city had a population of 129,699. The racial makeup of the city was 79.2% White, 11.3% African American, 0.4% Native American, 3.2% Asian, 0.1% Pacific Islander, 3.2% from other races, and 2.7% from two or more races. Hispanic or Latino of any race were 6.2% of the population.
The median income for a household in the city was $60,945, and the median income for a family was $71,945. The per capita income for the city was $27,945. About 5.2% of families and 7.2% of the population were below the poverty line, including 9.2% of those under age 18 and 6.2% of those age 65 or over.
Sterling Heights is a diverse city with a variety of cultures and backgrounds. The city is home to a large Arab-American population, as well as a large Polish-American population. The city is also home to a large number of immigrants from India, China, and other countries.
Common Questions
What is Per Capita Income in Sterling Heights?
Per Capita income in Sterling Heights is $35,615.
What is the Median Family Income in Sterling Heights?
Median Family Income in Sterling Heights is $90,488.
What is the Median Household income in Sterling Heights?
Median Household Income in Sterling Heights is $75,381.
What is Income or Wage Gap in Sterling Heights?
Income or Wage Gap in Sterling Heights is 36.4%.
Women in Sterling Heights earn 63.6 cents for every dollar earned by a man.
What is Family Income Deficit in Sterling Heights?
Family Income Deficit in Sterling Heights is $8,456.
Families that are below poverty line in Sterling Heights earn $8,456 less on average than the poverty threshold level.
What is Inequality or Gini Index in Sterling Heights?
Inequality or Gini Index in Sterling Heights is 0.41.
What is the Total Population of Sterling Heights?
Total Population of Sterling Heights is 133,744.
What is the Total Male Population of Sterling Heights?
Total Male Population of Sterling Heights is 65,238.
What is the Total Female Population of Sterling Heights?
Total Female Population of Sterling Heights is 68,506.
What is the Ratio of Males per 100 Females in Sterling Heights?
There are 95.23 Males per 100 Females in Sterling Heights.
What is the Ratio of Females per 100 Males in Sterling Heights?
There are 105.01 Females per 100 Males in Sterling Heights.
What is the Median Population Age in Sterling Heights?
Median Population Age in Sterling Heights is 41.2 Years.
What is the Average Family Size in Sterling Heights
Average Family Size in Sterling Heights is 3.2 People.
What is the Average Household Size in Sterling Heights
Average Household Size in Sterling Heights is 2.6 People.
How Large is the Labor Force in Sterling Heights?
There are 68,659 People in the Labor Forcein in Sterling Heights.
What is the Percentage of People in the Labor Force in Sterling Heights?
62.3% of People are in the Labor Force in Sterling Heights.
What is the Unemployment Rate in Sterling Heights?
Unemployment Rate in Sterling Heights is 5.9%.