Clawson, MI Map & Demographics
Clawson Map
Clawson Overview
$50,687
PER CAPITA INCOME
$104,662
AVG FAMILY INCOME
$82,713
AVG HOUSEHOLD INCOME
21.8%
WAGE / INCOME GAP [ % ]
78.2¢/ $1
WAGE / INCOME GAP [ $ ]
0.40
INEQUALITY / GINI INDEX
11,388
TOTAL POPULATION
5,877
MALE POPULATION
5,511
FEMALE POPULATION
106.64
MALES / 100 FEMALES
93.77
FEMALES / 100 MALES
41.3
MEDIAN AGE
2.7
AVG FAMILY SIZE
1.9
AVG HOUSEHOLD SIZE
6,866
LABOR FORCE [ PEOPLE ]
69.3%
PERCENT IN LABOR FORCE
4.2%
UNEMPLOYMENT RATE
Clawson Zip Codes
Clawson Area Codes
Income in Clawson
Income Overview in Clawson
Per Capita Income in Clawson is $50,687, while median incomes of families and households are $104,662 and $82,713 respectively.
| Characteristic | Number | Measure |
| Per Capita Income | 11,388 | $50,687 |
| Median Family Income | 2,856 | $104,662 |
| Mean Family Income | 2,856 | $121,166 |
| Median Household Income | 5,806 | $82,713 |
| Mean Household Income | 5,806 | $98,348 |
| Income Deficit | 2,856 | $0 |
| Wage / Income Gap (%) | 11,388 | 21.82% |
| Wage / Income Gap ($) | 11,388 | 78.18¢ per $1 |
| Gini / Inequality Index | 11,388 | 0.40 |
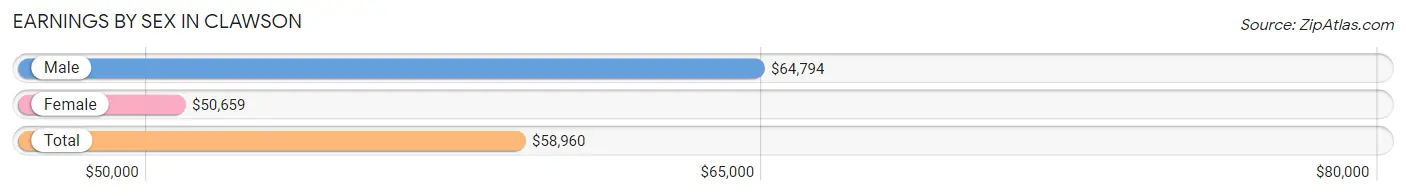
Earnings by Sex in Clawson
Average Earnings in Clawson are $58,960, $64,794 for men and $50,659 for women, a difference of 21.8%.
| Sex | Number | Average Earnings |
| Male | 3,869 (54.2%) | $64,794 |
| Female | 3,270 (45.8%) | $50,659 |
| Total | 7,139 (100.0%) | $58,960 |
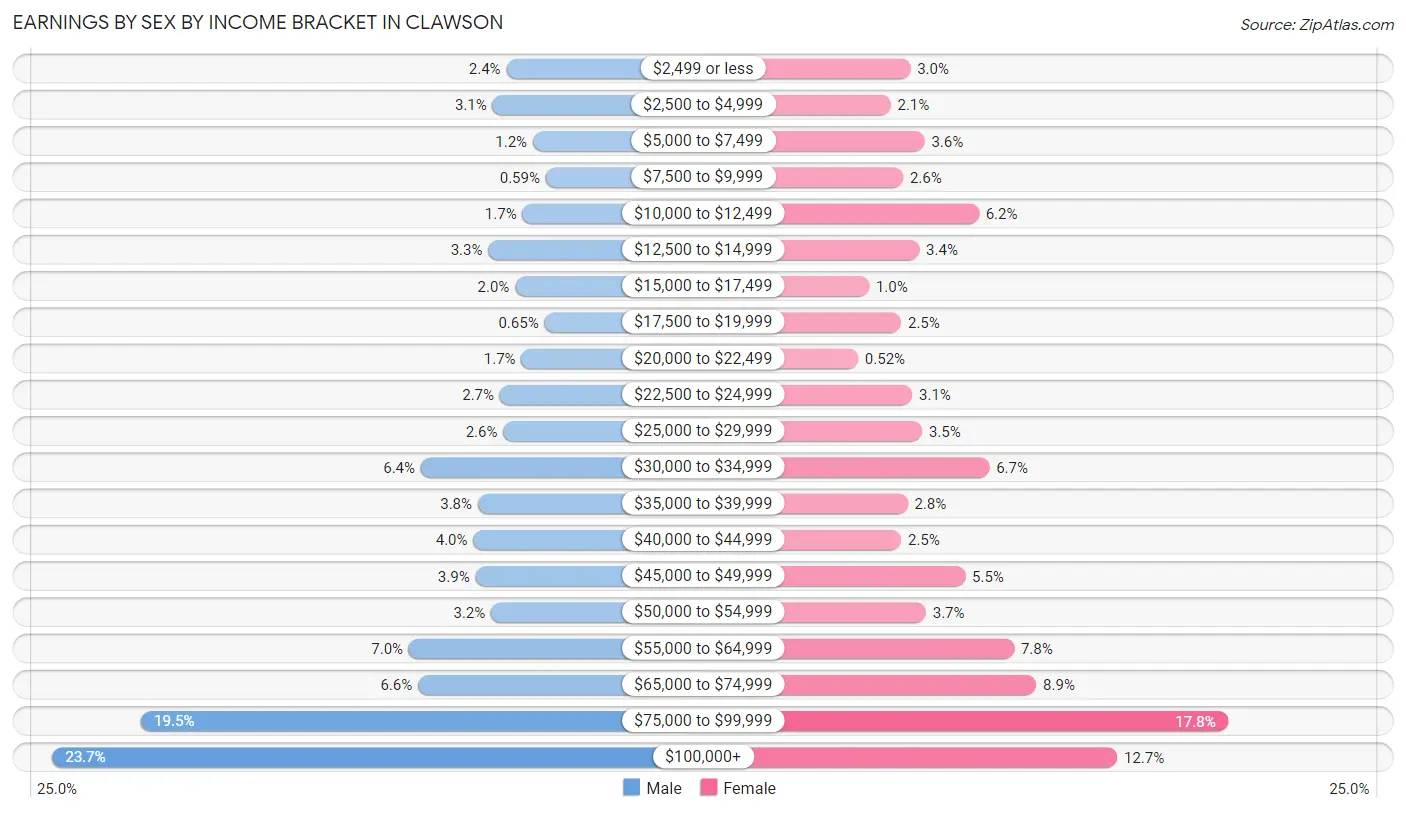
Earnings by Sex by Income Bracket in Clawson
The most common earnings brackets in Clawson are $100,000+ for men (917 | 23.7%) and $75,000 to $99,999 for women (583 | 17.8%).
| Income | Male | Female |
| $2,499 or less | 94 (2.4%) | 97 (3.0%) |
| $2,500 to $4,999 | 119 (3.1%) | 67 (2.1%) |
| $5,000 to $7,499 | 46 (1.2%) | 119 (3.6%) |
| $7,500 to $9,999 | 23 (0.6%) | 86 (2.6%) |
| $10,000 to $12,499 | 65 (1.7%) | 202 (6.2%) |
| $12,500 to $14,999 | 127 (3.3%) | 111 (3.4%) |
| $15,000 to $17,499 | 78 (2.0%) | 34 (1.0%) |
| $17,500 to $19,999 | 25 (0.6%) | 83 (2.5%) |
| $20,000 to $22,499 | 67 (1.7%) | 17 (0.5%) |
| $22,500 to $24,999 | 106 (2.7%) | 100 (3.1%) |
| $25,000 to $29,999 | 100 (2.6%) | 115 (3.5%) |
| $30,000 to $34,999 | 249 (6.4%) | 218 (6.7%) |
| $35,000 to $39,999 | 146 (3.8%) | 93 (2.8%) |
| $40,000 to $44,999 | 154 (4.0%) | 83 (2.5%) |
| $45,000 to $49,999 | 150 (3.9%) | 181 (5.5%) |
| $50,000 to $54,999 | 122 (3.2%) | 121 (3.7%) |
| $55,000 to $64,999 | 271 (7.0%) | 256 (7.8%) |
| $65,000 to $74,999 | 254 (6.6%) | 290 (8.9%) |
| $75,000 to $99,999 | 756 (19.5%) | 583 (17.8%) |
| $100,000+ | 917 (23.7%) | 414 (12.7%) |
| Total | 3,869 (100.0%) | 3,270 (100.0%) |
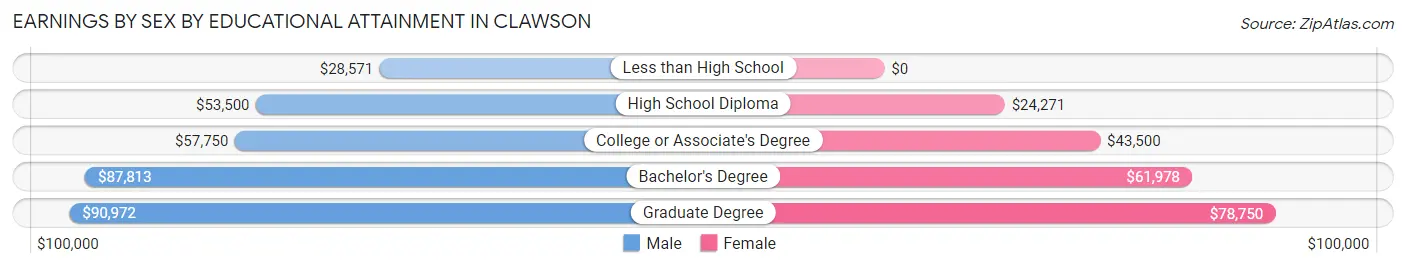
Earnings by Sex by Educational Attainment in Clawson
Average earnings in Clawson are $71,952 for men and $59,753 for women, a difference of 17.0%. Men with an educational attainment of graduate degree enjoy the highest average annual earnings of $90,972, while those with less than high school education earn the least with $28,571. Women with an educational attainment of graduate degree earn the most with the average annual earnings of $78,750, while those with high school diploma education have the smallest earnings of $24,271.
| Educational Attainment | Male Income | Female Income |
| Less than High School | $28,571 | $0 |
| High School Diploma | $53,500 | $24,271 |
| College or Associate's Degree | $57,750 | $43,500 |
| Bachelor's Degree | $87,813 | $61,978 |
| Graduate Degree | $90,972 | $78,750 |
| Total | $71,952 | $59,753 |
Family Income in Clawson
Family Income Brackets in Clawson
According to the Clawson family income data, there are 780 families falling into the $100,000 to $149,999 income range, which is the most common income bracket and makes up 27.3% of all families. Conversely, the $10,000 to $14,999 income bracket is the least frequent group with only 20 families (0.7%) belonging to this category.
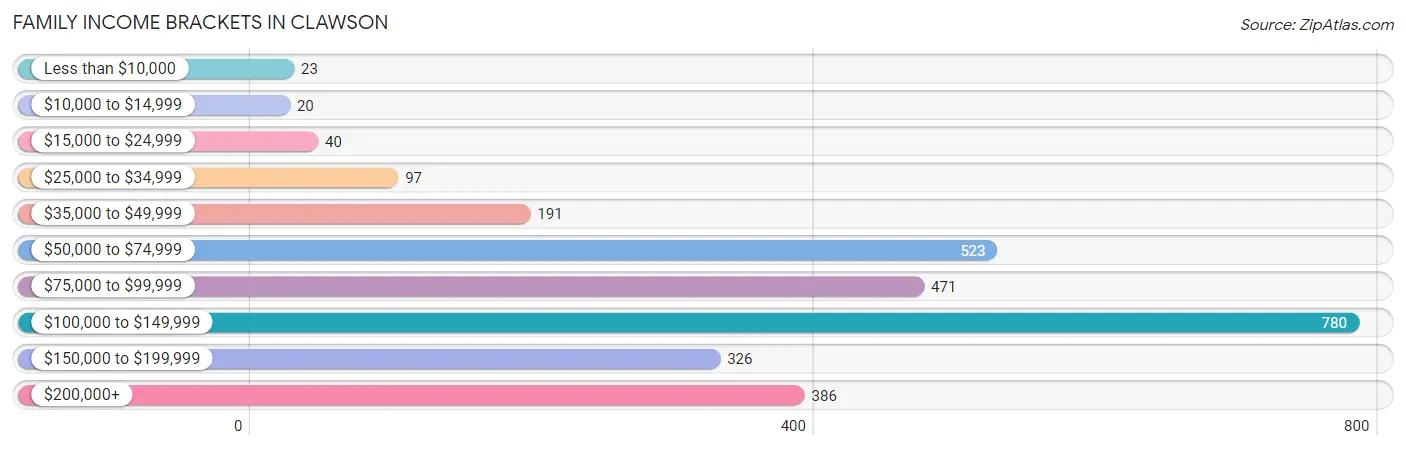
| Income Bracket | # Families | % Families |
| Less than $10,000 | 23 | 0.8% |
| $10,000 to $14,999 | 20 | 0.7% |
| $15,000 to $24,999 | 40 | 1.4% |
| $25,000 to $34,999 | 97 | 3.4% |
| $35,000 to $49,999 | 191 | 6.7% |
| $50,000 to $74,999 | 523 | 18.3% |
| $75,000 to $99,999 | 471 | 16.5% |
| $100,000 to $149,999 | 780 | 27.3% |
| $150,000 to $199,999 | 326 | 11.4% |
| $200,000+ | 386 | 13.5% |
Family Income by Famaliy Size in Clawson
3-person families (503 | 17.6%) account for the highest median family income in Clawson with $131,985 per family, while 2-person families (1,766 | 61.8%) have the highest median income of $49,054 per family member.
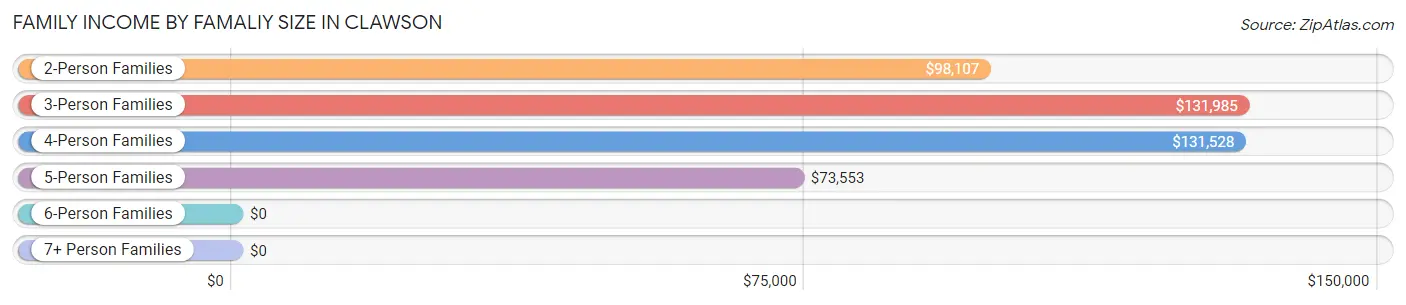
| Income Bracket | # Families | Median Income |
| 2-Person Families | 1,766 (61.8%) | $98,107 |
| 3-Person Families | 503 (17.6%) | $131,985 |
| 4-Person Families | 450 (15.8%) | $131,528 |
| 5-Person Families | 130 (4.5%) | $73,553 |
| 6-Person Families | 7 (0.3%) | $0 |
| 7+ Person Families | 0 (0.0%) | $0 |
| Total | 2,856 (100.0%) | $104,662 |
Family Income by Number of Earners in Clawson
The median family income in Clawson is $104,662, with families comprising 2 earners (1,274) having the highest median family income of $132,632, while families with no earners (396) have the lowest median family income of $52,401, accounting for 44.6% and 13.9% of families, respectively.
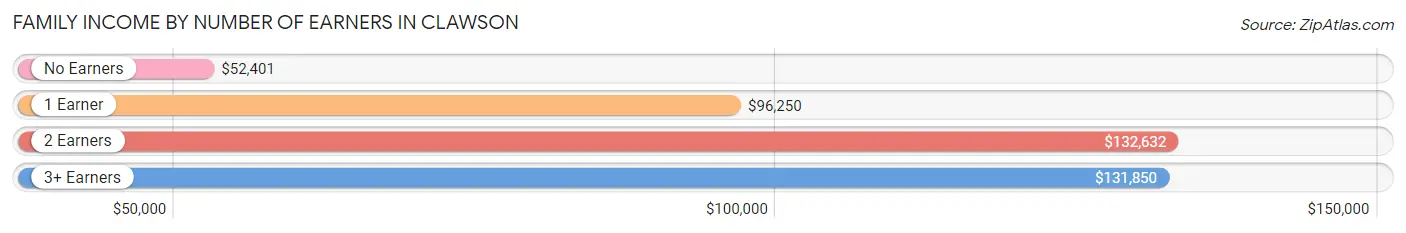
| Number of Earners | # Families | Median Income |
| No Earners | 396 (13.9%) | $52,401 |
| 1 Earner | 879 (30.8%) | $96,250 |
| 2 Earners | 1,274 (44.6%) | $132,632 |
| 3+ Earners | 307 (10.7%) | $131,850 |
| Total | 2,856 (100.0%) | $104,662 |
Household Income in Clawson
Household Income Brackets in Clawson
With 1,184 households falling in the category, the $100,000 to $149,999 income range is the most frequent in Clawson, accounting for 20.4% of all households. In contrast, only 116 households (2.0%) fall into the $10,000 to $14,999 income bracket, making it the least populous group.
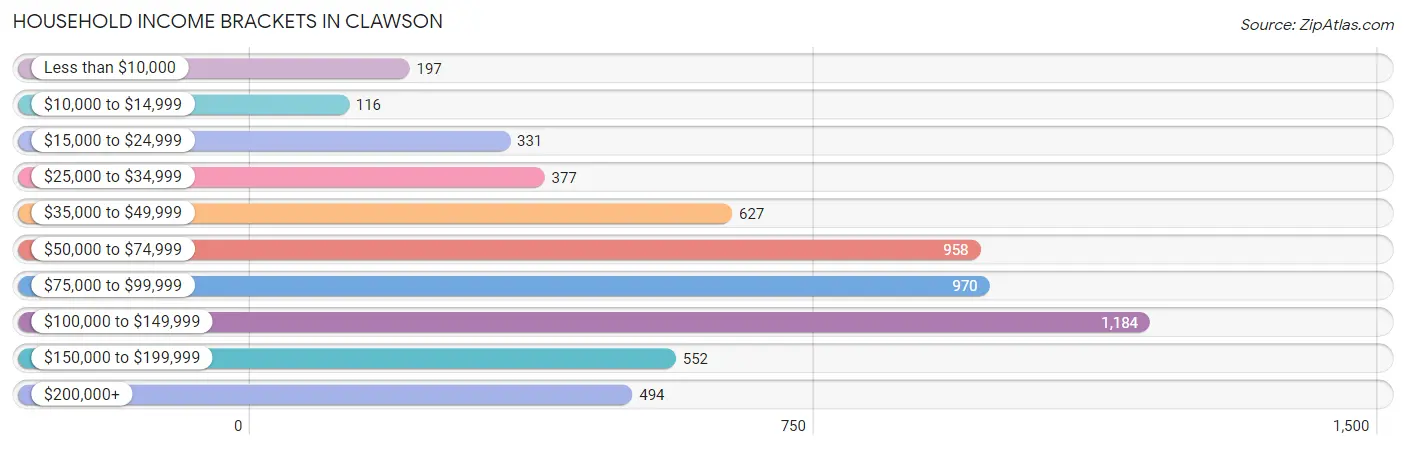
| Income Bracket | # Households | % Households |
| Less than $10,000 | 197 | 3.4% |
| $10,000 to $14,999 | 116 | 2.0% |
| $15,000 to $24,999 | 331 | 5.7% |
| $25,000 to $34,999 | 377 | 6.5% |
| $35,000 to $49,999 | 627 | 10.8% |
| $50,000 to $74,999 | 958 | 16.5% |
| $75,000 to $99,999 | 970 | 16.7% |
| $100,000 to $149,999 | 1,184 | 20.4% |
| $150,000 to $199,999 | 552 | 9.5% |
| $200,000+ | 494 | 8.5% |
Household Income by Householder Age in Clawson
The median household income in Clawson is $82,713, with the highest median household income of $98,705 found in the 45 to 64 years age bracket for the primary householder. A total of 1,817 households (31.3%) fall into this category. Meanwhile, the 65+ years age bracket for the primary householder has the lowest median household income of $44,353, with 1,517 households (26.1%) in this group.
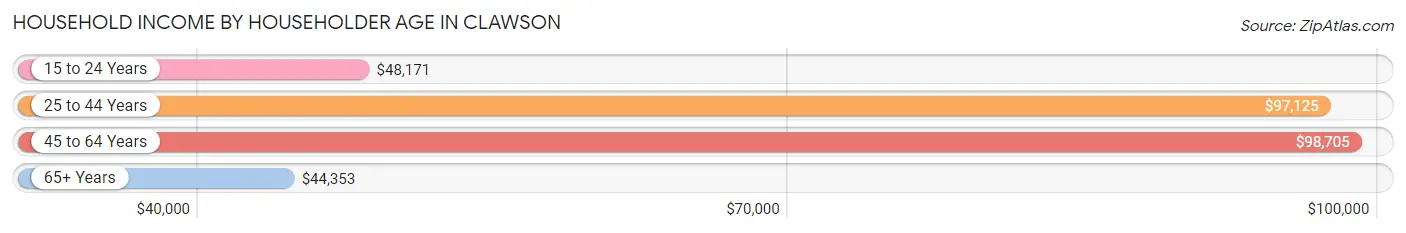
| Income Bracket | # Households | Median Income |
| 15 to 24 Years | 154 (2.6%) | $48,171 |
| 25 to 44 Years | 2,318 (39.9%) | $97,125 |
| 45 to 64 Years | 1,817 (31.3%) | $98,705 |
| 65+ Years | 1,517 (26.1%) | $44,353 |
| Total | 5,806 (100.0%) | $82,713 |
Poverty in Clawson
Income Below Poverty by Sex and Age in Clawson
With 6.4% poverty level for males and 6.2% for females among the residents of Clawson, under 5 year old males and 15 year old females are the most vulnerable to poverty, with 67 males (28.0%) and 16 females (28.6%) in their respective age groups living below the poverty level.
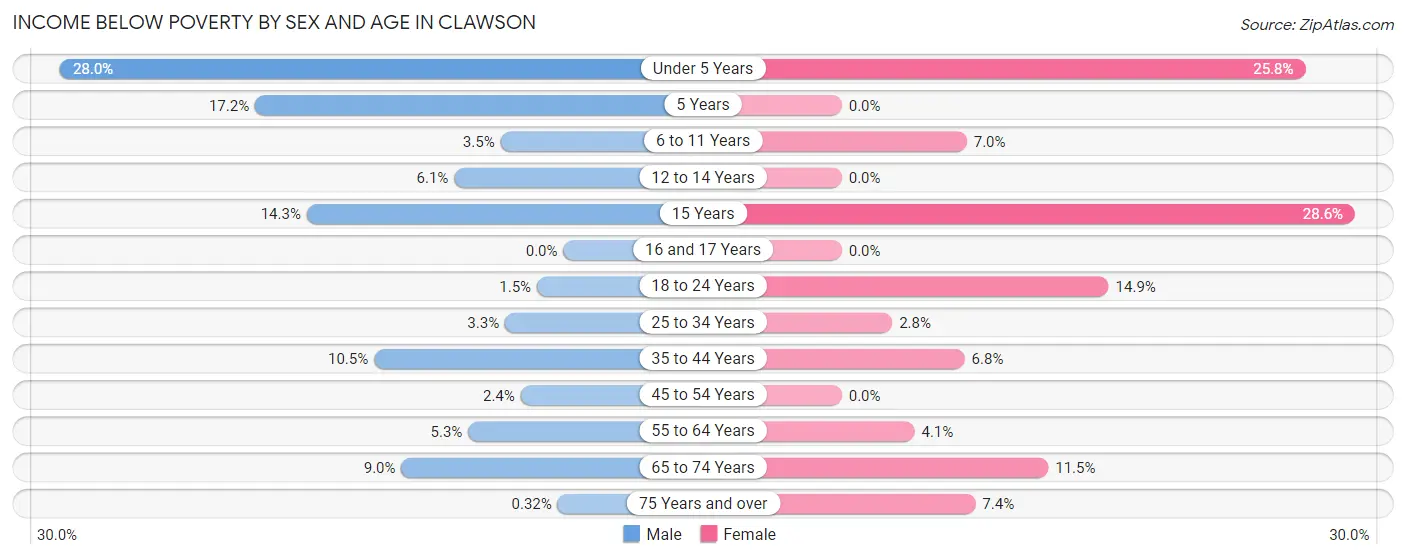
| Age Bracket | Male | Female |
| Under 5 Years | 67 (28.0%) | 24 (25.8%) |
| 5 Years | 17 (17.2%) | 0 (0.0%) |
| 6 to 11 Years | 12 (3.5%) | 19 (7.0%) |
| 12 to 14 Years | 9 (6.1%) | 0 (0.0%) |
| 15 Years | 9 (14.3%) | 16 (28.6%) |
| 16 and 17 Years | 0 (0.0%) | 0 (0.0%) |
| 18 to 24 Years | 5 (1.5%) | 44 (14.9%) |
| 25 to 34 Years | 38 (3.3%) | 33 (2.8%) |
| 35 to 44 Years | 95 (10.5%) | 45 (6.8%) |
| 45 to 54 Years | 13 (2.4%) | 0 (0.0%) |
| 55 to 64 Years | 49 (5.3%) | 36 (4.1%) |
| 65 to 74 Years | 56 (9.0%) | 93 (11.5%) |
| 75 Years and over | 1 (0.3%) | 29 (7.4%) |
| Total | 371 (6.4%) | 339 (6.2%) |
Income Above Poverty by Sex and Age in Clawson
According to the poverty statistics in Clawson, males aged 16 and 17 years and females aged 5 years are the age groups that are most secure financially, with 100.0% of males and 100.0% of females in these age groups living above the poverty line.
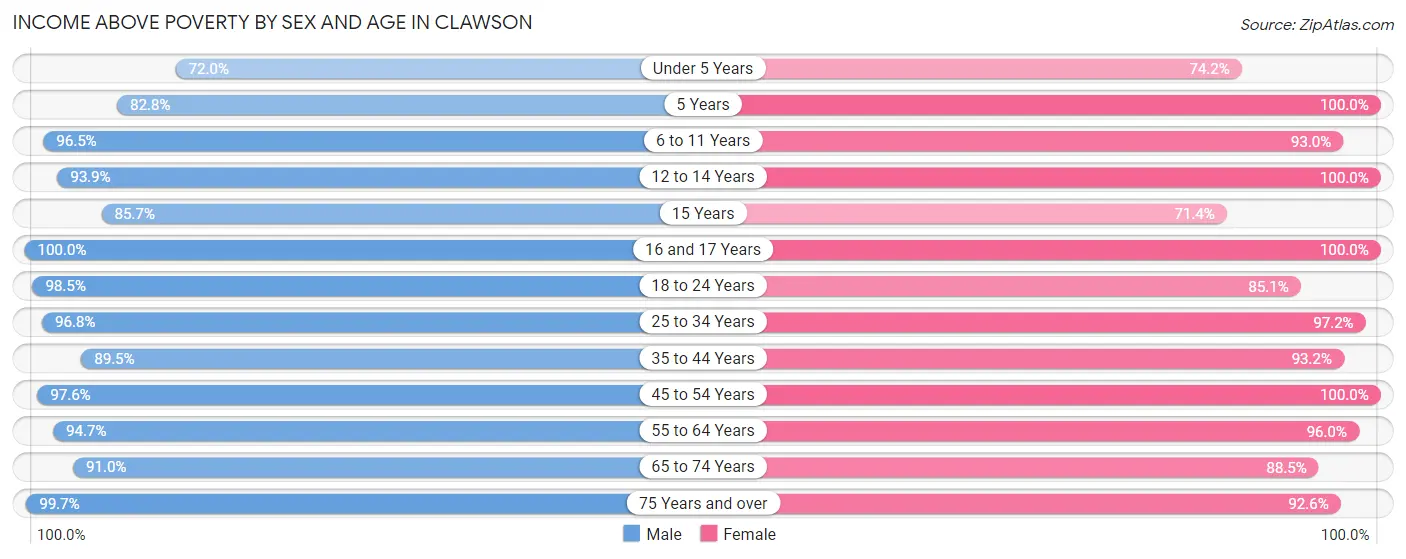
| Age Bracket | Male | Female |
| Under 5 Years | 172 (72.0%) | 69 (74.2%) |
| 5 Years | 82 (82.8%) | 6 (100.0%) |
| 6 to 11 Years | 331 (96.5%) | 254 (93.0%) |
| 12 to 14 Years | 139 (93.9%) | 144 (100.0%) |
| 15 Years | 54 (85.7%) | 40 (71.4%) |
| 16 and 17 Years | 98 (100.0%) | 76 (100.0%) |
| 18 to 24 Years | 334 (98.5%) | 252 (85.1%) |
| 25 to 34 Years | 1,131 (96.8%) | 1,141 (97.2%) |
| 35 to 44 Years | 806 (89.5%) | 613 (93.2%) |
| 45 to 54 Years | 533 (97.6%) | 601 (100.0%) |
| 55 to 64 Years | 876 (94.7%) | 852 (96.0%) |
| 65 to 74 Years | 565 (91.0%) | 716 (88.5%) |
| 75 Years and over | 315 (99.7%) | 361 (92.6%) |
| Total | 5,436 (93.6%) | 5,125 (93.8%) |
Income Below Poverty Among Married-Couple Families in Clawson
The poverty statistics for married-couple families in Clawson show that 1.7% or 37 of the total 2,148 families live below the poverty line. Families with 1 or 2 children have the highest poverty rate of 4.0%, comprising of 23 families. On the other hand, families with 3 or 4 children have the lowest poverty rate of 0.0%, which includes 0 families.
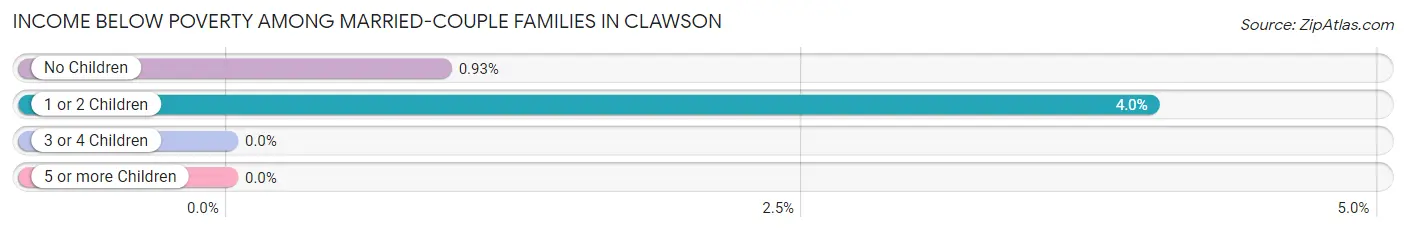
| Children | Above Poverty | Below Poverty |
| No Children | 1,498 (99.1%) | 14 (0.9%) |
| 1 or 2 Children | 551 (96.0%) | 23 (4.0%) |
| 3 or 4 Children | 62 (100.0%) | 0 (0.0%) |
| 5 or more Children | 0 (0.0%) | 0 (0.0%) |
| Total | 2,111 (98.3%) | 37 (1.7%) |
Income Below Poverty Among Single-Parent Households in Clawson
According to the poverty data in Clawson, 1.9% or 4 single-father households and 6.9% or 34 single-mother households are living below the poverty line. Among single-father households, those with 3 or 4 children have the highest poverty rate, with 4 households (100.0%) experiencing poverty. Likewise, among single-mother households, those with 3 or 4 children have the highest poverty rate, with 21 households (100.0%) falling below the poverty line.
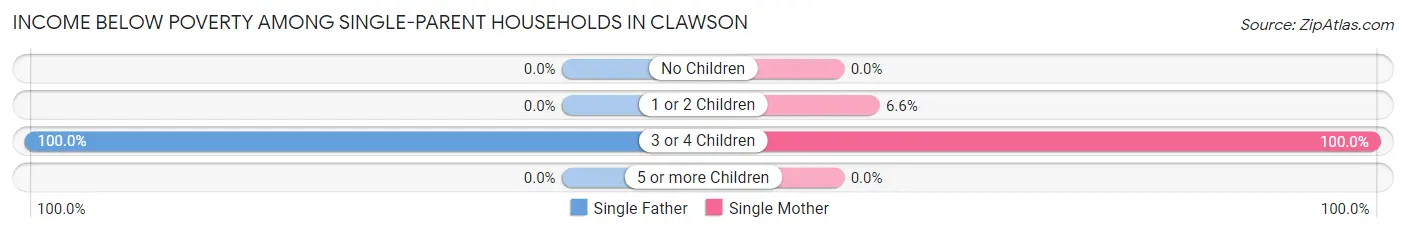
| Children | Single Father | Single Mother |
| No Children | 0 (0.0%) | 0 (0.0%) |
| 1 or 2 Children | 0 (0.0%) | 13 (6.6%) |
| 3 or 4 Children | 4 (100.0%) | 21 (100.0%) |
| 5 or more Children | 0 (0.0%) | 0 (0.0%) |
| Total | 4 (1.9%) | 34 (6.9%) |
Income Below Poverty Among Married-Couple vs Single-Parent Households in Clawson
The poverty data for Clawson shows that 37 of the married-couple family households (1.7%) and 38 of the single-parent households (5.4%) are living below the poverty level. Within the married-couple family households, those with 1 or 2 children have the highest poverty rate, with 23 households (4.0%) falling below the poverty line. Among the single-parent households, those with 3 or 4 children have the highest poverty rate, with 25 household (100.0%) living below poverty.
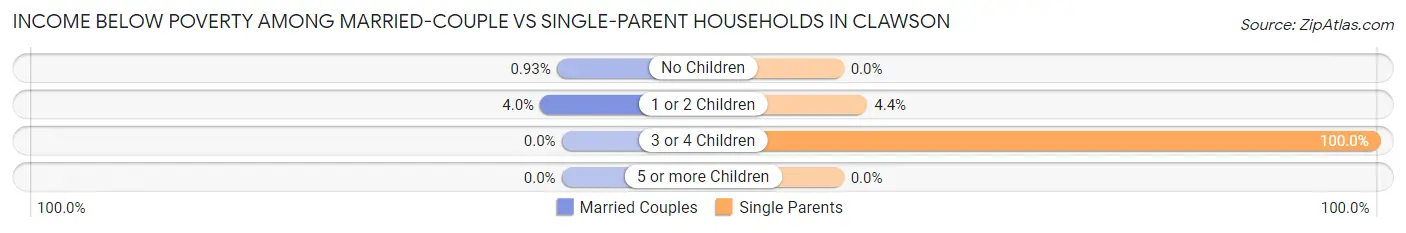
| Children | Married-Couple Families | Single-Parent Households |
| No Children | 14 (0.9%) | 0 (0.0%) |
| 1 or 2 Children | 23 (4.0%) | 13 (4.4%) |
| 3 or 4 Children | 0 (0.0%) | 25 (100.0%) |
| 5 or more Children | 0 (0.0%) | 0 (0.0%) |
| Total | 37 (1.7%) | 38 (5.4%) |
Race in Clawson
The most populous races in Clawson are White / Caucasian (10,429 | 91.6%), Two or more Races (531 | 4.7%), and Hispanic or Latino (277 | 2.4%).
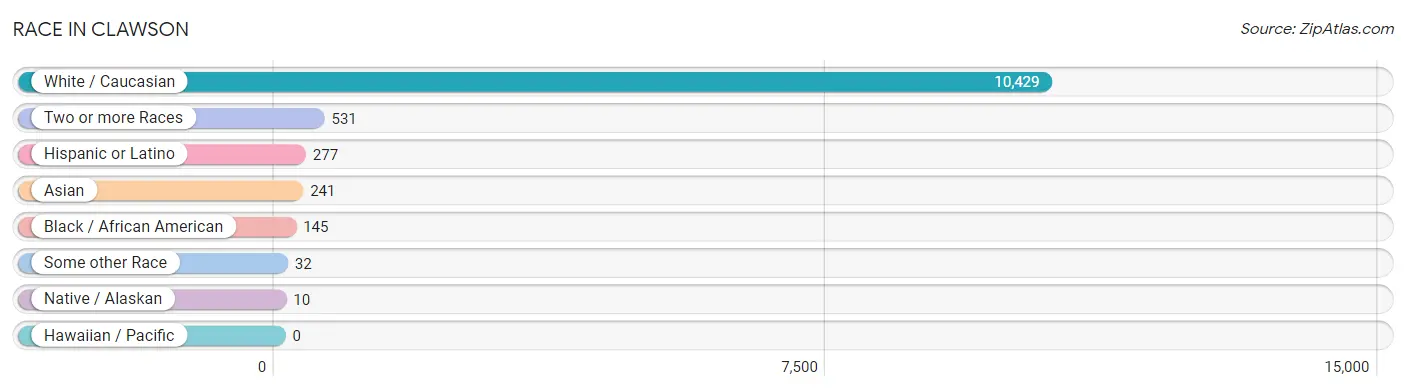
| Race | # Population | % Population |
| Asian | 241 | 2.1% |
| Black / African American | 145 | 1.3% |
| Hawaiian / Pacific | 0 | 0.0% |
| Hispanic or Latino | 277 | 2.4% |
| Native / Alaskan | 10 | 0.1% |
| White / Caucasian | 10,429 | 91.6% |
| Two or more Races | 531 | 4.7% |
| Some other Race | 32 | 0.3% |
| Total | 11,388 | 100.0% |
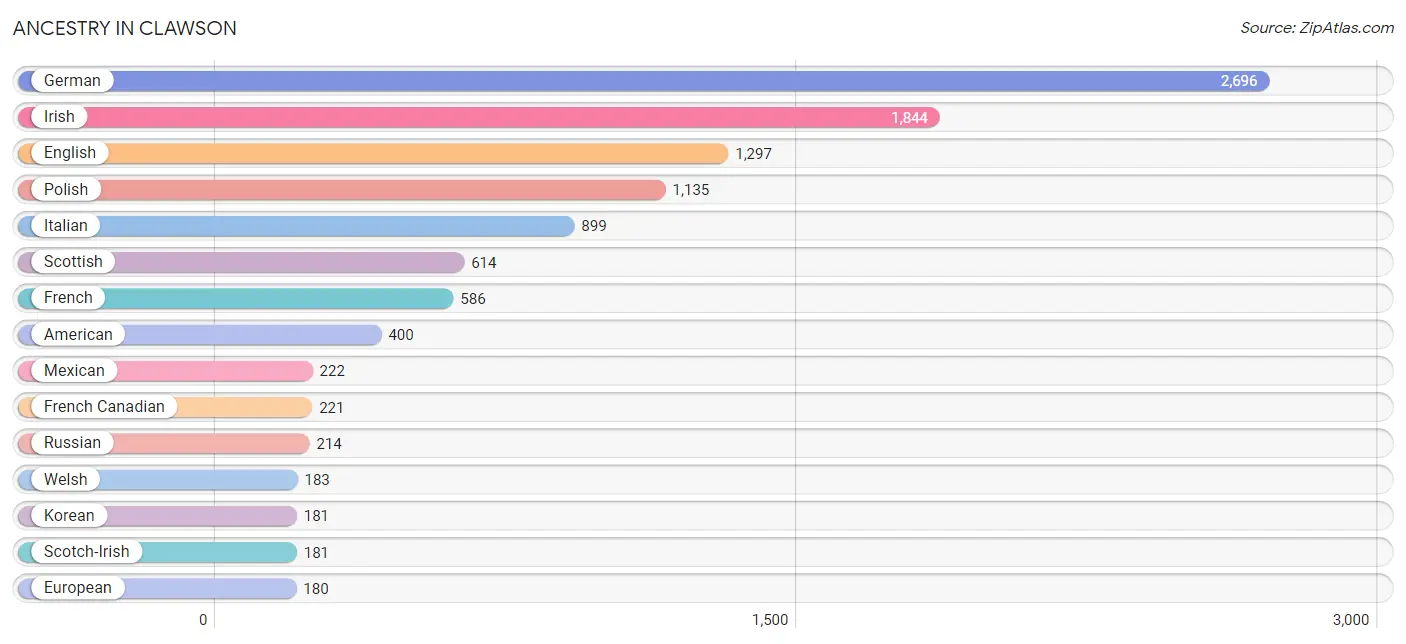
Ancestry in Clawson
The most populous ancestries reported in Clawson are German (2,696 | 23.7%), Irish (1,844 | 16.2%), English (1,297 | 11.4%), Polish (1,135 | 10.0%), and Italian (899 | 7.9%), together accounting for 69.1% of all Clawson residents.
| Ancestry | # Population | % Population |
| Albanian | 173 | 1.5% |
| American | 400 | 3.5% |
| Arab | 172 | 1.5% |
| Armenian | 20 | 0.2% |
| Assyrian / Chaldean / Syriac | 57 | 0.5% |
| Australian | 6 | 0.1% |
| Austrian | 10 | 0.1% |
| Belgian | 38 | 0.3% |
| Bhutanese | 54 | 0.5% |
| Brazilian | 10 | 0.1% |
| British | 55 | 0.5% |
| Burmese | 11 | 0.1% |
| Canadian | 88 | 0.8% |
| Carpatho Rusyn | 24 | 0.2% |
| Central American | 7 | 0.1% |
| Cherokee | 13 | 0.1% |
| Chippewa | 34 | 0.3% |
| Colombian | 10 | 0.1% |
| Croatian | 18 | 0.2% |
| Cuban | 12 | 0.1% |
| Czech | 108 | 0.9% |
| Czechoslovakian | 18 | 0.2% |
| Danish | 27 | 0.2% |
| Dutch | 128 | 1.1% |
| Eastern European | 64 | 0.6% |
| English | 1,297 | 11.4% |
| European | 180 | 1.6% |
| Finnish | 174 | 1.5% |
| French | 586 | 5.1% |
| French Canadian | 221 | 1.9% |
| German | 2,696 | 23.7% |
| Greek | 130 | 1.1% |
| Guamanian / Chamorro | 11 | 0.1% |
| Guatemalan | 7 | 0.1% |
| Haitian | 36 | 0.3% |
| Hungarian | 127 | 1.1% |
| Indian (Asian) | 81 | 0.7% |
| Iraqi | 28 | 0.3% |
| Irish | 1,844 | 16.2% |
| Italian | 899 | 7.9% |
| Korean | 181 | 1.6% |
| Lebanese | 105 | 0.9% |
| Lithuanian | 47 | 0.4% |
| Lumbee | 5 | 0.0% |
| Luxembourger | 6 | 0.1% |
| Macedonian | 12 | 0.1% |
| Maltese | 14 | 0.1% |
| Mexican | 222 | 1.9% |
| Mongolian | 21 | 0.2% |
| Norwegian | 128 | 1.1% |
| Pakistani | 49 | 0.4% |
| Polish | 1,135 | 10.0% |
| Puerto Rican | 16 | 0.1% |
| Romanian | 32 | 0.3% |
| Russian | 214 | 1.9% |
| Scandinavian | 37 | 0.3% |
| Scotch-Irish | 181 | 1.6% |
| Scottish | 614 | 5.4% |
| Serbian | 9 | 0.1% |
| Slovak | 48 | 0.4% |
| South American | 10 | 0.1% |
| Spaniard | 10 | 0.1% |
| Sri Lankan | 71 | 0.6% |
| Swedish | 77 | 0.7% |
| Syrian | 13 | 0.1% |
| Thai | 29 | 0.3% |
| Turkish | 18 | 0.2% |
| Ukrainian | 101 | 0.9% |
| Welsh | 183 | 1.6% | View All 69 Rows |
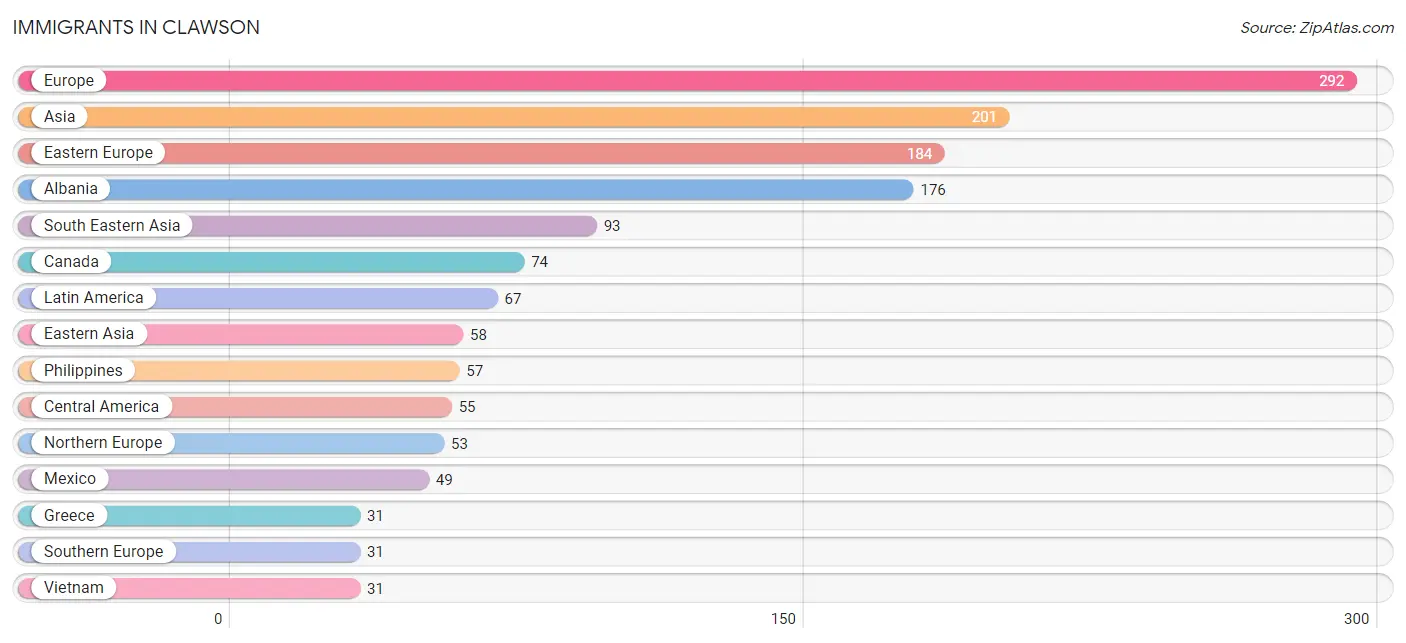
Immigrants in Clawson
The most numerous immigrant groups reported in Clawson came from Europe (292 | 2.6%), Asia (201 | 1.8%), Eastern Europe (184 | 1.6%), Albania (176 | 1.5%), and South Eastern Asia (93 | 0.8%), together accounting for 8.3% of all Clawson residents.
| Immigration Origin | # Population | % Population |
| Albania | 176 | 1.5% |
| Asia | 201 | 1.8% |
| Australia | 6 | 0.1% |
| Canada | 74 | 0.6% |
| Caribbean | 12 | 0.1% |
| Central America | 55 | 0.5% |
| China | 28 | 0.3% |
| Costa Rica | 6 | 0.1% |
| Cuba | 12 | 0.1% |
| Eastern Asia | 58 | 0.5% |
| Eastern Europe | 184 | 1.6% |
| Europe | 292 | 2.6% |
| Germany | 24 | 0.2% |
| Greece | 31 | 0.3% |
| India | 7 | 0.1% |
| Iraq | 15 | 0.1% |
| Japan | 19 | 0.2% |
| Korea | 11 | 0.1% |
| Latin America | 67 | 0.6% |
| Lebanon | 6 | 0.1% |
| Mexico | 49 | 0.4% |
| Northern Europe | 53 | 0.5% |
| Oceania | 6 | 0.1% |
| Pakistan | 22 | 0.2% |
| Philippines | 57 | 0.5% |
| Scotland | 9 | 0.1% |
| South Central Asia | 29 | 0.3% |
| South Eastern Asia | 93 | 0.8% |
| Southern Europe | 31 | 0.3% |
| Thailand | 5 | 0.0% |
| Ukraine | 8 | 0.1% |
| Vietnam | 31 | 0.3% |
| Western Asia | 21 | 0.2% |
| Western Europe | 24 | 0.2% | View All 34 Rows |
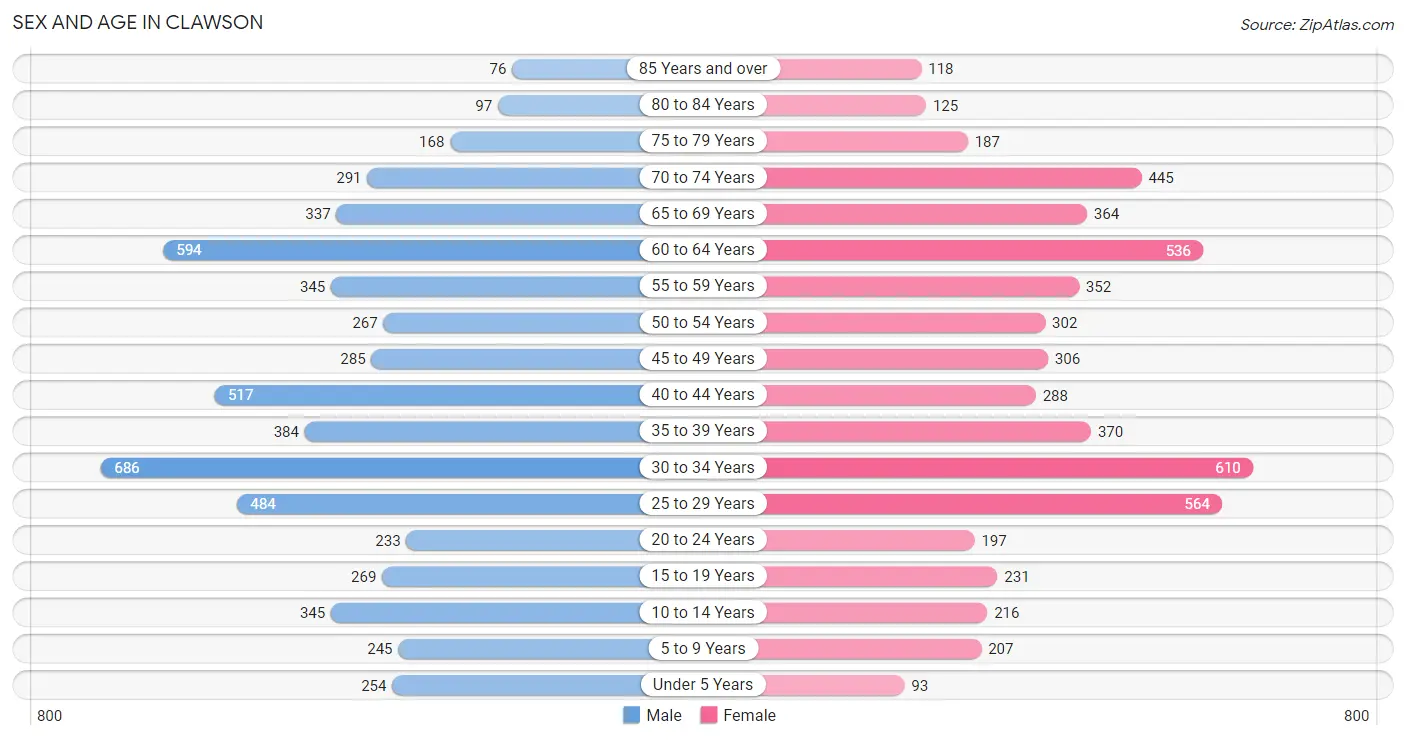
Sex and Age in Clawson
Sex and Age in Clawson
The most populous age groups in Clawson are 30 to 34 Years (686 | 11.7%) for men and 30 to 34 Years (610 | 11.1%) for women.
| Age Bracket | Male | Female |
| Under 5 Years | 254 (4.3%) | 93 (1.7%) |
| 5 to 9 Years | 245 (4.2%) | 207 (3.8%) |
| 10 to 14 Years | 345 (5.9%) | 216 (3.9%) |
| 15 to 19 Years | 269 (4.6%) | 231 (4.2%) |
| 20 to 24 Years | 233 (4.0%) | 197 (3.6%) |
| 25 to 29 Years | 484 (8.2%) | 564 (10.2%) |
| 30 to 34 Years | 686 (11.7%) | 610 (11.1%) |
| 35 to 39 Years | 384 (6.5%) | 370 (6.7%) |
| 40 to 44 Years | 517 (8.8%) | 288 (5.2%) |
| 45 to 49 Years | 285 (4.9%) | 306 (5.6%) |
| 50 to 54 Years | 267 (4.5%) | 302 (5.5%) |
| 55 to 59 Years | 345 (5.9%) | 352 (6.4%) |
| 60 to 64 Years | 594 (10.1%) | 536 (9.7%) |
| 65 to 69 Years | 337 (5.7%) | 364 (6.6%) |
| 70 to 74 Years | 291 (5.0%) | 445 (8.1%) |
| 75 to 79 Years | 168 (2.9%) | 187 (3.4%) |
| 80 to 84 Years | 97 (1.7%) | 125 (2.3%) |
| 85 Years and over | 76 (1.3%) | 118 (2.1%) |
| Total | 5,877 (100.0%) | 5,511 (100.0%) |
Families and Households in Clawson
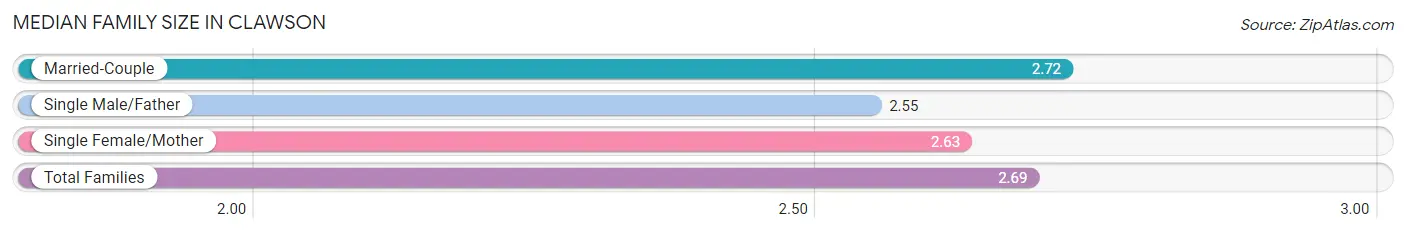
Median Family Size in Clawson
The median family size in Clawson is 2.69 persons per family, with married-couple families (2,148 | 75.2%) accounting for the largest median family size of 2.72 persons per family. On the other hand, single male/father families (214 | 7.5%) represent the smallest median family size with 2.55 persons per family.
| Family Type | # Families | Family Size |
| Married-Couple | 2,148 (75.2%) | 2.72 |
| Single Male/Father | 214 (7.5%) | 2.55 |
| Single Female/Mother | 494 (17.3%) | 2.63 |
| Total Families | 2,856 (100.0%) | 2.69 |
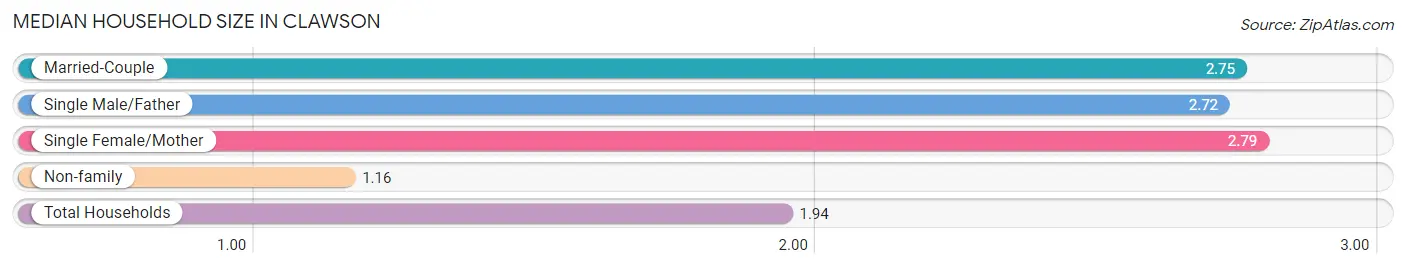
Median Household Size in Clawson
The median household size in Clawson is 1.94 persons per household, with single female/mother households (494 | 8.5%) accounting for the largest median household size of 2.79 persons per household. non-family households (2,950 | 50.8%) represent the smallest median household size with 1.16 persons per household.
| Household Type | # Households | Household Size |
| Married-Couple | 2,148 (37.0%) | 2.75 |
| Single Male/Father | 214 (3.7%) | 2.72 |
| Single Female/Mother | 494 (8.5%) | 2.79 |
| Non-family | 2,950 (50.8%) | 1.16 |
| Total Households | 5,806 (100.0%) | 1.94 |
Household Size by Marriage Status in Clawson
Out of a total of 5,806 households in Clawson, 2,856 (49.2%) are family households, while 2,950 (50.8%) are nonfamily households. The most numerous type of family households are 2-person households, comprising 1,690, and the most common type of nonfamily households are 1-person households, comprising 2,500.
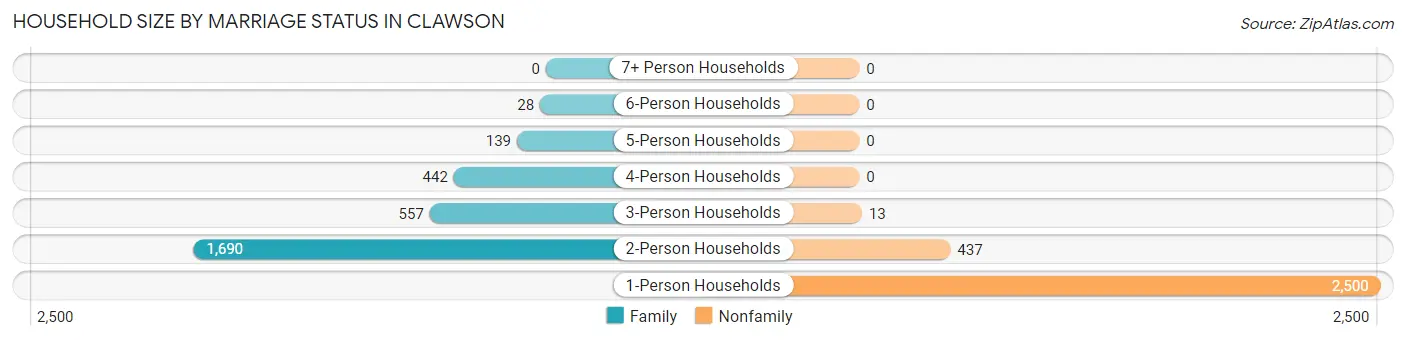
| Household Size | Family Households | Nonfamily Households |
| 1-Person Households | - | 2,500 (43.1%) |
| 2-Person Households | 1,690 (29.1%) | 437 (7.5%) |
| 3-Person Households | 557 (9.6%) | 13 (0.2%) |
| 4-Person Households | 442 (7.6%) | 0 (0.0%) |
| 5-Person Households | 139 (2.4%) | 0 (0.0%) |
| 6-Person Households | 28 (0.5%) | 0 (0.0%) |
| 7+ Person Households | 0 (0.0%) | 0 (0.0%) |
| Total | 2,856 (49.2%) | 2,950 (50.8%) |
Female Fertility in Clawson
Fertility by Age in Clawson
Average fertility rate in Clawson is 31.0 births per 1,000 women. Women in the age bracket of 20 to 34 years have the highest fertility rate with 35.0 births per 1,000 women. Women in the age bracket of 20 to 34 years acount for 59.3% of all women with births.
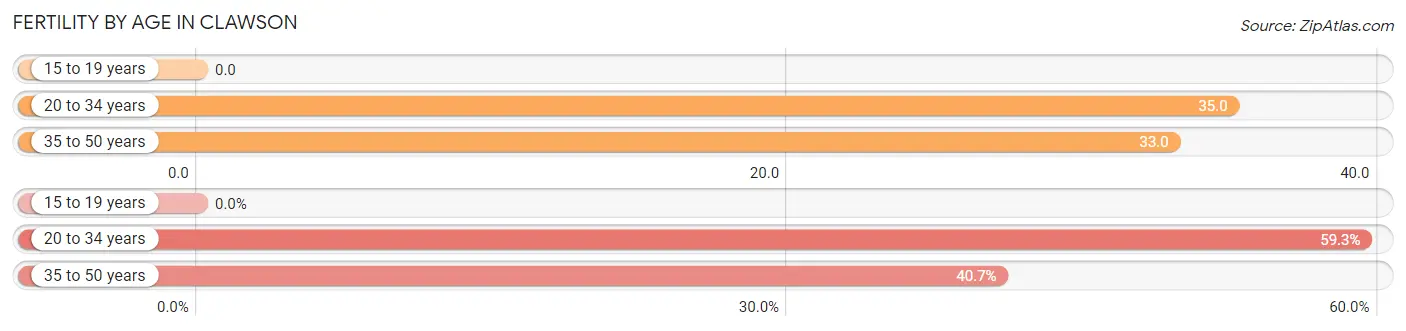
| Age Bracket | Women with Births | Births / 1,000 Women |
| 15 to 19 years | 0 (0.0%) | 0.0 |
| 20 to 34 years | 48 (59.3%) | 35.0 |
| 35 to 50 years | 33 (40.7%) | 33.0 |
| Total | 81 (100.0%) | 31.0 |
Fertility by Age by Marriage Status in Clawson
91.4% of women with births (81) in Clawson are married. The highest percentage of unmarried women with births falls into 20 to 34 years age bracket with 14.6% of them unmarried at the time of birth, while the lowest percentage of unmarried women with births belong to 35 to 50 years age bracket with 0.0% of them unmarried.
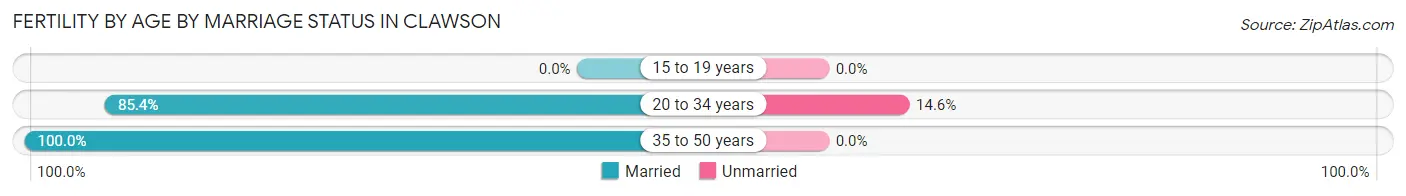
| Age Bracket | Married | Unmarried |
| 15 to 19 years | 0 (0.0%) | 0 (0.0%) |
| 20 to 34 years | 41 (85.4%) | 7 (14.6%) |
| 35 to 50 years | 33 (100.0%) | 0 (0.0%) |
| Total | 74 (91.4%) | 7 (8.6%) |
Fertility by Education in Clawson
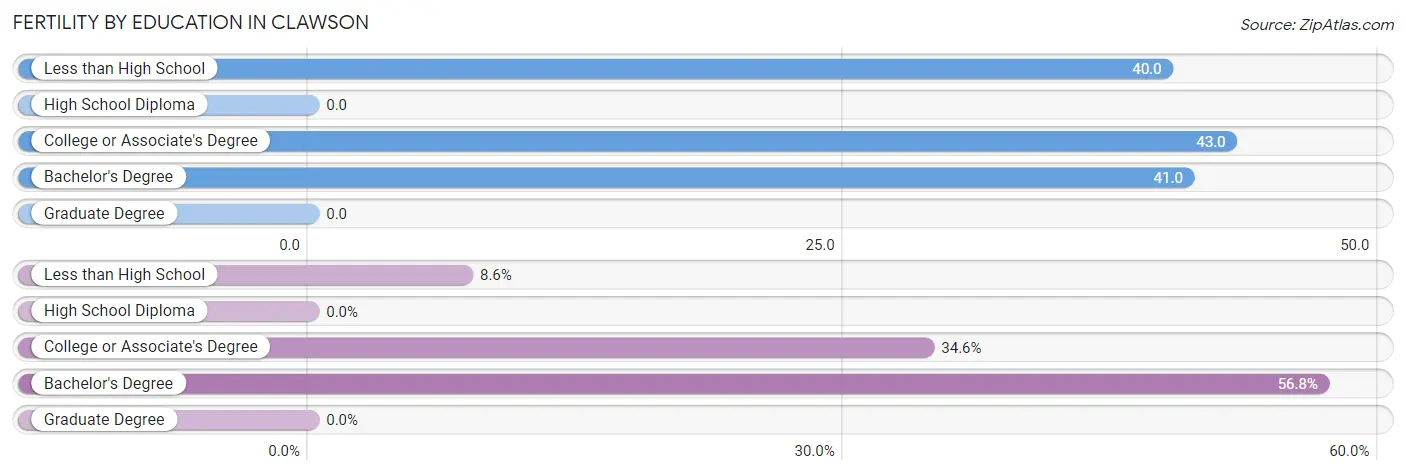
| Educational Attainment | Women with Births | Births / 1,000 Women |
| Less than High School | 7 (8.6%) | 40.0 |
| High School Diploma | 0 (0.0%) | 0.0 |
| College or Associate's Degree | 28 (34.6%) | 43.0 |
| Bachelor's Degree | 46 (56.8%) | 41.0 |
| Graduate Degree | 0 (0.0%) | 0.0 |
| Total | 81 (100.0%) | 31.0 |
Fertility by Education by Marriage Status in Clawson
8.6% of women with births in Clawson are unmarried. Women with the educational attainment of college or associate's degree are most likely to be married with 100.0% of them married at childbirth, while women with the educational attainment of less than high school are least likely to be married with 100.0% of them unmarried at childbirth.
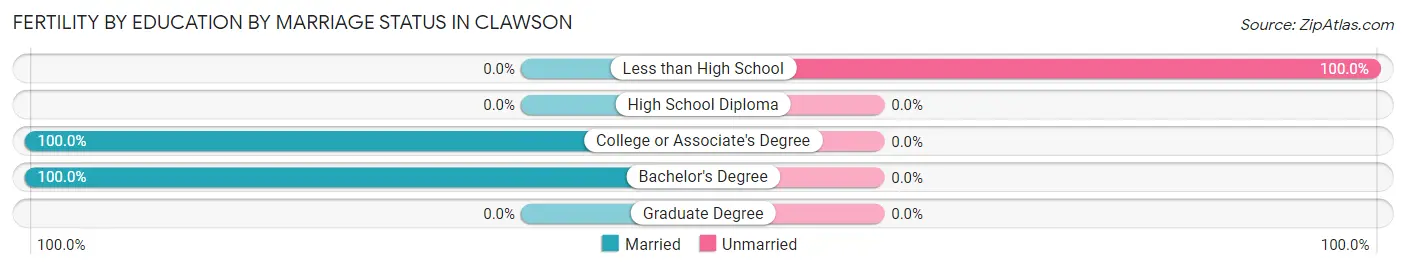
| Educational Attainment | Married | Unmarried |
| Less than High School | 0 (0.0%) | 7 (100.0%) |
| High School Diploma | 0 (0.0%) | 0 (0.0%) |
| College or Associate's Degree | 28 (100.0%) | 0 (0.0%) |
| Bachelor's Degree | 46 (100.0%) | 0 (0.0%) |
| Graduate Degree | 0 (0.0%) | 0 (0.0%) |
| Total | 74 (91.4%) | 7 (8.6%) |
Employment Characteristics in Clawson
Employment by Class of Employer in Clawson
Among the 6,474 employed individuals in Clawson, private company employees (4,711 | 72.8%), not-for-profit organizations (611 | 9.4%), and local government employees (503 | 7.8%) make up the most common classes of employment.
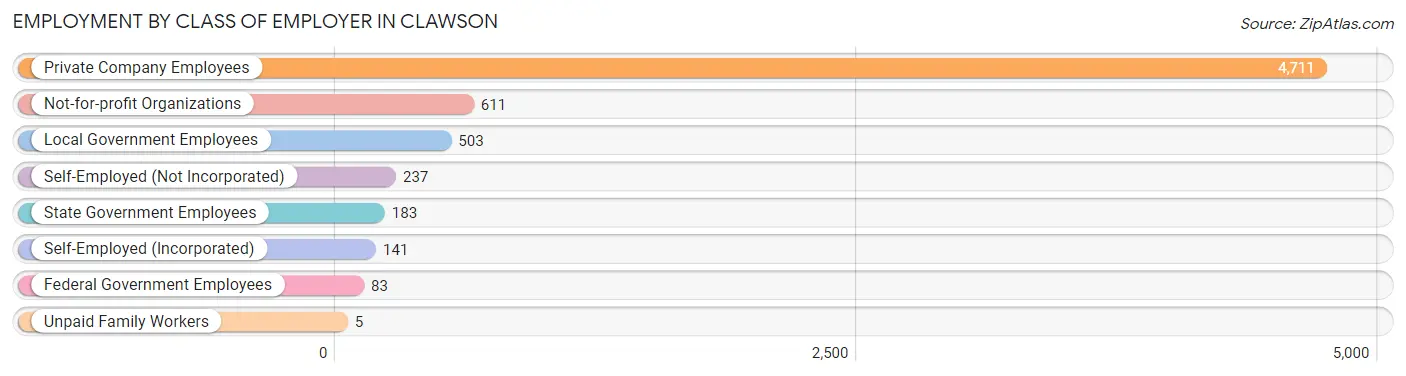
| Employer Class | # Employees | % Employees |
| Private Company Employees | 4,711 | 72.8% |
| Self-Employed (Incorporated) | 141 | 2.2% |
| Self-Employed (Not Incorporated) | 237 | 3.7% |
| Not-for-profit Organizations | 611 | 9.4% |
| Local Government Employees | 503 | 7.8% |
| State Government Employees | 183 | 2.8% |
| Federal Government Employees | 83 | 1.3% |
| Unpaid Family Workers | 5 | 0.1% |
| Total | 6,474 | 100.0% |
Employment Status by Age in Clawson
According to the labor force statistics for Clawson, out of the total population over 16 years of age (9,908), 69.3% or 6,866 individuals are in the labor force, with 4.2% or 288 of them unemployed. The age group with the highest labor force participation rate is 20 to 24 years, with 99.8% or 429 individuals in the labor force. Within the labor force, the 16 to 19 years age range has the highest percentage of unemployed individuals, with 25.8% or 48 of them being unemployed.
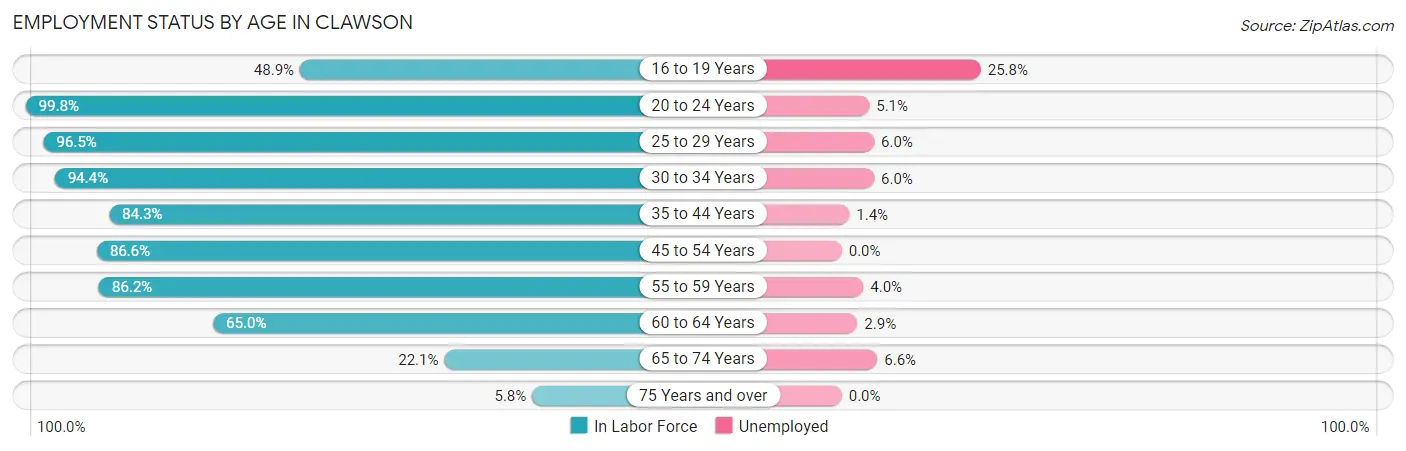
| Age Bracket | In Labor Force | Unemployed |
| 16 to 19 Years | 186 (48.9%) | 48 (25.8%) |
| 20 to 24 Years | 429 (99.8%) | 22 (5.1%) |
| 25 to 29 Years | 1,011 (96.5%) | 61 (6.0%) |
| 30 to 34 Years | 1,223 (94.4%) | 73 (6.0%) |
| 35 to 44 Years | 1,314 (84.3%) | 18 (1.4%) |
| 45 to 54 Years | 1,005 (86.6%) | 0 (0.0%) |
| 55 to 59 Years | 601 (86.2%) | 24 (4.0%) |
| 60 to 64 Years | 734 (65.0%) | 21 (2.9%) |
| 65 to 74 Years | 318 (22.1%) | 21 (6.6%) |
| 75 Years and over | 45 (5.8%) | 0 (0.0%) |
| Total | 6,866 (69.3%) | 288 (4.2%) |
Employment Status by Educational Attainment in Clawson
According to labor force statistics for Clawson, 85.5% of individuals (5,891) out of the total population between 25 and 64 years of age (6,890) are in the labor force, with 3.4% or 200 of them being unemployed. The group with the highest labor force participation rate are those with the educational attainment of bachelor's degree or higher, with 96.1% or 3,401 individuals in the labor force. Within the labor force, individuals with less than high school education have the highest percentage of unemployment, with 33.1% or 51 of them being unemployed.
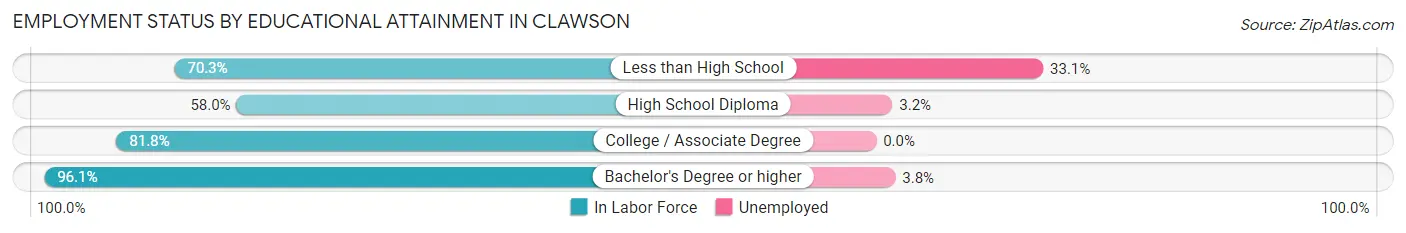
| Educational Attainment | In Labor Force | Unemployed |
| Less than High School | 154 (70.3%) | 72 (33.1%) |
| High School Diploma | 555 (58.0%) | 31 (3.2%) |
| College / Associate Degree | 1,779 (81.8%) | 0 (0.0%) |
| Bachelor's Degree or higher | 3,401 (96.1%) | 134 (3.8%) |
| Total | 5,891 (85.5%) | 234 (3.4%) |
Employment Occupations by Sex in Clawson
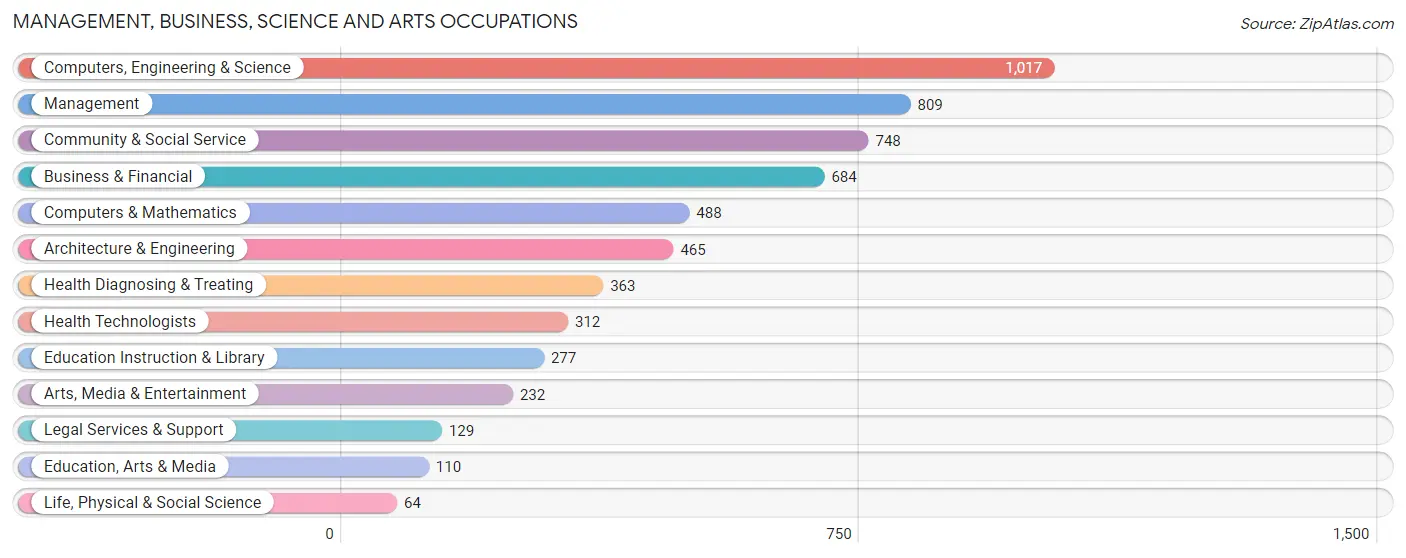
Management, Business, Science and Arts Occupations
The most common Management, Business, Science and Arts occupations in Clawson are Computers, Engineering & Science (1,017 | 15.5%), Management (809 | 12.3%), Community & Social Service (748 | 11.4%), Business & Financial (684 | 10.4%), and Computers & Mathematics (488 | 7.4%).
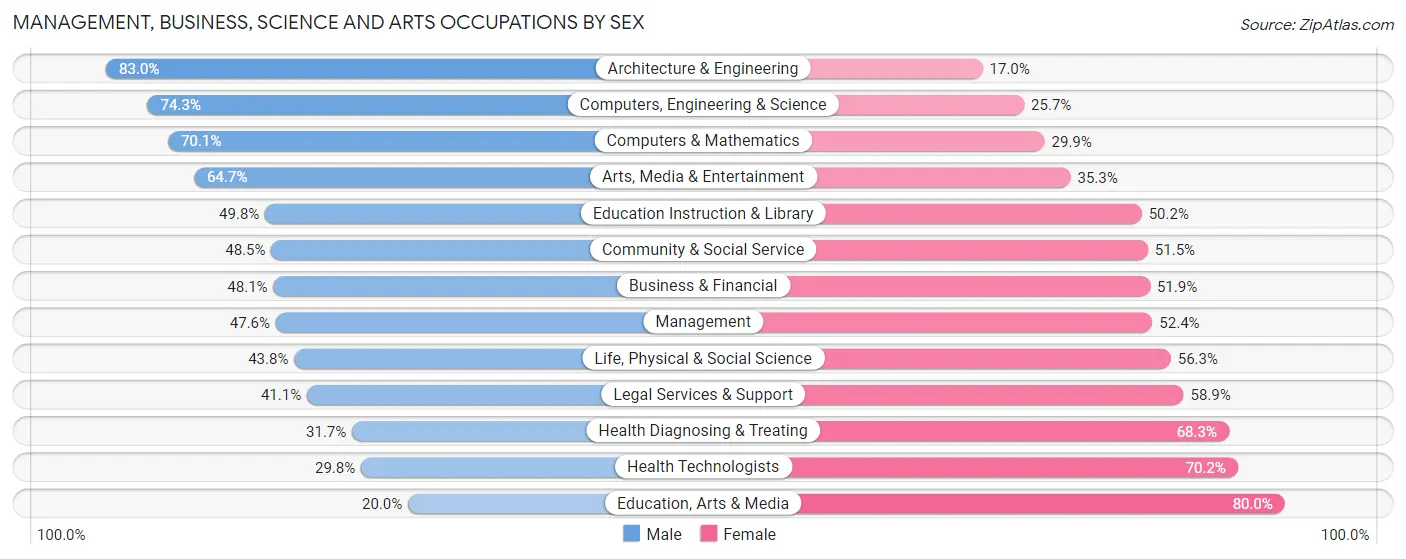
Management, Business, Science and Arts Occupations by Sex
Within the Management, Business, Science and Arts occupations in Clawson, the most male-oriented occupations are Architecture & Engineering (83.0%), Computers, Engineering & Science (74.3%), and Computers & Mathematics (70.1%), while the most female-oriented occupations are Education, Arts & Media (80.0%), Health Technologists (70.2%), and Health Diagnosing & Treating (68.3%).
| Occupation | Male | Female |
| Management | 385 (47.6%) | 424 (52.4%) |
| Business & Financial | 329 (48.1%) | 355 (51.9%) |
| Computers, Engineering & Science | 756 (74.3%) | 261 (25.7%) |
| Computers & Mathematics | 342 (70.1%) | 146 (29.9%) |
| Architecture & Engineering | 386 (83.0%) | 79 (17.0%) |
| Life, Physical & Social Science | 28 (43.8%) | 36 (56.2%) |
| Community & Social Service | 363 (48.5%) | 385 (51.5%) |
| Education, Arts & Media | 22 (20.0%) | 88 (80.0%) |
| Legal Services & Support | 53 (41.1%) | 76 (58.9%) |
| Education Instruction & Library | 138 (49.8%) | 139 (50.2%) |
| Arts, Media & Entertainment | 150 (64.7%) | 82 (35.3%) |
| Health Diagnosing & Treating | 115 (31.7%) | 248 (68.3%) |
| Health Technologists | 93 (29.8%) | 219 (70.2%) |
| Total (Category) | 1,948 (53.8%) | 1,673 (46.2%) |
| Total (Overall) | 3,560 (54.1%) | 3,017 (45.9%) |
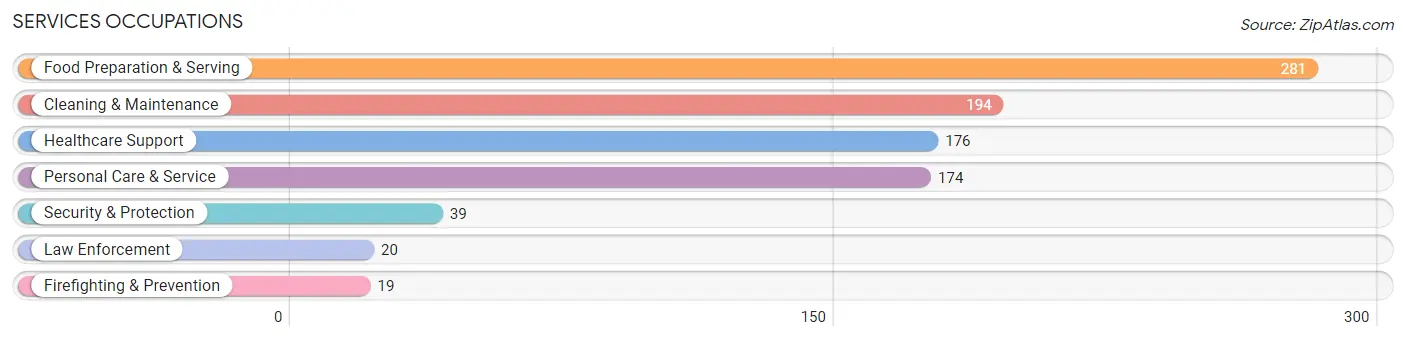
Services Occupations
The most common Services occupations in Clawson are Food Preparation & Serving (281 | 4.3%), Cleaning & Maintenance (194 | 2.9%), Healthcare Support (176 | 2.7%), Personal Care & Service (174 | 2.6%), and Security & Protection (39 | 0.6%).
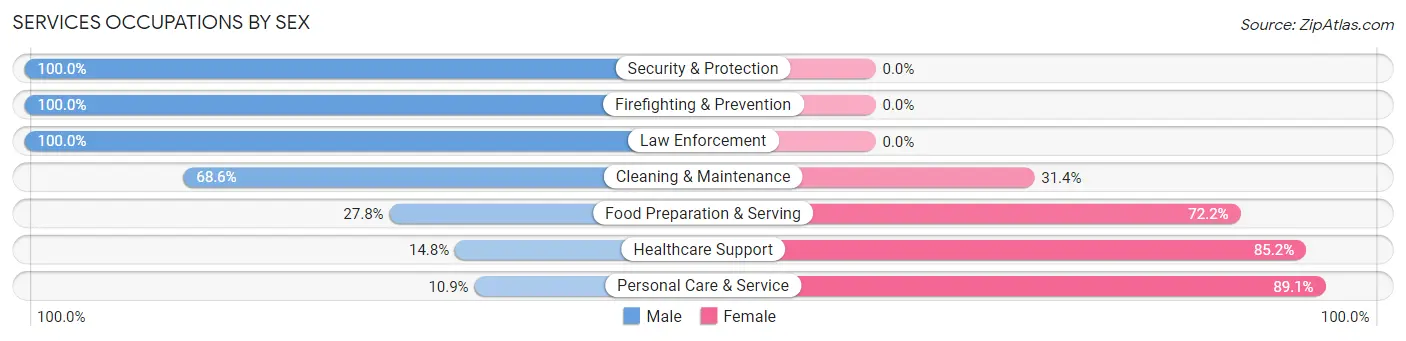
Services Occupations by Sex
Within the Services occupations in Clawson, the most male-oriented occupations are Security & Protection (100.0%), Firefighting & Prevention (100.0%), and Law Enforcement (100.0%), while the most female-oriented occupations are Personal Care & Service (89.1%), Healthcare Support (85.2%), and Food Preparation & Serving (72.2%).
| Occupation | Male | Female |
| Healthcare Support | 26 (14.8%) | 150 (85.2%) |
| Security & Protection | 39 (100.0%) | 0 (0.0%) |
| Firefighting & Prevention | 19 (100.0%) | 0 (0.0%) |
| Law Enforcement | 20 (100.0%) | 0 (0.0%) |
| Food Preparation & Serving | 78 (27.8%) | 203 (72.2%) |
| Cleaning & Maintenance | 133 (68.6%) | 61 (31.4%) |
| Personal Care & Service | 19 (10.9%) | 155 (89.1%) |
| Total (Category) | 295 (34.1%) | 569 (65.9%) |
| Total (Overall) | 3,560 (54.1%) | 3,017 (45.9%) |
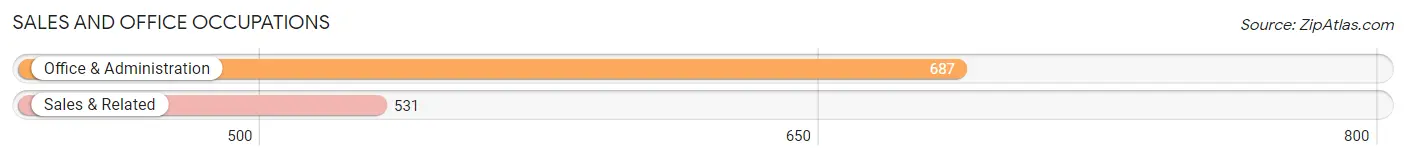
Sales and Office Occupations
The most common Sales and Office occupations in Clawson are Office & Administration (687 | 10.4%), and Sales & Related (531 | 8.1%).
Sales and Office Occupations by Sex
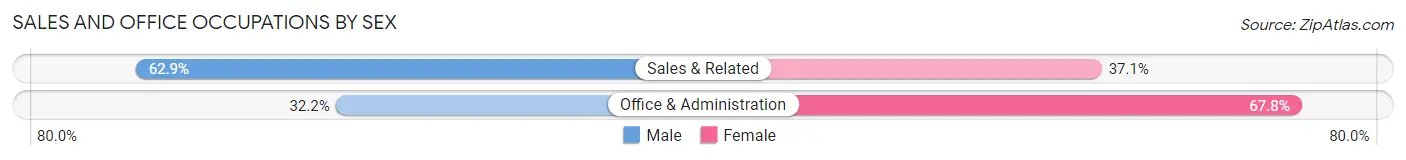
| Occupation | Male | Female |
| Sales & Related | 334 (62.9%) | 197 (37.1%) |
| Office & Administration | 221 (32.2%) | 466 (67.8%) |
| Total (Category) | 555 (45.6%) | 663 (54.4%) |
| Total (Overall) | 3,560 (54.1%) | 3,017 (45.9%) |
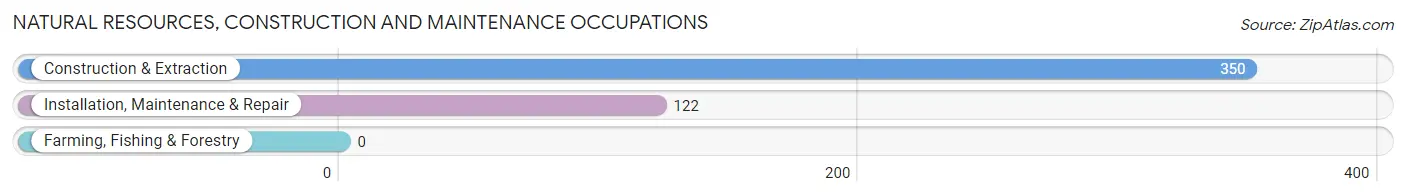
Natural Resources, Construction and Maintenance Occupations
The most common Natural Resources, Construction and Maintenance occupations in Clawson are Construction & Extraction (350 | 5.3%), and Installation, Maintenance & Repair (122 | 1.8%).
Natural Resources, Construction and Maintenance Occupations by Sex
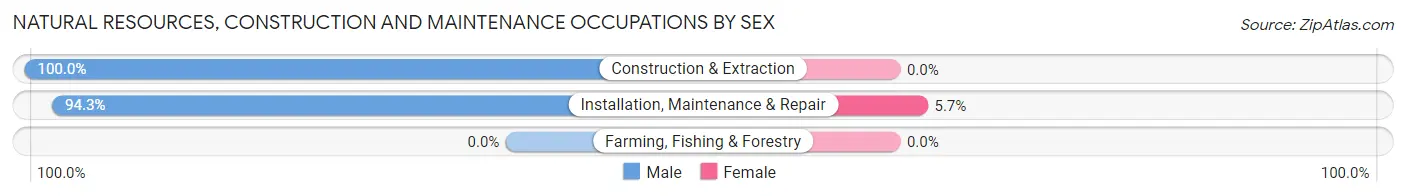
| Occupation | Male | Female |
| Farming, Fishing & Forestry | 0 (0.0%) | 0 (0.0%) |
| Construction & Extraction | 350 (100.0%) | 0 (0.0%) |
| Installation, Maintenance & Repair | 115 (94.3%) | 7 (5.7%) |
| Total (Category) | 465 (98.5%) | 7 (1.5%) |
| Total (Overall) | 3,560 (54.1%) | 3,017 (45.9%) |
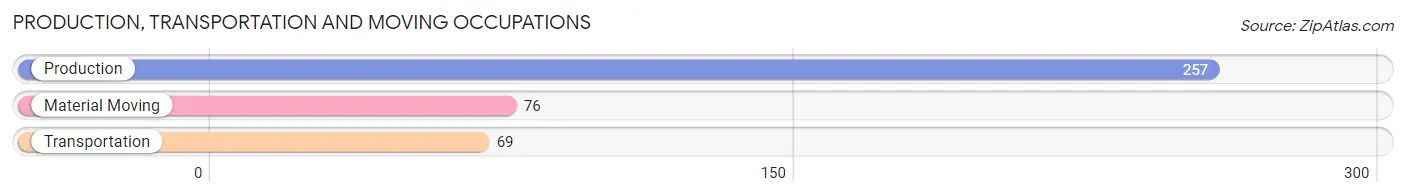
Production, Transportation and Moving Occupations
The most common Production, Transportation and Moving occupations in Clawson are Production (257 | 3.9%), Material Moving (76 | 1.2%), and Transportation (69 | 1.1%).
Production, Transportation and Moving Occupations by Sex
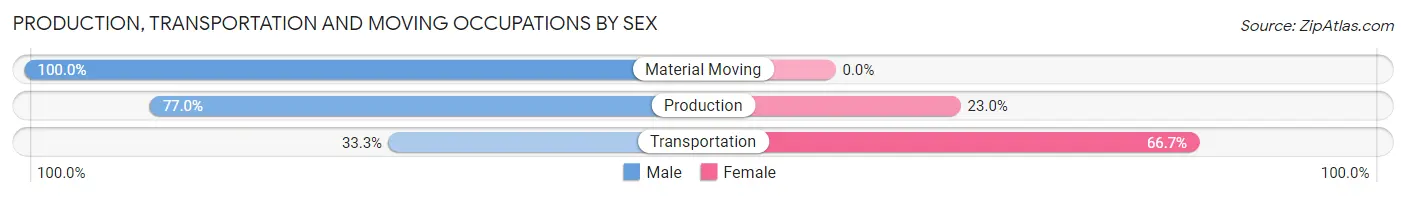
| Occupation | Male | Female |
| Production | 198 (77.0%) | 59 (23.0%) |
| Transportation | 23 (33.3%) | 46 (66.7%) |
| Material Moving | 76 (100.0%) | 0 (0.0%) |
| Total (Category) | 297 (73.9%) | 105 (26.1%) |
| Total (Overall) | 3,560 (54.1%) | 3,017 (45.9%) |
Employment Industries by Sex in Clawson
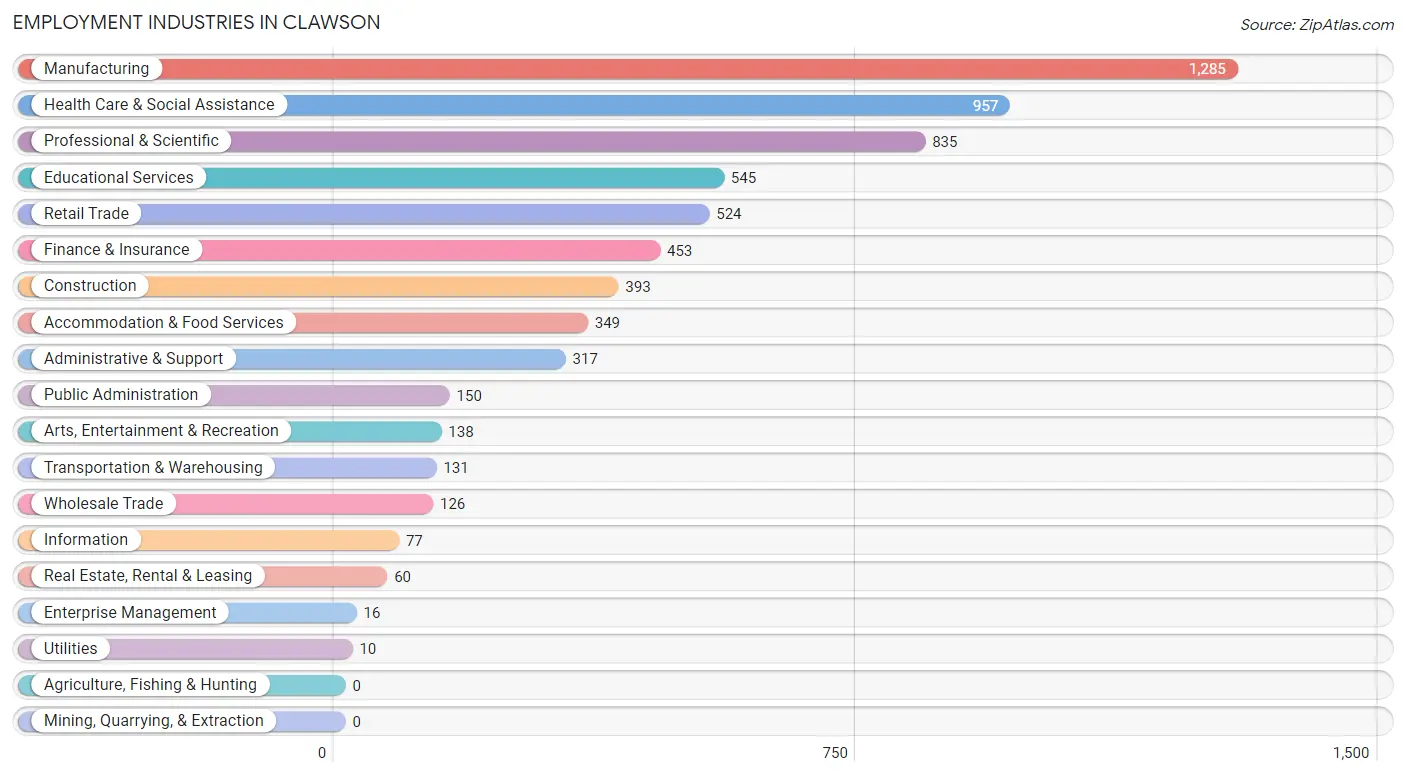
Employment Industries in Clawson
The major employment industries in Clawson include Manufacturing (1,285 | 19.5%), Health Care & Social Assistance (957 | 14.5%), Professional & Scientific (835 | 12.7%), Educational Services (545 | 8.3%), and Retail Trade (524 | 8.0%).
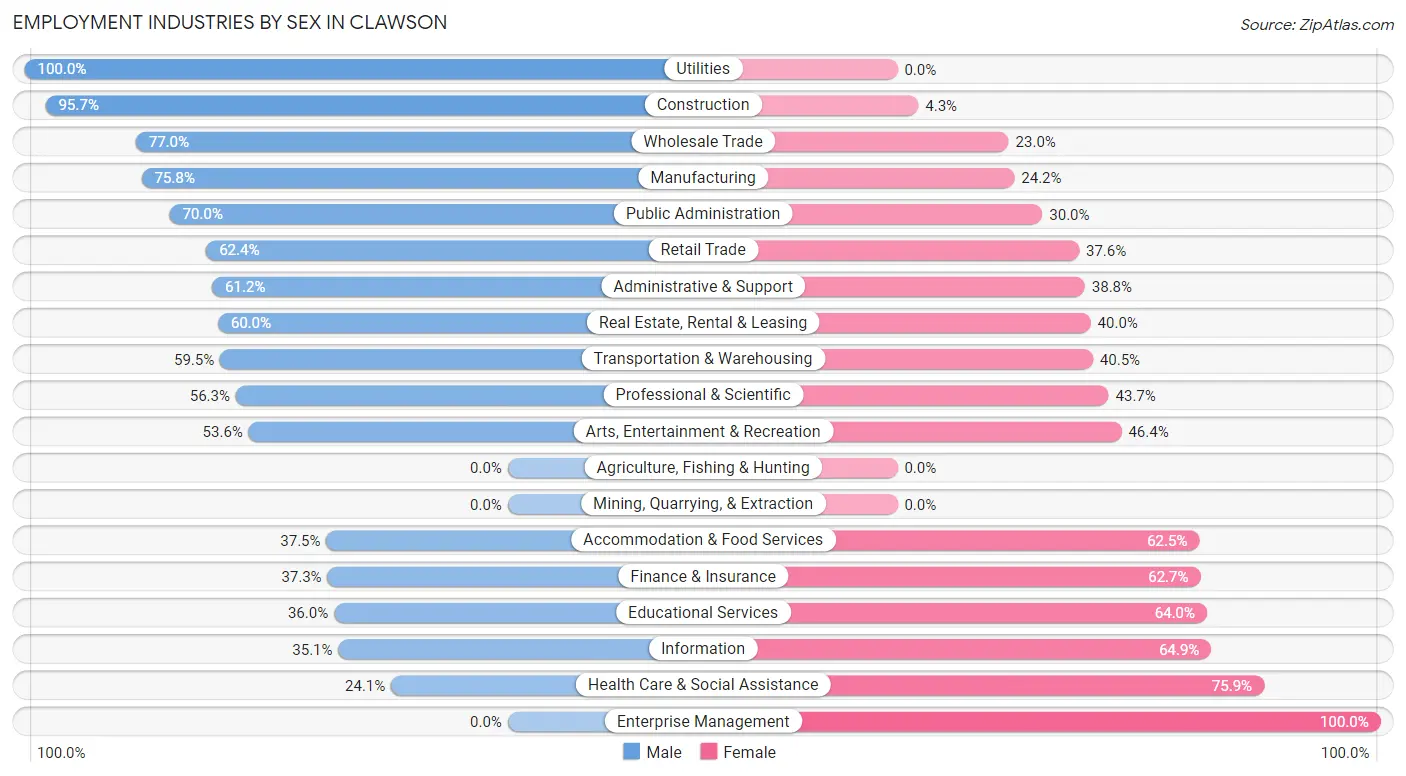
Employment Industries by Sex in Clawson
The Clawson industries that see more men than women are Utilities (100.0%), Construction (95.7%), and Wholesale Trade (77.0%), whereas the industries that tend to have a higher number of women are Enterprise Management (100.0%), Health Care & Social Assistance (75.9%), and Information (64.9%).
| Industry | Male | Female |
| Agriculture, Fishing & Hunting | 0 (0.0%) | 0 (0.0%) |
| Mining, Quarrying, & Extraction | 0 (0.0%) | 0 (0.0%) |
| Construction | 376 (95.7%) | 17 (4.3%) |
| Manufacturing | 974 (75.8%) | 311 (24.2%) |
| Wholesale Trade | 97 (77.0%) | 29 (23.0%) |
| Retail Trade | 327 (62.4%) | 197 (37.6%) |
| Transportation & Warehousing | 78 (59.5%) | 53 (40.5%) |
| Utilities | 10 (100.0%) | 0 (0.0%) |
| Information | 27 (35.1%) | 50 (64.9%) |
| Finance & Insurance | 169 (37.3%) | 284 (62.7%) |
| Real Estate, Rental & Leasing | 36 (60.0%) | 24 (40.0%) |
| Professional & Scientific | 470 (56.3%) | 365 (43.7%) |
| Enterprise Management | 0 (0.0%) | 16 (100.0%) |
| Administrative & Support | 194 (61.2%) | 123 (38.8%) |
| Educational Services | 196 (36.0%) | 349 (64.0%) |
| Health Care & Social Assistance | 231 (24.1%) | 726 (75.9%) |
| Arts, Entertainment & Recreation | 74 (53.6%) | 64 (46.4%) |
| Accommodation & Food Services | 131 (37.5%) | 218 (62.5%) |
| Public Administration | 105 (70.0%) | 45 (30.0%) |
| Total | 3,560 (54.1%) | 3,017 (45.9%) |
Education in Clawson
School Enrollment in Clawson
The most common levels of schooling among the 2,011 students in Clawson are high school (444 | 22.1%), middle school (413 | 20.5%), and college / undergraduate (398 | 19.8%).
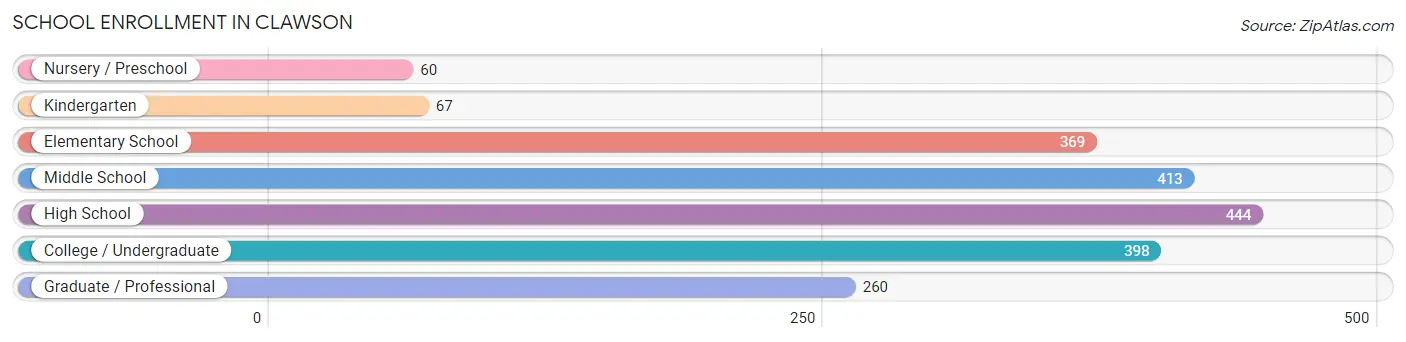
| School Level | # Students | % Students |
| Nursery / Preschool | 60 | 3.0% |
| Kindergarten | 67 | 3.3% |
| Elementary School | 369 | 18.3% |
| Middle School | 413 | 20.5% |
| High School | 444 | 22.1% |
| College / Undergraduate | 398 | 19.8% |
| Graduate / Professional | 260 | 12.9% |
| Total | 2,011 | 100.0% |
School Enrollment by Age by Funding Source in Clawson
Out of a total of 2,011 students who are enrolled in schools in Clawson, 473 (23.5%) attend a private institution, while the remaining 1,538 (76.5%) are enrolled in public schools. The age group of 35 years and over has the highest likelihood of being enrolled in private schools, with 84 (73.7% in the age bracket) enrolled. Conversely, the age group of 5 to 9 year old has the lowest likelihood of being enrolled in a private school, with 350 (90.0% in the age bracket) attending a public institution.
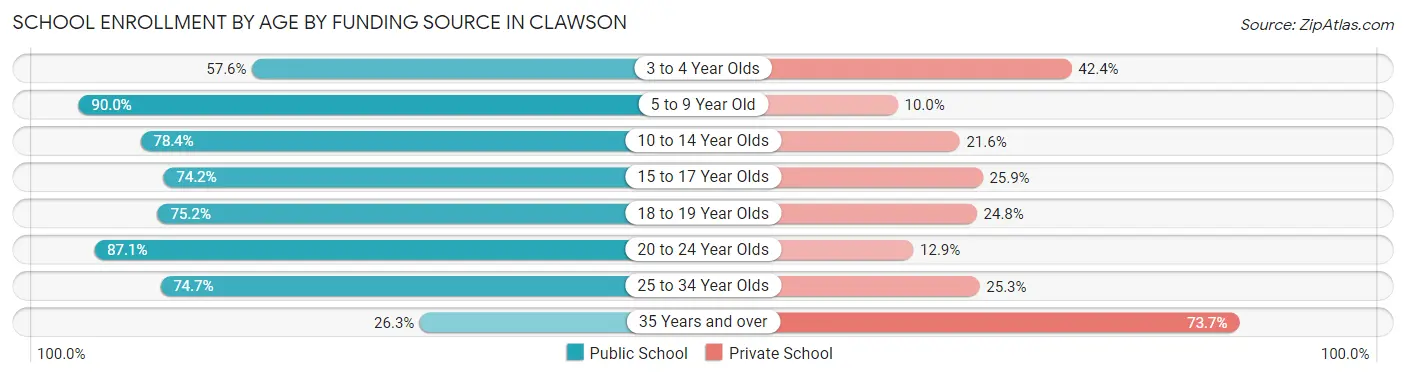
| Age Bracket | Public School | Private School |
| 3 to 4 Year Olds | 19 (57.6%) | 14 (42.4%) |
| 5 to 9 Year Old | 350 (90.0%) | 39 (10.0%) |
| 10 to 14 Year Olds | 440 (78.4%) | 121 (21.6%) |
| 15 to 17 Year Olds | 218 (74.2%) | 76 (25.9%) |
| 18 to 19 Year Olds | 79 (75.2%) | 26 (24.8%) |
| 20 to 24 Year Olds | 128 (87.1%) | 19 (12.9%) |
| 25 to 34 Year Olds | 275 (74.7%) | 93 (25.3%) |
| 35 Years and over | 30 (26.3%) | 84 (73.7%) |
| Total | 1,538 (76.5%) | 473 (23.5%) |
Educational Attainment by Field of Study in Clawson
Business (957 | 22.2%), engineering (634 | 14.7%), science & technology (404 | 9.4%), education (366 | 8.5%), and social sciences (278 | 6.5%) are the most common fields of study among 4,308 individuals in Clawson who have obtained a bachelor's degree or higher.
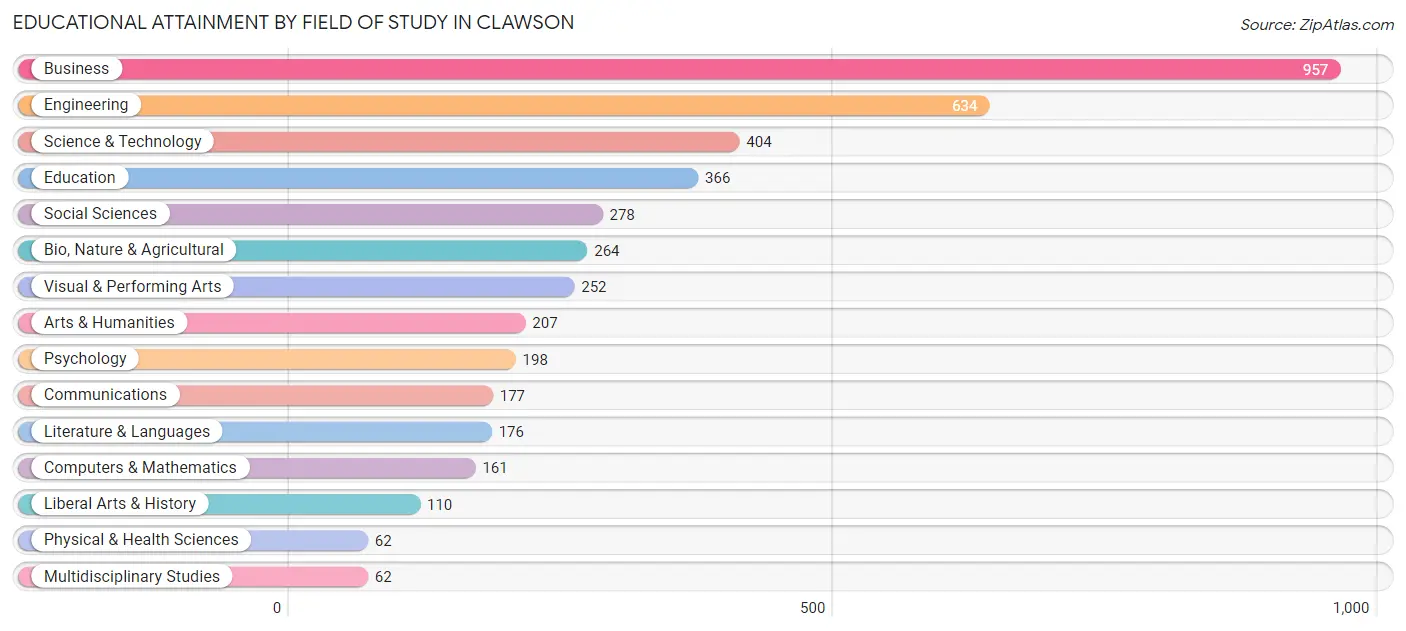
| Field of Study | # Graduates | % Graduates |
| Computers & Mathematics | 161 | 3.7% |
| Bio, Nature & Agricultural | 264 | 6.1% |
| Physical & Health Sciences | 62 | 1.4% |
| Psychology | 198 | 4.6% |
| Social Sciences | 278 | 6.5% |
| Engineering | 634 | 14.7% |
| Multidisciplinary Studies | 62 | 1.4% |
| Science & Technology | 404 | 9.4% |
| Business | 957 | 22.2% |
| Education | 366 | 8.5% |
| Literature & Languages | 176 | 4.1% |
| Liberal Arts & History | 110 | 2.5% |
| Visual & Performing Arts | 252 | 5.9% |
| Communications | 177 | 4.1% |
| Arts & Humanities | 207 | 4.8% |
| Total | 4,308 | 100.0% |
Transportation & Commute in Clawson
Vehicle Availability by Sex in Clawson
The most prevalent vehicle ownership categories in Clawson are males with 2 vehicles (1,639, accounting for 46.7%) and females with 2 vehicles (1,370, making up 55.3%).
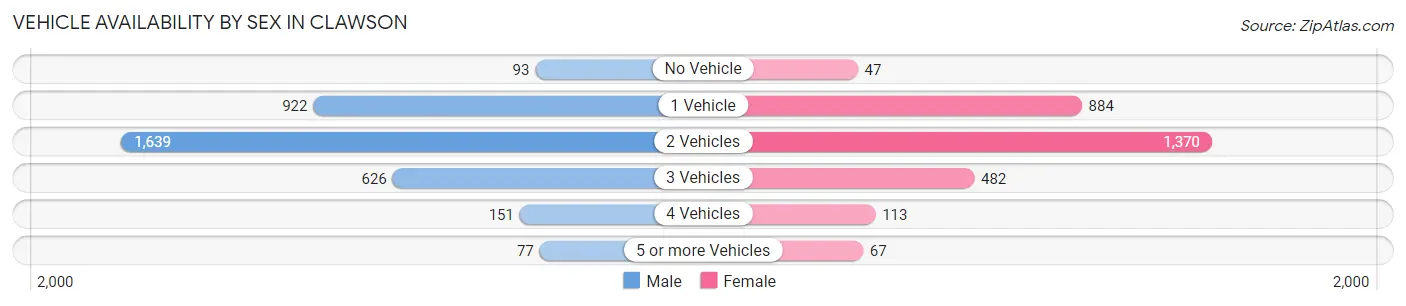
| Vehicles Available | Male | Female |
| No Vehicle | 93 (2.6%) | 47 (1.6%) |
| 1 Vehicle | 922 (26.3%) | 884 (29.8%) |
| 2 Vehicles | 1,639 (46.7%) | 1,370 (46.2%) |
| 3 Vehicles | 626 (17.8%) | 482 (16.3%) |
| 4 Vehicles | 151 (4.3%) | 113 (3.8%) |
| 5 or more Vehicles | 77 (2.2%) | 67 (2.3%) |
| Total | 3,508 (100.0%) | 2,963 (100.0%) |
Commute Time in Clawson
The most frequently occuring commute durations in Clawson are 20 to 24 minutes (1,159 commuters, 21.8%), 30 to 34 minutes (691 commuters, 13.0%), and 15 to 19 minutes (690 commuters, 13.0%).
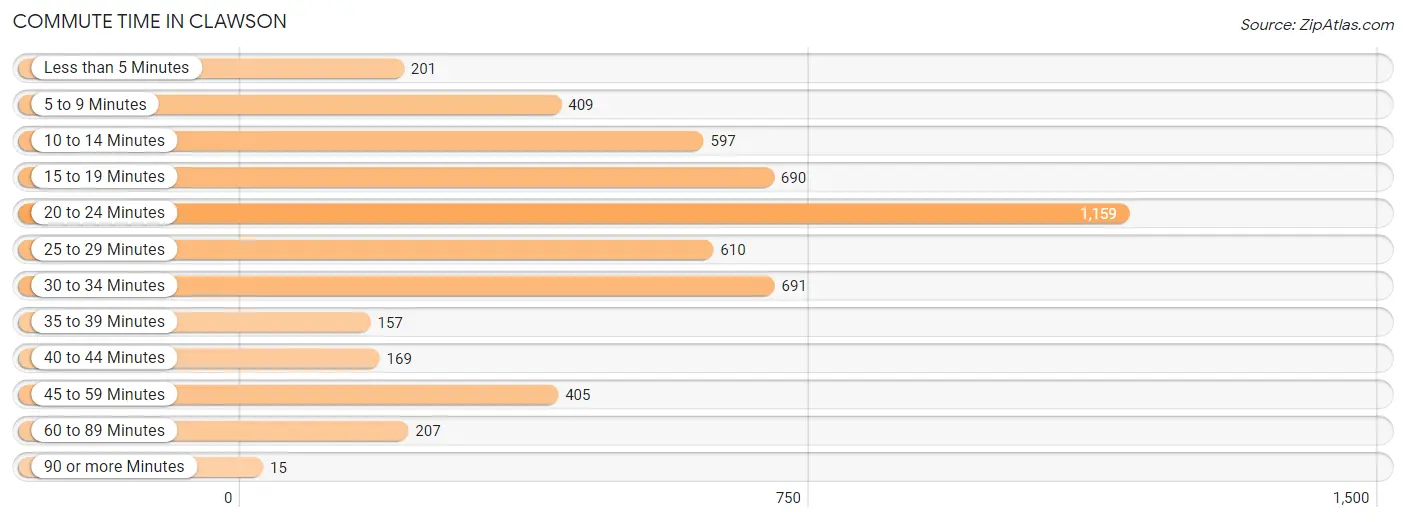
| Commute Time | # Commuters | % Commuters |
| Less than 5 Minutes | 201 | 3.8% |
| 5 to 9 Minutes | 409 | 7.7% |
| 10 to 14 Minutes | 597 | 11.2% |
| 15 to 19 Minutes | 690 | 13.0% |
| 20 to 24 Minutes | 1,159 | 21.8% |
| 25 to 29 Minutes | 610 | 11.5% |
| 30 to 34 Minutes | 691 | 13.0% |
| 35 to 39 Minutes | 157 | 3.0% |
| 40 to 44 Minutes | 169 | 3.2% |
| 45 to 59 Minutes | 405 | 7.6% |
| 60 to 89 Minutes | 207 | 3.9% |
| 90 or more Minutes | 15 | 0.3% |
Commute Time by Sex in Clawson
The most common commute times in Clawson are 20 to 24 minutes (620 commuters, 20.8%) for males and 20 to 24 minutes (539 commuters, 23.1%) for females.
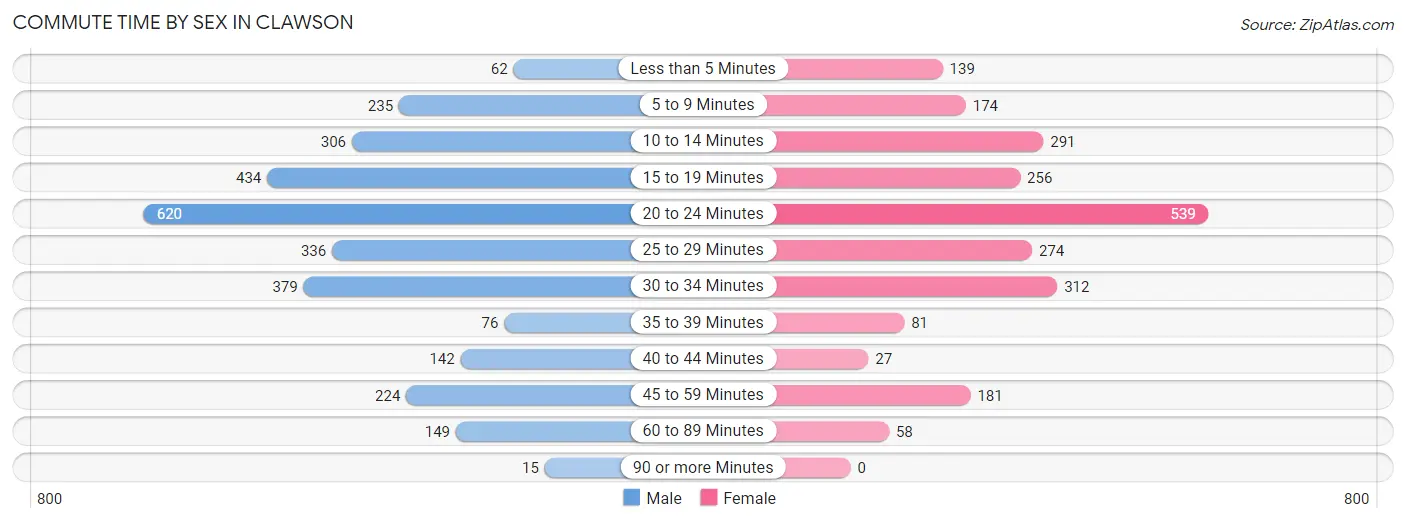
| Commute Time | Male | Female |
| Less than 5 Minutes | 62 (2.1%) | 139 (6.0%) |
| 5 to 9 Minutes | 235 (7.9%) | 174 (7.5%) |
| 10 to 14 Minutes | 306 (10.3%) | 291 (12.5%) |
| 15 to 19 Minutes | 434 (14.6%) | 256 (11.0%) |
| 20 to 24 Minutes | 620 (20.8%) | 539 (23.1%) |
| 25 to 29 Minutes | 336 (11.3%) | 274 (11.7%) |
| 30 to 34 Minutes | 379 (12.7%) | 312 (13.4%) |
| 35 to 39 Minutes | 76 (2.5%) | 81 (3.5%) |
| 40 to 44 Minutes | 142 (4.8%) | 27 (1.2%) |
| 45 to 59 Minutes | 224 (7.5%) | 181 (7.8%) |
| 60 to 89 Minutes | 149 (5.0%) | 58 (2.5%) |
| 90 or more Minutes | 15 (0.5%) | 0 (0.0%) |
Time of Departure to Work by Sex in Clawson
The most frequent times of departure to work in Clawson are 6:30 AM to 6:59 AM (474, 15.9%) for males and 7:00 AM to 7:29 AM (435, 18.6%) for females.
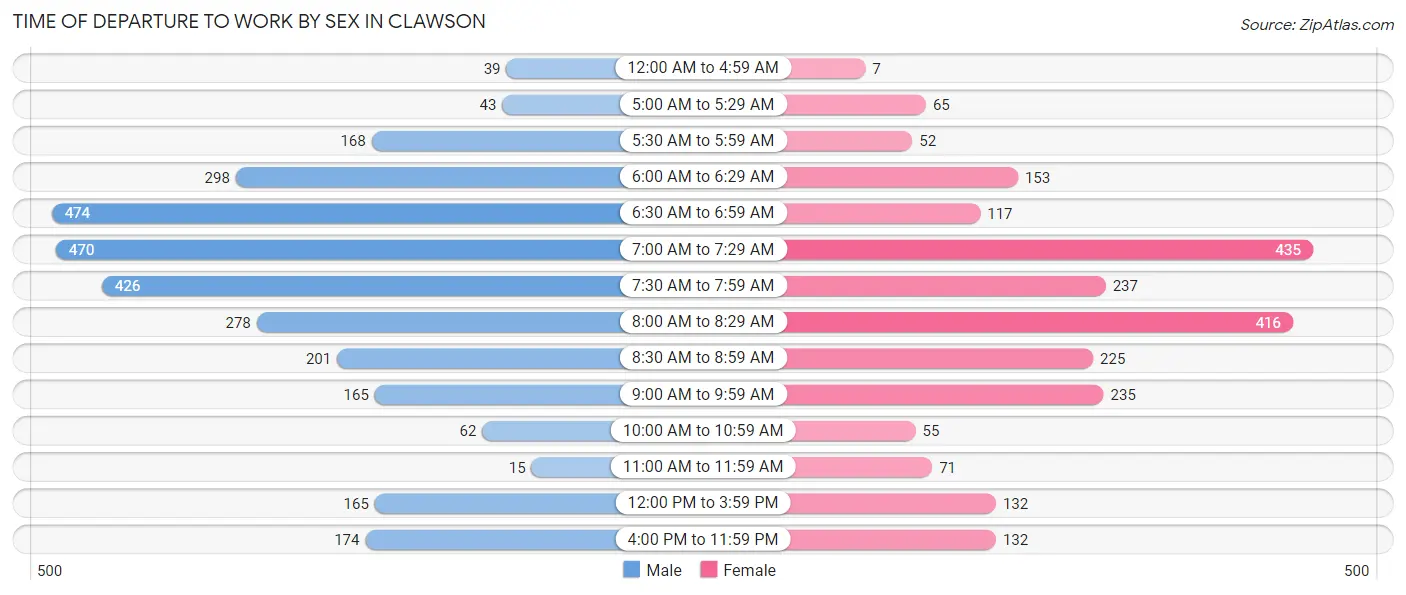
| Time of Departure | Male | Female |
| 12:00 AM to 4:59 AM | 39 (1.3%) | 7 (0.3%) |
| 5:00 AM to 5:29 AM | 43 (1.4%) | 65 (2.8%) |
| 5:30 AM to 5:59 AM | 168 (5.6%) | 52 (2.2%) |
| 6:00 AM to 6:29 AM | 298 (10.0%) | 153 (6.6%) |
| 6:30 AM to 6:59 AM | 474 (15.9%) | 117 (5.0%) |
| 7:00 AM to 7:29 AM | 470 (15.8%) | 435 (18.6%) |
| 7:30 AM to 7:59 AM | 426 (14.3%) | 237 (10.2%) |
| 8:00 AM to 8:29 AM | 278 (9.3%) | 416 (17.8%) |
| 8:30 AM to 8:59 AM | 201 (6.8%) | 225 (9.7%) |
| 9:00 AM to 9:59 AM | 165 (5.5%) | 235 (10.1%) |
| 10:00 AM to 10:59 AM | 62 (2.1%) | 55 (2.4%) |
| 11:00 AM to 11:59 AM | 15 (0.5%) | 71 (3.0%) |
| 12:00 PM to 3:59 PM | 165 (5.5%) | 132 (5.7%) |
| 4:00 PM to 11:59 PM | 174 (5.8%) | 132 (5.7%) |
| Total | 2,978 (100.0%) | 2,332 (100.0%) |
Housing Occupancy in Clawson
Occupancy by Ownership in Clawson
Of the total 5,806 dwellings in Clawson, owner-occupied units account for 4,281 (73.7%), while renter-occupied units make up 1,525 (26.3%).
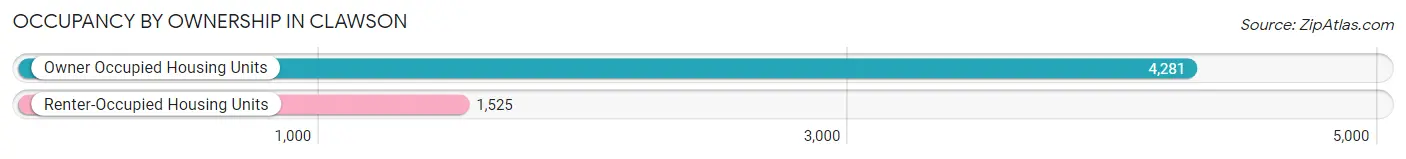
| Occupancy | # Housing Units | % Housing Units |
| Owner Occupied Housing Units | 4,281 | 73.7% |
| Renter-Occupied Housing Units | 1,525 | 26.3% |
| Total Occupied Housing Units | 5,806 | 100.0% |
Occupancy by Household Size in Clawson
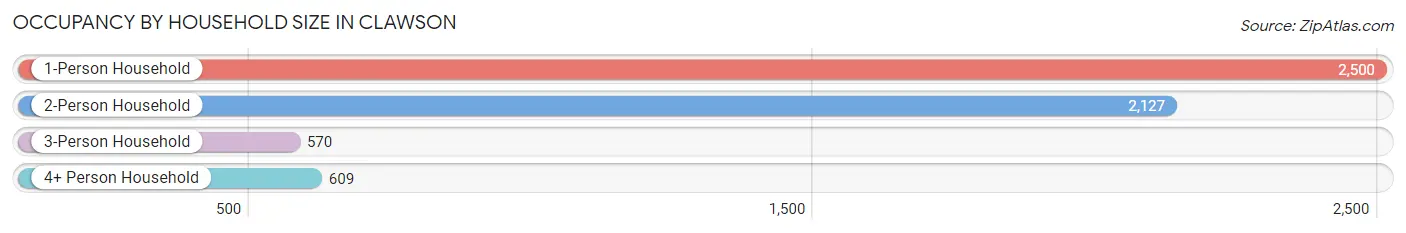
| Household Size | # Housing Units | % Housing Units |
| 1-Person Household | 2,500 | 43.1% |
| 2-Person Household | 2,127 | 36.6% |
| 3-Person Household | 570 | 9.8% |
| 4+ Person Household | 609 | 10.5% |
| Total Housing Units | 5,806 | 100.0% |
Occupancy by Ownership by Household Size in Clawson
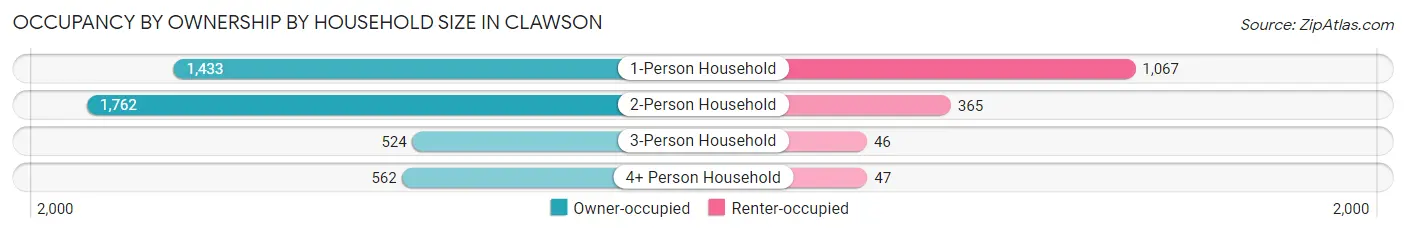
| Household Size | Owner-occupied | Renter-occupied |
| 1-Person Household | 1,433 (57.3%) | 1,067 (42.7%) |
| 2-Person Household | 1,762 (82.8%) | 365 (17.2%) |
| 3-Person Household | 524 (91.9%) | 46 (8.1%) |
| 4+ Person Household | 562 (92.3%) | 47 (7.7%) |
| Total Housing Units | 4,281 (73.7%) | 1,525 (26.3%) |
Occupancy by Educational Attainment in Clawson
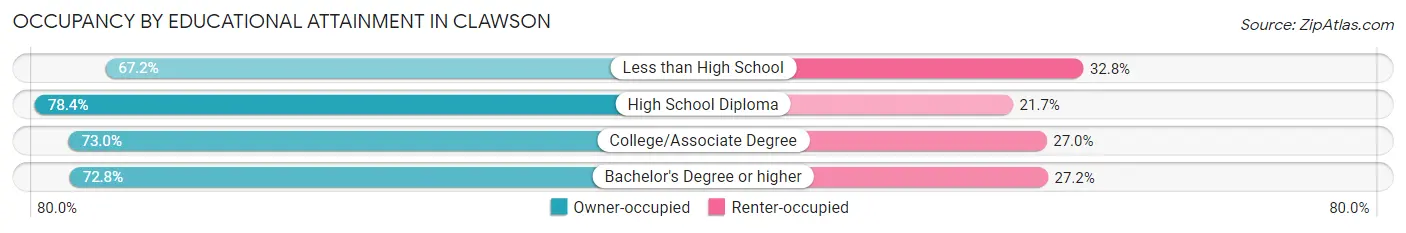
| Household Size | Owner-occupied | Renter-occupied |
| Less than High School | 125 (67.2%) | 61 (32.8%) |
| High School Diploma | 847 (78.3%) | 234 (21.6%) |
| College/Associate Degree | 1,340 (73.0%) | 495 (27.0%) |
| Bachelor's Degree or higher | 1,969 (72.8%) | 735 (27.2%) |
Occupancy by Age of Householder in Clawson
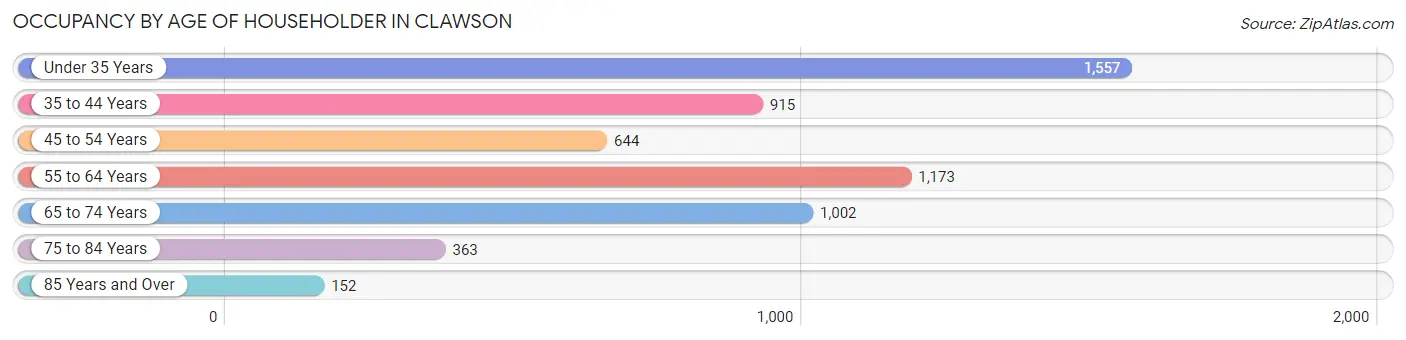
| Age Bracket | # Households | % Households |
| Under 35 Years | 1,557 | 26.8% |
| 35 to 44 Years | 915 | 15.8% |
| 45 to 54 Years | 644 | 11.1% |
| 55 to 64 Years | 1,173 | 20.2% |
| 65 to 74 Years | 1,002 | 17.3% |
| 75 to 84 Years | 363 | 6.2% |
| 85 Years and Over | 152 | 2.6% |
| Total | 5,806 | 100.0% |
Housing Finances in Clawson
Median Income by Occupancy in Clawson
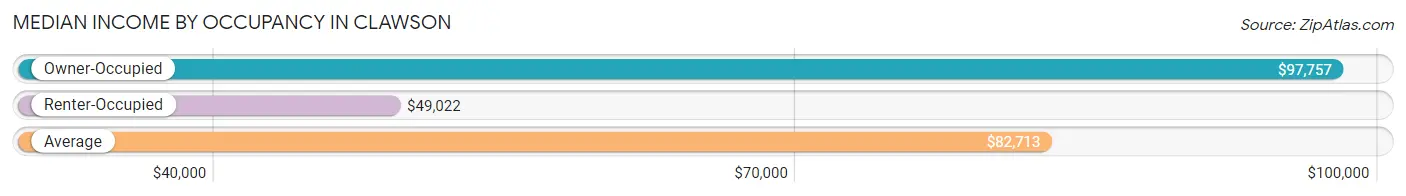
| Occupancy Type | # Households | Median Income |
| Owner-Occupied | 4,281 (73.7%) | $97,757 |
| Renter-Occupied | 1,525 (26.3%) | $49,022 |
| Average | 5,806 (100.0%) | $82,713 |
Occupancy by Householder Income Bracket in Clawson
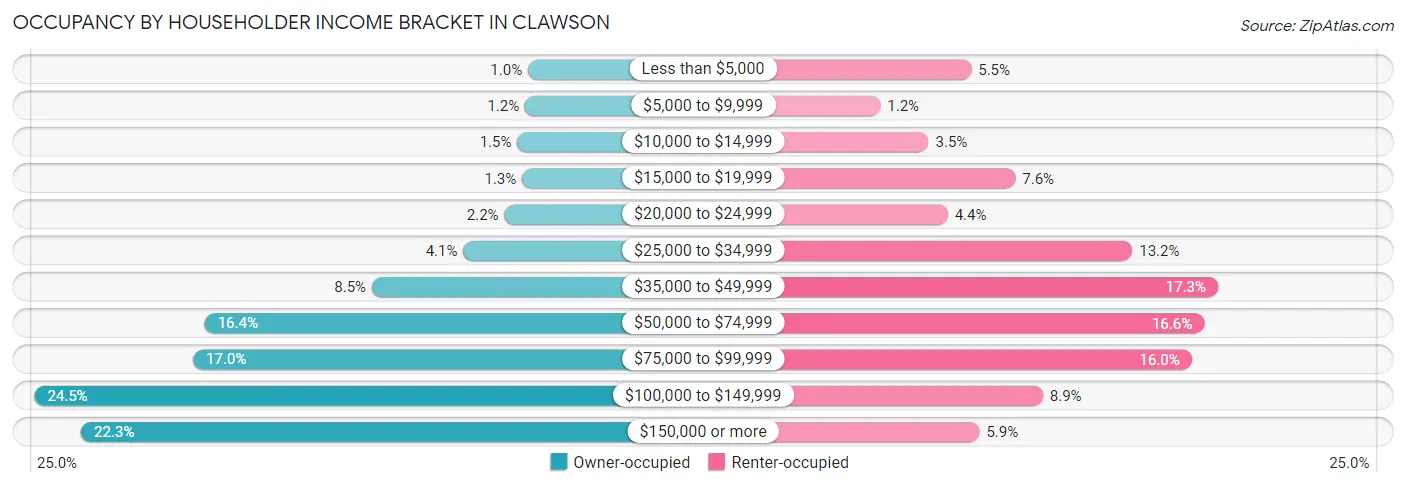
| Income Bracket | Owner-occupied | Renter-occupied |
| Less than $5,000 | 44 (1.0%) | 84 (5.5%) |
| $5,000 to $9,999 | 50 (1.2%) | 18 (1.2%) |
| $10,000 to $14,999 | 66 (1.5%) | 53 (3.5%) |
| $15,000 to $19,999 | 56 (1.3%) | 116 (7.6%) |
| $20,000 to $24,999 | 92 (2.1%) | 67 (4.4%) |
| $25,000 to $34,999 | 176 (4.1%) | 201 (13.2%) |
| $35,000 to $49,999 | 362 (8.5%) | 263 (17.2%) |
| $50,000 to $74,999 | 703 (16.4%) | 253 (16.6%) |
| $75,000 to $99,999 | 727 (17.0%) | 244 (16.0%) |
| $100,000 to $149,999 | 1,050 (24.5%) | 136 (8.9%) |
| $150,000 or more | 955 (22.3%) | 90 (5.9%) |
| Total | 4,281 (100.0%) | 1,525 (100.0%) |
Monthly Housing Cost Tiers in Clawson
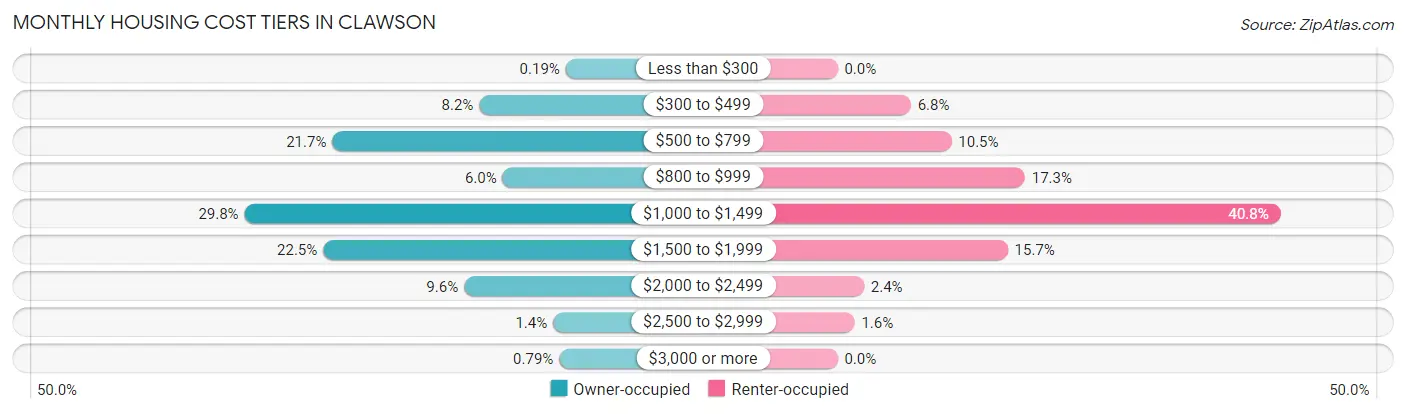
| Monthly Cost | Owner-occupied | Renter-occupied |
| Less than $300 | 8 (0.2%) | 0 (0.0%) |
| $300 to $499 | 349 (8.2%) | 103 (6.8%) |
| $500 to $799 | 928 (21.7%) | 160 (10.5%) |
| $800 to $999 | 257 (6.0%) | 263 (17.2%) |
| $1,000 to $1,499 | 1,274 (29.8%) | 622 (40.8%) |
| $1,500 to $1,999 | 964 (22.5%) | 239 (15.7%) |
| $2,000 to $2,499 | 409 (9.6%) | 37 (2.4%) |
| $2,500 to $2,999 | 58 (1.3%) | 24 (1.6%) |
| $3,000 or more | 34 (0.8%) | 0 (0.0%) |
| Total | 4,281 (100.0%) | 1,525 (100.0%) |
Physical Housing Characteristics in Clawson
Housing Structures in Clawson
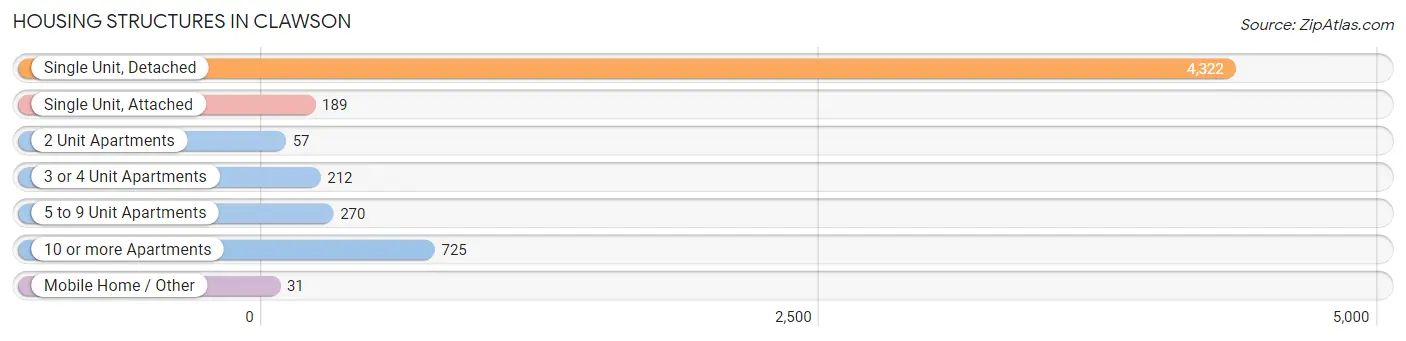
| Structure Type | # Housing Units | % Housing Units |
| Single Unit, Detached | 4,322 | 74.4% |
| Single Unit, Attached | 189 | 3.3% |
| 2 Unit Apartments | 57 | 1.0% |
| 3 or 4 Unit Apartments | 212 | 3.6% |
| 5 to 9 Unit Apartments | 270 | 4.6% |
| 10 or more Apartments | 725 | 12.5% |
| Mobile Home / Other | 31 | 0.5% |
| Total | 5,806 | 100.0% |
Housing Structures by Occupancy in Clawson
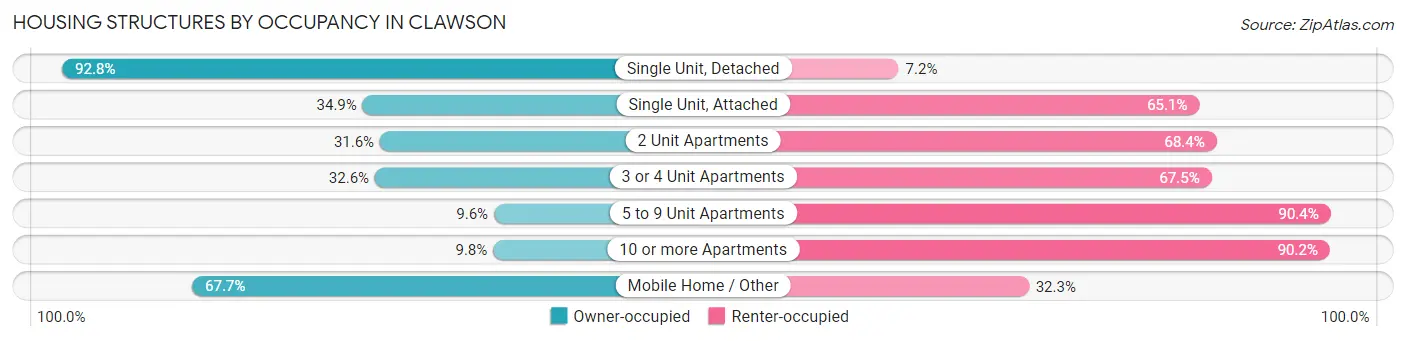
| Structure Type | Owner-occupied | Renter-occupied |
| Single Unit, Detached | 4,010 (92.8%) | 312 (7.2%) |
| Single Unit, Attached | 66 (34.9%) | 123 (65.1%) |
| 2 Unit Apartments | 18 (31.6%) | 39 (68.4%) |
| 3 or 4 Unit Apartments | 69 (32.6%) | 143 (67.4%) |
| 5 to 9 Unit Apartments | 26 (9.6%) | 244 (90.4%) |
| 10 or more Apartments | 71 (9.8%) | 654 (90.2%) |
| Mobile Home / Other | 21 (67.7%) | 10 (32.3%) |
| Total | 4,281 (73.7%) | 1,525 (26.3%) |
Housing Structures by Number of Rooms in Clawson
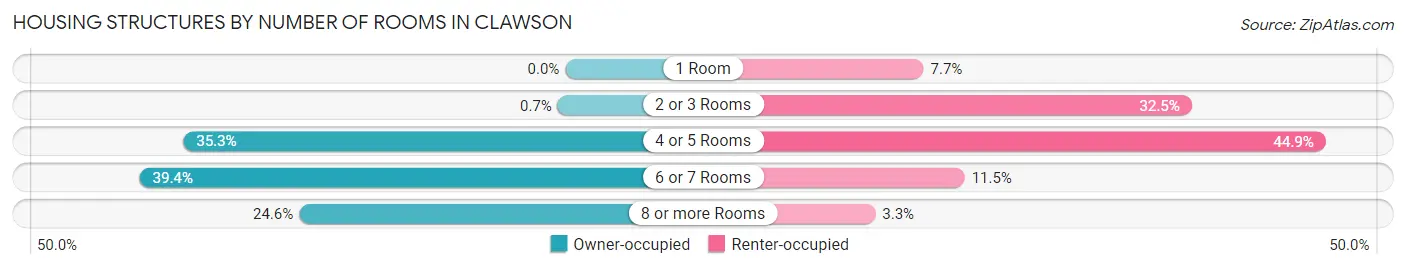
| Number of Rooms | Owner-occupied | Renter-occupied |
| 1 Room | 0 (0.0%) | 118 (7.7%) |
| 2 or 3 Rooms | 30 (0.7%) | 496 (32.5%) |
| 4 or 5 Rooms | 1,512 (35.3%) | 685 (44.9%) |
| 6 or 7 Rooms | 1,685 (39.4%) | 176 (11.5%) |
| 8 or more Rooms | 1,054 (24.6%) | 50 (3.3%) |
| Total | 4,281 (100.0%) | 1,525 (100.0%) |
Housing Structure by Heating Type in Clawson
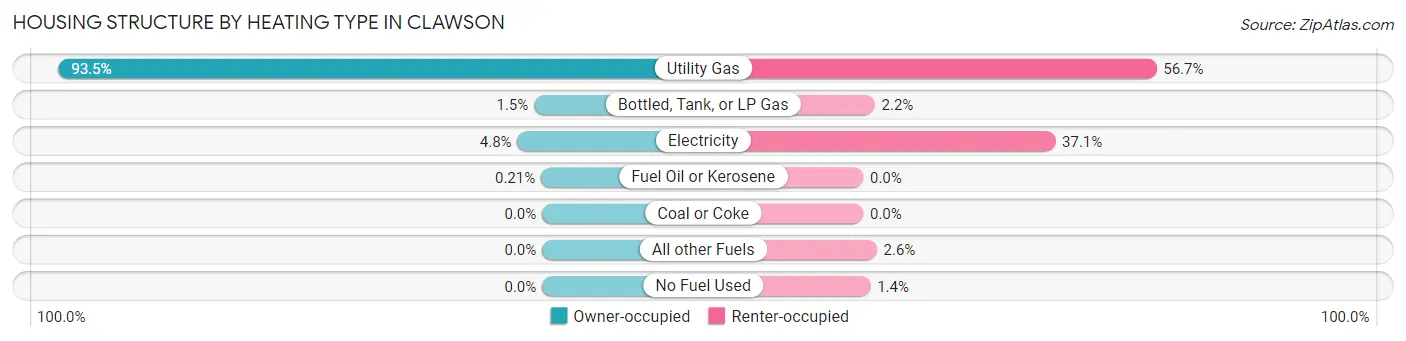
| Heating Type | Owner-occupied | Renter-occupied |
| Utility Gas | 4,002 (93.5%) | 864 (56.7%) |
| Bottled, Tank, or LP Gas | 66 (1.5%) | 34 (2.2%) |
| Electricity | 204 (4.8%) | 566 (37.1%) |
| Fuel Oil or Kerosene | 9 (0.2%) | 0 (0.0%) |
| Coal or Coke | 0 (0.0%) | 0 (0.0%) |
| All other Fuels | 0 (0.0%) | 40 (2.6%) |
| No Fuel Used | 0 (0.0%) | 21 (1.4%) |
| Total | 4,281 (100.0%) | 1,525 (100.0%) |
Household Vehicle Usage in Clawson
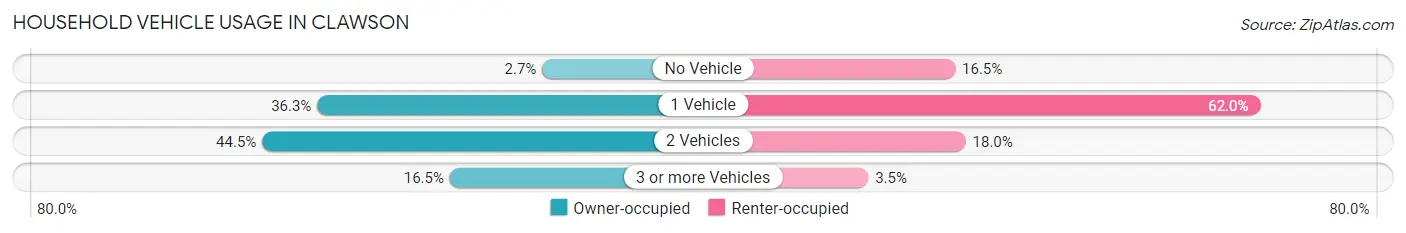
| Vehicles per Household | Owner-occupied | Renter-occupied |
| No Vehicle | 115 (2.7%) | 251 (16.5%) |
| 1 Vehicle | 1,554 (36.3%) | 946 (62.0%) |
| 2 Vehicles | 1,906 (44.5%) | 275 (18.0%) |
| 3 or more Vehicles | 706 (16.5%) | 53 (3.5%) |
| Total | 4,281 (100.0%) | 1,525 (100.0%) |
Real Estate & Mortgages in Clawson
Real Estate and Mortgage Overview in Clawson
| Characteristic | Without Mortgage | With Mortgage |
| Housing Units | 1,473 | 2,808 |
| Median Property Value | $228,600 | $242,200 |
| Median Household Income | $71,528 | $725 |
| Monthly Housing Costs | $591 | $26 |
| Real Estate Taxes | $3,262 | $44 |
Property Value by Mortgage Status in Clawson
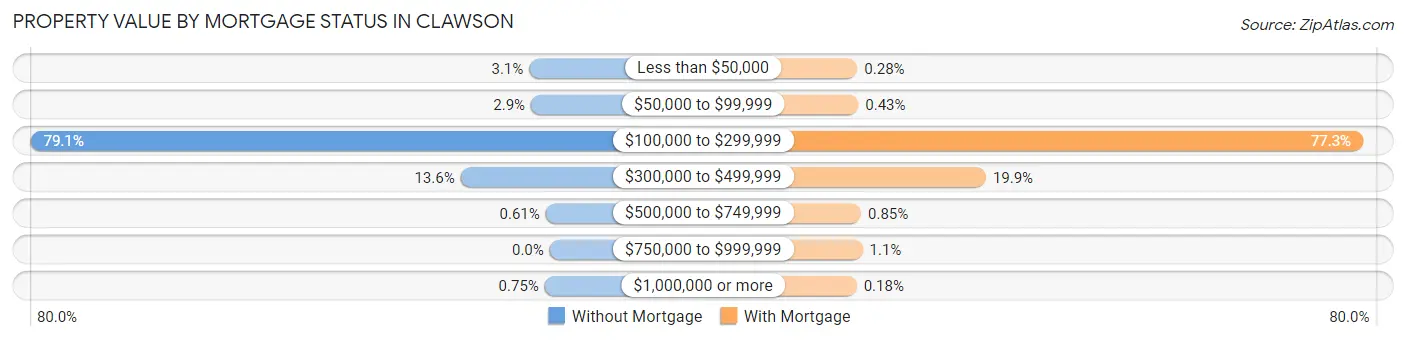
| Property Value | Without Mortgage | With Mortgage |
| Less than $50,000 | 46 (3.1%) | 8 (0.3%) |
| $50,000 to $99,999 | 42 (2.9%) | 12 (0.4%) |
| $100,000 to $299,999 | 1,165 (79.1%) | 2,171 (77.3%) |
| $300,000 to $499,999 | 200 (13.6%) | 558 (19.9%) |
| $500,000 to $749,999 | 9 (0.6%) | 24 (0.9%) |
| $750,000 to $999,999 | 0 (0.0%) | 30 (1.1%) |
| $1,000,000 or more | 11 (0.7%) | 5 (0.2%) |
| Total | 1,473 (100.0%) | 2,808 (100.0%) |
Household Income by Mortgage Status in Clawson
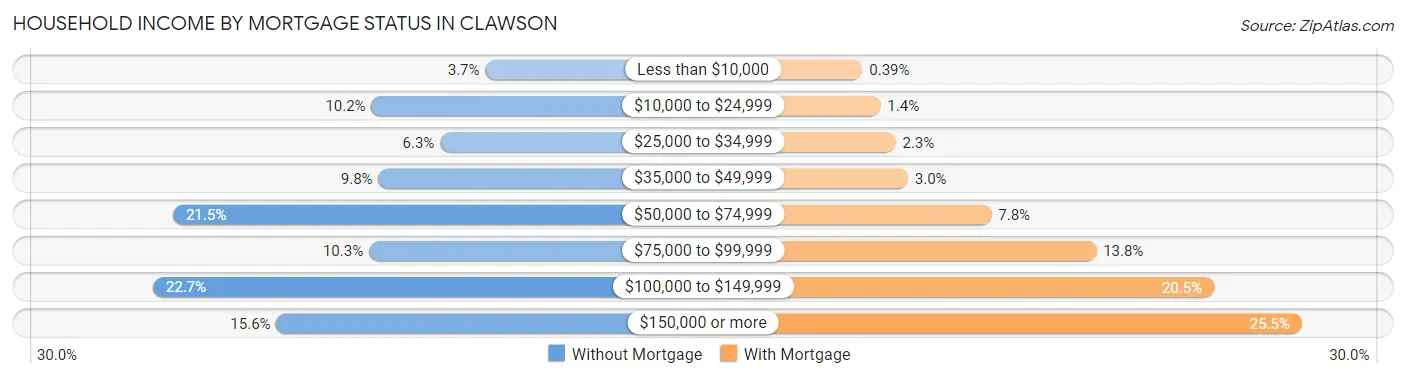
| Household Income | Without Mortgage | With Mortgage |
| Less than $10,000 | 54 (3.7%) | 11 (0.4%) |
| $10,000 to $24,999 | 150 (10.2%) | 40 (1.4%) |
| $25,000 to $34,999 | 92 (6.2%) | 64 (2.3%) |
| $35,000 to $49,999 | 144 (9.8%) | 84 (3.0%) |
| $50,000 to $74,999 | 317 (21.5%) | 218 (7.8%) |
| $75,000 to $99,999 | 152 (10.3%) | 386 (13.8%) |
| $100,000 to $149,999 | 334 (22.7%) | 575 (20.5%) |
| $150,000 or more | 230 (15.6%) | 716 (25.5%) |
| Total | 1,473 (100.0%) | 2,808 (100.0%) |
Property Value to Household Income Ratio in Clawson
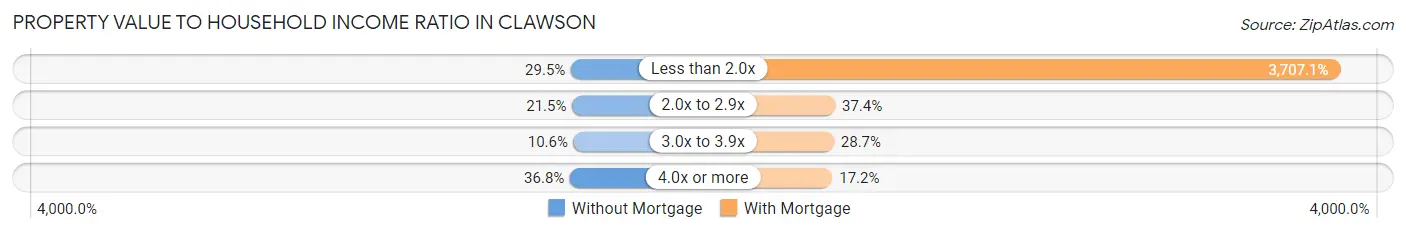
| Value-to-Income Ratio | Without Mortgage | With Mortgage |
| Less than 2.0x | 434 (29.5%) | 104,095 (3,707.1%) |
| 2.0x to 2.9x | 316 (21.4%) | 1,050 (37.4%) |
| 3.0x to 3.9x | 156 (10.6%) | 807 (28.7%) |
| 4.0x or more | 542 (36.8%) | 484 (17.2%) |
| Total | 1,473 (100.0%) | 2,808 (100.0%) |
Real Estate Taxes by Mortgage Status in Clawson
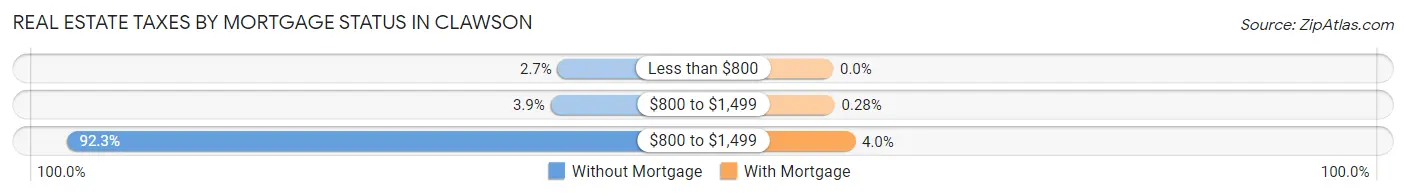
| Property Taxes | Without Mortgage | With Mortgage |
| Less than $800 | 39 (2.6%) | 0 (0.0%) |
| $800 to $1,499 | 58 (3.9%) | 8 (0.3%) |
| $800 to $1,499 | 1,360 (92.3%) | 113 (4.0%) |
| Total | 1,473 (100.0%) | 2,808 (100.0%) |
Health & Disability in Clawson
Health Insurance Coverage by Age in Clawson
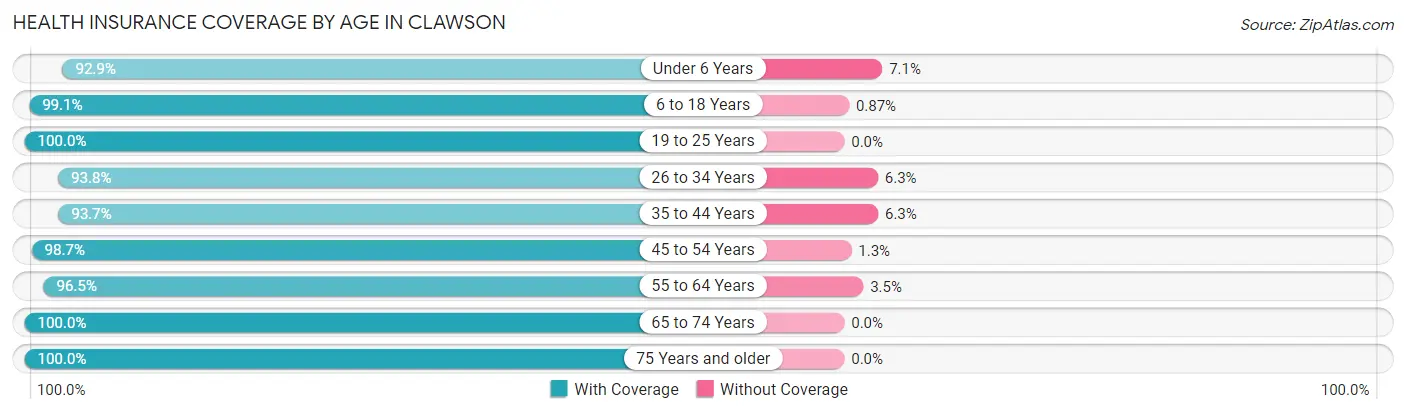
| Age Bracket | With Coverage | Without Coverage |
| Under 6 Years | 420 (92.9%) | 32 (7.1%) |
| 6 to 18 Years | 1,257 (99.1%) | 11 (0.9%) |
| 19 to 25 Years | 736 (100.0%) | 0 (0.0%) |
| 26 to 34 Years | 2,039 (93.8%) | 136 (6.2%) |
| 35 to 44 Years | 1,461 (93.7%) | 98 (6.3%) |
| 45 to 54 Years | 1,132 (98.7%) | 15 (1.3%) |
| 55 to 64 Years | 1,749 (96.5%) | 64 (3.5%) |
| 65 to 74 Years | 1,430 (100.0%) | 0 (0.0%) |
| 75 Years and older | 706 (100.0%) | 0 (0.0%) |
| Total | 10,930 (96.9%) | 356 (3.2%) |
Health Insurance Coverage by Citizenship Status in Clawson
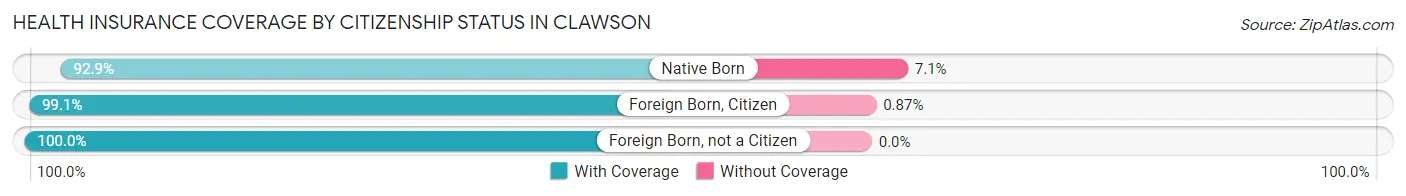
| Citizenship Status | With Coverage | Without Coverage |
| Native Born | 420 (92.9%) | 32 (7.1%) |
| Foreign Born, Citizen | 1,257 (99.1%) | 11 (0.9%) |
| Foreign Born, not a Citizen | 736 (100.0%) | 0 (0.0%) |
Health Insurance Coverage by Household Income in Clawson
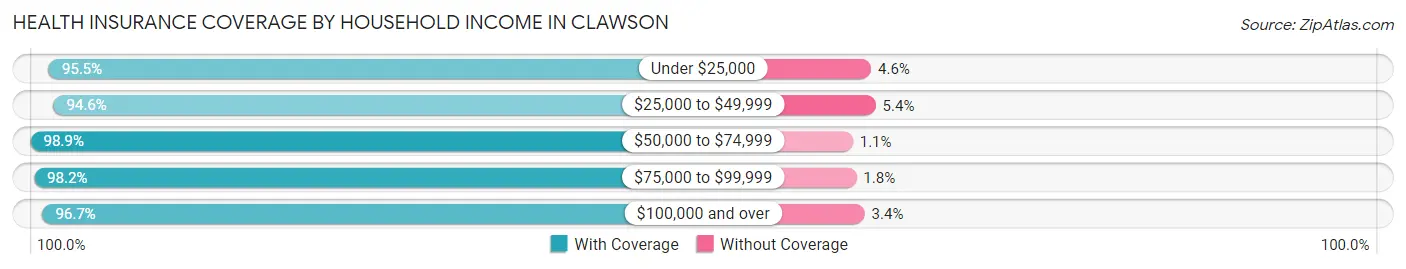
| Household Income | With Coverage | Without Coverage |
| Under $25,000 | 819 (95.5%) | 39 (4.5%) |
| $25,000 to $49,999 | 1,555 (94.6%) | 89 (5.4%) |
| $50,000 to $74,999 | 1,772 (98.9%) | 20 (1.1%) |
| $75,000 to $99,999 | 1,640 (98.2%) | 30 (1.8%) |
| $100,000 and over | 5,138 (96.7%) | 178 (3.4%) |
Public vs Private Health Insurance Coverage by Age in Clawson
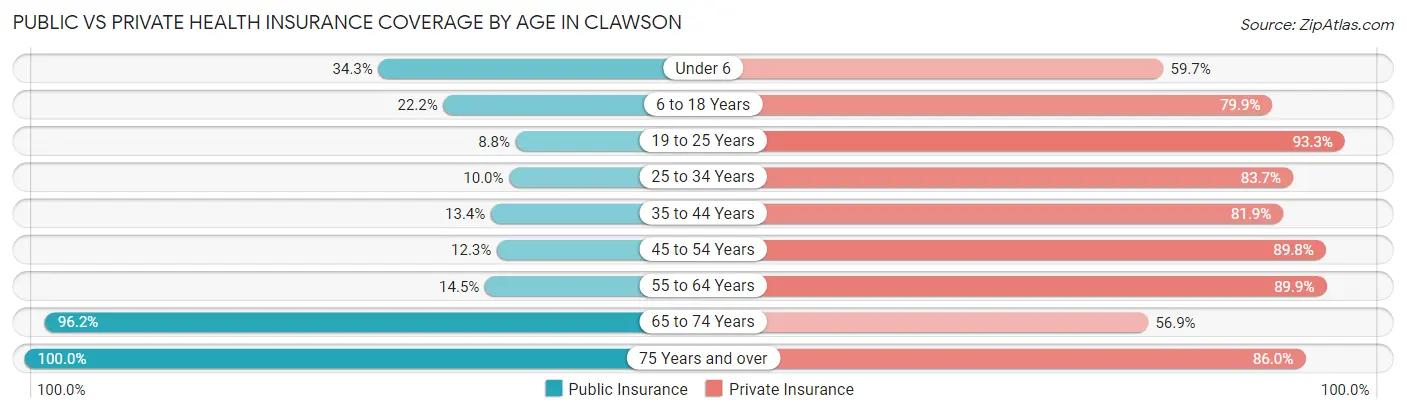
| Age Bracket | Public Insurance | Private Insurance |
| Under 6 | 155 (34.3%) | 270 (59.7%) |
| 6 to 18 Years | 282 (22.2%) | 1,013 (79.9%) |
| 19 to 25 Years | 65 (8.8%) | 687 (93.3%) |
| 25 to 34 Years | 218 (10.0%) | 1,821 (83.7%) |
| 35 to 44 Years | 209 (13.4%) | 1,277 (81.9%) |
| 45 to 54 Years | 141 (12.3%) | 1,030 (89.8%) |
| 55 to 64 Years | 263 (14.5%) | 1,630 (89.9%) |
| 65 to 74 Years | 1,376 (96.2%) | 814 (56.9%) |
| 75 Years and over | 706 (100.0%) | 607 (86.0%) |
| Total | 3,415 (30.3%) | 9,149 (81.1%) |
Disability Status by Sex by Age in Clawson
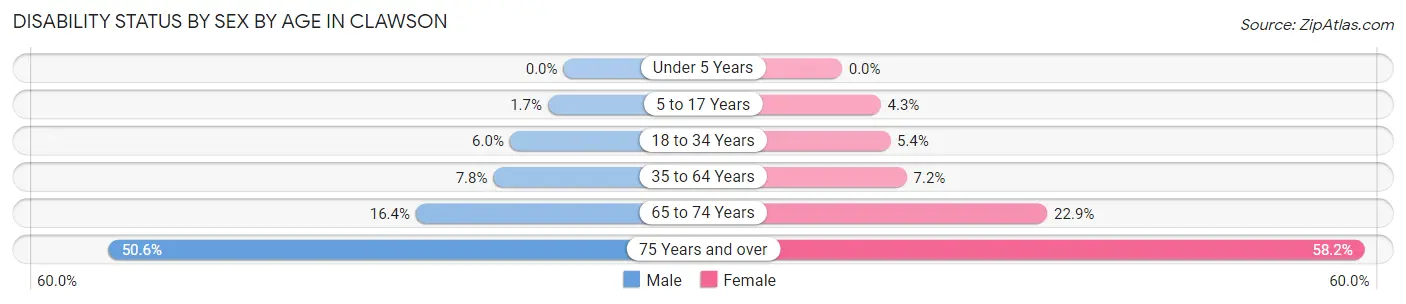
| Age Bracket | Male | Female |
| Under 5 Years | 0 (0.0%) | 0 (0.0%) |
| 5 to 17 Years | 13 (1.7%) | 24 (4.3%) |
| 18 to 34 Years | 90 (6.0%) | 79 (5.4%) |
| 35 to 64 Years | 185 (7.8%) | 155 (7.2%) |
| 65 to 74 Years | 102 (16.4%) | 185 (22.9%) |
| 75 Years and over | 160 (50.6%) | 227 (58.2%) |
Disability Class by Sex by Age in Clawson
Disability Class: Hearing Difficulty
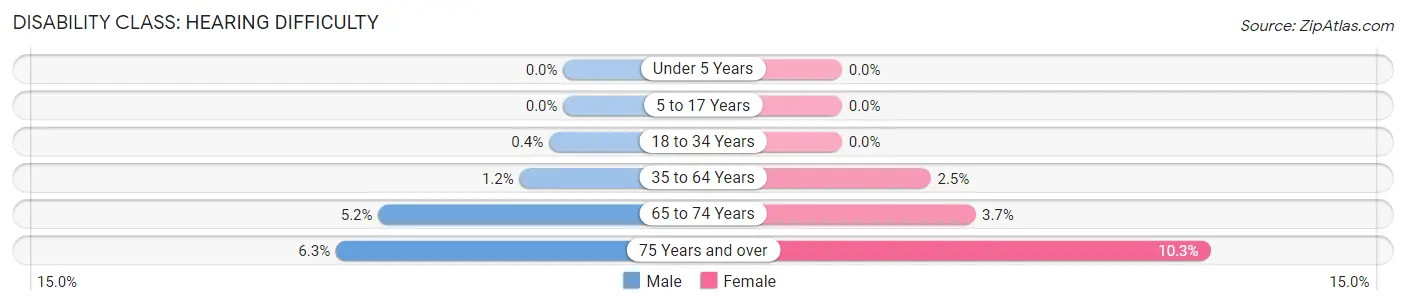
| Age Bracket | Male | Female |
| Under 5 Years | 0 (0.0%) | 0 (0.0%) |
| 5 to 17 Years | 0 (0.0%) | 0 (0.0%) |
| 18 to 34 Years | 6 (0.4%) | 0 (0.0%) |
| 35 to 64 Years | 29 (1.2%) | 53 (2.5%) |
| 65 to 74 Years | 32 (5.1%) | 30 (3.7%) |
| 75 Years and over | 20 (6.3%) | 40 (10.3%) |
Disability Class: Vision Difficulty
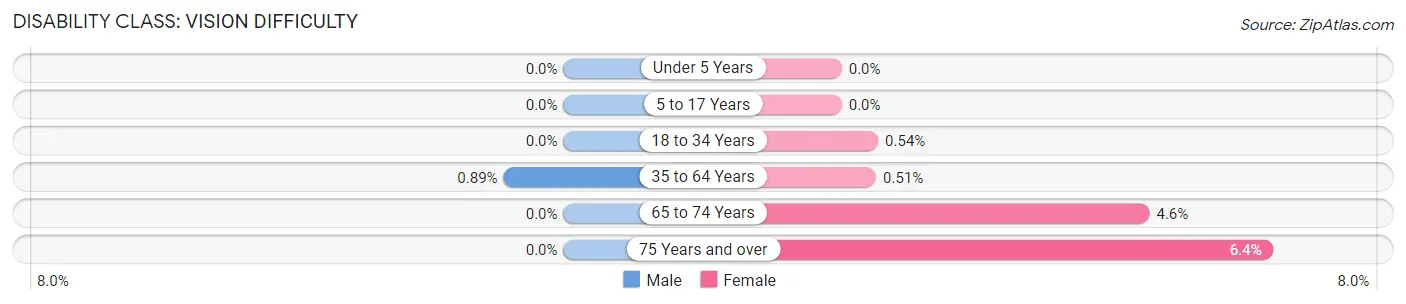
| Age Bracket | Male | Female |
| Under 5 Years | 0 (0.0%) | 0 (0.0%) |
| 5 to 17 Years | 0 (0.0%) | 0 (0.0%) |
| 18 to 34 Years | 0 (0.0%) | 8 (0.5%) |
| 35 to 64 Years | 21 (0.9%) | 11 (0.5%) |
| 65 to 74 Years | 0 (0.0%) | 37 (4.6%) |
| 75 Years and over | 0 (0.0%) | 25 (6.4%) |
Disability Class: Cognitive Difficulty
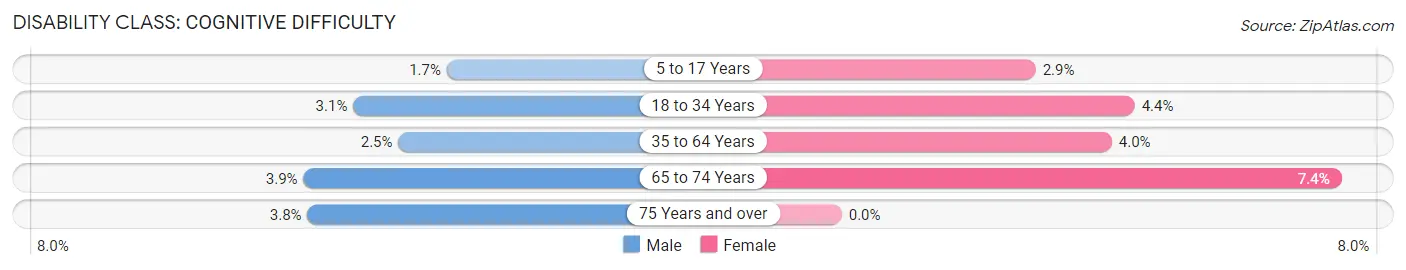
| Age Bracket | Male | Female |
| 5 to 17 Years | 13 (1.7%) | 16 (2.9%) |
| 18 to 34 Years | 47 (3.1%) | 64 (4.3%) |
| 35 to 64 Years | 58 (2.5%) | 86 (4.0%) |
| 65 to 74 Years | 24 (3.9%) | 60 (7.4%) |
| 75 Years and over | 12 (3.8%) | 0 (0.0%) |
Disability Class: Ambulatory Difficulty
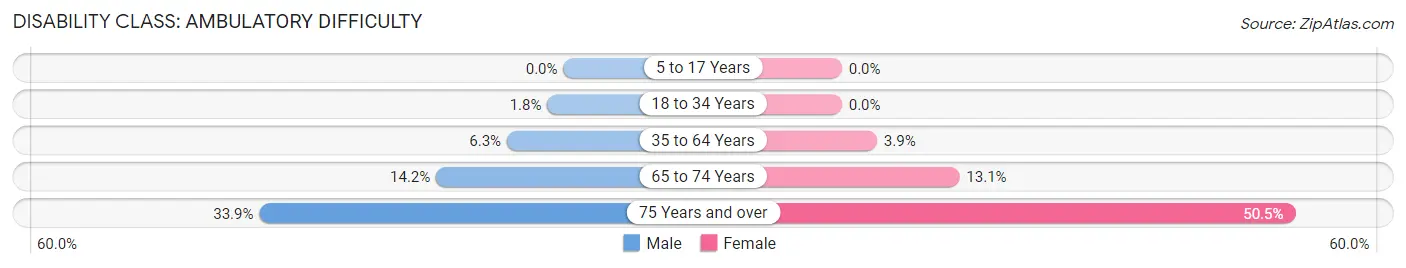
| Age Bracket | Male | Female |
| 5 to 17 Years | 0 (0.0%) | 0 (0.0%) |
| 18 to 34 Years | 27 (1.8%) | 0 (0.0%) |
| 35 to 64 Years | 149 (6.3%) | 84 (3.9%) |
| 65 to 74 Years | 88 (14.2%) | 106 (13.1%) |
| 75 Years and over | 107 (33.9%) | 197 (50.5%) |
Disability Class: Self-Care Difficulty
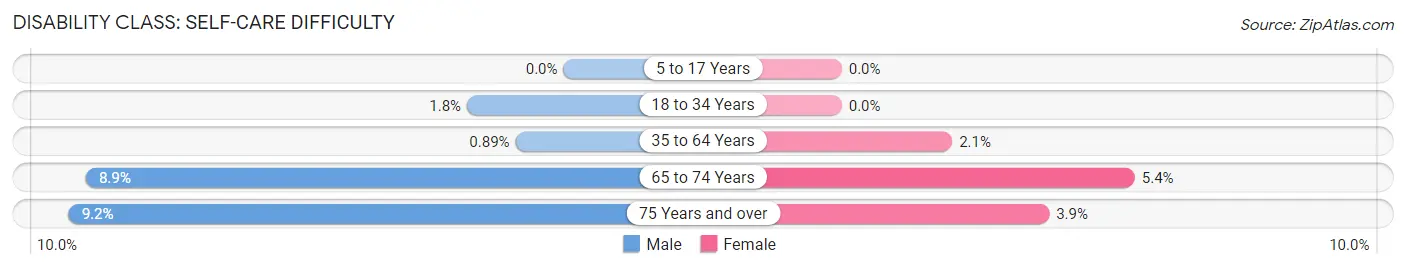
| Age Bracket | Male | Female |
| 5 to 17 Years | 0 (0.0%) | 0 (0.0%) |
| 18 to 34 Years | 27 (1.8%) | 0 (0.0%) |
| 35 to 64 Years | 21 (0.9%) | 44 (2.1%) |
| 65 to 74 Years | 55 (8.9%) | 44 (5.4%) |
| 75 Years and over | 29 (9.2%) | 15 (3.8%) |
Technology Access in Clawson
Computing Device Access in Clawson
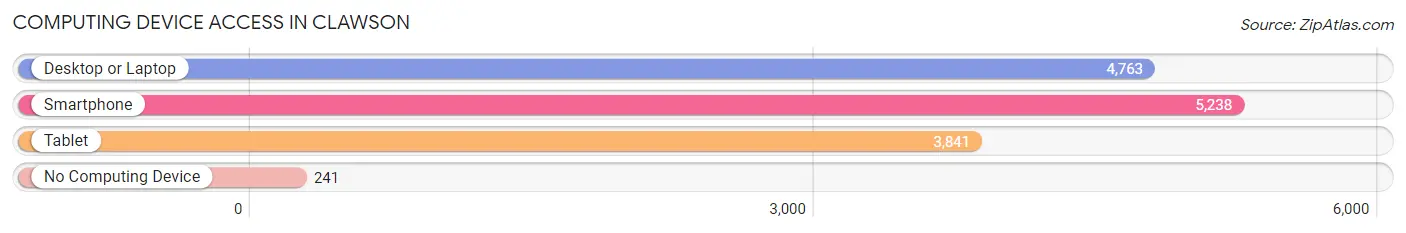
| Device Type | # Households | % Households |
| Desktop or Laptop | 4,763 | 82.0% |
| Smartphone | 5,238 | 90.2% |
| Tablet | 3,841 | 66.2% |
| No Computing Device | 241 | 4.2% |
| Total | 5,806 | 100.0% |
Internet Access in Clawson
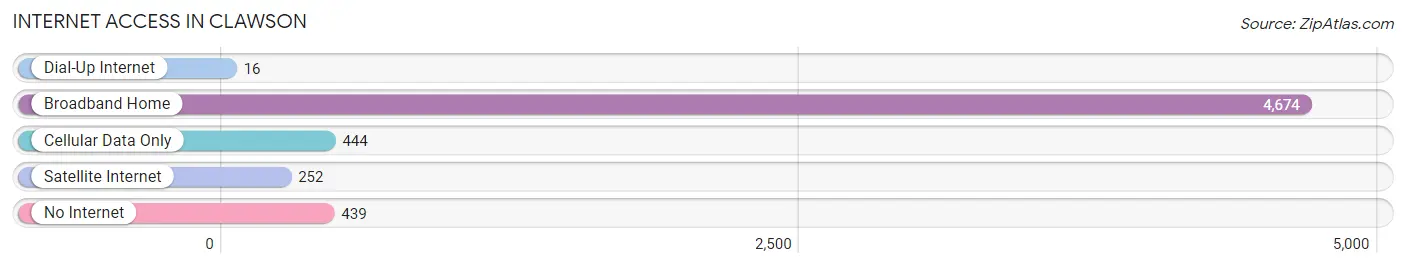
| Internet Type | # Households | % Households |
| Dial-Up Internet | 16 | 0.3% |
| Broadband Home | 4,674 | 80.5% |
| Cellular Data Only | 444 | 7.6% |
| Satellite Internet | 252 | 4.3% |
| No Internet | 439 | 7.6% |
| Total | 5,806 | 100.0% |
Clawson Summary
Clawson, Michigan is a small city located in Oakland County, Michigan. It is a suburb of Detroit and is part of the Detroit metropolitan area. The city has a population of 11,825 as of the 2010 census.
History
Clawson was first settled in 1829 by John Clawson, a farmer from New York. He purchased land from the government and built a log cabin on the site. The area was known as Clawsonville until 1885 when it was incorporated as a village. The village was named after John Clawson and was the first village in Oakland County to be incorporated.
In the late 19th century, the village grew rapidly due to the influx of German and Polish immigrants. The village was known for its brickyards and breweries. In the early 20th century, the village was home to several automobile factories, including the Packard Motor Car Company.
In the 1950s, the village was incorporated as a city. The city has since grown and developed into a thriving suburb of Detroit.
Geography
Clawson is located in Oakland County, Michigan. It is situated on the north side of the Detroit River, about 15 miles north of downtown Detroit. The city covers an area of 2.3 square miles and has a population density of 5,093 people per square mile.
The city is bordered by Troy to the north, Royal Oak to the east, Madison Heights to the south, and Birmingham to the west. Clawson is located in the Huron River watershed and is home to several small lakes and ponds.
Economy
Clawson is a primarily residential city, but it does have a few businesses. The city is home to several small businesses, including restaurants, retail stores, and professional services. The city is also home to several automotive suppliers, including the Packard Motor Car Company.
The city has a median household income of $50,845 and a poverty rate of 8.3%. The unemployment rate is 4.2%.
Demographics
As of the 2010 census, the population of Clawson was 11,825. The racial makeup of the city was 87.3% White, 5.2% African American, 0.3% Native American, 2.2% Asian, 0.1% Pacific Islander, and 4.9% from other races. Hispanic or Latino of any race were 6.2% of the population.
The median age in Clawson is 40.7 years. About 24.3% of the population is under the age of 18, and 11.2% is 65 years or older. The gender makeup of the city is 48.7% male and 51.3% female.
Conclusion
Clawson, Michigan is a small city located in Oakland County, Michigan. It is a suburb of Detroit and is part of the Detroit metropolitan area. The city has a population of 11,825 as of the 2010 census. Clawson was first settled in 1829 by John Clawson and was the first village in Oakland County to be incorporated. The city has since grown and developed into a thriving suburb of Detroit. The city is primarily residential, but it does have a few businesses. The median household income is $50,845 and the poverty rate is 8.3%. The racial makeup of the city is 87.3% White, 5.2% African American, 0.3% Native American, 2.2% Asian, 0.1% Pacific Islander, and 4.9% from other races. The median age in Clawson is 40.7 years.
Common Questions
What is Per Capita Income in Clawson?
Per Capita income in Clawson is $50,687.
What is the Median Family Income in Clawson?
Median Family Income in Clawson is $104,662.
What is the Median Household income in Clawson?
Median Household Income in Clawson is $82,713.
What is Income or Wage Gap in Clawson?
Income or Wage Gap in Clawson is 21.8%.
Women in Clawson earn 78.2 cents for every dollar earned by a man.
What is Inequality or Gini Index in Clawson?
Inequality or Gini Index in Clawson is 0.40.
What is the Total Population of Clawson?
Total Population of Clawson is 11,388.
What is the Total Male Population of Clawson?
Total Male Population of Clawson is 5,877.
What is the Total Female Population of Clawson?
Total Female Population of Clawson is 5,511.
What is the Ratio of Males per 100 Females in Clawson?
There are 106.64 Males per 100 Females in Clawson.
What is the Ratio of Females per 100 Males in Clawson?
There are 93.77 Females per 100 Males in Clawson.
What is the Median Population Age in Clawson?
Median Population Age in Clawson is 41.3 Years.
What is the Average Family Size in Clawson
Average Family Size in Clawson is 2.7 People.
What is the Average Household Size in Clawson
Average Household Size in Clawson is 1.9 People.
How Large is the Labor Force in Clawson?
There are 6,866 People in the Labor Forcein in Clawson.
What is the Percentage of People in the Labor Force in Clawson?
69.3% of People are in the Labor Force in Clawson.
What is the Unemployment Rate in Clawson?
Unemployment Rate in Clawson is 4.2%.