Delton, MI Map & Demographics
Delton Map
Delton Overview
$48,844
PER CAPITA INCOME
$105,156
AVG FAMILY INCOME
$85,109
AVG HOUSEHOLD INCOME
0.33
INEQUALITY / GINI INDEX
562
TOTAL POPULATION
251
MALE POPULATION
311
FEMALE POPULATION
80.71
MALES / 100 FEMALES
123.90
FEMALES / 100 MALES
59.4
MEDIAN AGE
2.2
AVG FAMILY SIZE
2.0
AVG HOUSEHOLD SIZE
263
LABOR FORCE [ PEOPLE ]
48.6%
PERCENT IN LABOR FORCE
Delton Zip Codes
Delton Area Codes
Income in Delton
Income Overview in Delton
Per Capita Income in Delton is $48,844, while median incomes of families and households are $105,156 and $85,109 respectively.
| Characteristic | Number | Measure |
| Per Capita Income | 562 | $48,844 |
| Median Family Income | 151 | $105,156 |
| Mean Family Income | 151 | $124,255 |
| Median Household Income | 286 | $85,109 |
| Mean Household Income | 286 | $95,210 |
| Income Deficit | 151 | $0 |
| Wage / Income Gap (%) | 562 | 0.00% |
| Wage / Income Gap ($) | 562 | 100.00¢ per $1 |
| Gini / Inequality Index | 562 | 0.33 |
Earnings by Sex in Delton
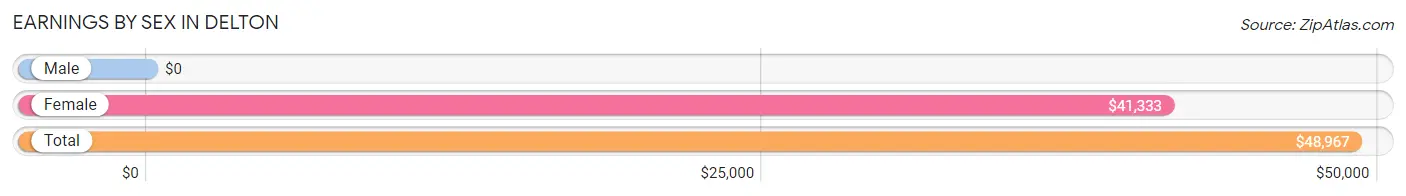
| Sex | Number | Average Earnings |
| Male | 105 (39.9%) | $0 |
| Female | 158 (60.1%) | $41,333 |
| Total | 263 (100.0%) | $48,967 |
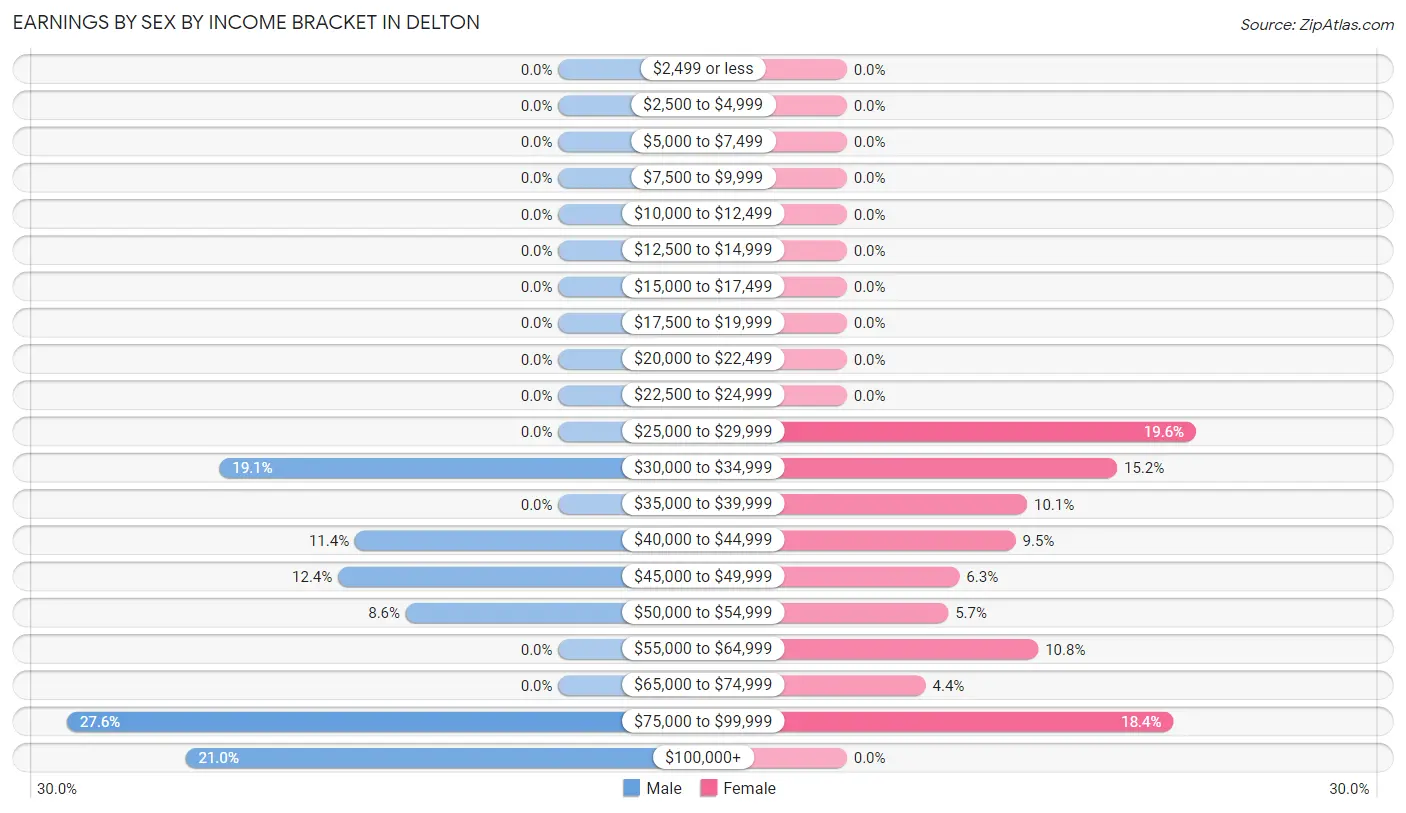
Earnings by Sex by Income Bracket in Delton
The most common earnings brackets in Delton are $75,000 to $99,999 for men (29 | 27.6%) and $25,000 to $29,999 for women (31 | 19.6%).
| Income | Male | Female |
| $2,499 or less | 0 (0.0%) | 0 (0.0%) |
| $2,500 to $4,999 | 0 (0.0%) | 0 (0.0%) |
| $5,000 to $7,499 | 0 (0.0%) | 0 (0.0%) |
| $7,500 to $9,999 | 0 (0.0%) | 0 (0.0%) |
| $10,000 to $12,499 | 0 (0.0%) | 0 (0.0%) |
| $12,500 to $14,999 | 0 (0.0%) | 0 (0.0%) |
| $15,000 to $17,499 | 0 (0.0%) | 0 (0.0%) |
| $17,500 to $19,999 | 0 (0.0%) | 0 (0.0%) |
| $20,000 to $22,499 | 0 (0.0%) | 0 (0.0%) |
| $22,500 to $24,999 | 0 (0.0%) | 0 (0.0%) |
| $25,000 to $29,999 | 0 (0.0%) | 31 (19.6%) |
| $30,000 to $34,999 | 20 (19.1%) | 24 (15.2%) |
| $35,000 to $39,999 | 0 (0.0%) | 16 (10.1%) |
| $40,000 to $44,999 | 12 (11.4%) | 15 (9.5%) |
| $45,000 to $49,999 | 13 (12.4%) | 10 (6.3%) |
| $50,000 to $54,999 | 9 (8.6%) | 9 (5.7%) |
| $55,000 to $64,999 | 0 (0.0%) | 17 (10.8%) |
| $65,000 to $74,999 | 0 (0.0%) | 7 (4.4%) |
| $75,000 to $99,999 | 29 (27.6%) | 29 (18.3%) |
| $100,000+ | 22 (20.9%) | 0 (0.0%) |
| Total | 105 (100.0%) | 158 (100.0%) |
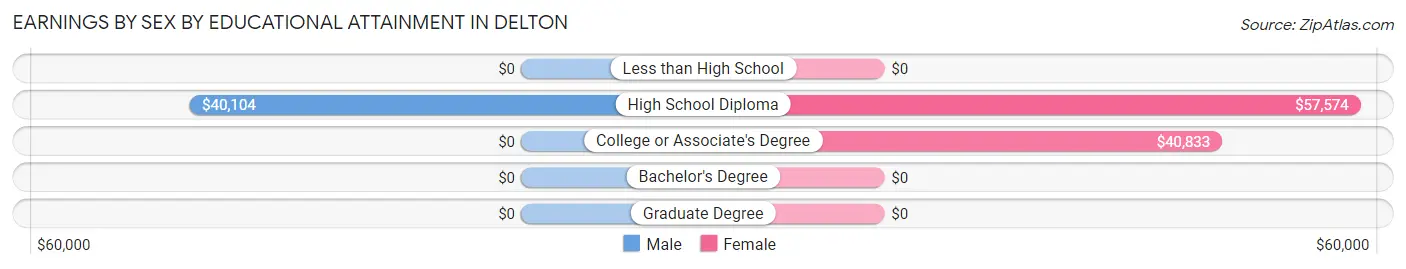
Earnings by Sex by Educational Attainment in Delton
Average earnings in Delton are $85,893 for men and $48,000 for women, a difference of 44.1%. Men with an educational attainment of high school diploma enjoy the highest average annual earnings of $40,104, while those with high school diploma education earn the least with $40,104. Women with an educational attainment of high school diploma earn the most with the average annual earnings of $57,574, while those with college or associate's degree education have the smallest earnings of $40,833.
| Educational Attainment | Male Income | Female Income |
| Less than High School | - | - |
| High School Diploma | $40,104 | $57,574 |
| College or Associate's Degree | - | - |
| Bachelor's Degree | - | - |
| Graduate Degree | - | - |
| Total | $85,893 | $48,000 |
Family Income in Delton
Family Income Brackets in Delton
According to the Delton family income data, there are 54 families falling into the $75,000 to $99,999 income range, which is the most common income bracket and makes up 35.8% of all families.
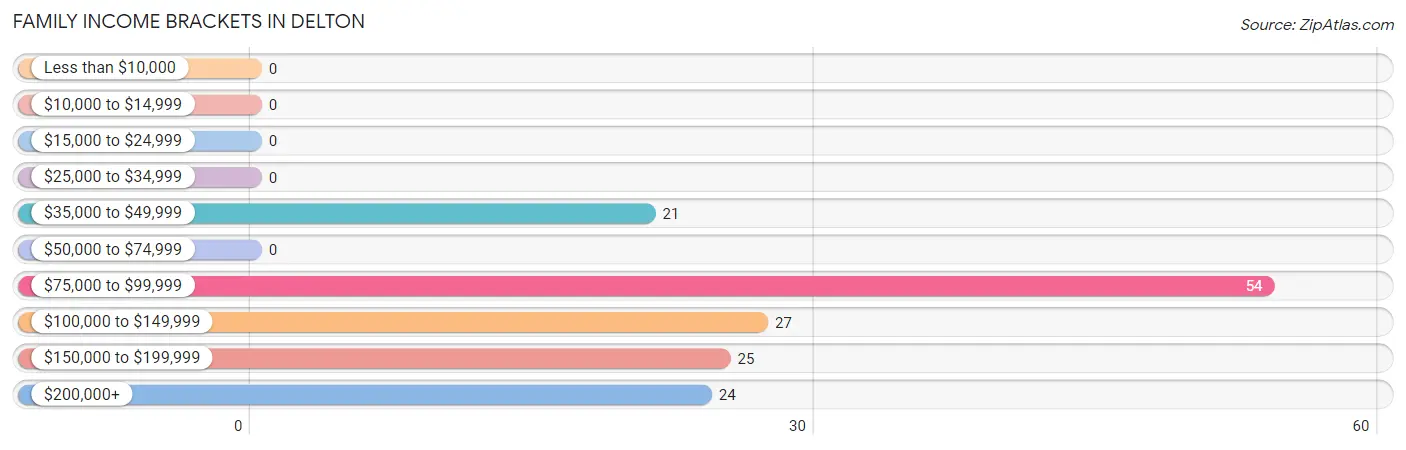
| Income Bracket | # Families | % Families |
| Less than $10,000 | 0 | 0.0% |
| $10,000 to $14,999 | 0 | 0.0% |
| $15,000 to $24,999 | 0 | 0.0% |
| $25,000 to $34,999 | 0 | 0.0% |
| $35,000 to $49,999 | 21 | 13.9% |
| $50,000 to $74,999 | 0 | 0.0% |
| $75,000 to $99,999 | 54 | 35.8% |
| $100,000 to $149,999 | 27 | 17.9% |
| $150,000 to $199,999 | 25 | 16.6% |
| $200,000+ | 24 | 15.9% |
Family Income by Famaliy Size in Delton
2-person families (129 | 85.4%) account for the highest median family income in Delton with $94,583 per family, while 2-person families (129 | 85.4%) have the highest median income of $47,292 per family member.
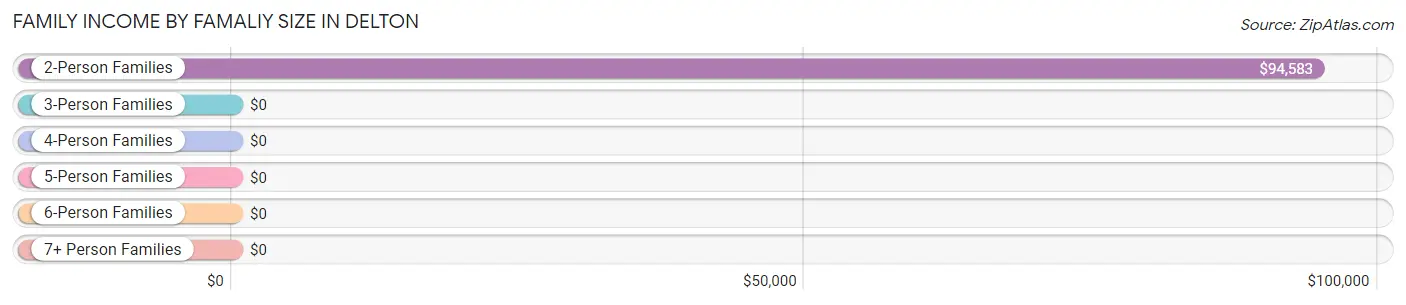
| Income Bracket | # Families | Median Income |
| 2-Person Families | 129 (85.4%) | $94,583 |
| 3-Person Families | 15 (9.9%) | $0 |
| 4-Person Families | 7 (4.6%) | $0 |
| 5-Person Families | 0 (0.0%) | $0 |
| 6-Person Families | 0 (0.0%) | $0 |
| 7+ Person Families | 0 (0.0%) | $0 |
| Total | 151 (100.0%) | $105,156 |
Family Income by Number of Earners in Delton
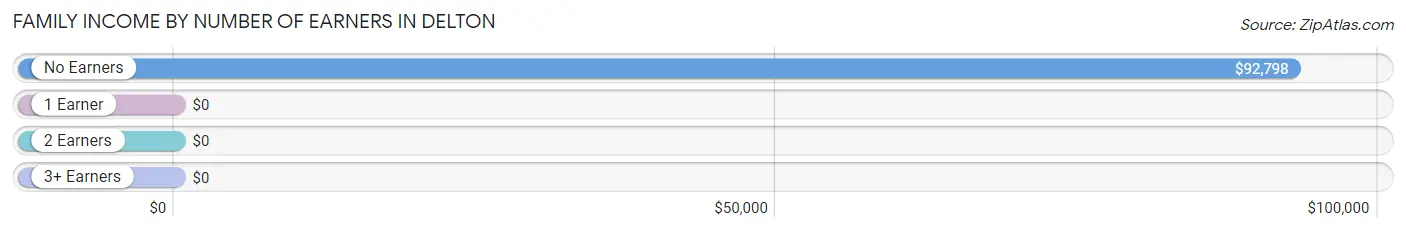
| Number of Earners | # Families | Median Income |
| No Earners | 53 (35.1%) | $92,798 |
| 1 Earner | 14 (9.3%) | $0 |
| 2 Earners | 69 (45.7%) | $0 |
| 3+ Earners | 15 (9.9%) | $0 |
| Total | 151 (100.0%) | $105,156 |
Household Income in Delton
Household Income Brackets in Delton
With 70 households falling in the category, the $35,000 to $49,999 income range is the most frequent in Delton, accounting for 24.5% of all households.
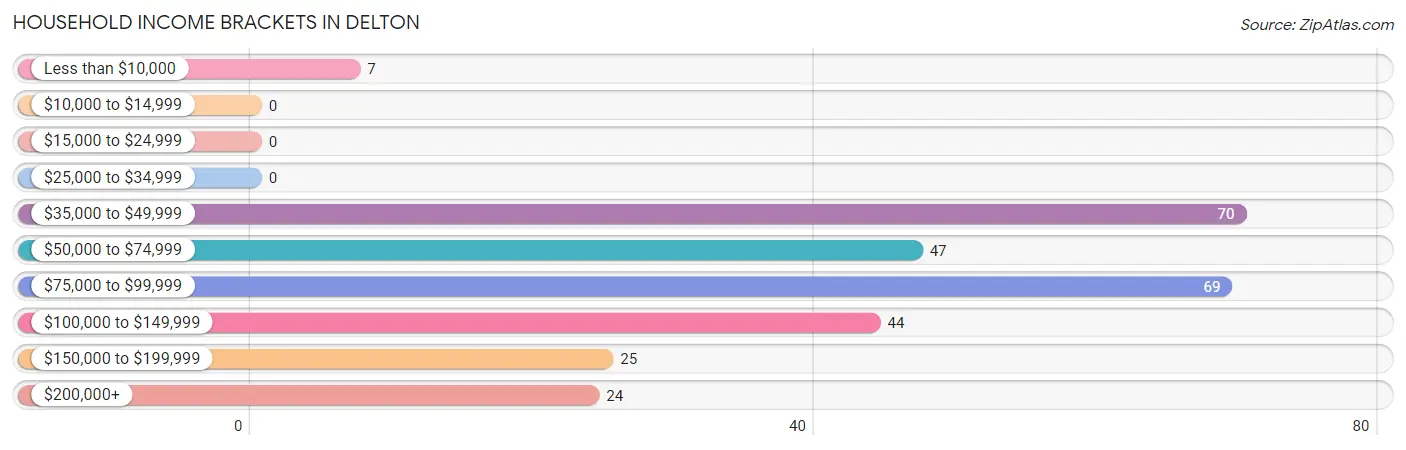
| Income Bracket | # Households | % Households |
| Less than $10,000 | 7 | 2.4% |
| $10,000 to $14,999 | 0 | 0.0% |
| $15,000 to $24,999 | 0 | 0.0% |
| $25,000 to $34,999 | 0 | 0.0% |
| $35,000 to $49,999 | 70 | 24.5% |
| $50,000 to $74,999 | 47 | 16.4% |
| $75,000 to $99,999 | 69 | 24.1% |
| $100,000 to $149,999 | 44 | 15.4% |
| $150,000 to $199,999 | 25 | 8.7% |
| $200,000+ | 24 | 8.4% |
Household Income by Householder Age in Delton
The median household income in Delton is $85,109, with the highest median household income of $111,250 found in the 45 to 64 years age bracket for the primary householder. A total of 170 households (59.4%) fall into this category. Meanwhile, the 15 to 24 years age bracket for the primary householder has the lowest median household income of $0, with 13 households (4.5%) in this group.
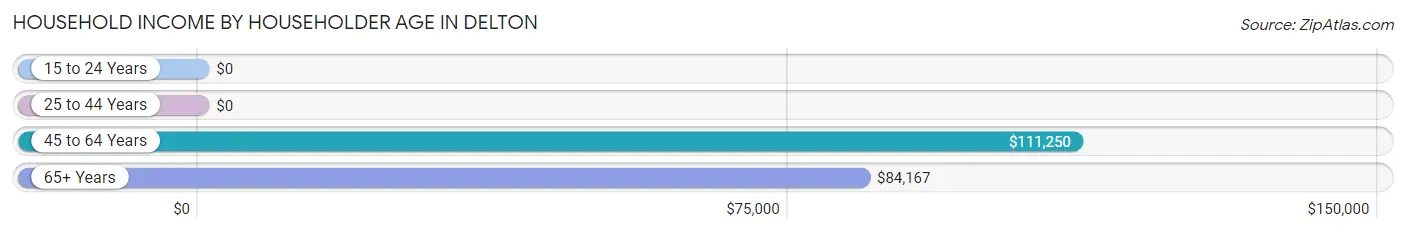
| Income Bracket | # Households | Median Income |
| 15 to 24 Years | 13 (4.5%) | $0 |
| 25 to 44 Years | 15 (5.2%) | $0 |
| 45 to 64 Years | 170 (59.4%) | $111,250 |
| 65+ Years | 88 (30.8%) | $84,167 |
| Total | 286 (100.0%) | $85,109 |
Poverty in Delton
Income Below Poverty by Sex and Age in Delton
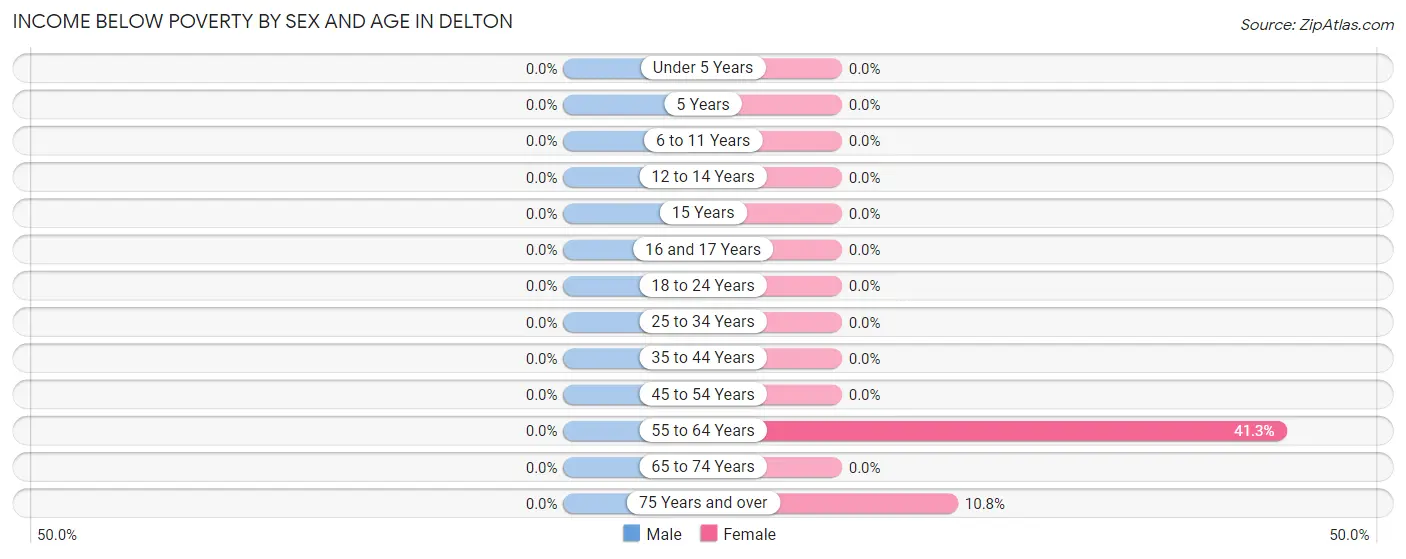
| Age Bracket | Male | Female |
| Under 5 Years | 0 (0.0%) | 0 (0.0%) |
| 5 Years | 0 (0.0%) | 0 (0.0%) |
| 6 to 11 Years | 0 (0.0%) | 0 (0.0%) |
| 12 to 14 Years | 0 (0.0%) | 0 (0.0%) |
| 15 Years | 0 (0.0%) | 0 (0.0%) |
| 16 and 17 Years | 0 (0.0%) | 0 (0.0%) |
| 18 to 24 Years | 0 (0.0%) | 0 (0.0%) |
| 25 to 34 Years | 0 (0.0%) | 0 (0.0%) |
| 35 to 44 Years | 0 (0.0%) | 0 (0.0%) |
| 45 to 54 Years | 0 (0.0%) | 0 (0.0%) |
| 55 to 64 Years | 0 (0.0%) | 66 (41.2%) |
| 65 to 74 Years | 0 (0.0%) | 0 (0.0%) |
| 75 Years and over | 0 (0.0%) | 7 (10.8%) |
| Total | 0 (0.0%) | 73 (23.5%) |
Income Above Poverty by Sex and Age in Delton
According to the poverty statistics in Delton, males aged 15 years and females aged 6 to 11 years are the age groups that are most secure financially, with 100.0% of males and 100.0% of females in these age groups living above the poverty line.
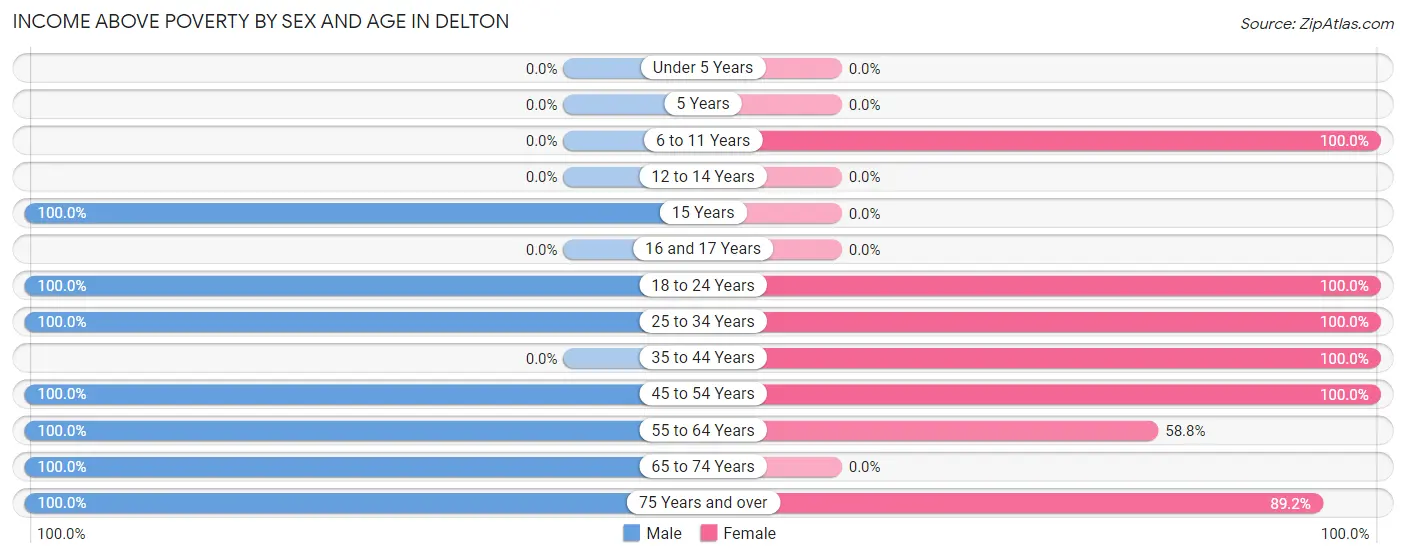
| Age Bracket | Male | Female |
| Under 5 Years | 0 (0.0%) | 0 (0.0%) |
| 5 Years | 0 (0.0%) | 0 (0.0%) |
| 6 to 11 Years | 0 (0.0%) | 13 (100.0%) |
| 12 to 14 Years | 0 (0.0%) | 0 (0.0%) |
| 15 Years | 8 (100.0%) | 0 (0.0%) |
| 16 and 17 Years | 0 (0.0%) | 0 (0.0%) |
| 18 to 24 Years | 13 (100.0%) | 18 (100.0%) |
| 25 to 34 Years | 20 (100.0%) | 16 (100.0%) |
| 35 to 44 Years | 0 (0.0%) | 21 (100.0%) |
| 45 to 54 Years | 46 (100.0%) | 18 (100.0%) |
| 55 to 64 Years | 73 (100.0%) | 94 (58.8%) |
| 65 to 74 Years | 46 (100.0%) | 0 (0.0%) |
| 75 Years and over | 45 (100.0%) | 58 (89.2%) |
| Total | 251 (100.0%) | 238 (76.5%) |
Income Below Poverty Among Married-Couple Families in Delton
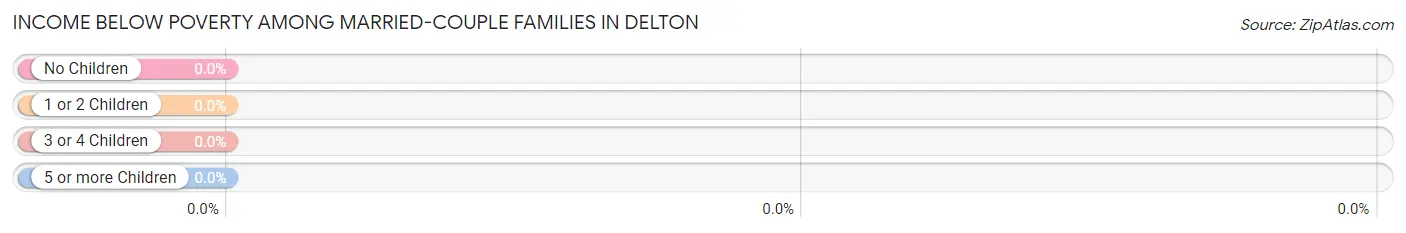
| Children | Above Poverty | Below Poverty |
| No Children | 113 (100.0%) | 0 (0.0%) |
| 1 or 2 Children | 0 (0.0%) | 0 (0.0%) |
| 3 or 4 Children | 0 (0.0%) | 0 (0.0%) |
| 5 or more Children | 0 (0.0%) | 0 (0.0%) |
| Total | 113 (100.0%) | 0 (0.0%) |
Income Below Poverty Among Single-Parent Households in Delton
| Children | Single Father | Single Mother |
| No Children | 0 (0.0%) | 0 (0.0%) |
| 1 or 2 Children | 0 (0.0%) | 0 (0.0%) |
| 3 or 4 Children | 0 (0.0%) | 0 (0.0%) |
| 5 or more Children | 0 (0.0%) | 0 (0.0%) |
| Total | 0 (0.0%) | 0 (0.0%) |
Income Below Poverty Among Married-Couple vs Single-Parent Households in Delton
| Children | Married-Couple Families | Single-Parent Households |
| No Children | 0 (0.0%) | 0 (0.0%) |
| 1 or 2 Children | 0 (0.0%) | 0 (0.0%) |
| 3 or 4 Children | 0 (0.0%) | 0 (0.0%) |
| 5 or more Children | 0 (0.0%) | 0 (0.0%) |
| Total | 0 (0.0%) | 0 (0.0%) |
Race in Delton
The most populous races in Delton are White / Caucasian (549 | 97.7%), and Two or more Races (13 | 2.3%).
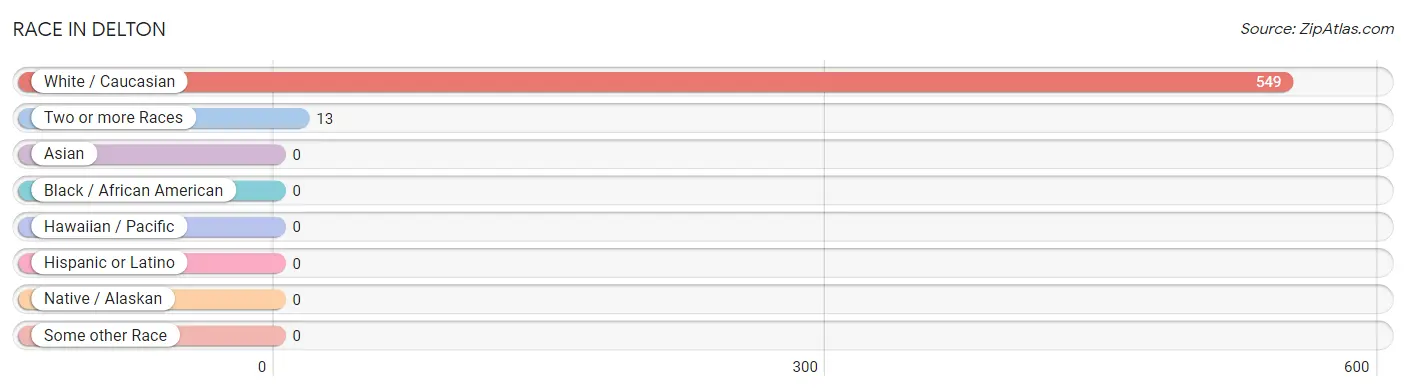
| Race | # Population | % Population |
| Asian | 0 | 0.0% |
| Black / African American | 0 | 0.0% |
| Hawaiian / Pacific | 0 | 0.0% |
| Hispanic or Latino | 0 | 0.0% |
| Native / Alaskan | 0 | 0.0% |
| White / Caucasian | 549 | 97.7% |
| Two or more Races | 13 | 2.3% |
| Some other Race | 0 | 0.0% |
| Total | 562 | 100.0% |
Ancestry in Delton
The most populous ancestries reported in Delton are German (180 | 32.0%), English (83 | 14.8%), Swedish (50 | 8.9%), Scottish (46 | 8.2%), and Polish (40 | 7.1%), together accounting for 71.0% of all Delton residents.
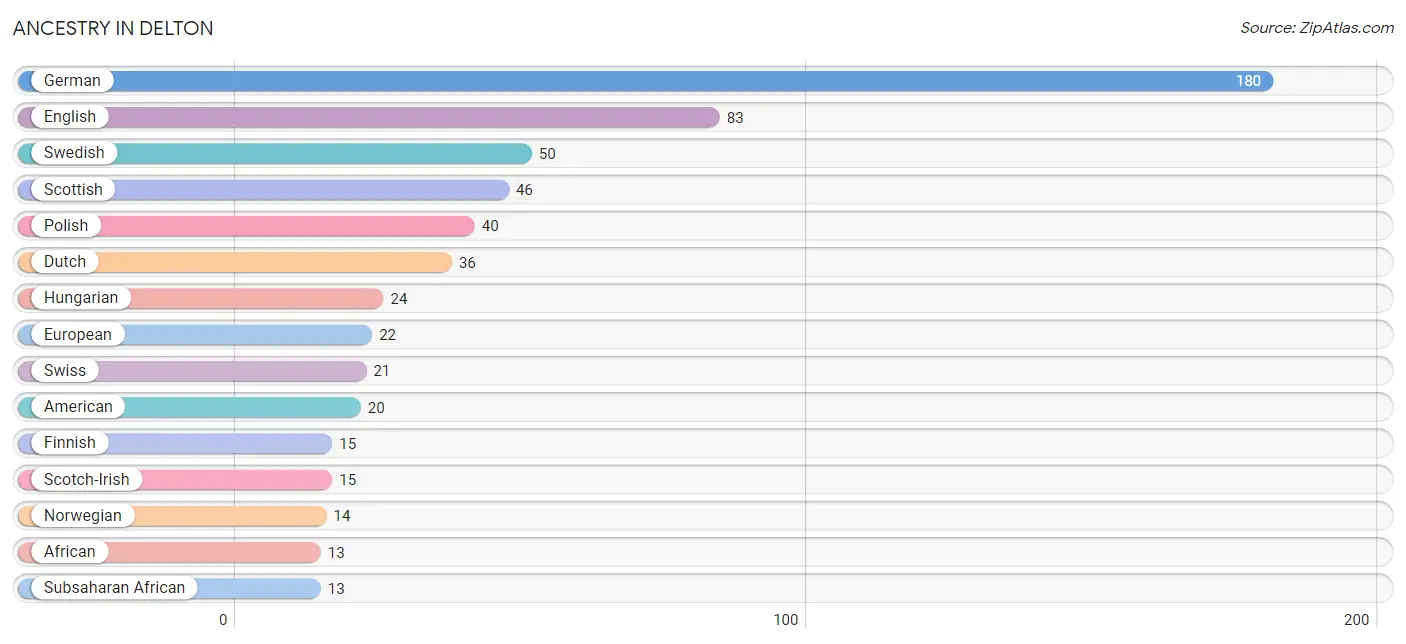
| Ancestry | # Population | % Population |
| African | 13 | 2.3% |
| American | 20 | 3.6% |
| Czech | 9 | 1.6% |
| Dutch | 36 | 6.4% |
| English | 83 | 14.8% |
| European | 22 | 3.9% |
| Finnish | 15 | 2.7% |
| German | 180 | 32.0% |
| Hungarian | 24 | 4.3% |
| Irish | 9 | 1.6% |
| Norwegian | 14 | 2.5% |
| Polish | 40 | 7.1% |
| Scotch-Irish | 15 | 2.7% |
| Scottish | 46 | 8.2% |
| Subsaharan African | 13 | 2.3% |
| Swedish | 50 | 8.9% |
| Swiss | 21 | 3.7% | View All 17 Rows |
Immigrants in Delton

| Immigration Origin | # Population | % Population | View All 0 Rows |
Sex and Age in Delton
Sex and Age in Delton
The most populous age groups in Delton are 60 to 64 Years (50 | 19.9%) for men and 55 to 59 Years (101 | 32.5%) for women.
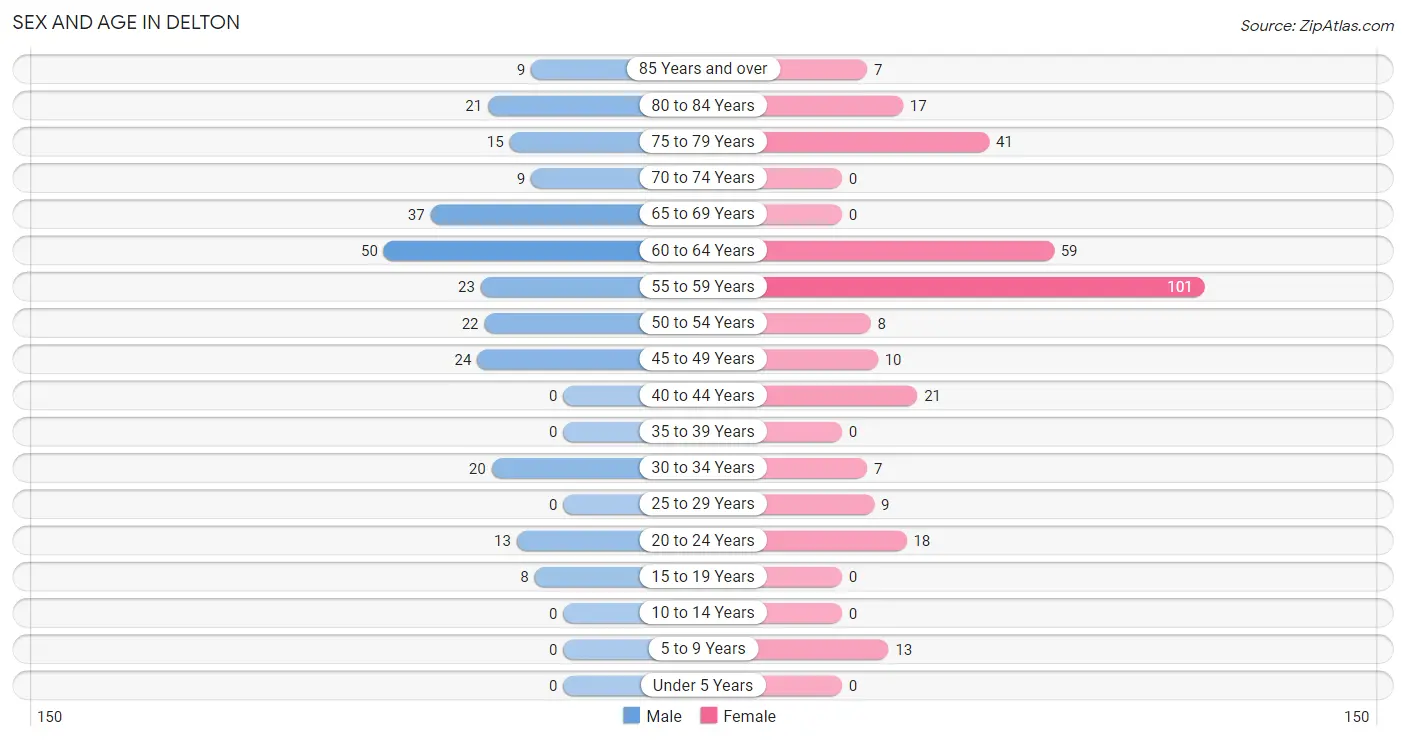
| Age Bracket | Male | Female |
| Under 5 Years | 0 (0.0%) | 0 (0.0%) |
| 5 to 9 Years | 0 (0.0%) | 13 (4.2%) |
| 10 to 14 Years | 0 (0.0%) | 0 (0.0%) |
| 15 to 19 Years | 8 (3.2%) | 0 (0.0%) |
| 20 to 24 Years | 13 (5.2%) | 18 (5.8%) |
| 25 to 29 Years | 0 (0.0%) | 9 (2.9%) |
| 30 to 34 Years | 20 (8.0%) | 7 (2.2%) |
| 35 to 39 Years | 0 (0.0%) | 0 (0.0%) |
| 40 to 44 Years | 0 (0.0%) | 21 (6.8%) |
| 45 to 49 Years | 24 (9.6%) | 10 (3.2%) |
| 50 to 54 Years | 22 (8.8%) | 8 (2.6%) |
| 55 to 59 Years | 23 (9.2%) | 101 (32.5%) |
| 60 to 64 Years | 50 (19.9%) | 59 (19.0%) |
| 65 to 69 Years | 37 (14.7%) | 0 (0.0%) |
| 70 to 74 Years | 9 (3.6%) | 0 (0.0%) |
| 75 to 79 Years | 15 (6.0%) | 41 (13.2%) |
| 80 to 84 Years | 21 (8.4%) | 17 (5.5%) |
| 85 Years and over | 9 (3.6%) | 7 (2.2%) |
| Total | 251 (100.0%) | 311 (100.0%) |
Families and Households in Delton
Median Family Size in Delton
The median family size in Delton is 2.20 persons per family, with single female/mother families (30 | 19.9%) accounting for the largest median family size of 2.6 persons per family. On the other hand, married-couple families (113 | 74.8%) represent the smallest median family size with 2.10 persons per family.
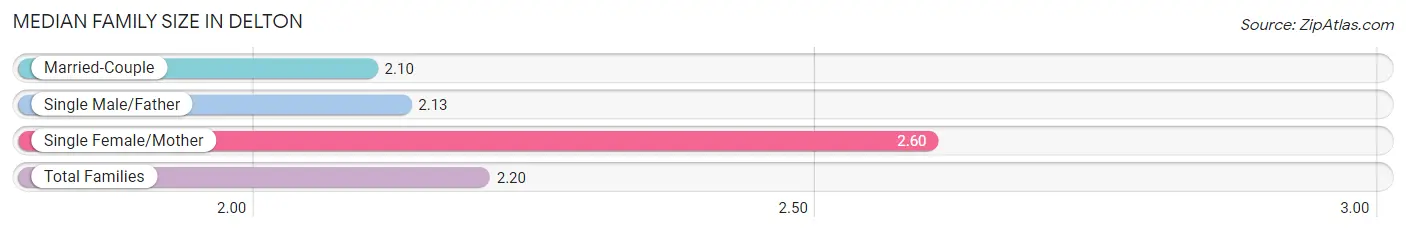
| Family Type | # Families | Family Size |
| Married-Couple | 113 (74.8%) | 2.10 |
| Single Male/Father | 8 (5.3%) | 2.13 |
| Single Female/Mother | 30 (19.9%) | 2.60 |
| Total Families | 151 (100.0%) | 2.20 |
Median Household Size in Delton
The median household size in Delton is 1.97 persons per household, with single female/mother households (30 | 10.5%) accounting for the largest median household size of 3.27 persons per household. non-family households (135 | 47.2%) represent the smallest median household size with 1.56 persons per household.
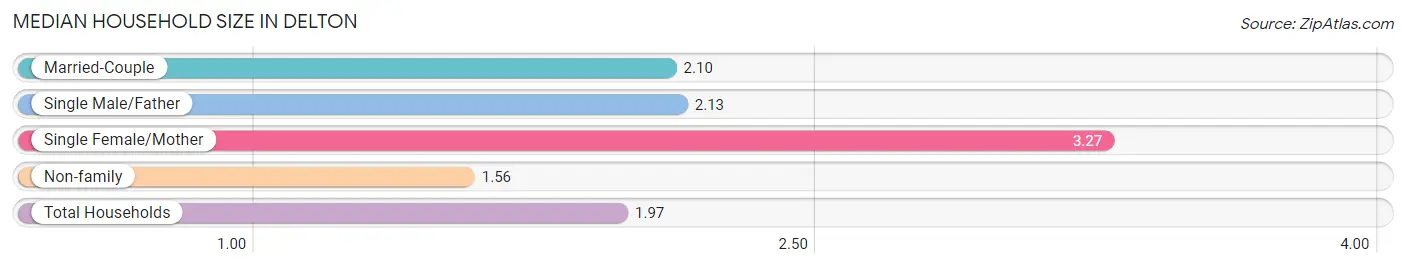
| Household Type | # Households | Household Size |
| Married-Couple | 113 (39.5%) | 2.10 |
| Single Male/Father | 8 (2.8%) | 2.13 |
| Single Female/Mother | 30 (10.5%) | 3.27 |
| Non-family | 135 (47.2%) | 1.56 |
| Total Households | 286 (100.0%) | 1.97 |
Household Size by Marriage Status in Delton
Out of a total of 286 households in Delton, 151 (52.8%) are family households, while 135 (47.2%) are nonfamily households. The most numerous type of family households are 2-person households, comprising 112, and the most common type of nonfamily households are 1-person households, comprising 117.
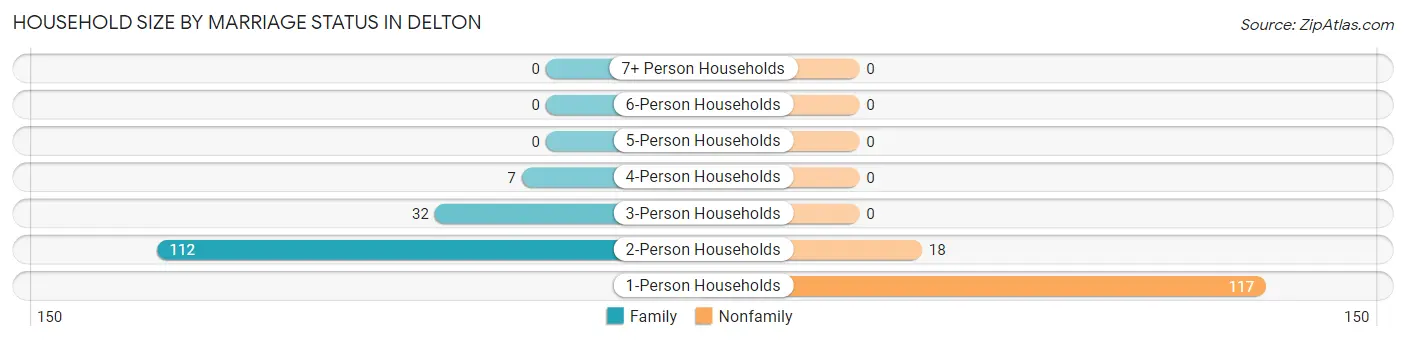
| Household Size | Family Households | Nonfamily Households |
| 1-Person Households | - | 117 (40.9%) |
| 2-Person Households | 112 (39.2%) | 18 (6.3%) |
| 3-Person Households | 32 (11.2%) | 0 (0.0%) |
| 4-Person Households | 7 (2.5%) | 0 (0.0%) |
| 5-Person Households | 0 (0.0%) | 0 (0.0%) |
| 6-Person Households | 0 (0.0%) | 0 (0.0%) |
| 7+ Person Households | 0 (0.0%) | 0 (0.0%) |
| Total | 151 (52.8%) | 135 (47.2%) |
Female Fertility in Delton
Fertility by Age in Delton
| Age Bracket | Women with Births | Births / 1,000 Women |
| 15 to 19 years | 0 (0.0%) | 0.0 |
| 20 to 34 years | 0 (0.0%) | 0.0 |
| 35 to 50 years | 0 (0.0%) | 0.0 |
| Total | 0 (0.0%) | 0.0 |
Fertility by Age by Marriage Status in Delton
| Age Bracket | Married | Unmarried |
| 15 to 19 years | 0 (0.0%) | 0 (0.0%) |
| 20 to 34 years | 0 (0.0%) | 0 (0.0%) |
| 35 to 50 years | 0 (0.0%) | 0 (0.0%) |
| Total | 0 (0.0%) | 0 (0.0%) |
Fertility by Education in Delton
| Educational Attainment | Women with Births | Births / 1,000 Women |
| Less than High School | 0 (0.0%) | 0.0 |
| High School Diploma | 0 (0.0%) | 0.0 |
| College or Associate's Degree | 0 (0.0%) | 0.0 |
| Bachelor's Degree | 0 (0.0%) | 0.0 |
| Graduate Degree | 0 (0.0%) | 0.0 |
| Total | 0 (0.0%) | 0.0 |
Fertility by Education by Marriage Status in Delton
| Educational Attainment | Married | Unmarried |
| Less than High School | 0 (0.0%) | 0 (0.0%) |
| High School Diploma | 0 (0.0%) | 0 (0.0%) |
| College or Associate's Degree | 0 (0.0%) | 0 (0.0%) |
| Bachelor's Degree | 0 (0.0%) | 0 (0.0%) |
| Graduate Degree | 0 (0.0%) | 0 (0.0%) |
| Total | 0 (0.0%) | 0 (0.0%) |
Employment Characteristics in Delton
Employment by Class of Employer in Delton
Among the 263 employed individuals in Delton, private company employees (182 | 69.2%), not-for-profit organizations (64 | 24.3%), and self-employed (incorporated) (9 | 3.4%) make up the most common classes of employment.
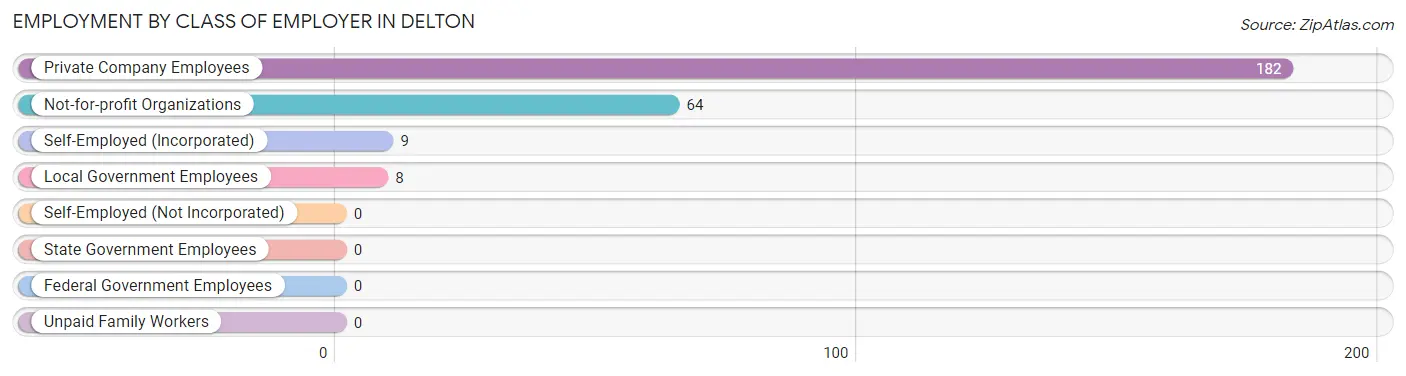
| Employer Class | # Employees | % Employees |
| Private Company Employees | 182 | 69.2% |
| Self-Employed (Incorporated) | 9 | 3.4% |
| Self-Employed (Not Incorporated) | 0 | 0.0% |
| Not-for-profit Organizations | 64 | 24.3% |
| Local Government Employees | 8 | 3.0% |
| State Government Employees | 0 | 0.0% |
| Federal Government Employees | 0 | 0.0% |
| Unpaid Family Workers | 0 | 0.0% |
| Total | 263 | 100.0% |
Employment Status by Age in Delton
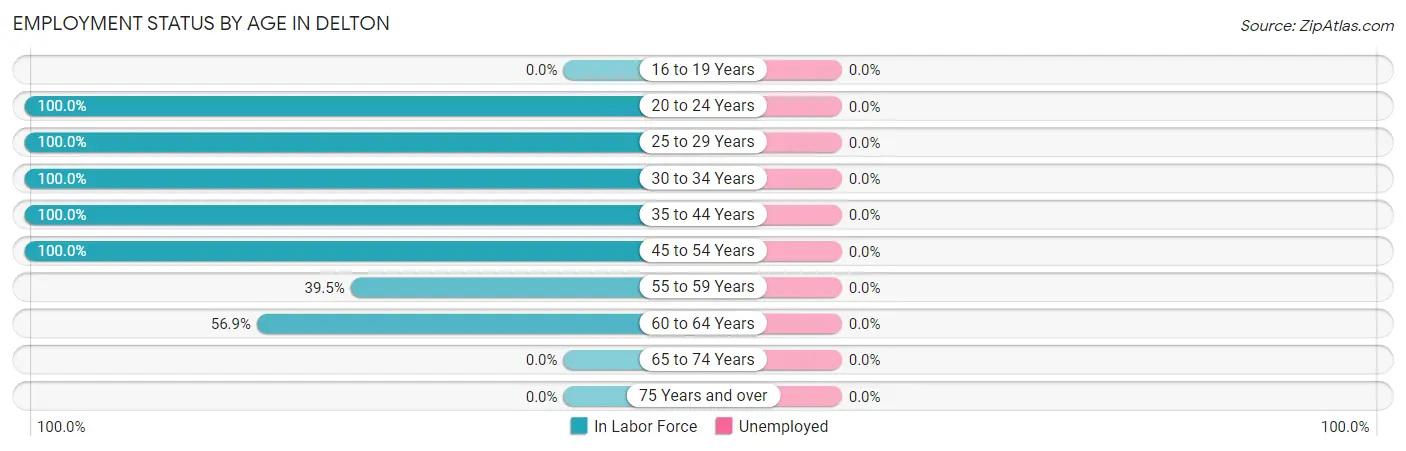
| Age Bracket | In Labor Force | Unemployed |
| 16 to 19 Years | 0 (0.0%) | 0 (0.0%) |
| 20 to 24 Years | 31 (100.0%) | 0 (0.0%) |
| 25 to 29 Years | 9 (100.0%) | 0 (0.0%) |
| 30 to 34 Years | 27 (100.0%) | 0 (0.0%) |
| 35 to 44 Years | 21 (100.0%) | 0 (0.0%) |
| 45 to 54 Years | 64 (100.0%) | 0 (0.0%) |
| 55 to 59 Years | 49 (39.5%) | 0 (0.0%) |
| 60 to 64 Years | 62 (56.9%) | 0 (0.0%) |
| 65 to 74 Years | 0 (0.0%) | 0 (0.0%) |
| 75 Years and over | 0 (0.0%) | 0 (0.0%) |
| Total | 263 (48.6%) | 0 (0.0%) |
Employment Status by Educational Attainment in Delton
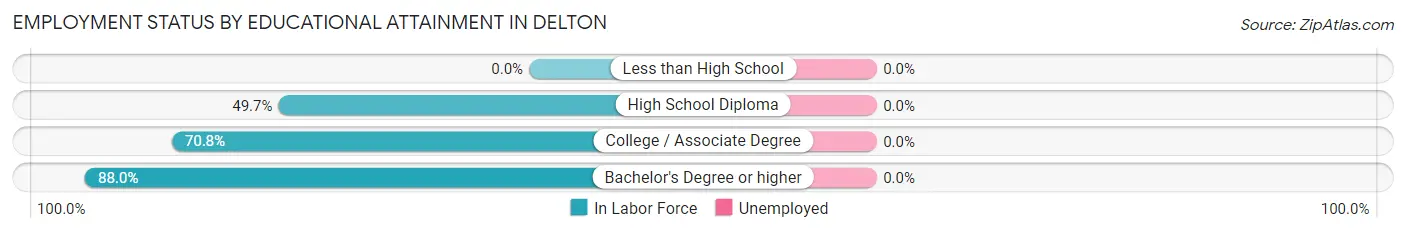
| Educational Attainment | In Labor Force | Unemployed |
| Less than High School | 0 (0.0%) | 0 (0.0%) |
| High School Diploma | 74 (49.7%) | 0 (0.0%) |
| College / Associate Degree | 92 (70.8%) | 0 (0.0%) |
| Bachelor's Degree or higher | 66 (88.0%) | 0 (0.0%) |
| Total | 232 (65.5%) | 0 (0.0%) |
Employment Occupations by Sex in Delton
Management, Business, Science and Arts Occupations
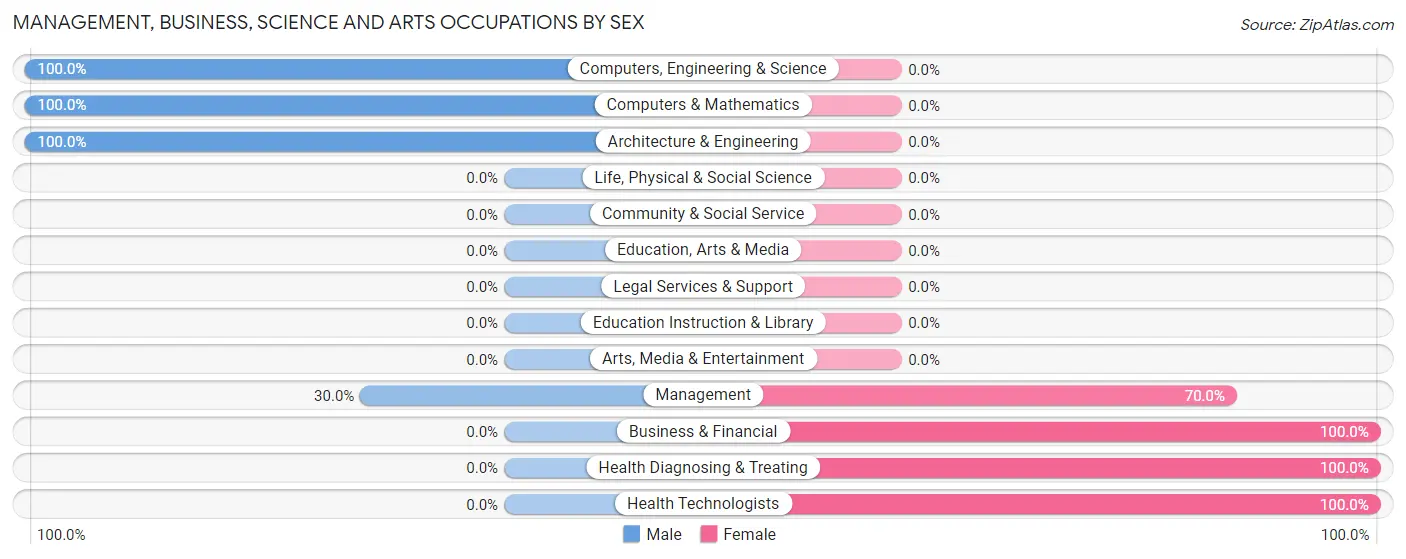
The most common Management, Business, Science and Arts occupations in Delton are Health Diagnosing & Treating (61 | 23.2%), Health Technologists (54 | 20.5%), Computers, Engineering & Science (37 | 14.1%), Management (30 | 11.4%), and Architecture & Engineering (22 | 8.4%).
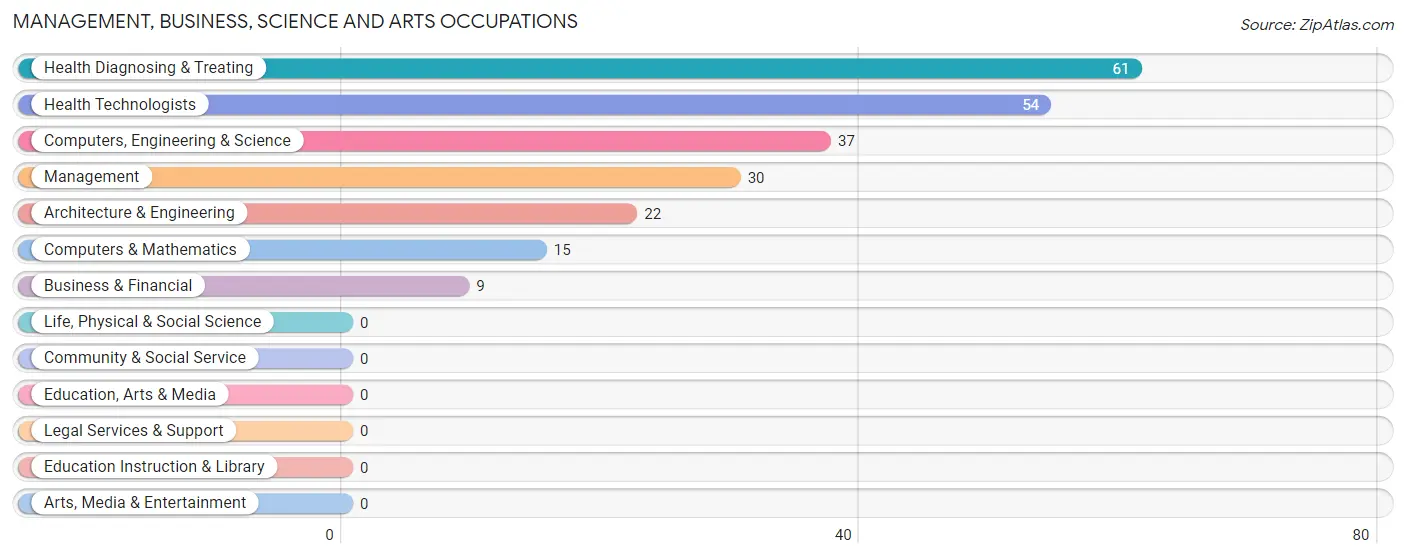
Management, Business, Science and Arts Occupations by Sex
Within the Management, Business, Science and Arts occupations in Delton, the most male-oriented occupations are Computers, Engineering & Science (100.0%), Computers & Mathematics (100.0%), and Architecture & Engineering (100.0%), while the most female-oriented occupations are Business & Financial (100.0%), Health Diagnosing & Treating (100.0%), and Health Technologists (100.0%).
| Occupation | Male | Female |
| Management | 9 (30.0%) | 21 (70.0%) |
| Business & Financial | 0 (0.0%) | 9 (100.0%) |
| Computers, Engineering & Science | 37 (100.0%) | 0 (0.0%) |
| Computers & Mathematics | 15 (100.0%) | 0 (0.0%) |
| Architecture & Engineering | 22 (100.0%) | 0 (0.0%) |
| Life, Physical & Social Science | 0 (0.0%) | 0 (0.0%) |
| Community & Social Service | 0 (0.0%) | 0 (0.0%) |
| Education, Arts & Media | 0 (0.0%) | 0 (0.0%) |
| Legal Services & Support | 0 (0.0%) | 0 (0.0%) |
| Education Instruction & Library | 0 (0.0%) | 0 (0.0%) |
| Arts, Media & Entertainment | 0 (0.0%) | 0 (0.0%) |
| Health Diagnosing & Treating | 0 (0.0%) | 61 (100.0%) |
| Health Technologists | 0 (0.0%) | 54 (100.0%) |
| Total (Category) | 46 (33.6%) | 91 (66.4%) |
| Total (Overall) | 105 (39.9%) | 158 (60.1%) |
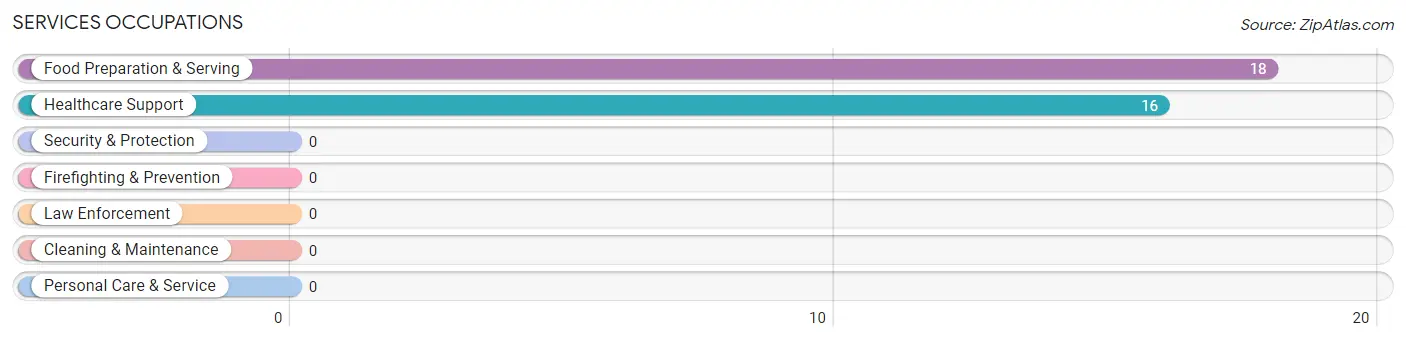
Services Occupations
The most common Services occupations in Delton are Food Preparation & Serving (18 | 6.8%), and Healthcare Support (16 | 6.1%).
Services Occupations by Sex
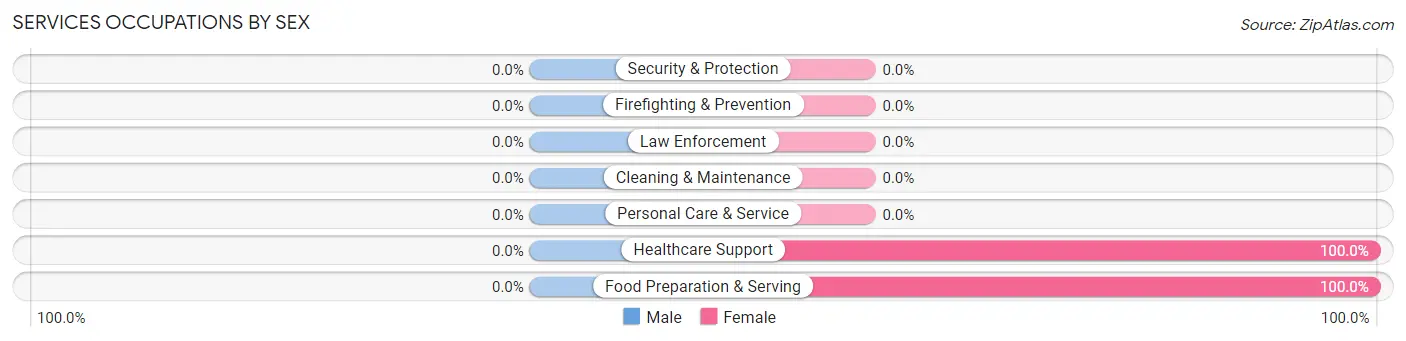
| Occupation | Male | Female |
| Healthcare Support | 0 (0.0%) | 16 (100.0%) |
| Security & Protection | 0 (0.0%) | 0 (0.0%) |
| Firefighting & Prevention | 0 (0.0%) | 0 (0.0%) |
| Law Enforcement | 0 (0.0%) | 0 (0.0%) |
| Food Preparation & Serving | 0 (0.0%) | 18 (100.0%) |
| Cleaning & Maintenance | 0 (0.0%) | 0 (0.0%) |
| Personal Care & Service | 0 (0.0%) | 0 (0.0%) |
| Total (Category) | 0 (0.0%) | 34 (100.0%) |
| Total (Overall) | 105 (39.9%) | 158 (60.1%) |
Sales and Office Occupations
The most common Sales and Office occupations in Delton are Office & Administration (17 | 6.5%), and Sales & Related (10 | 3.8%).

Sales and Office Occupations by Sex

| Occupation | Male | Female |
| Sales & Related | 0 (0.0%) | 10 (100.0%) |
| Office & Administration | 0 (0.0%) | 17 (100.0%) |
| Total (Category) | 0 (0.0%) | 27 (100.0%) |
| Total (Overall) | 105 (39.9%) | 158 (60.1%) |
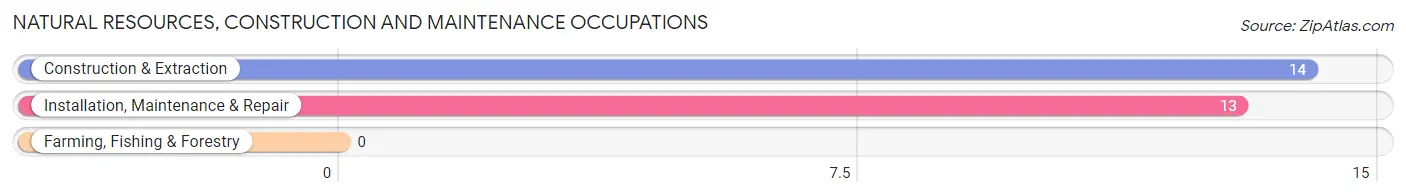
Natural Resources, Construction and Maintenance Occupations
The most common Natural Resources, Construction and Maintenance occupations in Delton are Construction & Extraction (14 | 5.3%), and Installation, Maintenance & Repair (13 | 4.9%).
Natural Resources, Construction and Maintenance Occupations by Sex
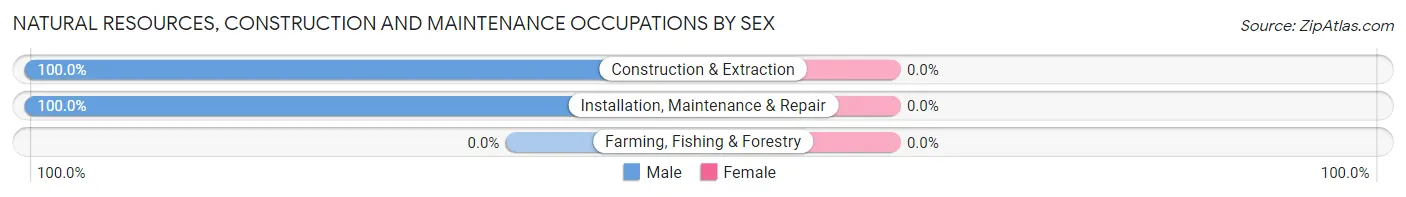
| Occupation | Male | Female |
| Farming, Fishing & Forestry | 0 (0.0%) | 0 (0.0%) |
| Construction & Extraction | 14 (100.0%) | 0 (0.0%) |
| Installation, Maintenance & Repair | 13 (100.0%) | 0 (0.0%) |
| Total (Category) | 27 (100.0%) | 0 (0.0%) |
| Total (Overall) | 105 (39.9%) | 158 (60.1%) |
Production, Transportation and Moving Occupations
The most common Production, Transportation and Moving occupations in Delton are , and Production (38 | 14.4%).
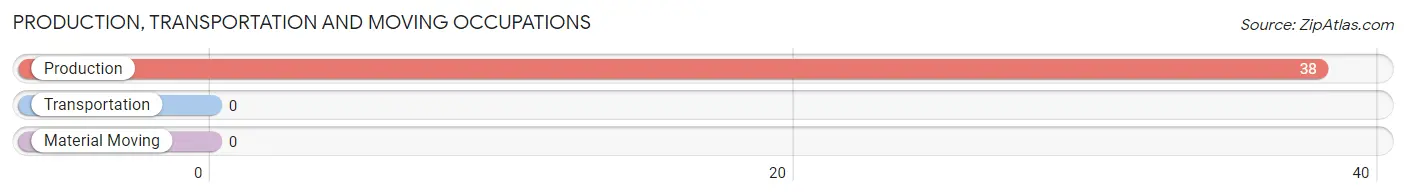
Production, Transportation and Moving Occupations by Sex
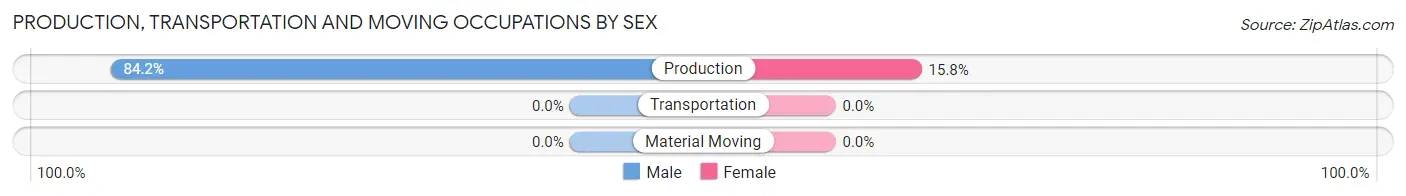
| Occupation | Male | Female |
| Production | 32 (84.2%) | 6 (15.8%) |
| Transportation | 0 (0.0%) | 0 (0.0%) |
| Material Moving | 0 (0.0%) | 0 (0.0%) |
| Total (Category) | 32 (84.2%) | 6 (15.8%) |
| Total (Overall) | 105 (39.9%) | 158 (60.1%) |
Employment Industries by Sex in Delton
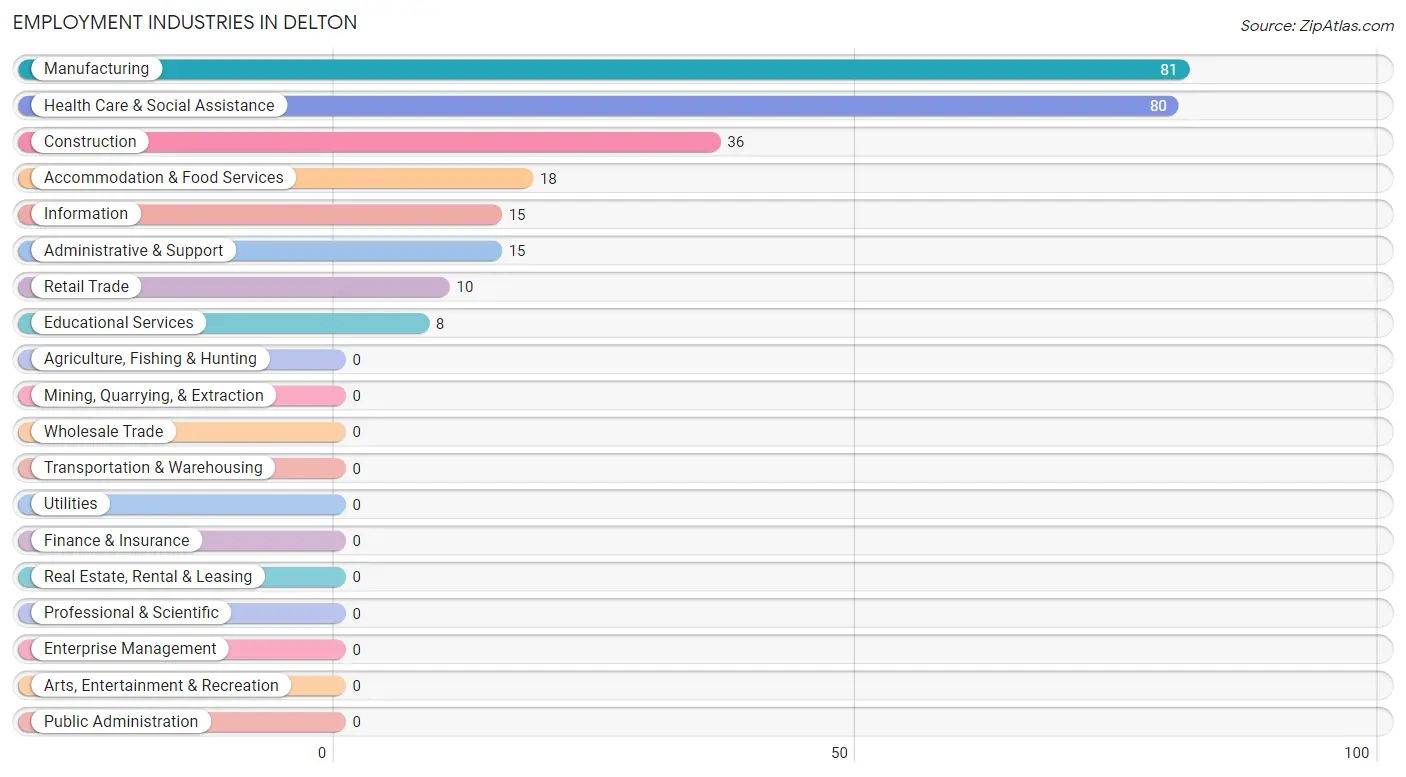
Employment Industries in Delton
The major employment industries in Delton include Manufacturing (81 | 30.8%), Health Care & Social Assistance (80 | 30.4%), Construction (36 | 13.7%), Accommodation & Food Services (18 | 6.8%), and Information (15 | 5.7%).
Employment Industries by Sex in Delton
The Delton industries that see more men than women are Construction (100.0%), Information (100.0%), and Manufacturing (66.7%), whereas the industries that tend to have a higher number of women are Retail Trade (100.0%), Administrative & Support (100.0%), and Educational Services (100.0%).
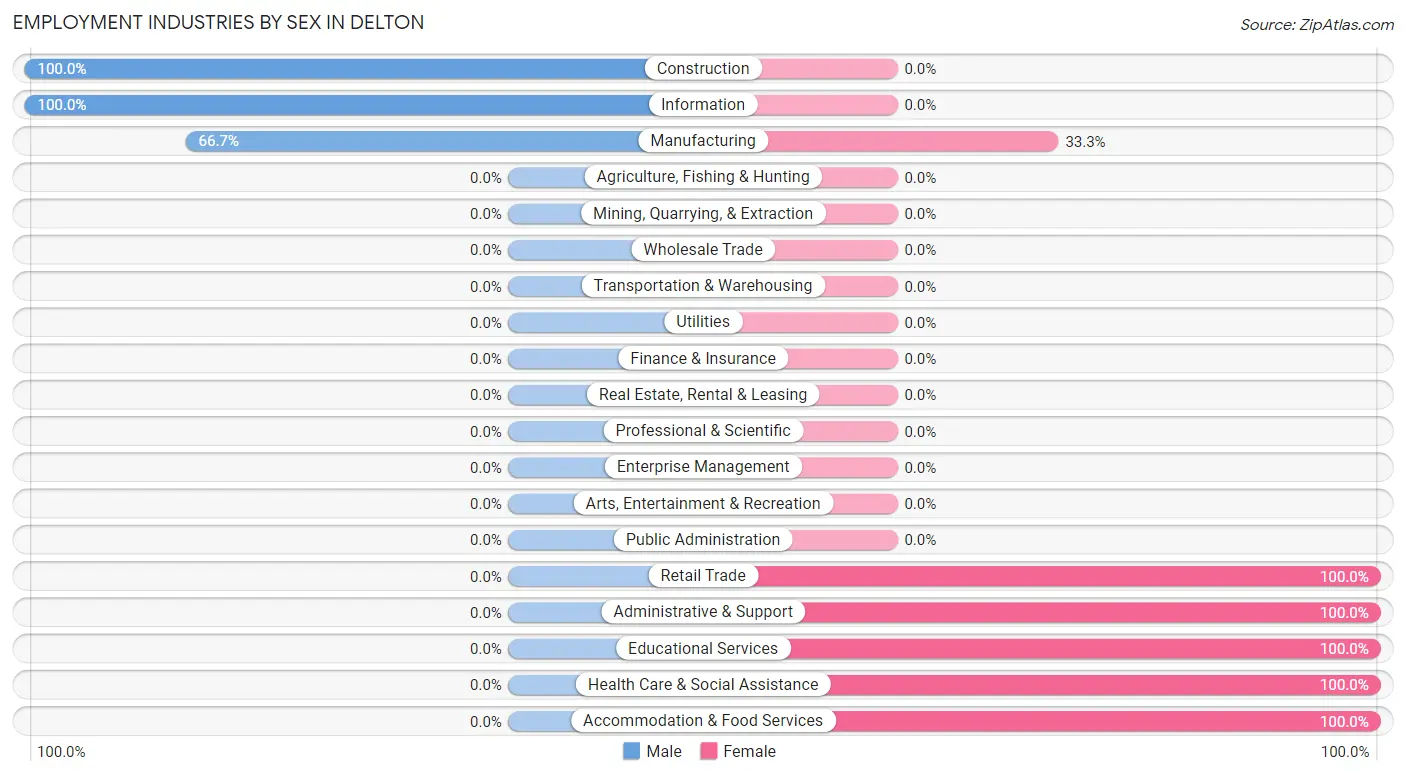
| Industry | Male | Female |
| Agriculture, Fishing & Hunting | 0 (0.0%) | 0 (0.0%) |
| Mining, Quarrying, & Extraction | 0 (0.0%) | 0 (0.0%) |
| Construction | 36 (100.0%) | 0 (0.0%) |
| Manufacturing | 54 (66.7%) | 27 (33.3%) |
| Wholesale Trade | 0 (0.0%) | 0 (0.0%) |
| Retail Trade | 0 (0.0%) | 10 (100.0%) |
| Transportation & Warehousing | 0 (0.0%) | 0 (0.0%) |
| Utilities | 0 (0.0%) | 0 (0.0%) |
| Information | 15 (100.0%) | 0 (0.0%) |
| Finance & Insurance | 0 (0.0%) | 0 (0.0%) |
| Real Estate, Rental & Leasing | 0 (0.0%) | 0 (0.0%) |
| Professional & Scientific | 0 (0.0%) | 0 (0.0%) |
| Enterprise Management | 0 (0.0%) | 0 (0.0%) |
| Administrative & Support | 0 (0.0%) | 15 (100.0%) |
| Educational Services | 0 (0.0%) | 8 (100.0%) |
| Health Care & Social Assistance | 0 (0.0%) | 80 (100.0%) |
| Arts, Entertainment & Recreation | 0 (0.0%) | 0 (0.0%) |
| Accommodation & Food Services | 0 (0.0%) | 18 (100.0%) |
| Public Administration | 0 (0.0%) | 0 (0.0%) |
| Total | 105 (39.9%) | 158 (60.1%) |
Education in Delton
School Enrollment in Delton
The most common levels of schooling among the 39 students in Delton are college / undergraduate (18 | 46.2%), elementary school (13 | 33.3%), and high school (8 | 20.5%).
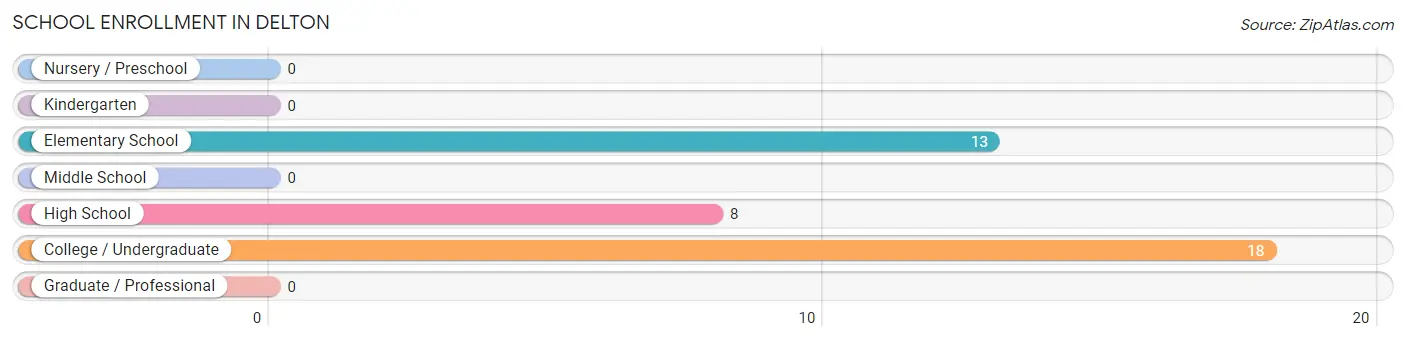
| School Level | # Students | % Students |
| Nursery / Preschool | 0 | 0.0% |
| Kindergarten | 0 | 0.0% |
| Elementary School | 13 | 33.3% |
| Middle School | 0 | 0.0% |
| High School | 8 | 20.5% |
| College / Undergraduate | 18 | 46.2% |
| Graduate / Professional | 0 | 0.0% |
| Total | 39 | 100.0% |
School Enrollment by Age by Funding Source in Delton
Out of a total of 39 students who are enrolled in schools in Delton, 18 (46.2%) attend a private institution, while the remaining 21 (53.8%) are enrolled in public schools. The age group of 20 to 24 year olds has the highest likelihood of being enrolled in private schools, with 18 (100.0% in the age bracket) enrolled. Conversely, the age group of 5 to 9 year old has the lowest likelihood of being enrolled in a private school, with 13 (100.0% in the age bracket) attending a public institution.
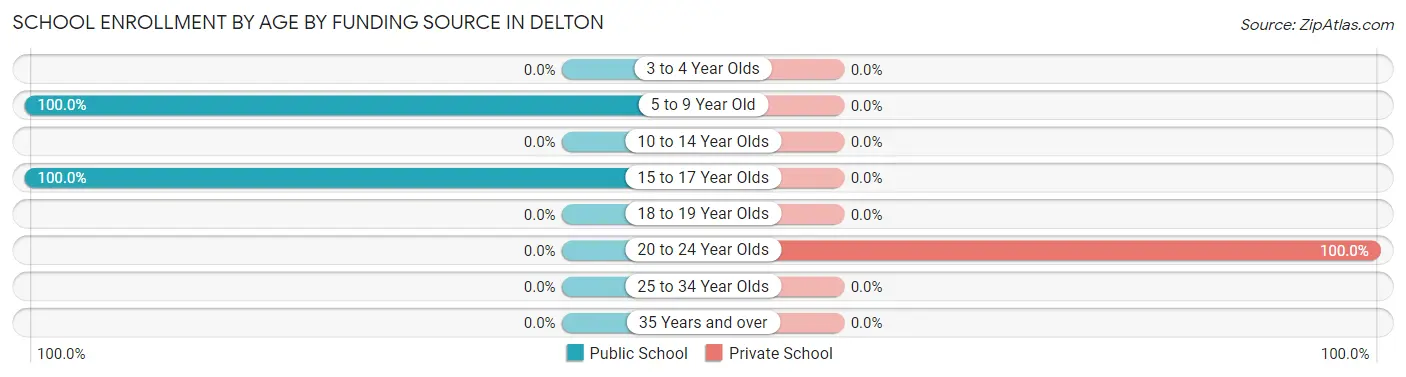
| Age Bracket | Public School | Private School |
| 3 to 4 Year Olds | 0 (0.0%) | 0 (0.0%) |
| 5 to 9 Year Old | 13 (100.0%) | 0 (0.0%) |
| 10 to 14 Year Olds | 0 (0.0%) | 0 (0.0%) |
| 15 to 17 Year Olds | 8 (100.0%) | 0 (0.0%) |
| 18 to 19 Year Olds | 0 (0.0%) | 0 (0.0%) |
| 20 to 24 Year Olds | 0 (0.0%) | 18 (100.0%) |
| 25 to 34 Year Olds | 0 (0.0%) | 0 (0.0%) |
| 35 Years and over | 0 (0.0%) | 0 (0.0%) |
| Total | 21 (53.8%) | 18 (46.2%) |
Educational Attainment by Field of Study in Delton
Liberal arts & history (43 | 20.7%), arts & humanities (33 | 15.9%), psychology (28 | 13.5%), education (27 | 13.0%), and engineering (21 | 10.1%) are the most common fields of study among 208 individuals in Delton who have obtained a bachelor's degree or higher.
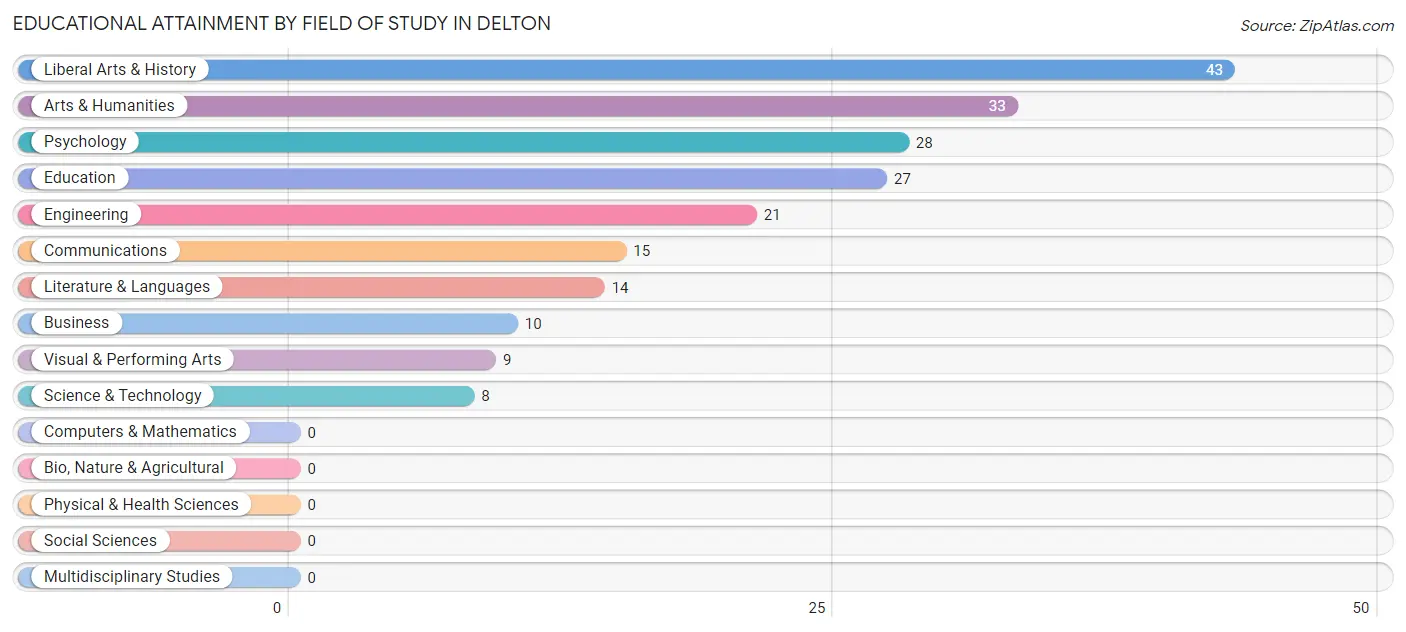
| Field of Study | # Graduates | % Graduates |
| Computers & Mathematics | 0 | 0.0% |
| Bio, Nature & Agricultural | 0 | 0.0% |
| Physical & Health Sciences | 0 | 0.0% |
| Psychology | 28 | 13.5% |
| Social Sciences | 0 | 0.0% |
| Engineering | 21 | 10.1% |
| Multidisciplinary Studies | 0 | 0.0% |
| Science & Technology | 8 | 3.8% |
| Business | 10 | 4.8% |
| Education | 27 | 13.0% |
| Literature & Languages | 14 | 6.7% |
| Liberal Arts & History | 43 | 20.7% |
| Visual & Performing Arts | 9 | 4.3% |
| Communications | 15 | 7.2% |
| Arts & Humanities | 33 | 15.9% |
| Total | 208 | 100.0% |
Transportation & Commute in Delton
Vehicle Availability by Sex in Delton
The most prevalent vehicle ownership categories in Delton are males with 4 vehicles (36, accounting for 34.3%) and females with 4 vehicles (54, making up 22.8%).
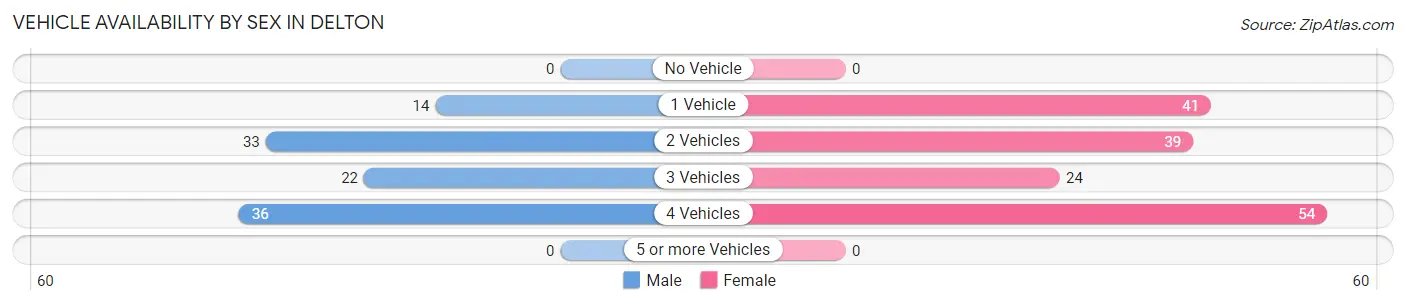
| Vehicles Available | Male | Female |
| No Vehicle | 0 (0.0%) | 0 (0.0%) |
| 1 Vehicle | 14 (13.3%) | 41 (26.0%) |
| 2 Vehicles | 33 (31.4%) | 39 (24.7%) |
| 3 Vehicles | 22 (20.9%) | 24 (15.2%) |
| 4 Vehicles | 36 (34.3%) | 54 (34.2%) |
| 5 or more Vehicles | 0 (0.0%) | 0 (0.0%) |
| Total | 105 (100.0%) | 158 (100.0%) |
Commute Time in Delton
The most frequently occuring commute durations in Delton are 30 to 34 minutes (118 commuters, 46.5%), 20 to 24 minutes (55 commuters, 21.6%), and 45 to 59 minutes (46 commuters, 18.1%).
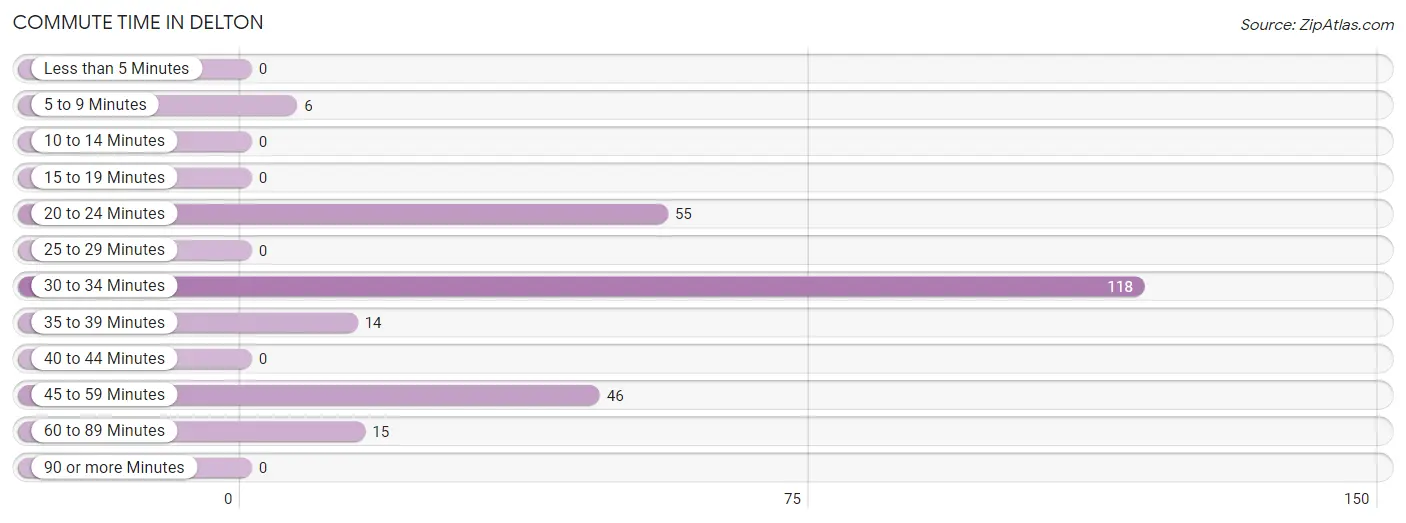
| Commute Time | # Commuters | % Commuters |
| Less than 5 Minutes | 0 | 0.0% |
| 5 to 9 Minutes | 6 | 2.4% |
| 10 to 14 Minutes | 0 | 0.0% |
| 15 to 19 Minutes | 0 | 0.0% |
| 20 to 24 Minutes | 55 | 21.6% |
| 25 to 29 Minutes | 0 | 0.0% |
| 30 to 34 Minutes | 118 | 46.5% |
| 35 to 39 Minutes | 14 | 5.5% |
| 40 to 44 Minutes | 0 | 0.0% |
| 45 to 59 Minutes | 46 | 18.1% |
| 60 to 89 Minutes | 15 | 5.9% |
| 90 or more Minutes | 0 | 0.0% |
Commute Time by Sex in Delton
The most common commute times in Delton are 30 to 34 minutes (67 commuters, 63.8%) for males and 30 to 34 minutes (51 commuters, 34.2%) for females.
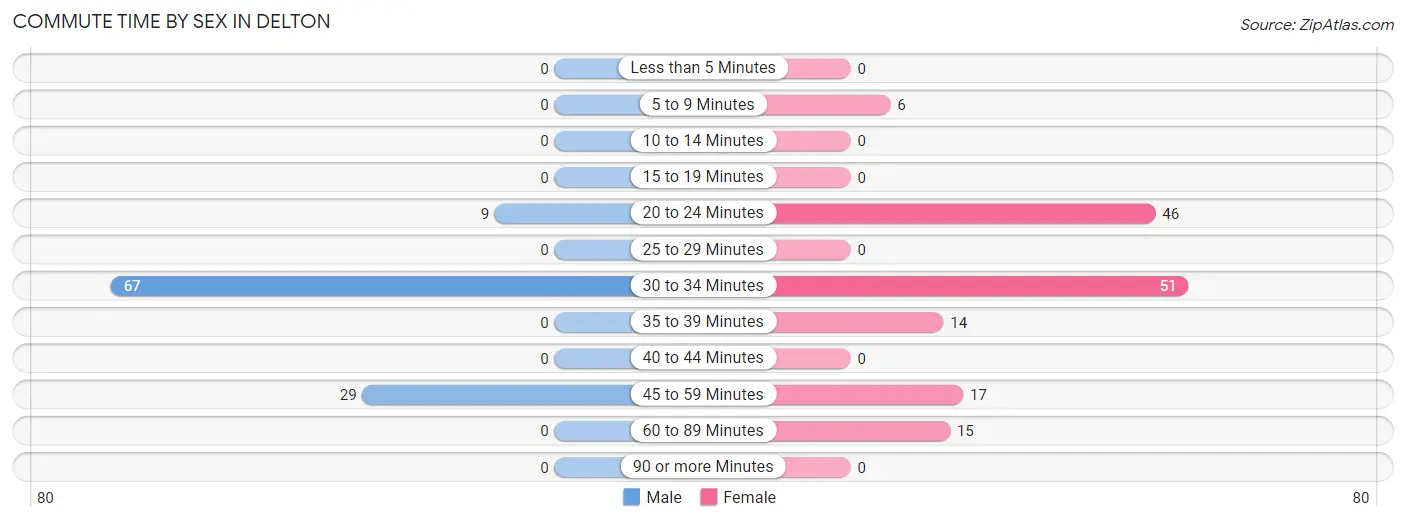
| Commute Time | Male | Female |
| Less than 5 Minutes | 0 (0.0%) | 0 (0.0%) |
| 5 to 9 Minutes | 0 (0.0%) | 6 (4.0%) |
| 10 to 14 Minutes | 0 (0.0%) | 0 (0.0%) |
| 15 to 19 Minutes | 0 (0.0%) | 0 (0.0%) |
| 20 to 24 Minutes | 9 (8.6%) | 46 (30.9%) |
| 25 to 29 Minutes | 0 (0.0%) | 0 (0.0%) |
| 30 to 34 Minutes | 67 (63.8%) | 51 (34.2%) |
| 35 to 39 Minutes | 0 (0.0%) | 14 (9.4%) |
| 40 to 44 Minutes | 0 (0.0%) | 0 (0.0%) |
| 45 to 59 Minutes | 29 (27.6%) | 17 (11.4%) |
| 60 to 89 Minutes | 0 (0.0%) | 15 (10.1%) |
| 90 or more Minutes | 0 (0.0%) | 0 (0.0%) |
Time of Departure to Work by Sex in Delton
The most frequent times of departure to work in Delton are 6:30 AM to 6:59 AM (24, 22.9%) for males and 6:30 AM to 6:59 AM (35, 23.5%) for females.
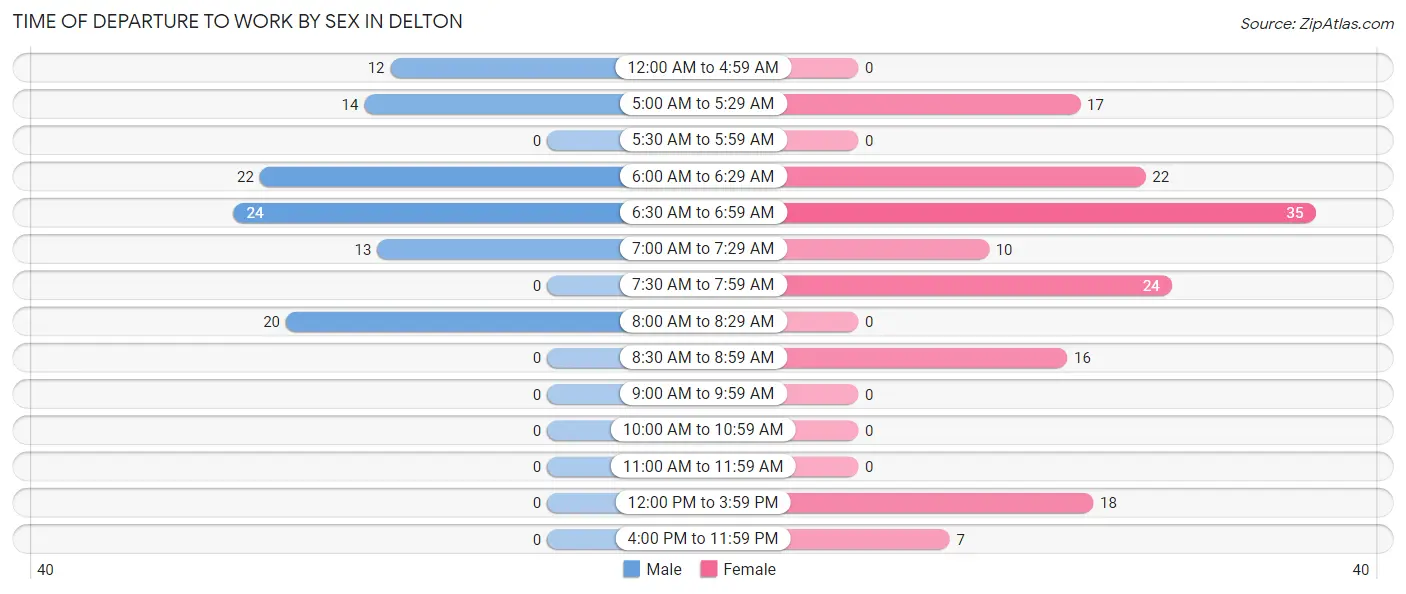
| Time of Departure | Male | Female |
| 12:00 AM to 4:59 AM | 12 (11.4%) | 0 (0.0%) |
| 5:00 AM to 5:29 AM | 14 (13.3%) | 17 (11.4%) |
| 5:30 AM to 5:59 AM | 0 (0.0%) | 0 (0.0%) |
| 6:00 AM to 6:29 AM | 22 (20.9%) | 22 (14.8%) |
| 6:30 AM to 6:59 AM | 24 (22.9%) | 35 (23.5%) |
| 7:00 AM to 7:29 AM | 13 (12.4%) | 10 (6.7%) |
| 7:30 AM to 7:59 AM | 0 (0.0%) | 24 (16.1%) |
| 8:00 AM to 8:29 AM | 20 (19.1%) | 0 (0.0%) |
| 8:30 AM to 8:59 AM | 0 (0.0%) | 16 (10.7%) |
| 9:00 AM to 9:59 AM | 0 (0.0%) | 0 (0.0%) |
| 10:00 AM to 10:59 AM | 0 (0.0%) | 0 (0.0%) |
| 11:00 AM to 11:59 AM | 0 (0.0%) | 0 (0.0%) |
| 12:00 PM to 3:59 PM | 0 (0.0%) | 18 (12.1%) |
| 4:00 PM to 11:59 PM | 0 (0.0%) | 7 (4.7%) |
| Total | 105 (100.0%) | 149 (100.0%) |
Housing Occupancy in Delton
Occupancy by Ownership in Delton
Of the total 286 dwellings in Delton, owner-occupied units account for 273 (95.5%), while renter-occupied units make up 13 (4.5%).
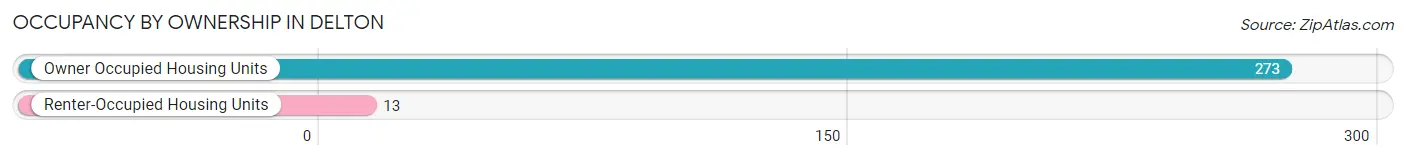
| Occupancy | # Housing Units | % Housing Units |
| Owner Occupied Housing Units | 273 | 95.5% |
| Renter-Occupied Housing Units | 13 | 4.5% |
| Total Occupied Housing Units | 286 | 100.0% |
Occupancy by Household Size in Delton
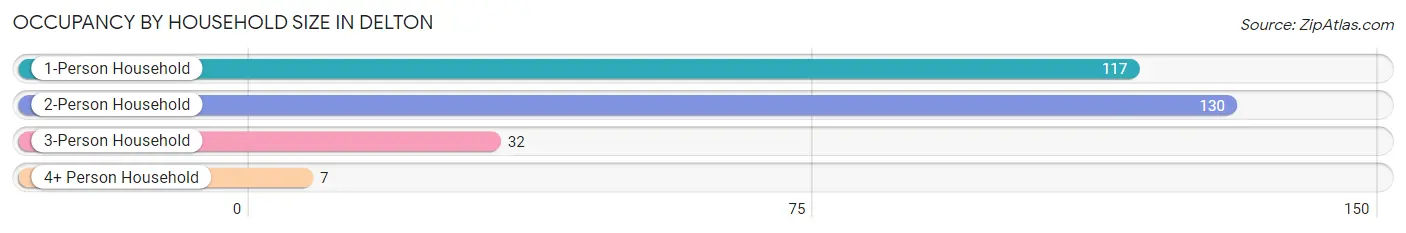
| Household Size | # Housing Units | % Housing Units |
| 1-Person Household | 117 | 40.9% |
| 2-Person Household | 130 | 45.5% |
| 3-Person Household | 32 | 11.2% |
| 4+ Person Household | 7 | 2.5% |
| Total Housing Units | 286 | 100.0% |
Occupancy by Ownership by Household Size in Delton
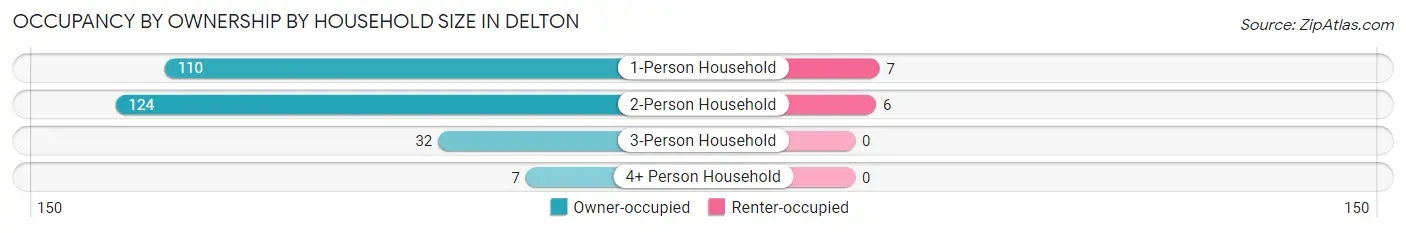
| Household Size | Owner-occupied | Renter-occupied |
| 1-Person Household | 110 (94.0%) | 7 (6.0%) |
| 2-Person Household | 124 (95.4%) | 6 (4.6%) |
| 3-Person Household | 32 (100.0%) | 0 (0.0%) |
| 4+ Person Household | 7 (100.0%) | 0 (0.0%) |
| Total Housing Units | 273 (95.5%) | 13 (4.5%) |
Occupancy by Educational Attainment in Delton
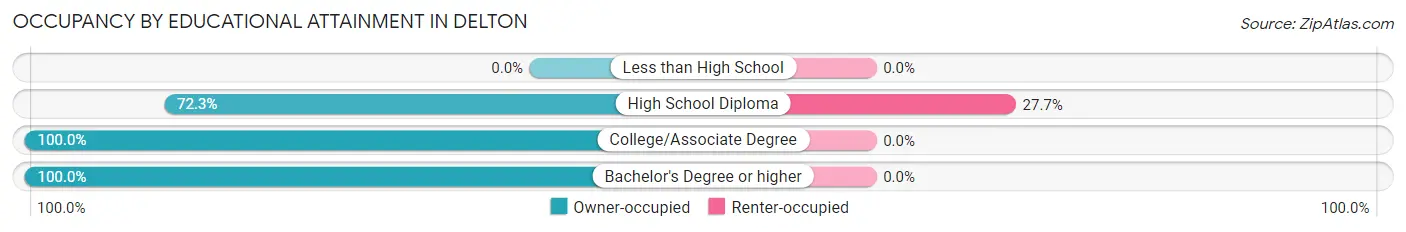
| Household Size | Owner-occupied | Renter-occupied |
| Less than High School | 0 (0.0%) | 0 (0.0%) |
| High School Diploma | 34 (72.3%) | 13 (27.7%) |
| College/Associate Degree | 135 (100.0%) | 0 (0.0%) |
| Bachelor's Degree or higher | 104 (100.0%) | 0 (0.0%) |
Occupancy by Age of Householder in Delton
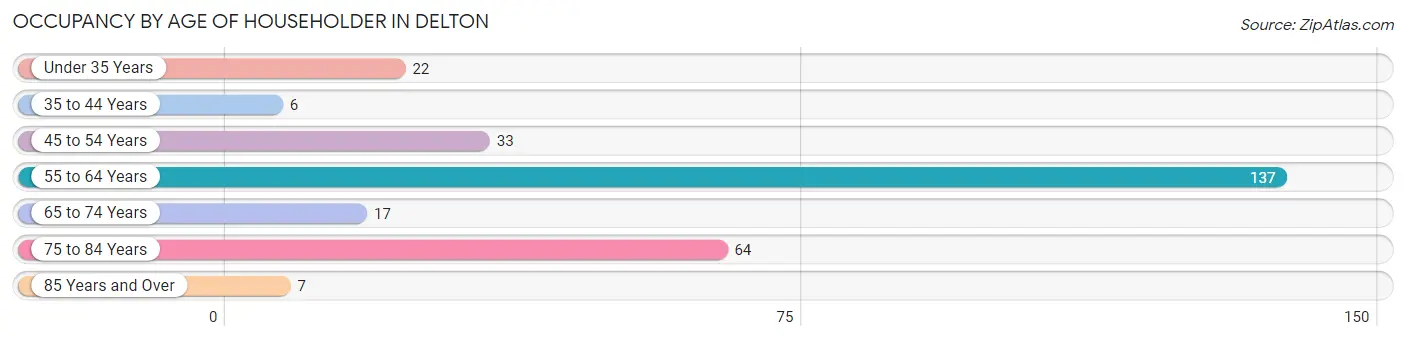
| Age Bracket | # Households | % Households |
| Under 35 Years | 22 | 7.7% |
| 35 to 44 Years | 6 | 2.1% |
| 45 to 54 Years | 33 | 11.5% |
| 55 to 64 Years | 137 | 47.9% |
| 65 to 74 Years | 17 | 5.9% |
| 75 to 84 Years | 64 | 22.4% |
| 85 Years and Over | 7 | 2.5% |
| Total | 286 | 100.0% |
Housing Finances in Delton
Median Income by Occupancy in Delton
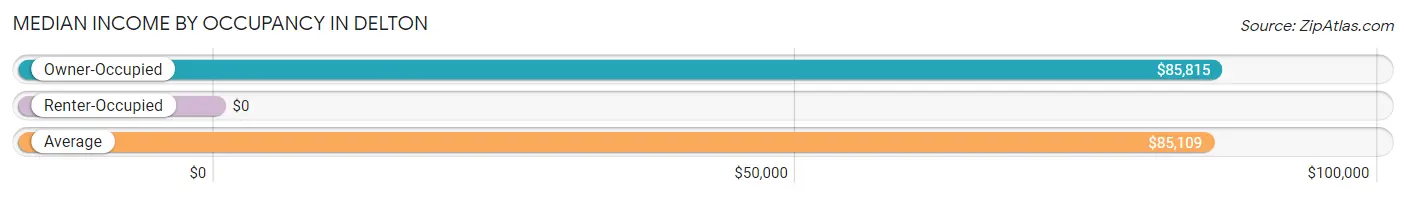
| Occupancy Type | # Households | Median Income |
| Owner-Occupied | 273 (95.5%) | $85,815 |
| Renter-Occupied | 13 (4.5%) | $0 |
| Average | 286 (100.0%) | $85,109 |
Occupancy by Householder Income Bracket in Delton
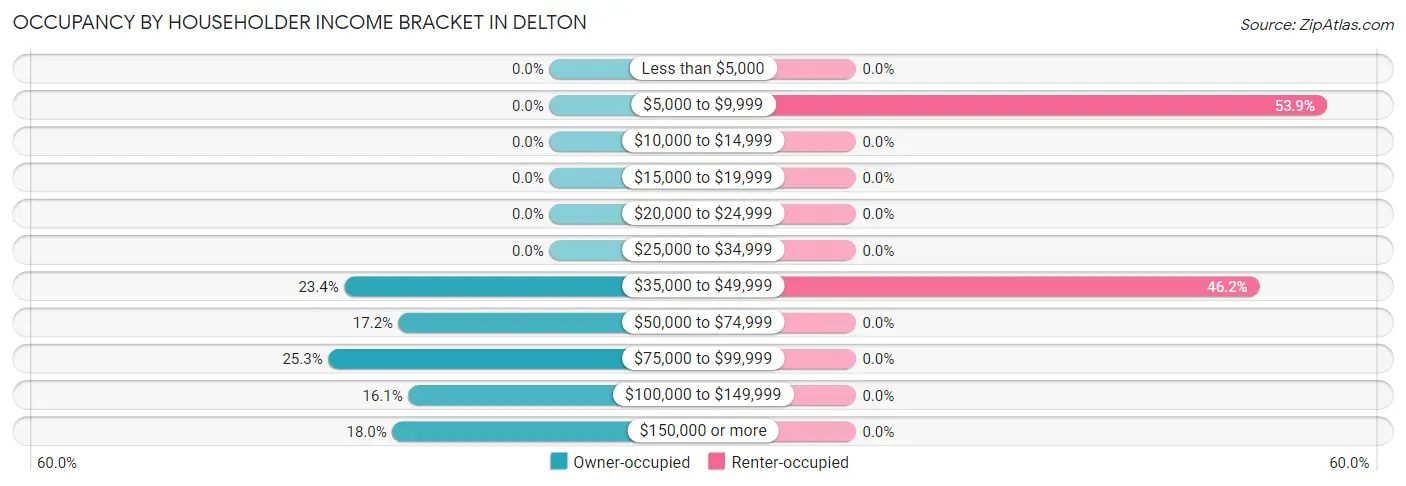
| Income Bracket | Owner-occupied | Renter-occupied |
| Less than $5,000 | 0 (0.0%) | 0 (0.0%) |
| $5,000 to $9,999 | 0 (0.0%) | 7 (53.8%) |
| $10,000 to $14,999 | 0 (0.0%) | 0 (0.0%) |
| $15,000 to $19,999 | 0 (0.0%) | 0 (0.0%) |
| $20,000 to $24,999 | 0 (0.0%) | 0 (0.0%) |
| $25,000 to $34,999 | 0 (0.0%) | 0 (0.0%) |
| $35,000 to $49,999 | 64 (23.4%) | 6 (46.2%) |
| $50,000 to $74,999 | 47 (17.2%) | 0 (0.0%) |
| $75,000 to $99,999 | 69 (25.3%) | 0 (0.0%) |
| $100,000 to $149,999 | 44 (16.1%) | 0 (0.0%) |
| $150,000 or more | 49 (17.9%) | 0 (0.0%) |
| Total | 273 (100.0%) | 13 (100.0%) |
Monthly Housing Cost Tiers in Delton
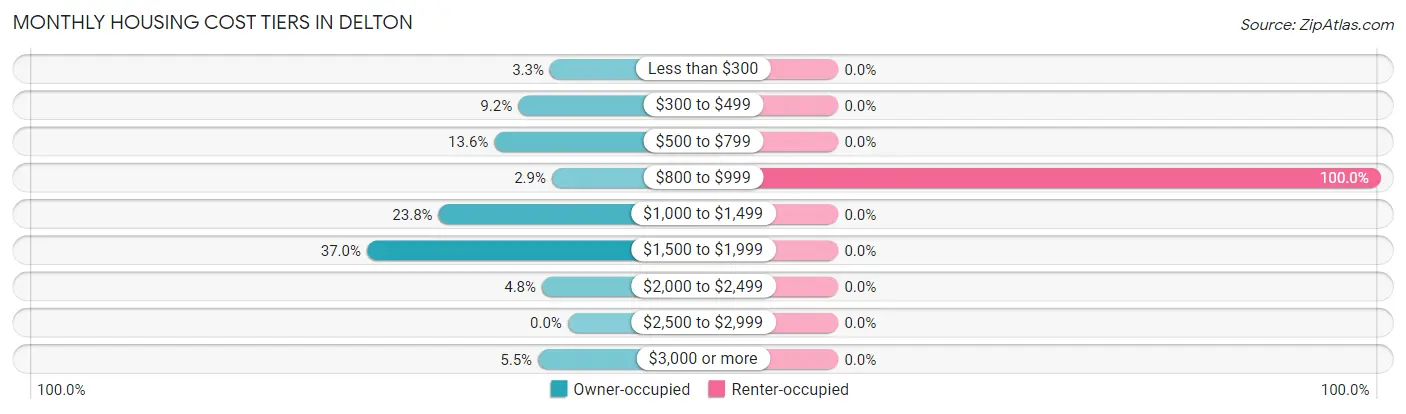
| Monthly Cost | Owner-occupied | Renter-occupied |
| Less than $300 | 9 (3.3%) | 0 (0.0%) |
| $300 to $499 | 25 (9.2%) | 0 (0.0%) |
| $500 to $799 | 37 (13.6%) | 0 (0.0%) |
| $800 to $999 | 8 (2.9%) | 13 (100.0%) |
| $1,000 to $1,499 | 65 (23.8%) | 0 (0.0%) |
| $1,500 to $1,999 | 101 (37.0%) | 0 (0.0%) |
| $2,000 to $2,499 | 13 (4.8%) | 0 (0.0%) |
| $2,500 to $2,999 | 0 (0.0%) | 0 (0.0%) |
| $3,000 or more | 15 (5.5%) | 0 (0.0%) |
| Total | 273 (100.0%) | 13 (100.0%) |
Physical Housing Characteristics in Delton
Housing Structures in Delton
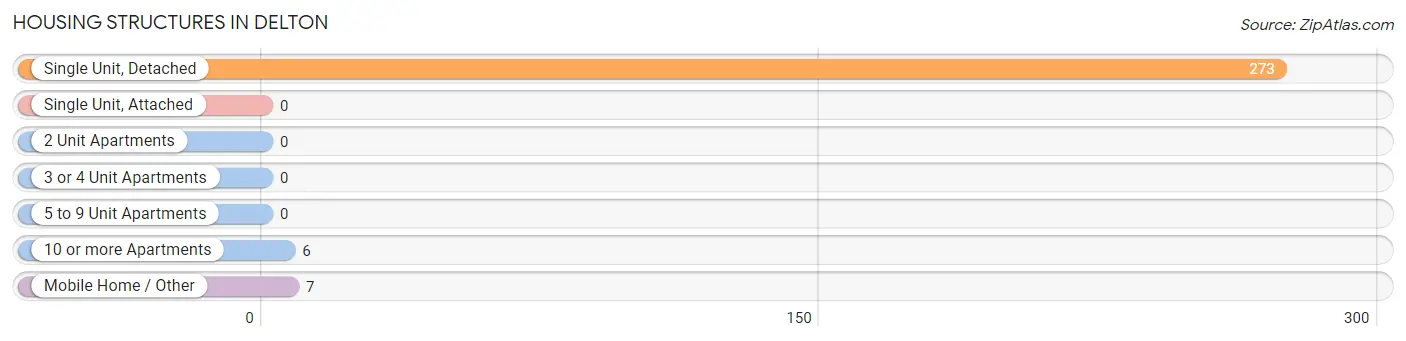
| Structure Type | # Housing Units | % Housing Units |
| Single Unit, Detached | 273 | 95.5% |
| Single Unit, Attached | 0 | 0.0% |
| 2 Unit Apartments | 0 | 0.0% |
| 3 or 4 Unit Apartments | 0 | 0.0% |
| 5 to 9 Unit Apartments | 0 | 0.0% |
| 10 or more Apartments | 6 | 2.1% |
| Mobile Home / Other | 7 | 2.5% |
| Total | 286 | 100.0% |
Housing Structures by Occupancy in Delton
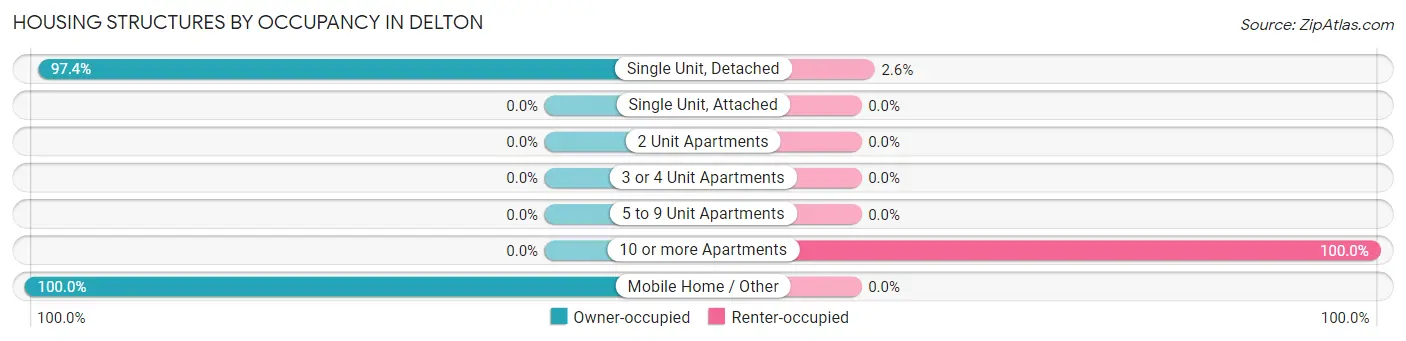
| Structure Type | Owner-occupied | Renter-occupied |
| Single Unit, Detached | 266 (97.4%) | 7 (2.6%) |
| Single Unit, Attached | 0 (0.0%) | 0 (0.0%) |
| 2 Unit Apartments | 0 (0.0%) | 0 (0.0%) |
| 3 or 4 Unit Apartments | 0 (0.0%) | 0 (0.0%) |
| 5 to 9 Unit Apartments | 0 (0.0%) | 0 (0.0%) |
| 10 or more Apartments | 0 (0.0%) | 6 (100.0%) |
| Mobile Home / Other | 7 (100.0%) | 0 (0.0%) |
| Total | 273 (95.5%) | 13 (4.5%) |
Housing Structures by Number of Rooms in Delton
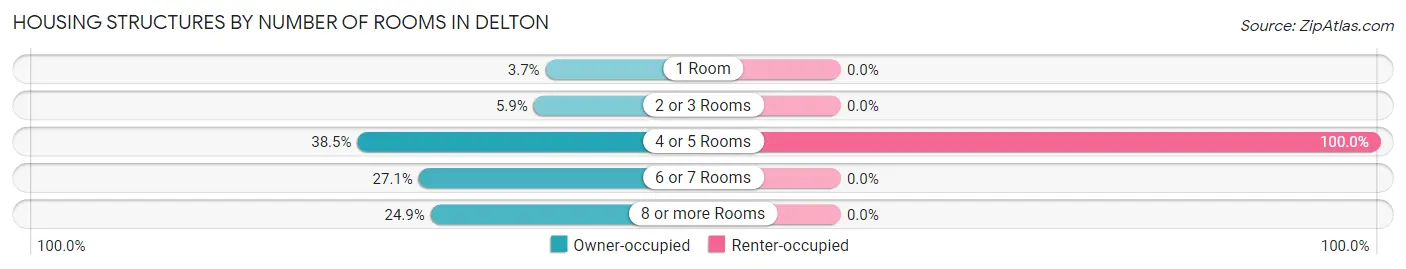
| Number of Rooms | Owner-occupied | Renter-occupied |
| 1 Room | 10 (3.7%) | 0 (0.0%) |
| 2 or 3 Rooms | 16 (5.9%) | 0 (0.0%) |
| 4 or 5 Rooms | 105 (38.5%) | 13 (100.0%) |
| 6 or 7 Rooms | 74 (27.1%) | 0 (0.0%) |
| 8 or more Rooms | 68 (24.9%) | 0 (0.0%) |
| Total | 273 (100.0%) | 13 (100.0%) |
Housing Structure by Heating Type in Delton
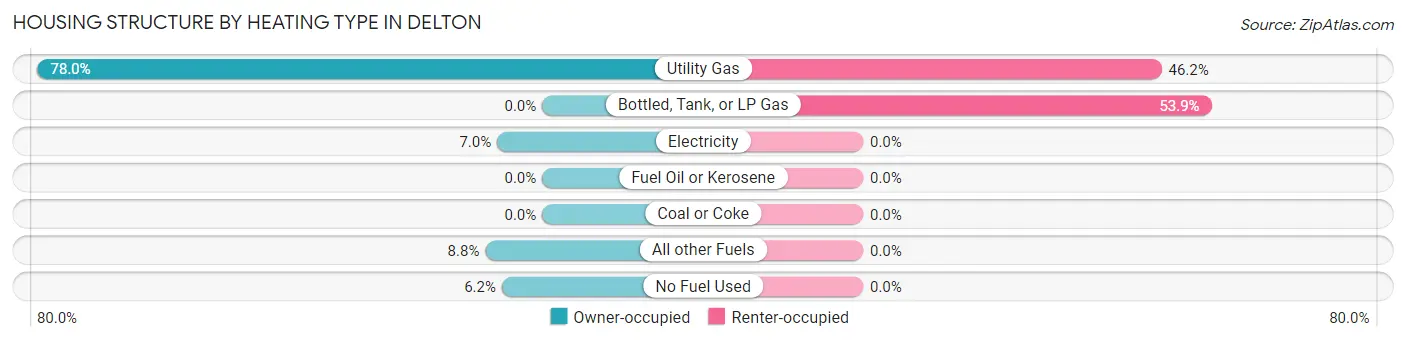
| Heating Type | Owner-occupied | Renter-occupied |
| Utility Gas | 213 (78.0%) | 6 (46.2%) |
| Bottled, Tank, or LP Gas | 0 (0.0%) | 7 (53.8%) |
| Electricity | 19 (7.0%) | 0 (0.0%) |
| Fuel Oil or Kerosene | 0 (0.0%) | 0 (0.0%) |
| Coal or Coke | 0 (0.0%) | 0 (0.0%) |
| All other Fuels | 24 (8.8%) | 0 (0.0%) |
| No Fuel Used | 17 (6.2%) | 0 (0.0%) |
| Total | 273 (100.0%) | 13 (100.0%) |
Household Vehicle Usage in Delton
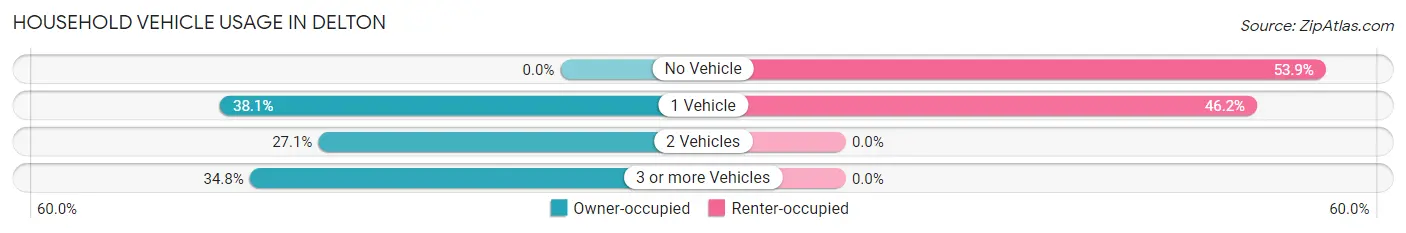
| Vehicles per Household | Owner-occupied | Renter-occupied |
| No Vehicle | 0 (0.0%) | 7 (53.8%) |
| 1 Vehicle | 104 (38.1%) | 6 (46.2%) |
| 2 Vehicles | 74 (27.1%) | 0 (0.0%) |
| 3 or more Vehicles | 95 (34.8%) | 0 (0.0%) |
| Total | 273 (100.0%) | 13 (100.0%) |
Real Estate & Mortgages in Delton
Real Estate and Mortgage Overview in Delton
| Characteristic | Without Mortgage | With Mortgage |
| Housing Units | 53 | 220 |
| Median Property Value | $174,500 | $236,400 |
| Median Household Income | $85,417 | $49 |
| Monthly Housing Costs | $470 | $15 |
| Real Estate Taxes | $2,315 | $0 |
Property Value by Mortgage Status in Delton
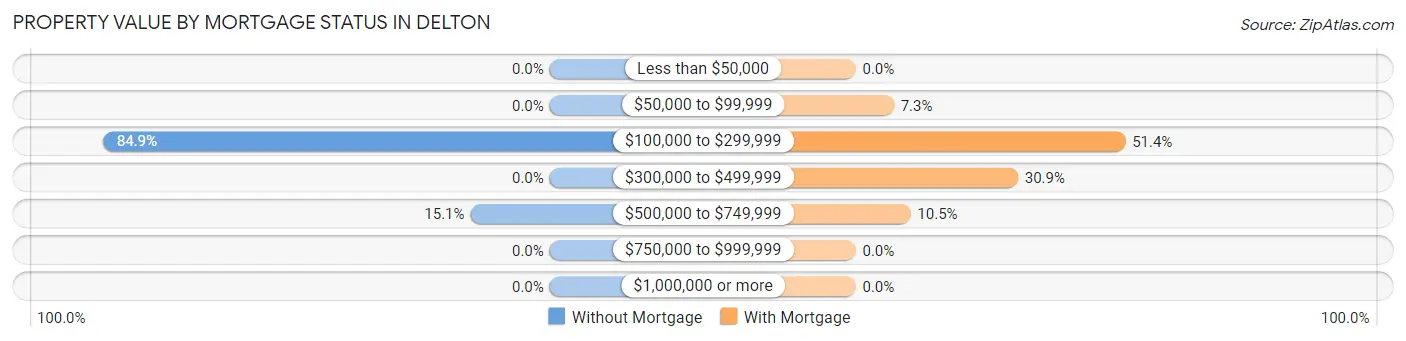
| Property Value | Without Mortgage | With Mortgage |
| Less than $50,000 | 0 (0.0%) | 0 (0.0%) |
| $50,000 to $99,999 | 0 (0.0%) | 16 (7.3%) |
| $100,000 to $299,999 | 45 (84.9%) | 113 (51.4%) |
| $300,000 to $499,999 | 0 (0.0%) | 68 (30.9%) |
| $500,000 to $749,999 | 8 (15.1%) | 23 (10.4%) |
| $750,000 to $999,999 | 0 (0.0%) | 0 (0.0%) |
| $1,000,000 or more | 0 (0.0%) | 0 (0.0%) |
| Total | 53 (100.0%) | 220 (100.0%) |
Household Income by Mortgage Status in Delton
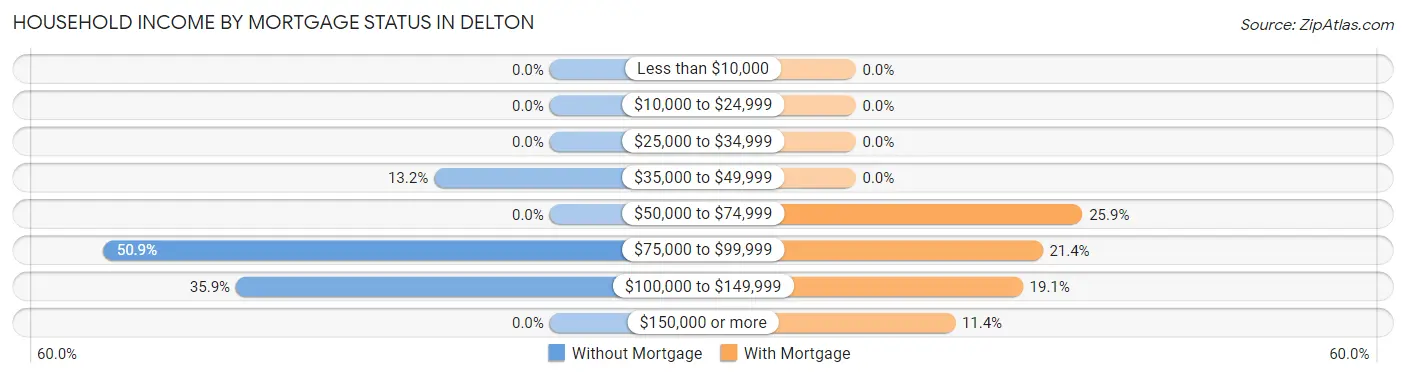
| Household Income | Without Mortgage | With Mortgage |
| Less than $10,000 | 0 (0.0%) | 0 (0.0%) |
| $10,000 to $24,999 | 0 (0.0%) | 0 (0.0%) |
| $25,000 to $34,999 | 0 (0.0%) | 0 (0.0%) |
| $35,000 to $49,999 | 7 (13.2%) | 0 (0.0%) |
| $50,000 to $74,999 | 0 (0.0%) | 57 (25.9%) |
| $75,000 to $99,999 | 27 (50.9%) | 47 (21.4%) |
| $100,000 to $149,999 | 19 (35.8%) | 42 (19.1%) |
| $150,000 or more | 0 (0.0%) | 25 (11.4%) |
| Total | 53 (100.0%) | 220 (100.0%) |
Property Value to Household Income Ratio in Delton
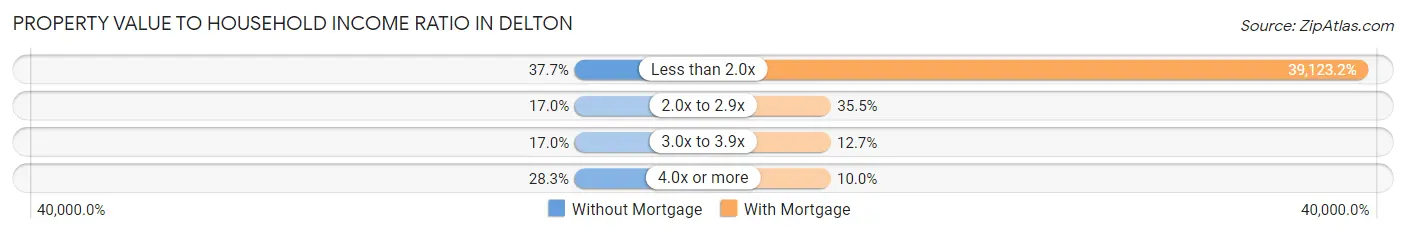
| Value-to-Income Ratio | Without Mortgage | With Mortgage |
| Less than 2.0x | 20 (37.7%) | 86,071 (39,123.2%) |
| 2.0x to 2.9x | 9 (17.0%) | 78 (35.4%) |
| 3.0x to 3.9x | 9 (17.0%) | 28 (12.7%) |
| 4.0x or more | 15 (28.3%) | 22 (10.0%) |
| Total | 53 (100.0%) | 220 (100.0%) |
Real Estate Taxes by Mortgage Status in Delton
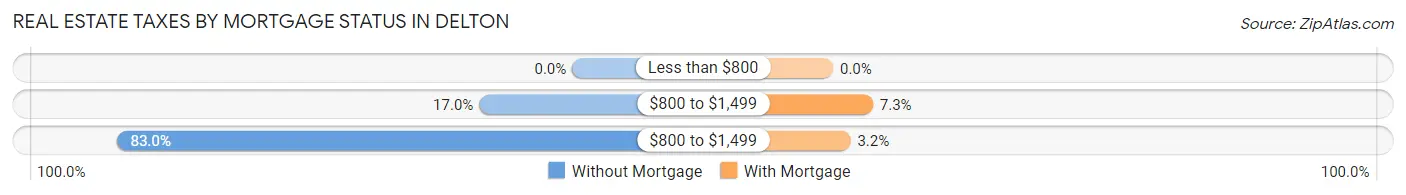
| Property Taxes | Without Mortgage | With Mortgage |
| Less than $800 | 0 (0.0%) | 0 (0.0%) |
| $800 to $1,499 | 9 (17.0%) | 16 (7.3%) |
| $800 to $1,499 | 44 (83.0%) | 7 (3.2%) |
| Total | 53 (100.0%) | 220 (100.0%) |
Health & Disability in Delton
Health Insurance Coverage by Age in Delton
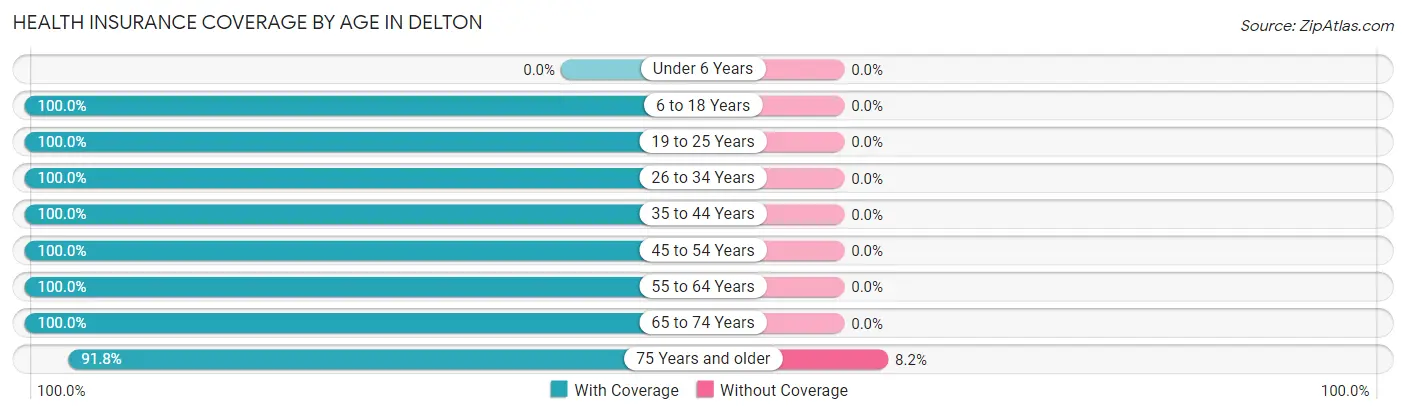
| Age Bracket | With Coverage | Without Coverage |
| Under 6 Years | 0 (0.0%) | 0 (0.0%) |
| 6 to 18 Years | 21 (100.0%) | 0 (0.0%) |
| 19 to 25 Years | 31 (100.0%) | 0 (0.0%) |
| 26 to 34 Years | 36 (100.0%) | 0 (0.0%) |
| 35 to 44 Years | 21 (100.0%) | 0 (0.0%) |
| 45 to 54 Years | 64 (100.0%) | 0 (0.0%) |
| 55 to 64 Years | 233 (100.0%) | 0 (0.0%) |
| 65 to 74 Years | 46 (100.0%) | 0 (0.0%) |
| 75 Years and older | 101 (91.8%) | 9 (8.2%) |
| Total | 553 (98.4%) | 9 (1.6%) |
Health Insurance Coverage by Citizenship Status in Delton
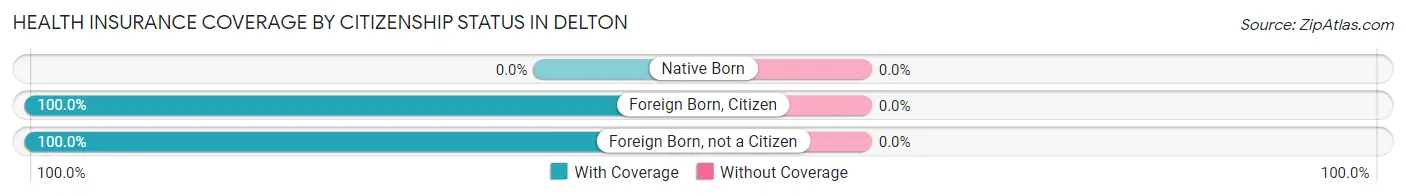
| Citizenship Status | With Coverage | Without Coverage |
| Native Born | 0 (0.0%) | 0 (0.0%) |
| Foreign Born, Citizen | 21 (100.0%) | 0 (0.0%) |
| Foreign Born, not a Citizen | 31 (100.0%) | 0 (0.0%) |
Health Insurance Coverage by Household Income in Delton
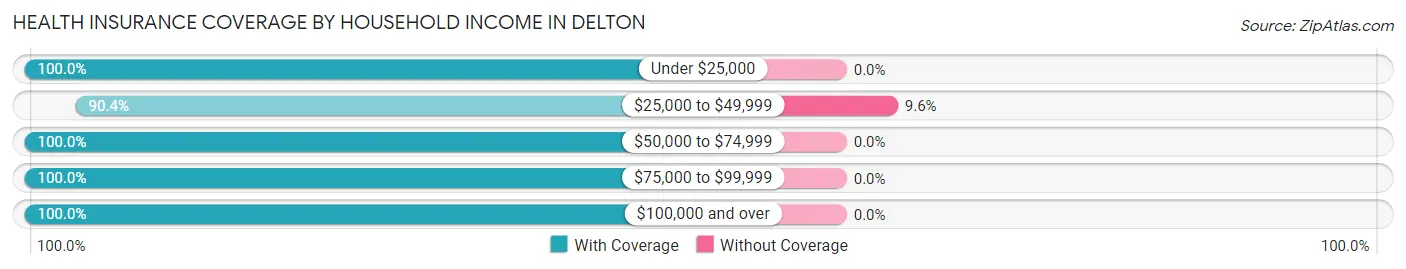
| Household Income | With Coverage | Without Coverage |
| Under $25,000 | 7 (100.0%) | 0 (0.0%) |
| $25,000 to $49,999 | 85 (90.4%) | 9 (9.6%) |
| $50,000 to $74,999 | 47 (100.0%) | 0 (0.0%) |
| $75,000 to $99,999 | 187 (100.0%) | 0 (0.0%) |
| $100,000 and over | 227 (100.0%) | 0 (0.0%) |
Public vs Private Health Insurance Coverage by Age in Delton
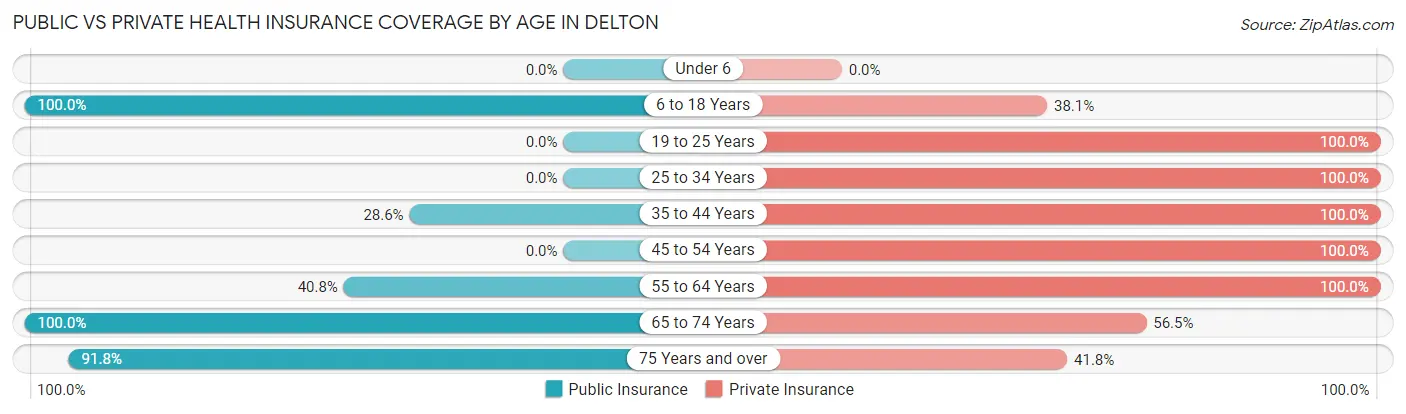
| Age Bracket | Public Insurance | Private Insurance |
| Under 6 | 0 (0.0%) | 0 (0.0%) |
| 6 to 18 Years | 21 (100.0%) | 8 (38.1%) |
| 19 to 25 Years | 0 (0.0%) | 31 (100.0%) |
| 25 to 34 Years | 0 (0.0%) | 36 (100.0%) |
| 35 to 44 Years | 6 (28.6%) | 21 (100.0%) |
| 45 to 54 Years | 0 (0.0%) | 64 (100.0%) |
| 55 to 64 Years | 95 (40.8%) | 233 (100.0%) |
| 65 to 74 Years | 46 (100.0%) | 26 (56.5%) |
| 75 Years and over | 101 (91.8%) | 46 (41.8%) |
| Total | 269 (47.9%) | 465 (82.7%) |
Disability Status by Sex by Age in Delton
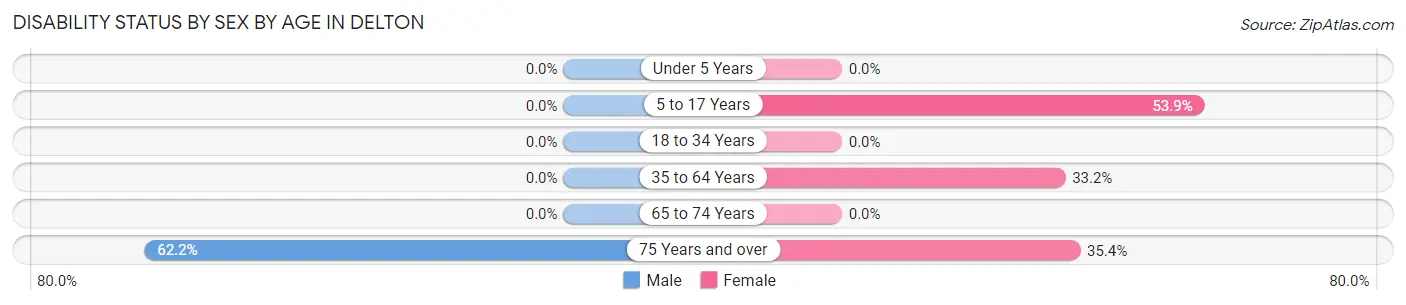
| Age Bracket | Male | Female |
| Under 5 Years | 0 (0.0%) | 0 (0.0%) |
| 5 to 17 Years | 0 (0.0%) | 7 (53.8%) |
| 18 to 34 Years | 0 (0.0%) | 0 (0.0%) |
| 35 to 64 Years | 0 (0.0%) | 66 (33.2%) |
| 65 to 74 Years | 0 (0.0%) | 0 (0.0%) |
| 75 Years and over | 28 (62.2%) | 23 (35.4%) |
Disability Class by Sex by Age in Delton
Disability Class: Hearing Difficulty
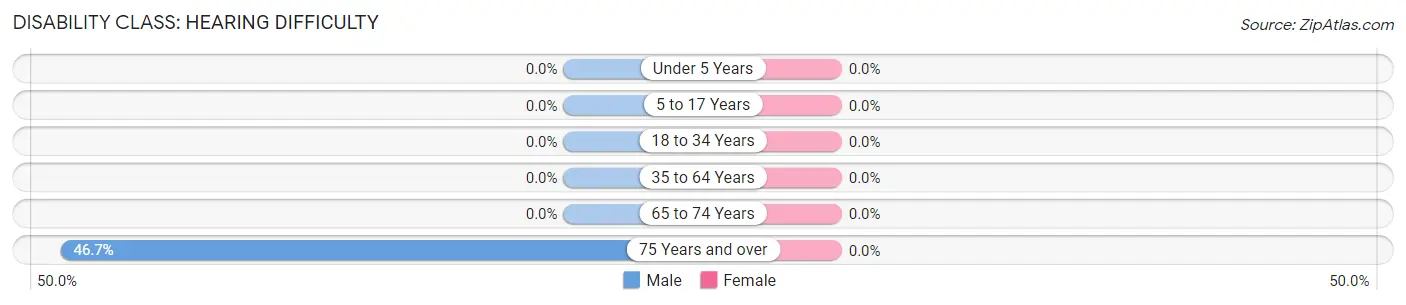
| Age Bracket | Male | Female |
| Under 5 Years | 0 (0.0%) | 0 (0.0%) |
| 5 to 17 Years | 0 (0.0%) | 0 (0.0%) |
| 18 to 34 Years | 0 (0.0%) | 0 (0.0%) |
| 35 to 64 Years | 0 (0.0%) | 0 (0.0%) |
| 65 to 74 Years | 0 (0.0%) | 0 (0.0%) |
| 75 Years and over | 21 (46.7%) | 0 (0.0%) |
Disability Class: Vision Difficulty
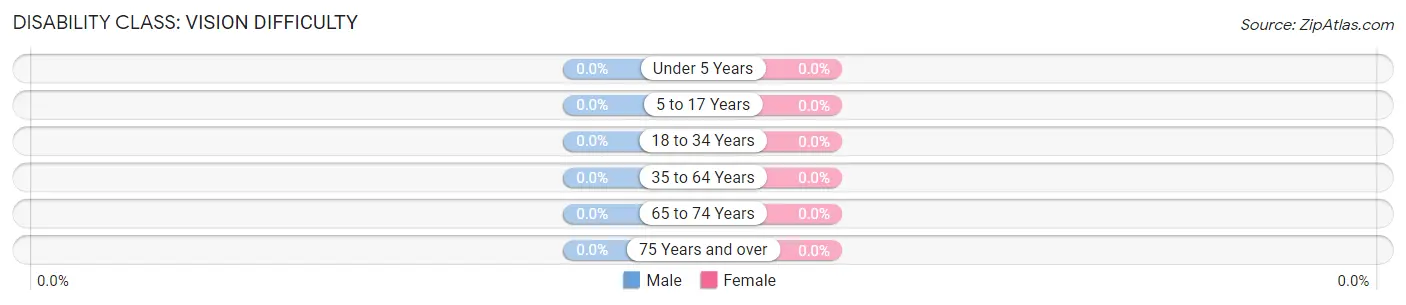
| Age Bracket | Male | Female |
| Under 5 Years | 0 (0.0%) | 0 (0.0%) |
| 5 to 17 Years | 0 (0.0%) | 0 (0.0%) |
| 18 to 34 Years | 0 (0.0%) | 0 (0.0%) |
| 35 to 64 Years | 0 (0.0%) | 0 (0.0%) |
| 65 to 74 Years | 0 (0.0%) | 0 (0.0%) |
| 75 Years and over | 0 (0.0%) | 0 (0.0%) |
Disability Class: Cognitive Difficulty
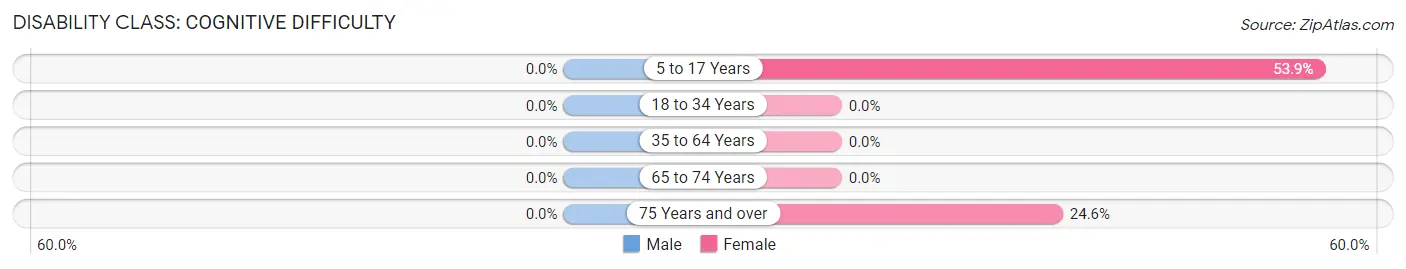
| Age Bracket | Male | Female |
| 5 to 17 Years | 0 (0.0%) | 7 (53.8%) |
| 18 to 34 Years | 0 (0.0%) | 0 (0.0%) |
| 35 to 64 Years | 0 (0.0%) | 0 (0.0%) |
| 65 to 74 Years | 0 (0.0%) | 0 (0.0%) |
| 75 Years and over | 0 (0.0%) | 16 (24.6%) |
Disability Class: Ambulatory Difficulty
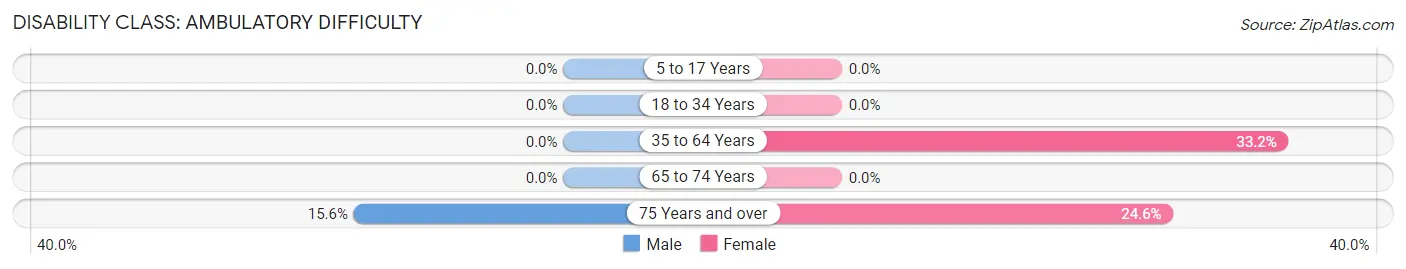
| Age Bracket | Male | Female |
| 5 to 17 Years | 0 (0.0%) | 0 (0.0%) |
| 18 to 34 Years | 0 (0.0%) | 0 (0.0%) |
| 35 to 64 Years | 0 (0.0%) | 66 (33.2%) |
| 65 to 74 Years | 0 (0.0%) | 0 (0.0%) |
| 75 Years and over | 7 (15.6%) | 16 (24.6%) |
Disability Class: Self-Care Difficulty
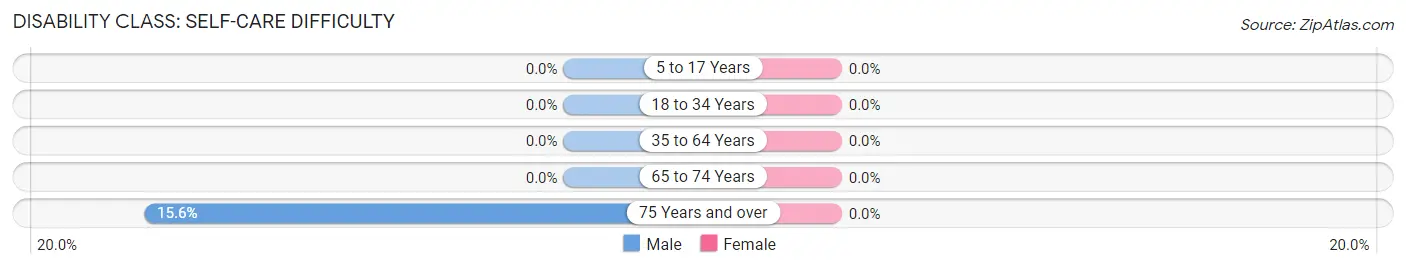
| Age Bracket | Male | Female |
| 5 to 17 Years | 0 (0.0%) | 0 (0.0%) |
| 18 to 34 Years | 0 (0.0%) | 0 (0.0%) |
| 35 to 64 Years | 0 (0.0%) | 0 (0.0%) |
| 65 to 74 Years | 0 (0.0%) | 0 (0.0%) |
| 75 Years and over | 7 (15.6%) | 0 (0.0%) |
Technology Access in Delton
Computing Device Access in Delton
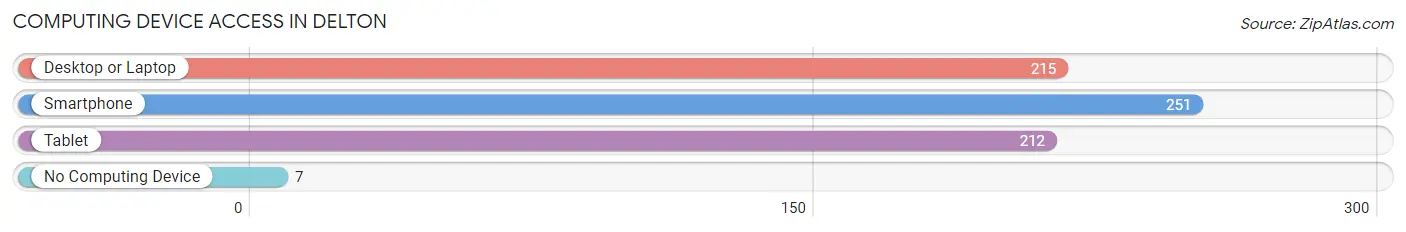
| Device Type | # Households | % Households |
| Desktop or Laptop | 215 | 75.2% |
| Smartphone | 251 | 87.8% |
| Tablet | 212 | 74.1% |
| No Computing Device | 7 | 2.5% |
| Total | 286 | 100.0% |
Internet Access in Delton
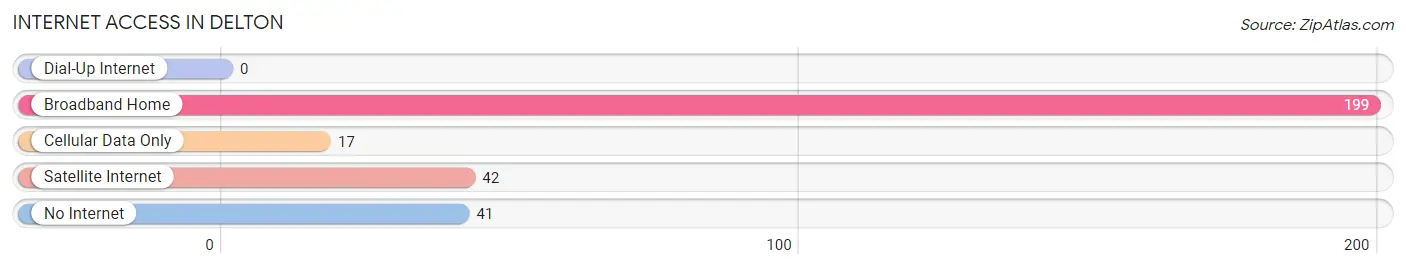
| Internet Type | # Households | % Households |
| Dial-Up Internet | 0 | 0.0% |
| Broadband Home | 199 | 69.6% |
| Cellular Data Only | 17 | 5.9% |
| Satellite Internet | 42 | 14.7% |
| No Internet | 41 | 14.3% |
| Total | 286 | 100.0% |
Delton Summary
Delton, Michigan is a small village located in Barry County, Michigan. It is situated on the banks of the Thornapple River, and is part of the greater Grand Rapids metropolitan area. The village has a population of approximately 1,000 people, and is known for its rural charm and small-town atmosphere.
History
Delton was first settled in 1836 by a group of settlers from New York. The village was originally known as “Deltonville”, and was named after the nearby Delton Township. The village was incorporated in 1867, and the first post office was established in 1868.
In the late 19th century, Delton was a thriving agricultural community, with a variety of crops being grown in the area. The village was also home to several sawmills, which provided lumber for the local economy.
In the early 20th century, Delton began to experience a decline in population as many of its residents moved away to larger cities. The village was also affected by the Great Depression, and many of its businesses closed.
Geography
Delton is located in Barry County, Michigan, and is situated on the banks of the Thornapple River. The village is located approximately 25 miles southeast of Grand Rapids, and is part of the greater Grand Rapids metropolitan area.
The village is surrounded by rolling hills and farmland, and is home to several small lakes and ponds. The village is also home to several parks, including the Delton State Park, which offers camping, fishing, and hiking opportunities.
Economy
Delton’s economy is largely based on agriculture and tourism. The village is home to several farms, which produce a variety of crops, including corn, soybeans, and wheat. The village is also home to several wineries, which produce a variety of wines.
The village is also home to several small businesses, including restaurants, shops, and other services. The village is also home to several bed and breakfasts, which attract tourists from around the region.
Demographics
As of the 2010 census, Delton had a population of 1,000 people. The racial makeup of the village was 97.2% White, 0.7% African American, 0.2% Native American, 0.2% Asian, 0.2% from other races, and 1.7% from two or more races. Hispanic or Latino of any race were 1.2% of the population.
The median income for a household in the village was $41,250, and the median income for a family was $50,000. The per capita income for the village was $20,845. About 8.2% of families and 10.2% of the population were below the poverty line, including 14.3% of those under age 18 and 6.7% of those age 65 or over.
Conclusion
Delton, Michigan is a small village located in Barry County, Michigan. It is situated on the banks of the Thornapple River, and is part of the greater Grand Rapids metropolitan area. The village has a population of approximately 1,000 people, and is known for its rural charm and small-town atmosphere. The village’s economy is largely based on agriculture and tourism, and the village is home to several small businesses, including restaurants, shops, and other services. The village is also home to several parks, including the Delton State Park, which offers camping, fishing, and hiking opportunities. As of the 2010 census, Delton had a population of 1,000 people, with a median income for a household of $41,250 and a median income for a family of $50,000.
Common Questions
What is Per Capita Income in Delton?
Per Capita income in Delton is $48,844.
What is the Median Family Income in Delton?
Median Family Income in Delton is $105,156.
What is the Median Household income in Delton?
Median Household Income in Delton is $85,109.
What is Inequality or Gini Index in Delton?
Inequality or Gini Index in Delton is 0.33.
What is the Total Population of Delton?
Total Population of Delton is 562.
What is the Total Male Population of Delton?
Total Male Population of Delton is 251.
What is the Total Female Population of Delton?
Total Female Population of Delton is 311.
What is the Ratio of Males per 100 Females in Delton?
There are 80.71 Males per 100 Females in Delton.
What is the Ratio of Females per 100 Males in Delton?
There are 123.90 Females per 100 Males in Delton.
What is the Median Population Age in Delton?
Median Population Age in Delton is 59.4 Years.
What is the Average Family Size in Delton
Average Family Size in Delton is 2.2 People.
What is the Average Household Size in Delton
Average Household Size in Delton is 2.0 People.
How Large is the Labor Force in Delton?
There are 263 People in the Labor Forcein in Delton.
What is the Percentage of People in the Labor Force in Delton?
48.6% of People are in the Labor Force in Delton.