Zip Codes with the Highest Percentage of Population Employed in Architecture & Engineering in Muskegon, MI
RELATED REPORTS & OPTIONS
Architecture & Engineering
Muskegon
Compare Zip Codes
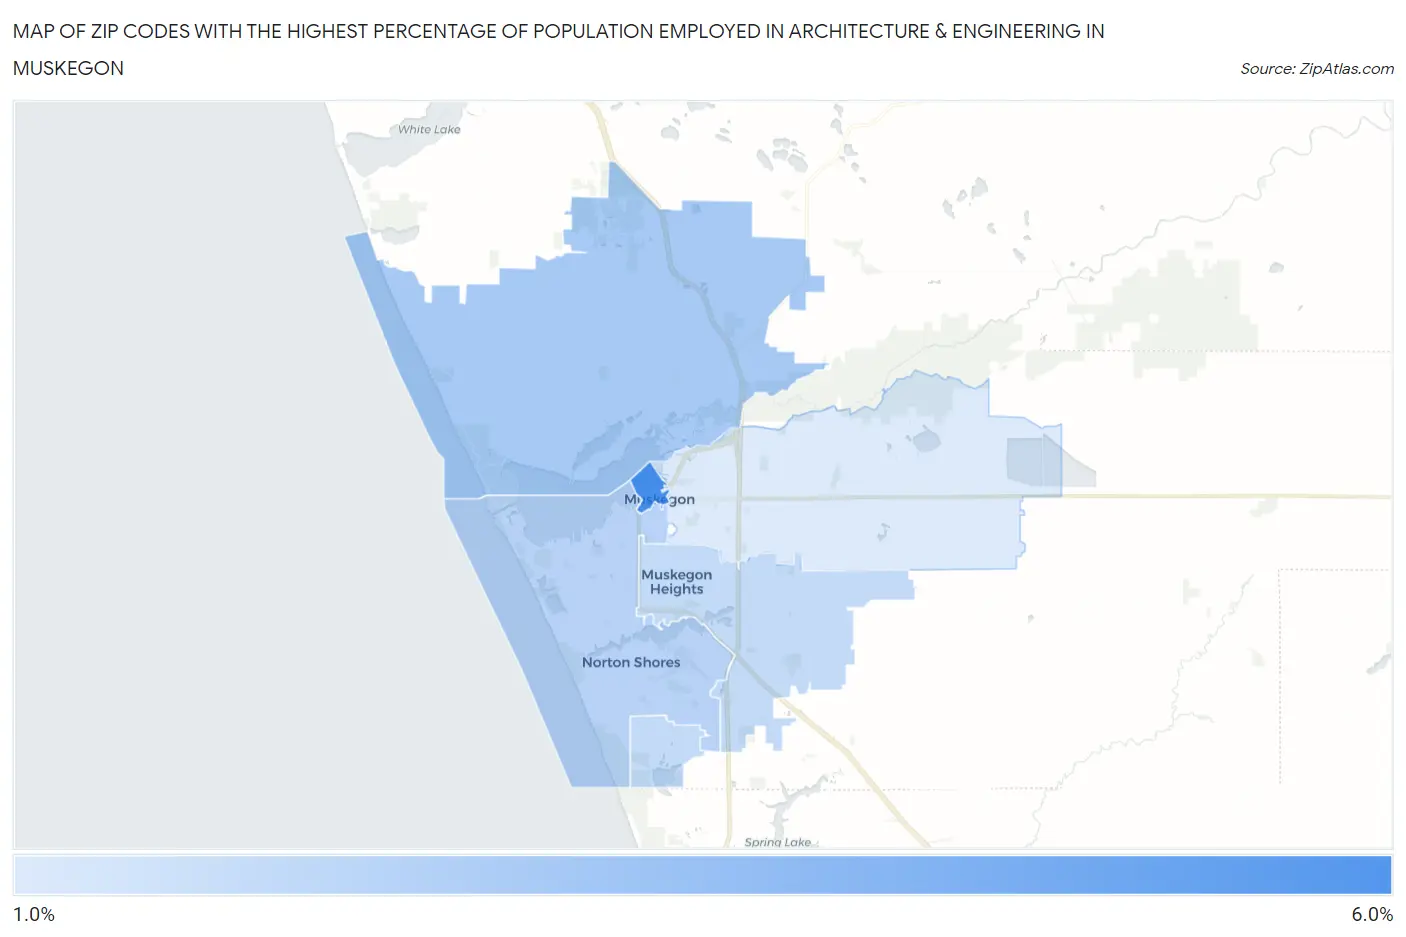
Map of Zip Codes with the Highest Percentage of Population Employed in Architecture & Engineering in Muskegon
1.2%
5.8%
Zip Codes with the Highest Percentage of Population Employed in Architecture & Engineering in Muskegon, MI
| Zip Code | % Employed | vs State | vs National | |
| 1. | 49440 | 5.8% | 3.4%(+2.42)#83 | 2.1%(+3.64)#1,180 |
| 2. | 49445 | 2.8% | 3.4%(-0.540)#304 | 2.1%(+0.678)#5,678 |
| 3. | 49441 | 2.3% | 3.4%(-1.03)#384 | 2.1%(+0.183)#7,791 |
| 4. | 49444 | 1.9% | 3.4%(-1.43)#467 | 2.1%(-0.214)#10,013 |
| 5. | 49442 | 1.2% | 3.4%(-2.16)#641 | 2.1%(-0.946)#15,043 |
1
Common Questions
What are the Top 3 Zip Codes with the Highest Percentage of Population Employed in Architecture & Engineering in Muskegon, MI?
Top 3 Zip Codes with the Highest Percentage of Population Employed in Architecture & Engineering in Muskegon, MI are:
What zip code has the Highest Percentage of Population Employed in Architecture & Engineering in Muskegon, MI?
49440 has the Highest Percentage of Population Employed in Architecture & Engineering in Muskegon, MI with 5.8%.
What is the Percentage of Population Employed in Architecture & Engineering in Muskegon, MI?
Percentage of Population Employed in Architecture & Engineering in Muskegon is 0.91%.
What is the Percentage of Population Employed in Architecture & Engineering in Michigan?
Percentage of Population Employed in Architecture & Engineering in Michigan is 3.4%.
What is the Percentage of Population Employed in Architecture & Engineering in the United States?
Percentage of Population Employed in Architecture & Engineering in the United States is 2.1%.