Zip Codes with the Highest Percentage of Population Employed in Architecture & Engineering in Washington, MI
RELATED REPORTS & OPTIONS
Architecture & Engineering
Washington
Compare Zip Codes
Map of Zip Codes with the Highest Percentage of Population Employed in Architecture & Engineering in Washington
6.2%
6.4%
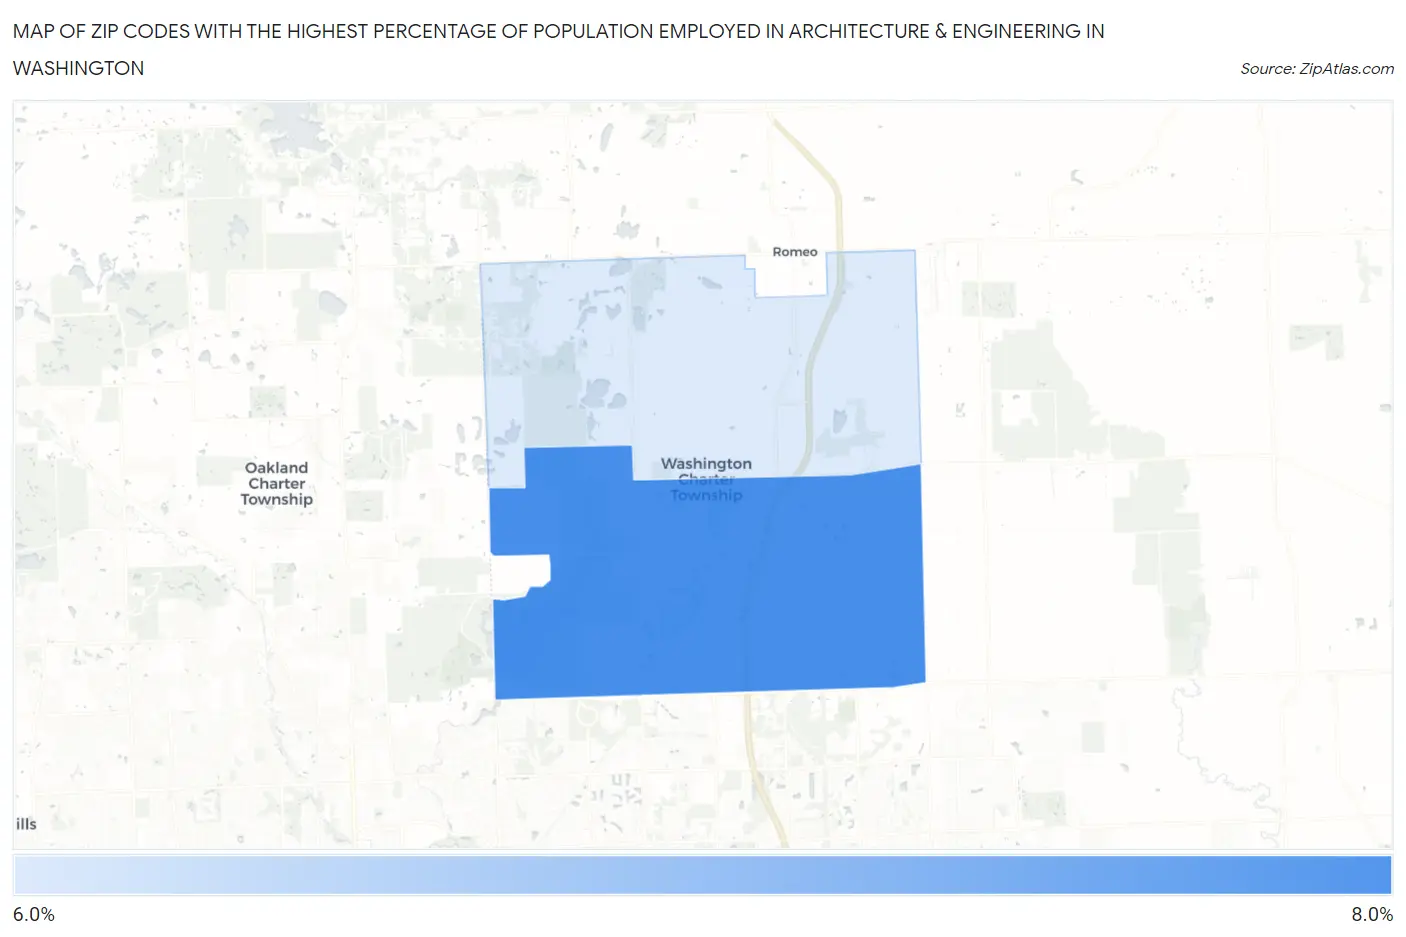
Zip Codes with the Highest Percentage of Population Employed in Architecture & Engineering in Washington, MI
| Zip Code | % Employed | vs State | vs National | |
| 1. | 48094 | 6.4% | 3.4%(+3.03)#62 | 2.1%(+4.25)#923 |
| 2. | 48095 | 6.2% | 3.4%(+2.88)#63 | 2.1%(+4.09)#986 |
1
Common Questions
What are the Top Zip Codes with the Highest Percentage of Population Employed in Architecture & Engineering in Washington, MI?
Top Zip Codes with the Highest Percentage of Population Employed in Architecture & Engineering in Washington, MI are:
What zip code has the Highest Percentage of Population Employed in Architecture & Engineering in Washington, MI?
48094 has the Highest Percentage of Population Employed in Architecture & Engineering in Washington, MI with 6.4%.
What is the Percentage of Population Employed in Architecture & Engineering in Michigan?
Percentage of Population Employed in Architecture & Engineering in Michigan is 3.4%.
What is the Percentage of Population Employed in Architecture & Engineering in the United States?
Percentage of Population Employed in Architecture & Engineering in the United States is 2.1%.