Cities with the Largest Canadian Community in Michigan
RELATED REPORTS & OPTIONS
Canadian
Michigan
Compare Cities
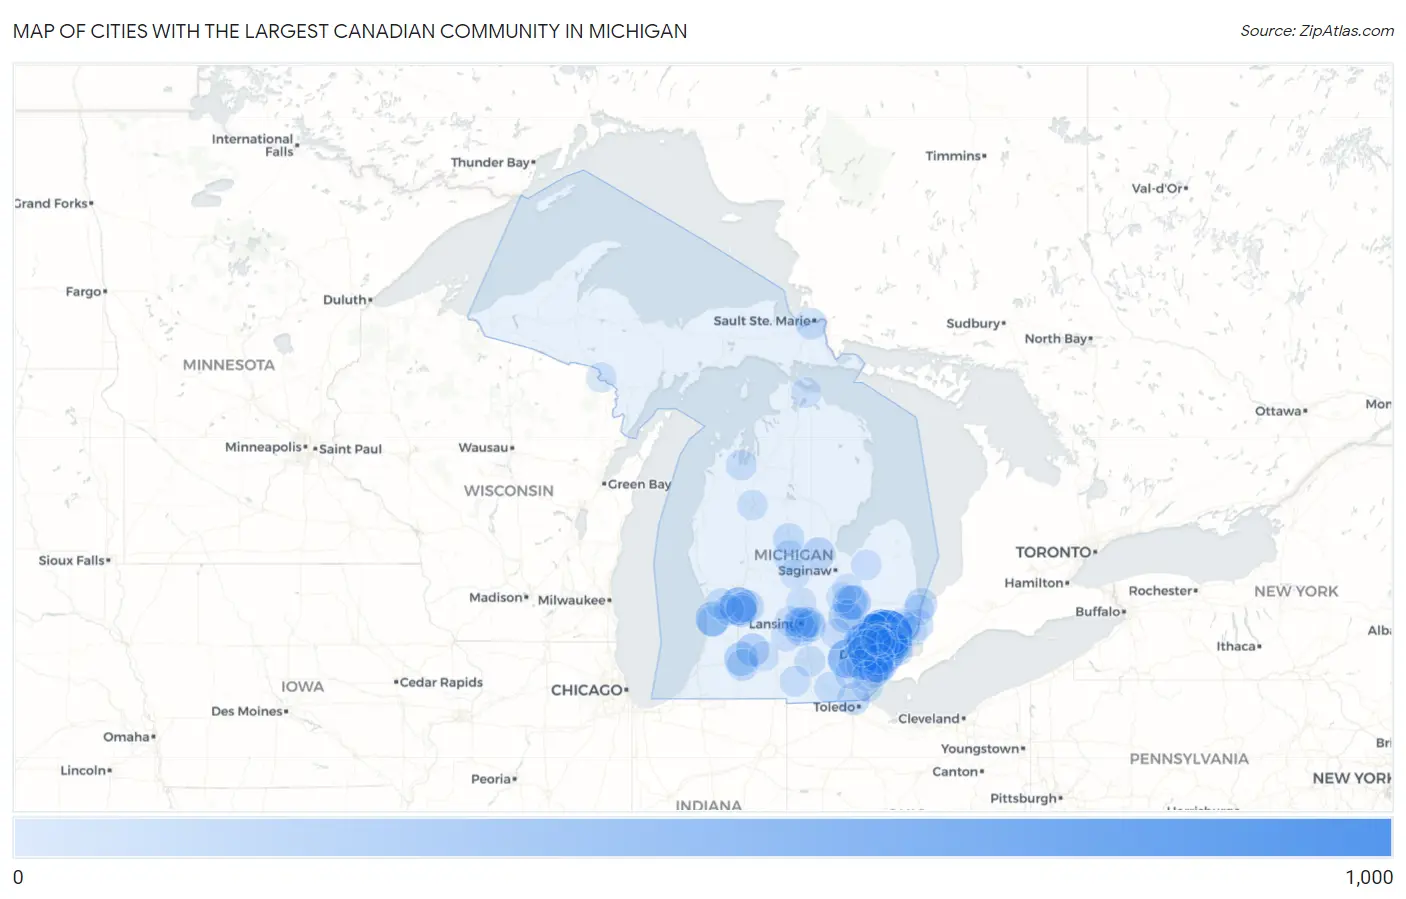
Map of Cities with the Largest Canadian Community in Michigan
0
1,000
Cities with the Largest Canadian Community in Michigan
| City | Canadian | vs State | vs National | |
| 1. | Sterling Heights | 954 | 37,188(2.57%)#1 | 590,636(0.16%)#32 |
| 2. | Troy | 776 | 37,188(2.09%)#2 | 590,636(0.13%)#45 |
| 3. | Detroit | 531 | 37,188(1.43%)#3 | 590,636(0.09%)#96 |
| 4. | Livonia | 510 | 37,188(1.37%)#4 | 590,636(0.09%)#107 |
| 5. | Taylor | 479 | 37,188(1.29%)#5 | 590,636(0.08%)#122 |
| 6. | Farmington Hills | 464 | 37,188(1.25%)#6 | 590,636(0.08%)#133 |
| 7. | Rochester Hills | 456 | 37,188(1.23%)#7 | 590,636(0.08%)#136 |
| 8. | Ann Arbor | 455 | 37,188(1.22%)#8 | 590,636(0.08%)#138 |
| 9. | Grand Rapids | 403 | 37,188(1.08%)#9 | 590,636(0.07%)#154 |
| 10. | Warren | 380 | 37,188(1.02%)#10 | 590,636(0.06%)#177 |
| 11. | Royal Oak | 365 | 37,188(0.98%)#11 | 590,636(0.06%)#195 |
| 12. | Westland | 295 | 37,188(0.79%)#12 | 590,636(0.05%)#268 |
| 13. | Novi | 265 | 37,188(0.71%)#13 | 590,636(0.04%)#305 |
| 14. | Dearborn Heights | 259 | 37,188(0.70%)#14 | 590,636(0.04%)#315 |
| 15. | Beechwood | 242 | 37,188(0.65%)#15 | 590,636(0.04%)#349 |
| 16. | Southfield | 237 | 37,188(0.64%)#16 | 590,636(0.04%)#358 |
| 17. | Flint | 235 | 37,188(0.63%)#17 | 590,636(0.04%)#362 |
| 18. | Burton | 225 | 37,188(0.61%)#18 | 590,636(0.04%)#381 |
| 19. | Lansing | 218 | 37,188(0.59%)#19 | 590,636(0.04%)#397 |
| 20. | Madison Heights | 218 | 37,188(0.59%)#20 | 590,636(0.04%)#398 |
| 21. | Kalamazoo | 213 | 37,188(0.57%)#21 | 590,636(0.04%)#408 |
| 22. | Grosse Pointe Woods | 207 | 37,188(0.56%)#22 | 590,636(0.04%)#425 |
| 23. | St Clair Shores | 205 | 37,188(0.55%)#23 | 590,636(0.03%)#429 |
| 24. | Center Line | 185 | 37,188(0.50%)#24 | 590,636(0.03%)#486 |
| 25. | South Gull Lake | 185 | 37,188(0.50%)#25 | 590,636(0.03%)#487 |
| 26. | Linden | 179 | 37,188(0.48%)#26 | 590,636(0.03%)#507 |
| 27. | Wyandotte | 177 | 37,188(0.48%)#27 | 590,636(0.03%)#518 |
| 28. | Dearborn | 171 | 37,188(0.46%)#28 | 590,636(0.03%)#541 |
| 29. | Pontiac | 162 | 37,188(0.44%)#29 | 590,636(0.03%)#578 |
| 30. | Midland | 159 | 37,188(0.43%)#30 | 590,636(0.03%)#584 |
| 31. | Allen Park | 157 | 37,188(0.42%)#31 | 590,636(0.03%)#593 |
| 32. | Holt | 155 | 37,188(0.42%)#32 | 590,636(0.03%)#602 |
| 33. | Forest Hills | 154 | 37,188(0.41%)#33 | 590,636(0.03%)#605 |
| 34. | Birmingham | 149 | 37,188(0.40%)#34 | 590,636(0.03%)#631 |
| 35. | Lambertville | 143 | 37,188(0.38%)#35 | 590,636(0.02%)#666 |
| 36. | Eastpointe | 139 | 37,188(0.37%)#36 | 590,636(0.02%)#689 |
| 37. | Lincoln Park | 135 | 37,188(0.36%)#37 | 590,636(0.02%)#704 |
| 38. | Roseville | 134 | 37,188(0.36%)#38 | 590,636(0.02%)#712 |
| 39. | Kentwood | 131 | 37,188(0.35%)#39 | 590,636(0.02%)#733 |
| 40. | Ferndale | 127 | 37,188(0.34%)#40 | 590,636(0.02%)#760 |
| 41. | East Lansing | 125 | 37,188(0.34%)#41 | 590,636(0.02%)#769 |
| 42. | Grosse Pointe Farms | 123 | 37,188(0.33%)#42 | 590,636(0.02%)#792 |
| 43. | Ypsilanti | 121 | 37,188(0.33%)#43 | 590,636(0.02%)#810 |
| 44. | Marine City | 118 | 37,188(0.32%)#44 | 590,636(0.02%)#832 |
| 45. | Port Huron | 117 | 37,188(0.31%)#45 | 590,636(0.02%)#840 |
| 46. | Portage | 113 | 37,188(0.30%)#46 | 590,636(0.02%)#873 |
| 47. | Northville | 112 | 37,188(0.30%)#47 | 590,636(0.02%)#887 |
| 48. | Mount Pleasant | 111 | 37,188(0.30%)#48 | 590,636(0.02%)#891 |
| 49. | Rochester | 111 | 37,188(0.30%)#49 | 590,636(0.02%)#894 |
| 50. | Walled Lake | 108 | 37,188(0.29%)#50 | 590,636(0.02%)#922 |
| 51. | Okemos | 107 | 37,188(0.29%)#51 | 590,636(0.02%)#932 |
| 52. | Clare | 104 | 37,188(0.28%)#52 | 590,636(0.02%)#966 |
| 53. | Sault Ste Marie | 101 | 37,188(0.27%)#53 | 590,636(0.02%)#994 |
| 54. | Holland | 100 | 37,188(0.27%)#54 | 590,636(0.02%)#1,005 |
| 55. | Garden City | 97 | 37,188(0.26%)#55 | 590,636(0.02%)#1,036 |
| 56. | Adrian | 97 | 37,188(0.26%)#56 | 590,636(0.02%)#1,039 |
| 57. | Allendale | 91 | 37,188(0.24%)#57 | 590,636(0.02%)#1,100 |
| 58. | Clawson | 88 | 37,188(0.24%)#58 | 590,636(0.01%)#1,127 |
| 59. | Marysville | 84 | 37,188(0.23%)#59 | 590,636(0.01%)#1,182 |
| 60. | Wayne | 80 | 37,188(0.22%)#60 | 590,636(0.01%)#1,248 |
| 61. | Berkley | 79 | 37,188(0.21%)#61 | 590,636(0.01%)#1,261 |
| 62. | New Baltimore | 78 | 37,188(0.21%)#62 | 590,636(0.01%)#1,276 |
| 63. | Monroe | 76 | 37,188(0.20%)#63 | 590,636(0.01%)#1,296 |
| 64. | Jenison | 75 | 37,188(0.20%)#64 | 590,636(0.01%)#1,309 |
| 65. | Jackson | 74 | 37,188(0.20%)#65 | 590,636(0.01%)#1,322 |
| 66. | Hazel Park | 74 | 37,188(0.20%)#66 | 590,636(0.01%)#1,327 |
| 67. | Traverse City | 73 | 37,188(0.20%)#67 | 590,636(0.01%)#1,345 |
| 68. | Jonesville | 73 | 37,188(0.20%)#68 | 590,636(0.01%)#1,352 |
| 69. | Auburn Hills | 71 | 37,188(0.19%)#69 | 590,636(0.01%)#1,377 |
| 70. | Trenton | 68 | 37,188(0.18%)#70 | 590,636(0.01%)#1,426 |
| 71. | Charlotte | 66 | 37,188(0.18%)#71 | 590,636(0.01%)#1,460 |
| 72. | Harper Woods | 63 | 37,188(0.17%)#72 | 590,636(0.01%)#1,498 |
| 73. | Flat Rock | 63 | 37,188(0.17%)#73 | 590,636(0.01%)#1,501 |
| 74. | Grand Ledge | 62 | 37,188(0.17%)#74 | 590,636(0.01%)#1,524 |
| 75. | Caro | 61 | 37,188(0.16%)#75 | 590,636(0.01%)#1,549 |
| 76. | Farmington | 60 | 37,188(0.16%)#76 | 590,636(0.01%)#1,566 |
| 77. | Lake Fenton | 60 | 37,188(0.16%)#77 | 590,636(0.01%)#1,568 |
| 78. | Edgemont Park | 60 | 37,188(0.16%)#78 | 590,636(0.01%)#1,573 |
| 79. | East Grand Rapids | 59 | 37,188(0.16%)#79 | 590,636(0.01%)#1,593 |
| 80. | Riverview | 58 | 37,188(0.16%)#80 | 590,636(0.01%)#1,614 |
| 81. | Milan | 58 | 37,188(0.16%)#81 | 590,636(0.01%)#1,623 |
| 82. | Haslett | 57 | 37,188(0.15%)#82 | 590,636(0.01%)#1,643 |
| 83. | Fraser | 57 | 37,188(0.15%)#83 | 590,636(0.01%)#1,644 |
| 84. | Melvindale | 57 | 37,188(0.15%)#84 | 590,636(0.01%)#1,647 |
| 85. | Howell | 57 | 37,188(0.15%)#85 | 590,636(0.01%)#1,648 |
| 86. | New Haven | 57 | 37,188(0.15%)#86 | 590,636(0.01%)#1,655 |
| 87. | Cadillac | 53 | 37,188(0.14%)#87 | 590,636(0.01%)#1,753 |
| 88. | Huntington Woods | 51 | 37,188(0.14%)#88 | 590,636(0.01%)#1,809 |
| 89. | Cheboygan | 50 | 37,188(0.13%)#89 | 590,636(0.01%)#1,832 |
| 90. | Belleville | 49 | 37,188(0.13%)#90 | 590,636(0.01%)#1,854 |
| 91. | Carleton | 49 | 37,188(0.13%)#91 | 590,636(0.01%)#1,856 |
| 92. | Battle Creek | 48 | 37,188(0.13%)#92 | 590,636(0.01%)#1,862 |
| 93. | Plymouth | 47 | 37,188(0.13%)#93 | 590,636(0.01%)#1,919 |
| 94. | Flushing | 47 | 37,188(0.13%)#94 | 590,636(0.01%)#1,920 |
| 95. | Beverly Hills | 46 | 37,188(0.12%)#95 | 590,636(0.01%)#1,948 |
| 96. | Pearl Beach | 46 | 37,188(0.12%)#96 | 590,636(0.01%)#1,956 |
| 97. | Clio | 46 | 37,188(0.12%)#97 | 590,636(0.01%)#1,962 |
| 98. | St Johns | 45 | 37,188(0.12%)#98 | 590,636(0.01%)#1,984 |
| 99. | Alma | 44 | 37,188(0.12%)#99 | 590,636(0.01%)#2,012 |
| 100. | Iron Mountain | 44 | 37,188(0.12%)#100 | 590,636(0.01%)#2,018 |
Common Questions
What are the Top 10 Cities with the Largest Canadian Community in Michigan?
Top 10 Cities with the Largest Canadian Community in Michigan are:
#1
954
#2
776
#3
531
#4
510
#5
479
#6
464
#7
456
#8
455
#9
403
#10
380
What city has the Largest Canadian Community in Michigan?
Sterling Heights has the Largest Canadian Community in Michigan with 954.
What is the Total Canadian Population in the State of Michigan?
Total Canadian Population in Michigan is 37,188.
What is the Total Canadian Population in the United States?
Total Canadian Population in the United States is 590,636.