Zip Codes with the Highest Percentage of Population Employed in Architecture & Engineering in Rochester, MI
RELATED REPORTS & OPTIONS
Architecture & Engineering
Rochester
Compare Zip Codes
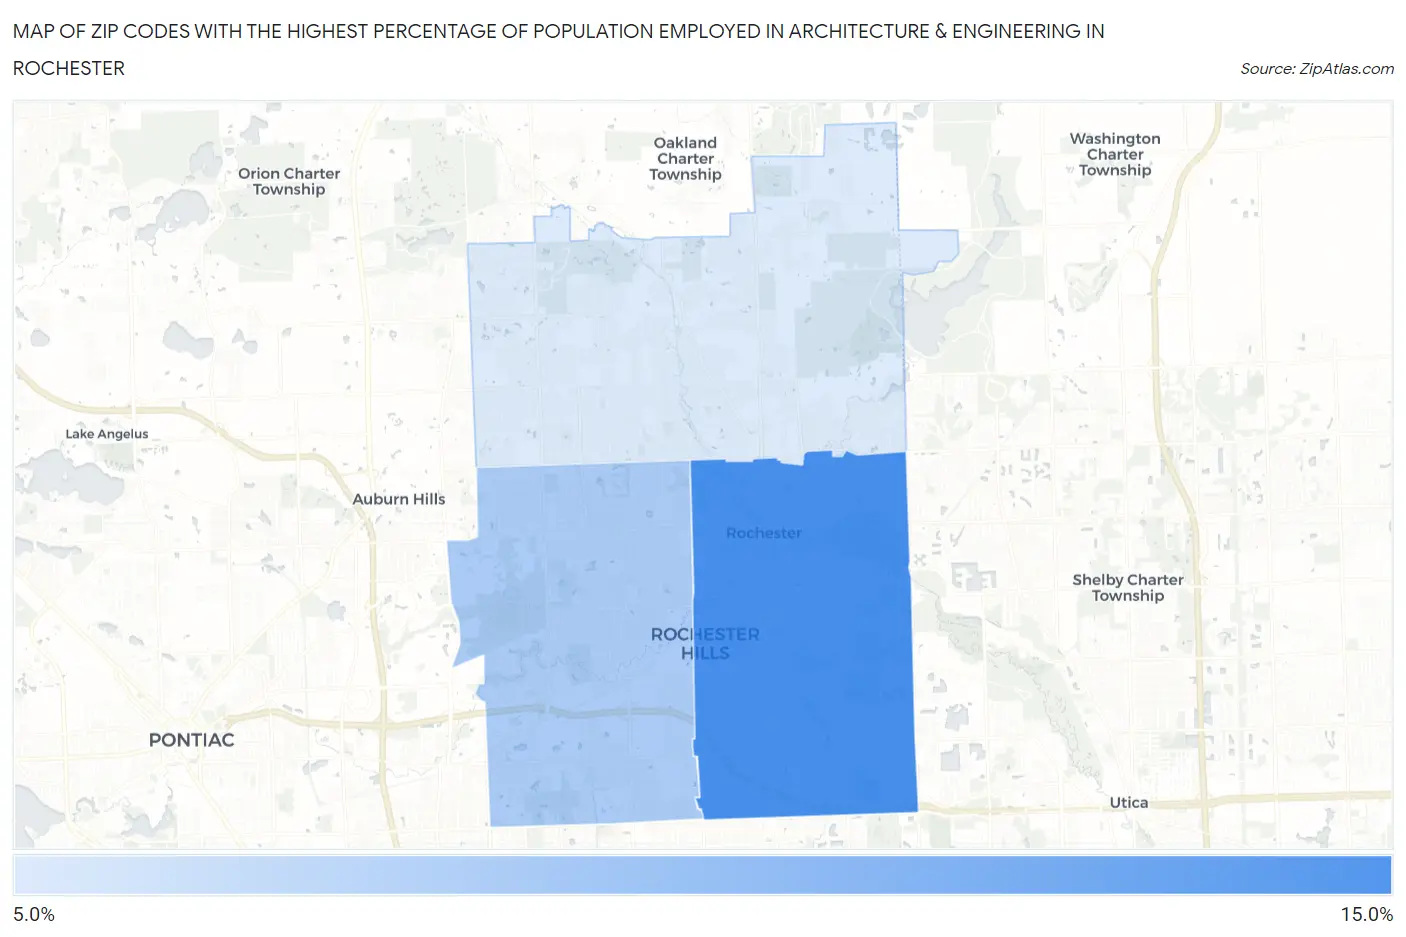
Map of Zip Codes with the Highest Percentage of Population Employed in Architecture & Engineering in Rochester
7.6%
10.0%
Zip Codes with the Highest Percentage of Population Employed in Architecture & Engineering in Rochester, MI
| Zip Code | % Employed | vs State | vs National | |
| 1. | 48307 | 10.0% | 3.4%(+6.66)#16 | 2.1%(+7.88)#338 |
| 2. | 48309 | 8.4% | 3.4%(+5.06)#30 | 2.1%(+6.28)#496 |
| 3. | 48306 | 7.6% | 3.4%(+4.24)#38 | 2.1%(+5.45)#640 |
1
Common Questions
What are the Top Zip Codes with the Highest Percentage of Population Employed in Architecture & Engineering in Rochester, MI?
Top Zip Codes with the Highest Percentage of Population Employed in Architecture & Engineering in Rochester, MI are:
What zip code has the Highest Percentage of Population Employed in Architecture & Engineering in Rochester, MI?
48307 has the Highest Percentage of Population Employed in Architecture & Engineering in Rochester, MI with 10.0%.
What is the Percentage of Population Employed in Architecture & Engineering in Rochester, MI?
Percentage of Population Employed in Architecture & Engineering in Rochester is 7.3%.
What is the Percentage of Population Employed in Architecture & Engineering in Michigan?
Percentage of Population Employed in Architecture & Engineering in Michigan is 3.4%.
What is the Percentage of Population Employed in Architecture & Engineering in the United States?
Percentage of Population Employed in Architecture & Engineering in the United States is 2.1%.