Cities with the Largest Nigerian Community in Michigan
RELATED REPORTS & OPTIONS
Nigerian
Michigan
Compare Cities
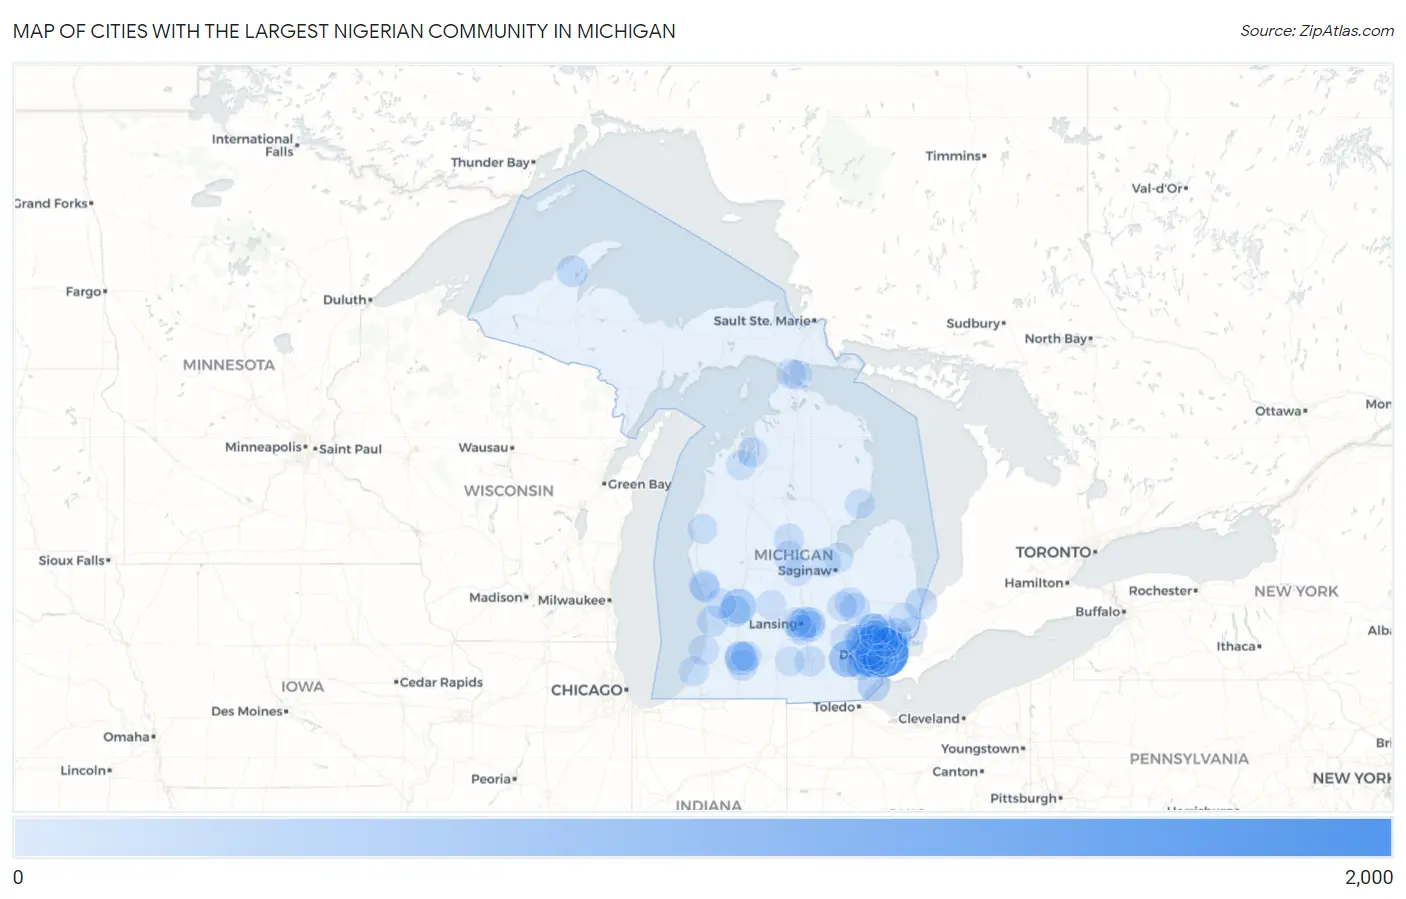
Map of Cities with the Largest Nigerian Community in Michigan
0
2,000
Cities with the Largest Nigerian Community in Michigan
| City | Nigerian | vs State | vs National | |
| 1. | Detroit | 1,776 | 10,457(16.98%)#1 | 581,853(0.31%)#29 |
| 2. | Westland | 878 | 10,457(8.40%)#2 | 581,853(0.15%)#83 |
| 3. | Southfield | 648 | 10,457(6.20%)#3 | 581,853(0.11%)#129 |
| 4. | Ann Arbor | 600 | 10,457(5.74%)#4 | 581,853(0.10%)#138 |
| 5. | Grand Rapids | 423 | 10,457(4.05%)#5 | 581,853(0.07%)#204 |
| 6. | Pontiac | 285 | 10,457(2.73%)#6 | 581,853(0.05%)#326 |
| 7. | Kalamazoo | 236 | 10,457(2.26%)#7 | 581,853(0.04%)#386 |
| 8. | Stony Point | 225 | 10,457(2.15%)#8 | 581,853(0.04%)#407 |
| 9. | Wyoming | 163 | 10,457(1.56%)#9 | 581,853(0.03%)#551 |
| 10. | Farmington Hills | 157 | 10,457(1.50%)#10 | 581,853(0.03%)#575 |
| 11. | Lansing | 149 | 10,457(1.42%)#11 | 581,853(0.03%)#603 |
| 12. | East Lansing | 141 | 10,457(1.35%)#12 | 581,853(0.02%)#633 |
| 13. | Port Huron | 138 | 10,457(1.32%)#13 | 581,853(0.02%)#646 |
| 14. | Warren | 127 | 10,457(1.21%)#14 | 581,853(0.02%)#684 |
| 15. | Houghton | 124 | 10,457(1.19%)#15 | 581,853(0.02%)#697 |
| 16. | Inkster | 122 | 10,457(1.17%)#16 | 581,853(0.02%)#704 |
| 17. | Highland Park | 118 | 10,457(1.13%)#17 | 581,853(0.02%)#721 |
| 18. | Dearborn | 117 | 10,457(1.12%)#18 | 581,853(0.02%)#722 |
| 19. | Wayne | 111 | 10,457(1.06%)#19 | 581,853(0.02%)#756 |
| 20. | Orchard Lake Village | 101 | 10,457(0.97%)#20 | 581,853(0.02%)#813 |
| 21. | Taylor | 93 | 10,457(0.89%)#21 | 581,853(0.02%)#845 |
| 22. | Portage | 93 | 10,457(0.89%)#22 | 581,853(0.02%)#847 |
| 23. | Oak Park | 90 | 10,457(0.86%)#23 | 581,853(0.02%)#869 |
| 24. | Ferndale | 84 | 10,457(0.80%)#24 | 581,853(0.01%)#917 |
| 25. | Grand Blanc | 79 | 10,457(0.76%)#25 | 581,853(0.01%)#959 |
| 26. | Westwood | 78 | 10,457(0.75%)#26 | 581,853(0.01%)#973 |
| 27. | Holland | 77 | 10,457(0.74%)#27 | 581,853(0.01%)#976 |
| 28. | Ypsilanti | 77 | 10,457(0.74%)#28 | 581,853(0.01%)#979 |
| 29. | Beverly Hills | 72 | 10,457(0.69%)#29 | 581,853(0.01%)#1,023 |
| 30. | Mount Clemens | 67 | 10,457(0.64%)#30 | 581,853(0.01%)#1,074 |
| 31. | Novi | 65 | 10,457(0.62%)#31 | 581,853(0.01%)#1,085 |
| 32. | Okemos | 62 | 10,457(0.59%)#32 | 581,853(0.01%)#1,123 |
| 33. | Mount Pleasant | 62 | 10,457(0.59%)#33 | 581,853(0.01%)#1,125 |
| 34. | Comstock Northwest | 61 | 10,457(0.58%)#34 | 581,853(0.01%)#1,141 |
| 35. | Romulus | 58 | 10,457(0.55%)#35 | 581,853(0.01%)#1,166 |
| 36. | Harper Woods | 58 | 10,457(0.55%)#36 | 581,853(0.01%)#1,171 |
| 37. | Jackson | 54 | 10,457(0.52%)#37 | 581,853(0.01%)#1,208 |
| 38. | Haslett | 53 | 10,457(0.51%)#38 | 581,853(0.01%)#1,220 |
| 39. | Roseville | 46 | 10,457(0.44%)#39 | 581,853(0.01%)#1,319 |
| 40. | Holt | 45 | 10,457(0.43%)#40 | 581,853(0.01%)#1,335 |
| 41. | South Haven | 41 | 10,457(0.39%)#41 | 581,853(0.01%)#1,407 |
| 42. | Belleville | 35 | 10,457(0.33%)#42 | 581,853(0.01%)#1,514 |
| 43. | Allendale | 34 | 10,457(0.33%)#43 | 581,853(0.01%)#1,521 |
| 44. | Allen Park | 32 | 10,457(0.31%)#44 | 581,853(0.01%)#1,565 |
| 45. | Dearborn Heights | 30 | 10,457(0.29%)#45 | 581,853(0.01%)#1,613 |
| 46. | Scotts | 30 | 10,457(0.29%)#46 | 581,853(0.01%)#1,632 |
| 47. | Muskegon | 28 | 10,457(0.27%)#47 | 581,853(0.00%)#1,658 |
| 48. | Walled Lake | 28 | 10,457(0.27%)#48 | 581,853(0.00%)#1,677 |
| 49. | Sterling Heights | 27 | 10,457(0.26%)#49 | 581,853(0.00%)#1,682 |
| 50. | Franklin | 27 | 10,457(0.26%)#50 | 581,853(0.00%)#1,700 |
| 51. | Wixom | 26 | 10,457(0.25%)#51 | 581,853(0.00%)#1,716 |
| 52. | Garden City | 23 | 10,457(0.22%)#52 | 581,853(0.00%)#1,796 |
| 53. | Flint | 22 | 10,457(0.21%)#53 | 581,853(0.00%)#1,825 |
| 54. | Clare | 22 | 10,457(0.21%)#54 | 581,853(0.00%)#1,849 |
| 55. | Troy | 19 | 10,457(0.18%)#55 | 581,853(0.00%)#1,925 |
| 56. | Madison Heights | 19 | 10,457(0.18%)#56 | 581,853(0.00%)#1,935 |
| 57. | Muskegon Heights | 18 | 10,457(0.17%)#57 | 581,853(0.00%)#1,984 |
| 58. | Livonia | 15 | 10,457(0.14%)#58 | 581,853(0.00%)#2,078 |
| 59. | Ionia | 15 | 10,457(0.14%)#59 | 581,853(0.00%)#2,102 |
| 60. | Mackinac Island | 15 | 10,457(0.14%)#60 | 581,853(0.00%)#2,124 |
| 61. | Tawas City | 13 | 10,457(0.12%)#61 | 581,853(0.00%)#2,225 |
| 62. | Rochester Hills | 12 | 10,457(0.11%)#62 | 581,853(0.00%)#2,233 |
| 63. | Waverly | 11 | 10,457(0.11%)#63 | 581,853(0.00%)#2,313 |
| 64. | Center Line | 11 | 10,457(0.11%)#64 | 581,853(0.00%)#2,335 |
| 65. | St Louis | 11 | 10,457(0.11%)#65 | 581,853(0.00%)#2,342 |
| 66. | Bay City | 10 | 10,457(0.10%)#66 | 581,853(0.00%)#2,374 |
| 67. | River Rouge | 10 | 10,457(0.10%)#67 | 581,853(0.00%)#2,407 |
| 68. | Swartz Creek | 9 | 10,457(0.09%)#68 | 581,853(0.00%)#2,479 |
| 69. | Traverse City | 8 | 10,457(0.08%)#69 | 581,853(0.00%)#2,530 |
| 70. | Brighton | 8 | 10,457(0.08%)#70 | 581,853(0.00%)#2,548 |
| 71. | Pearl Beach | 8 | 10,457(0.08%)#71 | 581,853(0.00%)#2,551 |
| 72. | Auburn Hills | 7 | 10,457(0.07%)#72 | 581,853(0.00%)#2,586 |
| 73. | Bloomfield Hills | 7 | 10,457(0.07%)#73 | 581,853(0.00%)#2,606 |
| 74. | Benton Harbor | 6 | 10,457(0.06%)#74 | 581,853(0.00%)#2,653 |
| 75. | Freeland | 6 | 10,457(0.06%)#75 | 581,853(0.00%)#2,656 |
| 76. | Elk Rapids | 6 | 10,457(0.06%)#76 | 581,853(0.00%)#2,682 |
| 77. | Richmond | 5 | 10,457(0.05%)#77 | 581,853(0.00%)#2,720 |
| 78. | Scottville | 4 | 10,457(0.04%)#78 | 581,853(0.00%)#2,799 |
| 79. | St Ignace | 2 | 10,457(0.02%)#79 | 581,853(0.00%)#2,904 |
| 80. | Albion | 1 | 10,457(0.01%)#80 | 581,853(0.00%)#2,959 |
Common Questions
What are the Top 10 Cities with the Largest Nigerian Community in Michigan?
Top 10 Cities with the Largest Nigerian Community in Michigan are:
#1
1,776
#2
878
#3
648
#4
600
#5
423
#6
285
#7
236
#8
225
#9
163
#10
157
What city has the Largest Nigerian Community in Michigan?
Detroit has the Largest Nigerian Community in Michigan with 1,776.
What is the Total Nigerian Population in the State of Michigan?
Total Nigerian Population in Michigan is 10,457.
What is the Total Nigerian Population in the United States?
Total Nigerian Population in the United States is 581,853.