New Baltimore, MI Map & Demographics
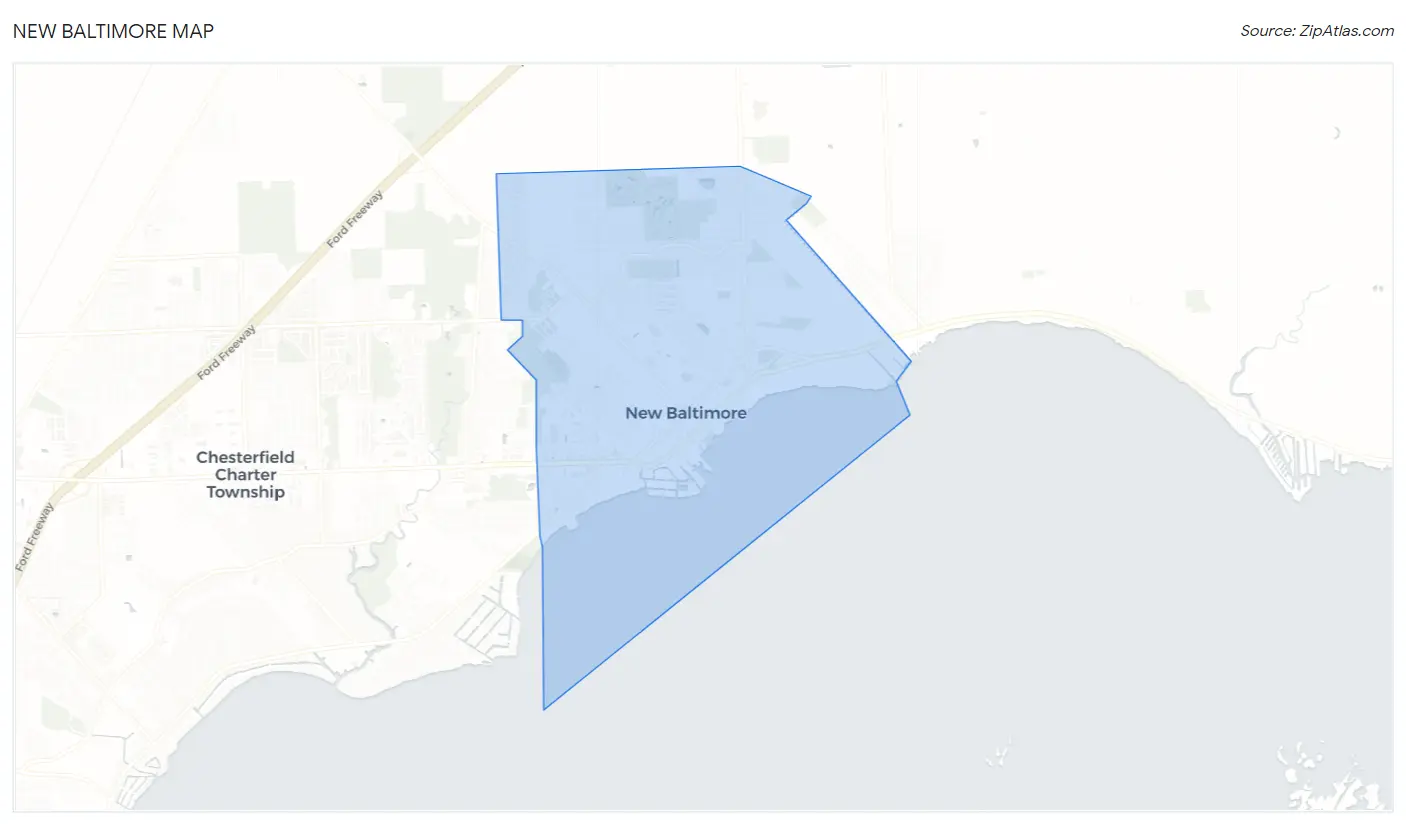
New Baltimore Map
New Baltimore Overview
$40,391
PER CAPITA INCOME
$112,943
AVG FAMILY INCOME
$90,028
AVG HOUSEHOLD INCOME
50.5%
WAGE / INCOME GAP [ % ]
49.5¢/ $1
WAGE / INCOME GAP [ $ ]
0.38
INEQUALITY / GINI INDEX
12,104
TOTAL POPULATION
5,853
MALE POPULATION
6,251
FEMALE POPULATION
93.63
MALES / 100 FEMALES
106.80
FEMALES / 100 MALES
41.9
MEDIAN AGE
3.1
AVG FAMILY SIZE
2.6
AVG HOUSEHOLD SIZE
6,390
LABOR FORCE [ PEOPLE ]
65.2%
PERCENT IN LABOR FORCE
4.3%
UNEMPLOYMENT RATE
New Baltimore Area Codes
Income in New Baltimore
Income Overview in New Baltimore
Per Capita Income in New Baltimore is $40,391, while median incomes of families and households are $112,943 and $90,028 respectively.
| Characteristic | Number | Measure |
| Per Capita Income | 12,104 | $40,391 |
| Median Family Income | 3,205 | $112,943 |
| Mean Family Income | 3,205 | $124,140 |
| Median Household Income | 4,691 | $90,028 |
| Mean Household Income | 4,691 | $103,802 |
| Income Deficit | 3,205 | $0 |
| Wage / Income Gap (%) | 12,104 | 50.54% |
| Wage / Income Gap ($) | 12,104 | 49.46¢ per $1 |
| Gini / Inequality Index | 12,104 | 0.38 |
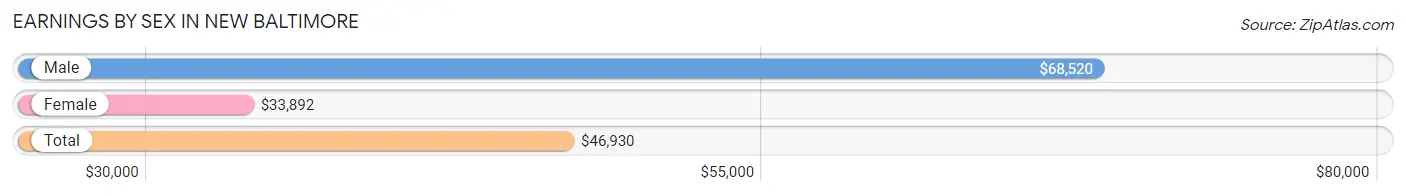
Earnings by Sex in New Baltimore
Average Earnings in New Baltimore are $46,930, $68,520 for men and $33,892 for women, a difference of 50.5%.
| Sex | Number | Average Earnings |
| Male | 3,364 (50.5%) | $68,520 |
| Female | 3,292 (49.5%) | $33,892 |
| Total | 6,656 (100.0%) | $46,930 |
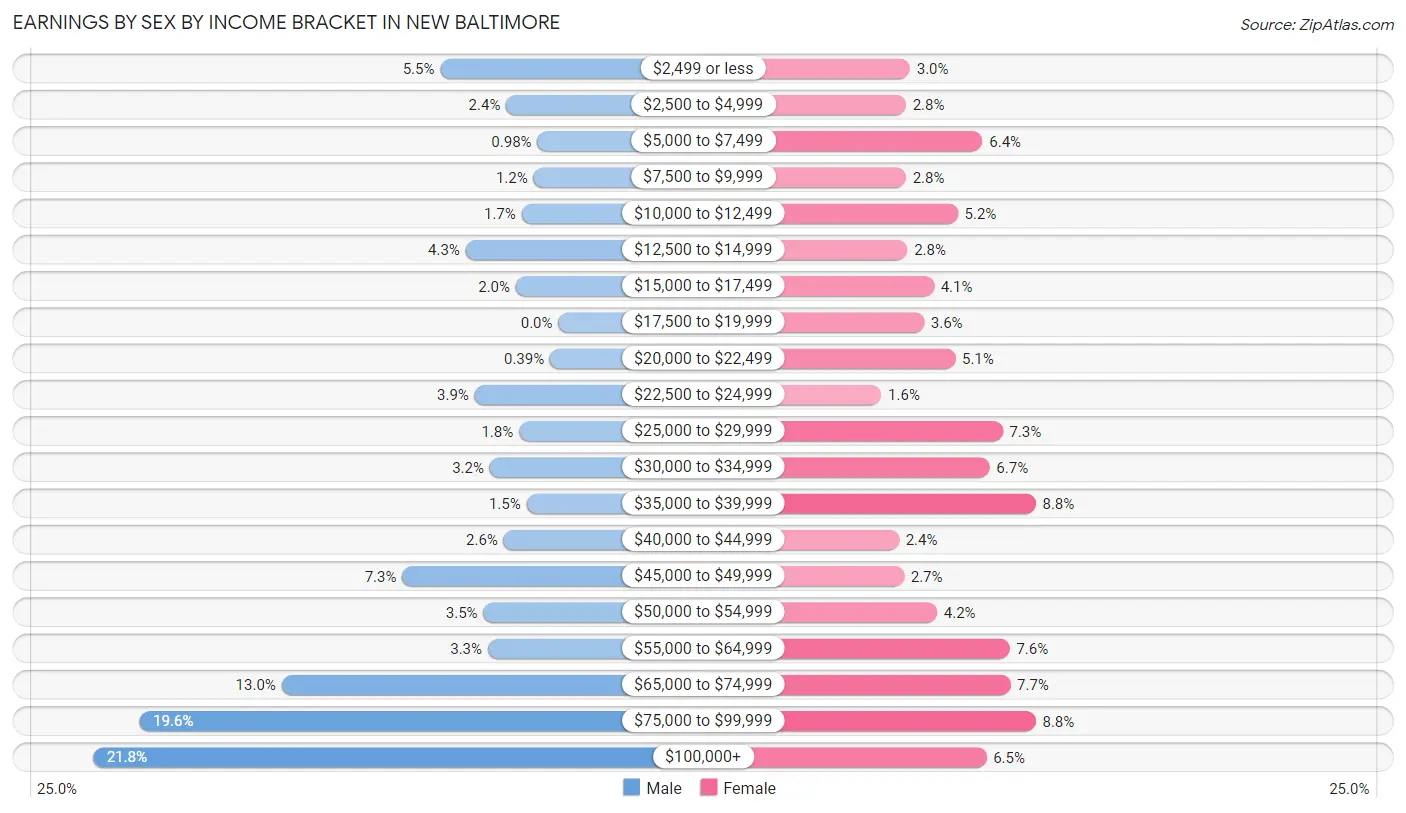
Earnings by Sex by Income Bracket in New Baltimore
The most common earnings brackets in New Baltimore are $100,000+ for men (732 | 21.8%) and $35,000 to $39,999 for women (291 | 8.8%).
| Income | Male | Female |
| $2,499 or less | 186 (5.5%) | 97 (2.9%) |
| $2,500 to $4,999 | 82 (2.4%) | 91 (2.8%) |
| $5,000 to $7,499 | 33 (1.0%) | 209 (6.4%) |
| $7,500 to $9,999 | 39 (1.2%) | 91 (2.8%) |
| $10,000 to $12,499 | 58 (1.7%) | 171 (5.2%) |
| $12,500 to $14,999 | 146 (4.3%) | 93 (2.8%) |
| $15,000 to $17,499 | 67 (2.0%) | 134 (4.1%) |
| $17,500 to $19,999 | 0 (0.0%) | 119 (3.6%) |
| $20,000 to $22,499 | 13 (0.4%) | 167 (5.1%) |
| $22,500 to $24,999 | 132 (3.9%) | 53 (1.6%) |
| $25,000 to $29,999 | 62 (1.8%) | 240 (7.3%) |
| $30,000 to $34,999 | 108 (3.2%) | 220 (6.7%) |
| $35,000 to $39,999 | 50 (1.5%) | 291 (8.8%) |
| $40,000 to $44,999 | 86 (2.6%) | 80 (2.4%) |
| $45,000 to $49,999 | 246 (7.3%) | 88 (2.7%) |
| $50,000 to $54,999 | 118 (3.5%) | 139 (4.2%) |
| $55,000 to $64,999 | 111 (3.3%) | 251 (7.6%) |
| $65,000 to $74,999 | 436 (13.0%) | 252 (7.6%) |
| $75,000 to $99,999 | 659 (19.6%) | 291 (8.8%) |
| $100,000+ | 732 (21.8%) | 215 (6.5%) |
| Total | 3,364 (100.0%) | 3,292 (100.0%) |
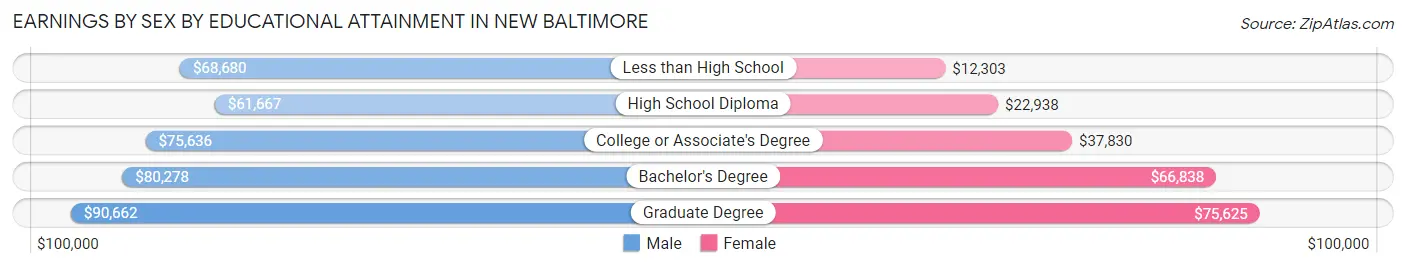
Earnings by Sex by Educational Attainment in New Baltimore
Average earnings in New Baltimore are $72,795 for men and $39,057 for women, a difference of 46.4%. Men with an educational attainment of graduate degree enjoy the highest average annual earnings of $90,662, while those with high school diploma education earn the least with $61,667. Women with an educational attainment of graduate degree earn the most with the average annual earnings of $75,625, while those with less than high school education have the smallest earnings of $12,303.
| Educational Attainment | Male Income | Female Income |
| Less than High School | $68,680 | $12,303 |
| High School Diploma | $61,667 | $22,938 |
| College or Associate's Degree | $75,636 | $37,830 |
| Bachelor's Degree | $80,278 | $66,838 |
| Graduate Degree | $90,662 | $75,625 |
| Total | $72,795 | $39,057 |
Family Income in New Baltimore
Family Income Brackets in New Baltimore
According to the New Baltimore family income data, there are 760 families falling into the $100,000 to $149,999 income range, which is the most common income bracket and makes up 23.7% of all families. Conversely, the $10,000 to $14,999 income bracket is the least frequent group with only 19 families (0.6%) belonging to this category.
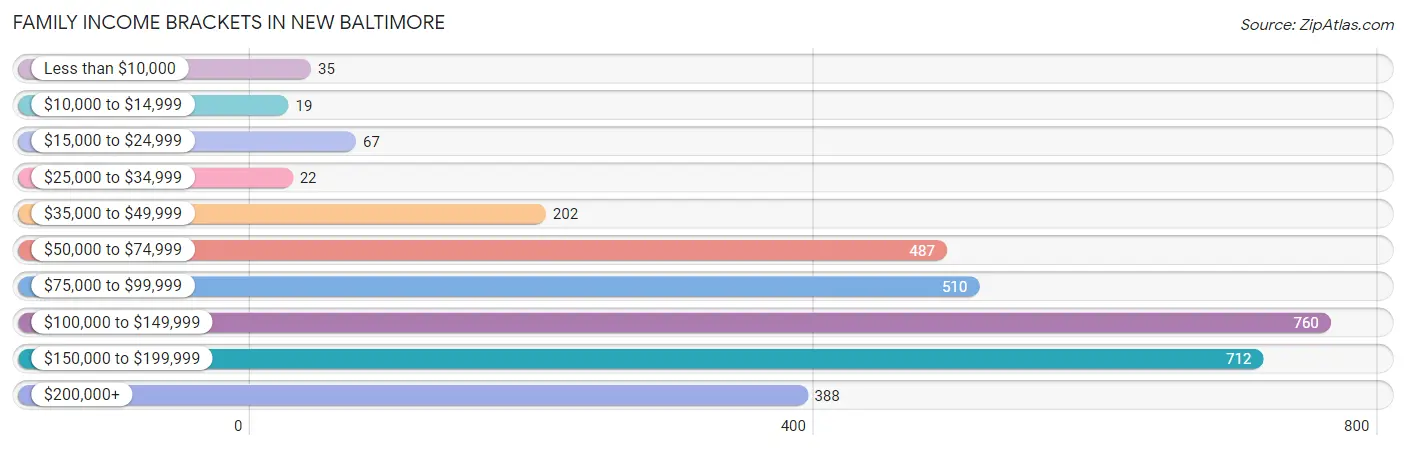
| Income Bracket | # Families | % Families |
| Less than $10,000 | 35 | 1.1% |
| $10,000 to $14,999 | 19 | 0.6% |
| $15,000 to $24,999 | 67 | 2.1% |
| $25,000 to $34,999 | 22 | 0.7% |
| $35,000 to $49,999 | 202 | 6.3% |
| $50,000 to $74,999 | 487 | 15.2% |
| $75,000 to $99,999 | 510 | 15.9% |
| $100,000 to $149,999 | 760 | 23.7% |
| $150,000 to $199,999 | 712 | 22.2% |
| $200,000+ | 388 | 12.1% |
Family Income by Famaliy Size in New Baltimore
4-person families (769 | 24.0%) account for the highest median family income in New Baltimore with $135,721 per family, while 2-person families (1,300 | 40.6%) have the highest median income of $46,458 per family member.
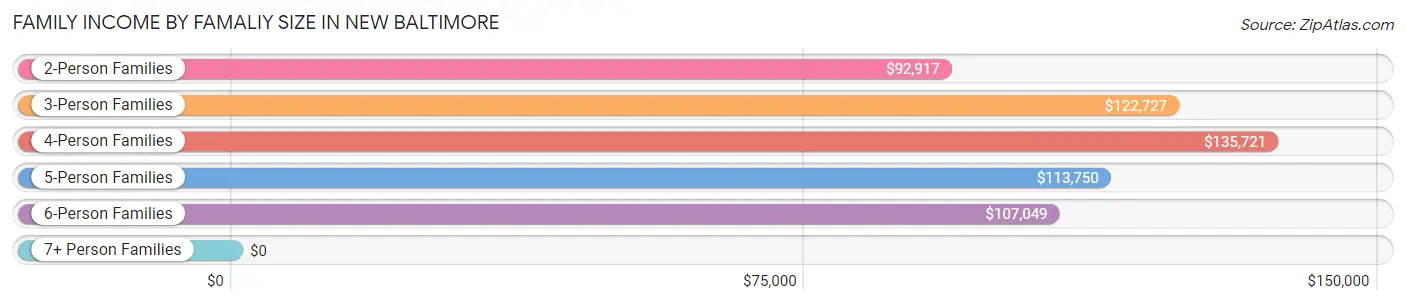
| Income Bracket | # Families | Median Income |
| 2-Person Families | 1,300 (40.6%) | $92,917 |
| 3-Person Families | 754 (23.5%) | $122,727 |
| 4-Person Families | 769 (24.0%) | $135,721 |
| 5-Person Families | 198 (6.2%) | $113,750 |
| 6-Person Families | 162 (5.1%) | $107,049 |
| 7+ Person Families | 22 (0.7%) | $0 |
| Total | 3,205 (100.0%) | $112,943 |
Family Income by Number of Earners in New Baltimore
The median family income in New Baltimore is $112,943, with families comprising 3+ earners (528) having the highest median family income of $166,500, while families with 1 earner (699) have the lowest median family income of $74,297, accounting for 16.5% and 21.8% of families, respectively.
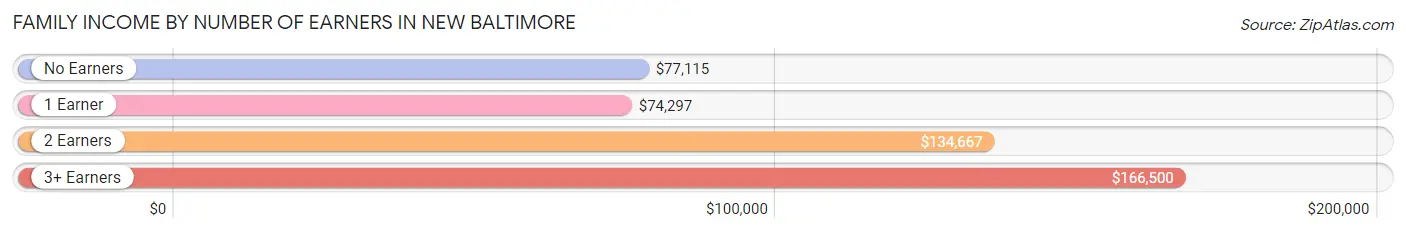
| Number of Earners | # Families | Median Income |
| No Earners | 418 (13.0%) | $77,115 |
| 1 Earner | 699 (21.8%) | $74,297 |
| 2 Earners | 1,560 (48.7%) | $134,667 |
| 3+ Earners | 528 (16.5%) | $166,500 |
| Total | 3,205 (100.0%) | $112,943 |
Household Income in New Baltimore
Household Income Brackets in New Baltimore
With 1,013 households falling in the category, the $100,000 to $149,999 income range is the most frequent in New Baltimore, accounting for 21.6% of all households. In contrast, only 99 households (2.1%) fall into the less than $10,000 income bracket, making it the least populous group.
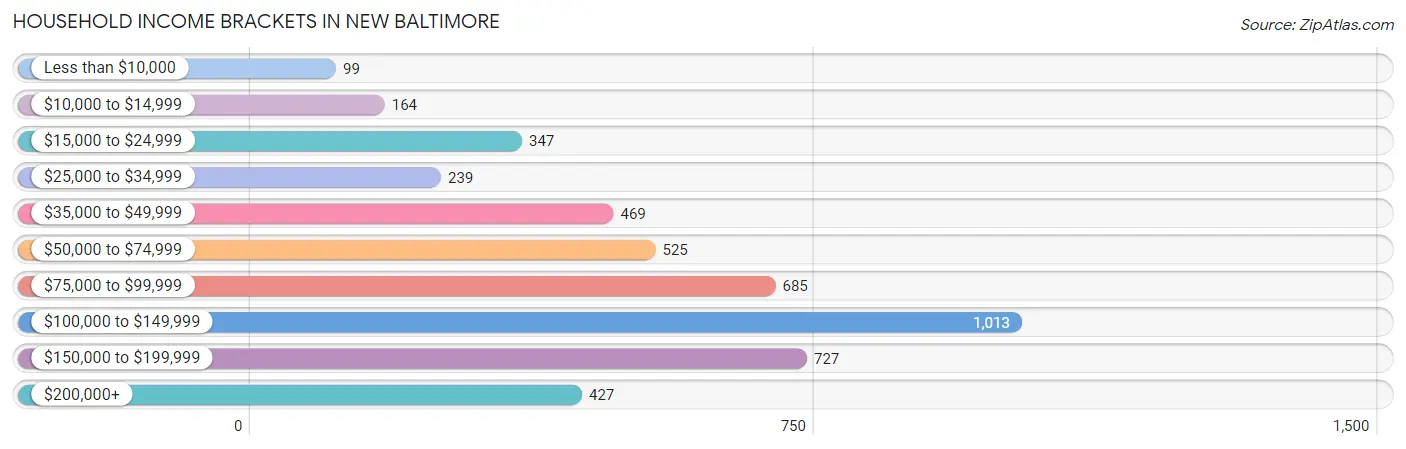
| Income Bracket | # Households | % Households |
| Less than $10,000 | 99 | 2.1% |
| $10,000 to $14,999 | 164 | 3.5% |
| $15,000 to $24,999 | 347 | 7.4% |
| $25,000 to $34,999 | 239 | 5.1% |
| $35,000 to $49,999 | 469 | 10.0% |
| $50,000 to $74,999 | 525 | 11.2% |
| $75,000 to $99,999 | 685 | 14.6% |
| $100,000 to $149,999 | 1,013 | 21.6% |
| $150,000 to $199,999 | 727 | 15.5% |
| $200,000+ | 427 | 9.1% |
Household Income by Householder Age in New Baltimore
The median household income in New Baltimore is $90,028, with the highest median household income of $111,712 found in the 45 to 64 years age bracket for the primary householder. A total of 1,995 households (42.5%) fall into this category. Meanwhile, the 65+ years age bracket for the primary householder has the lowest median household income of $42,500, with 1,292 households (27.5%) in this group.
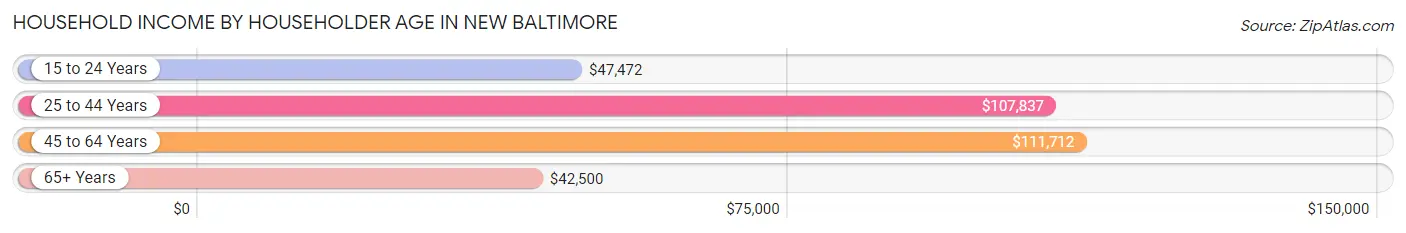
| Income Bracket | # Households | Median Income |
| 15 to 24 Years | 89 (1.9%) | $47,472 |
| 25 to 44 Years | 1,315 (28.0%) | $107,837 |
| 45 to 64 Years | 1,995 (42.5%) | $111,712 |
| 65+ Years | 1,292 (27.5%) | $42,500 |
| Total | 4,691 (100.0%) | $90,028 |
Poverty in New Baltimore
Income Below Poverty by Sex and Age in New Baltimore
With 4.4% poverty level for males and 4.2% for females among the residents of New Baltimore, 55 to 64 year old males and 6 to 11 year old females are the most vulnerable to poverty, with 77 males (10.5%) and 34 females (13.6%) in their respective age groups living below the poverty level.
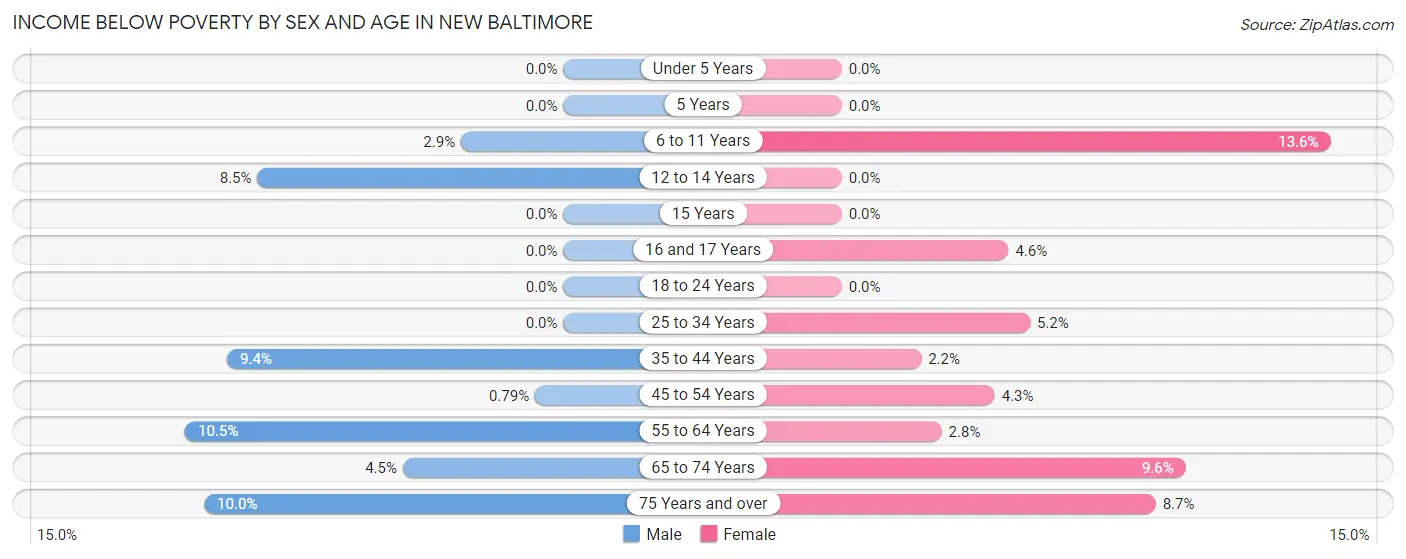
| Age Bracket | Male | Female |
| Under 5 Years | 0 (0.0%) | 0 (0.0%) |
| 5 Years | 0 (0.0%) | 0 (0.0%) |
| 6 to 11 Years | 15 (2.9%) | 34 (13.6%) |
| 12 to 14 Years | 23 (8.5%) | 0 (0.0%) |
| 15 Years | 0 (0.0%) | 0 (0.0%) |
| 16 and 17 Years | 0 (0.0%) | 7 (4.6%) |
| 18 to 24 Years | 0 (0.0%) | 0 (0.0%) |
| 25 to 34 Years | 0 (0.0%) | 34 (5.2%) |
| 35 to 44 Years | 86 (9.4%) | 18 (2.2%) |
| 45 to 54 Years | 8 (0.8%) | 35 (4.3%) |
| 55 to 64 Years | 77 (10.5%) | 29 (2.8%) |
| 65 to 74 Years | 20 (4.5%) | 67 (9.6%) |
| 75 Years and over | 27 (10.0%) | 41 (8.7%) |
| Total | 256 (4.4%) | 265 (4.2%) |
Income Above Poverty by Sex and Age in New Baltimore
According to the poverty statistics in New Baltimore, males aged under 5 years and females aged under 5 years are the age groups that are most secure financially, with 100.0% of males and 100.0% of females in these age groups living above the poverty line.
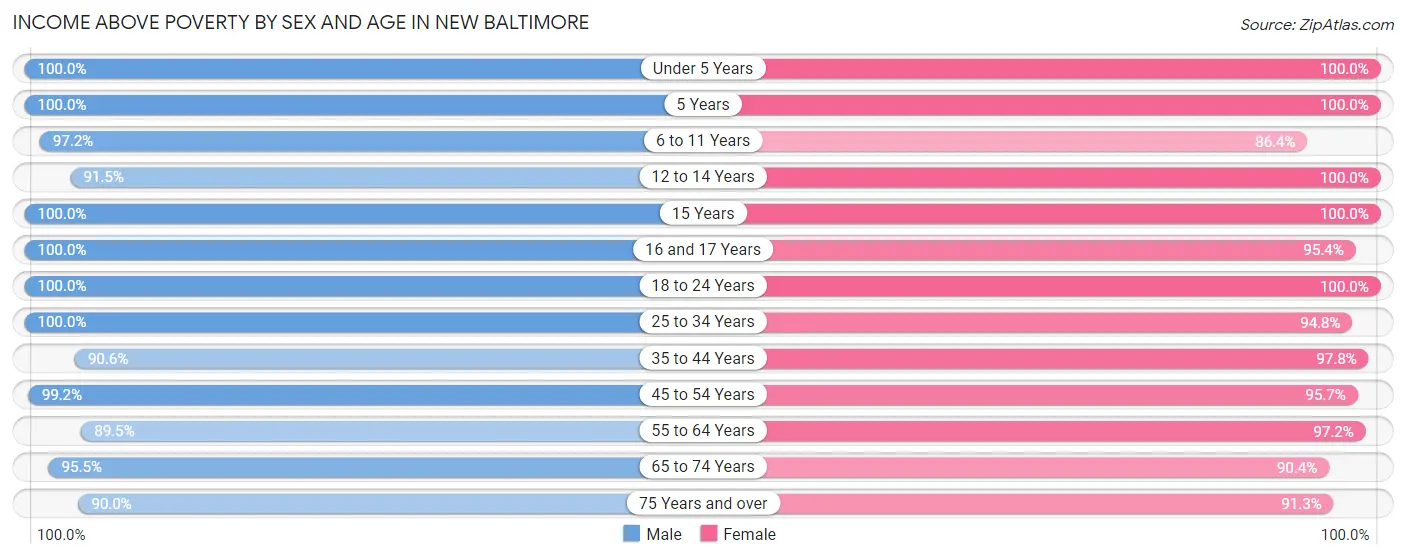
| Age Bracket | Male | Female |
| Under 5 Years | 249 (100.0%) | 362 (100.0%) |
| 5 Years | 126 (100.0%) | 20 (100.0%) |
| 6 to 11 Years | 511 (97.2%) | 216 (86.4%) |
| 12 to 14 Years | 247 (91.5%) | 321 (100.0%) |
| 15 Years | 96 (100.0%) | 79 (100.0%) |
| 16 and 17 Years | 199 (100.0%) | 144 (95.4%) |
| 18 to 24 Years | 433 (100.0%) | 567 (100.0%) |
| 25 to 34 Years | 570 (100.0%) | 615 (94.8%) |
| 35 to 44 Years | 833 (90.6%) | 797 (97.8%) |
| 45 to 54 Years | 999 (99.2%) | 787 (95.7%) |
| 55 to 64 Years | 654 (89.5%) | 1,013 (97.2%) |
| 65 to 74 Years | 427 (95.5%) | 633 (90.4%) |
| 75 Years and over | 243 (90.0%) | 428 (91.3%) |
| Total | 5,587 (95.6%) | 5,982 (95.8%) |
Income Below Poverty Among Married-Couple Families in New Baltimore
The poverty statistics for married-couple families in New Baltimore show that 1.6% or 44 of the total 2,687 families live below the poverty line. Families with 3 or 4 children have the highest poverty rate of 4.6%, comprising of 12 families. On the other hand, families with 1 or 2 children have the lowest poverty rate of 0.0%, which includes 0 families.
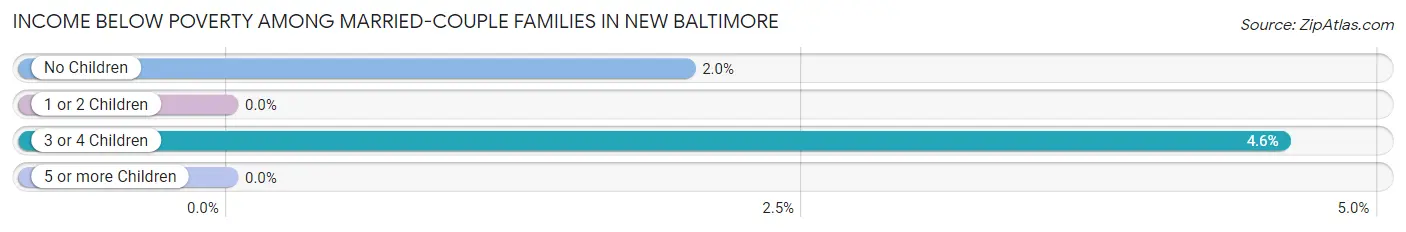
| Children | Above Poverty | Below Poverty |
| No Children | 1,578 (98.0%) | 32 (2.0%) |
| 1 or 2 Children | 815 (100.0%) | 0 (0.0%) |
| 3 or 4 Children | 250 (95.4%) | 12 (4.6%) |
| 5 or more Children | 0 (0.0%) | 0 (0.0%) |
| Total | 2,643 (98.4%) | 44 (1.6%) |
Income Below Poverty Among Single-Parent Households in New Baltimore
According to the poverty data in New Baltimore, 19.6% or 21 single-father households and 2.2% or 9 single-mother households are living below the poverty line. Among single-father households, those with 1 or 2 children have the highest poverty rate, with 21 households (44.7%) experiencing poverty. Likewise, among single-mother households, those with 1 or 2 children have the highest poverty rate, with 9 households (3.7%) falling below the poverty line.
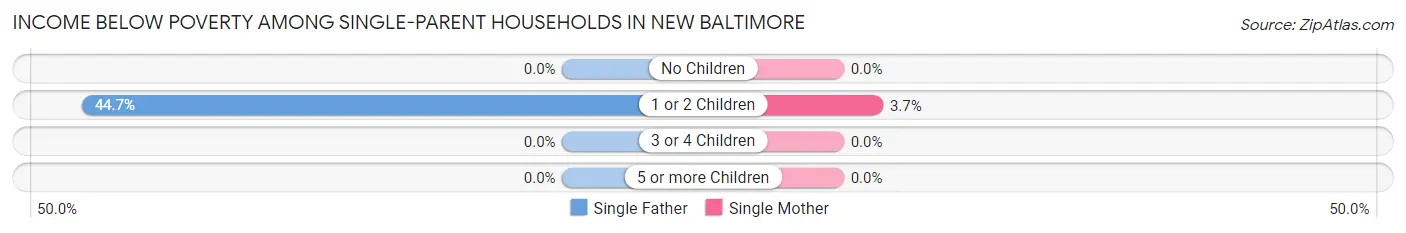
| Children | Single Father | Single Mother |
| No Children | 0 (0.0%) | 0 (0.0%) |
| 1 or 2 Children | 21 (44.7%) | 9 (3.7%) |
| 3 or 4 Children | 0 (0.0%) | 0 (0.0%) |
| 5 or more Children | 0 (0.0%) | 0 (0.0%) |
| Total | 21 (19.6%) | 9 (2.2%) |
Income Below Poverty Among Married-Couple vs Single-Parent Households in New Baltimore
The poverty data for New Baltimore shows that 44 of the married-couple family households (1.6%) and 30 of the single-parent households (5.8%) are living below the poverty level. Within the married-couple family households, those with 3 or 4 children have the highest poverty rate, with 12 households (4.6%) falling below the poverty line. Among the single-parent households, those with 1 or 2 children have the highest poverty rate, with 30 household (10.2%) living below poverty.
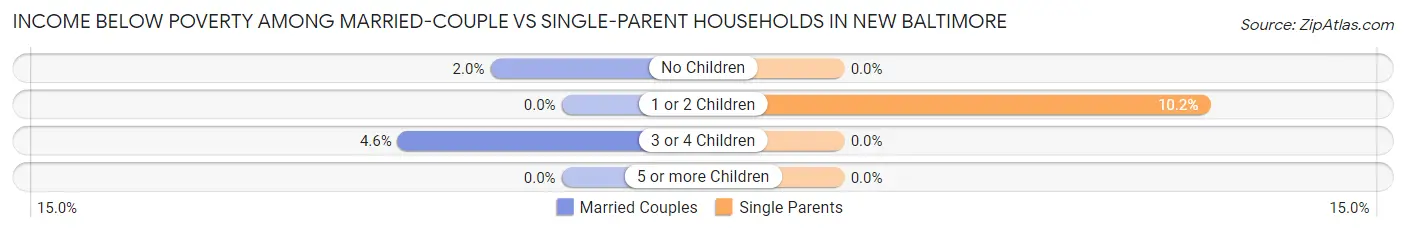
| Children | Married-Couple Families | Single-Parent Households |
| No Children | 32 (2.0%) | 0 (0.0%) |
| 1 or 2 Children | 0 (0.0%) | 30 (10.2%) |
| 3 or 4 Children | 12 (4.6%) | 0 (0.0%) |
| 5 or more Children | 0 (0.0%) | 0 (0.0%) |
| Total | 44 (1.6%) | 30 (5.8%) |
Race in New Baltimore
The most populous races in New Baltimore are White / Caucasian (11,045 | 91.2%), Two or more Races (707 | 5.8%), and Hispanic or Latino (486 | 4.0%).
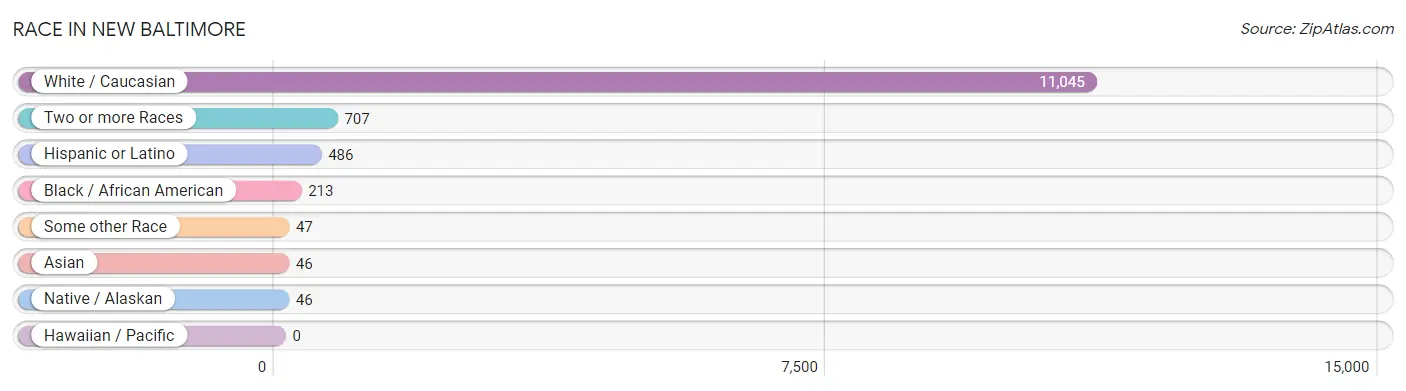
| Race | # Population | % Population |
| Asian | 46 | 0.4% |
| Black / African American | 213 | 1.8% |
| Hawaiian / Pacific | 0 | 0.0% |
| Hispanic or Latino | 486 | 4.0% |
| Native / Alaskan | 46 | 0.4% |
| White / Caucasian | 11,045 | 91.2% |
| Two or more Races | 707 | 5.8% |
| Some other Race | 47 | 0.4% |
| Total | 12,104 | 100.0% |
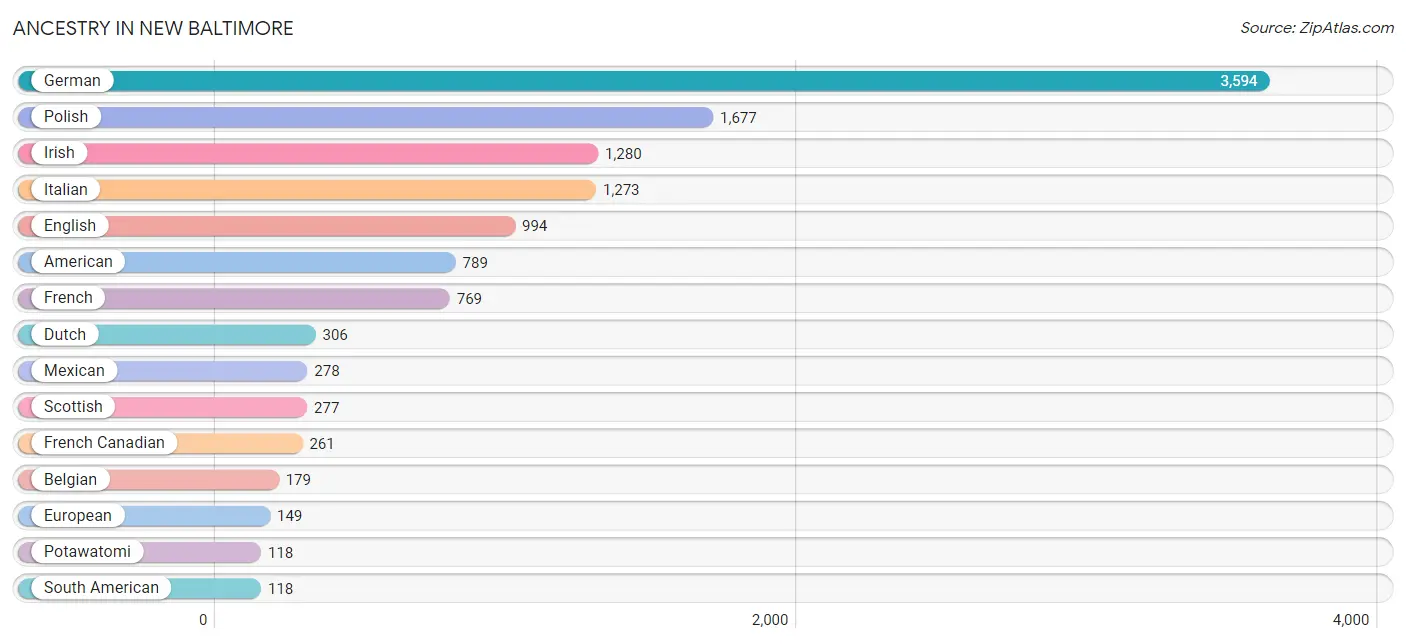
Ancestry in New Baltimore
The most populous ancestries reported in New Baltimore are German (3,594 | 29.7%), Polish (1,677 | 13.9%), Irish (1,280 | 10.6%), Italian (1,273 | 10.5%), and English (994 | 8.2%), together accounting for 72.8% of all New Baltimore residents.
| Ancestry | # Population | % Population |
| African | 30 | 0.3% |
| Albanian | 79 | 0.6% |
| American | 789 | 6.5% |
| Arab | 65 | 0.5% |
| Armenian | 7 | 0.1% |
| Australian | 17 | 0.1% |
| Belgian | 179 | 1.5% |
| Bhutanese | 43 | 0.4% |
| Bolivian | 30 | 0.3% |
| Brazilian | 48 | 0.4% |
| British | 36 | 0.3% |
| Burmese | 38 | 0.3% |
| Canadian | 78 | 0.6% |
| Celtic | 8 | 0.1% |
| Chippewa | 17 | 0.1% |
| Colombian | 71 | 0.6% |
| Croatian | 36 | 0.3% |
| Czech | 16 | 0.1% |
| Danish | 9 | 0.1% |
| Dutch | 306 | 2.5% |
| Eastern European | 101 | 0.8% |
| English | 994 | 8.2% |
| European | 149 | 1.2% |
| Finnish | 40 | 0.3% |
| French | 769 | 6.4% |
| French American Indian | 7 | 0.1% |
| French Canadian | 261 | 2.2% |
| German | 3,594 | 29.7% |
| Greek | 100 | 0.8% |
| Haitian | 8 | 0.1% |
| Hungarian | 85 | 0.7% |
| Iranian | 9 | 0.1% |
| Iraqi | 19 | 0.2% |
| Irish | 1,280 | 10.6% |
| Italian | 1,273 | 10.5% |
| Korean | 24 | 0.2% |
| Lebanese | 46 | 0.4% |
| Lithuanian | 9 | 0.1% |
| Macedonian | 100 | 0.8% |
| Maltese | 28 | 0.2% |
| Mexican | 278 | 2.3% |
| Northern European | 18 | 0.2% |
| Norwegian | 31 | 0.3% |
| Pakistani | 67 | 0.5% |
| Polish | 1,677 | 13.9% |
| Potawatomi | 118 | 1.0% |
| Puerto Rican | 58 | 0.5% |
| Romanian | 63 | 0.5% |
| Russian | 58 | 0.5% |
| Scotch-Irish | 46 | 0.4% |
| Scottish | 277 | 2.3% |
| Slavic | 21 | 0.2% |
| Slovak | 36 | 0.3% |
| South American | 118 | 1.0% |
| Spanish | 32 | 0.3% |
| Sri Lankan | 36 | 0.3% |
| Subsaharan African | 30 | 0.3% |
| Swedish | 71 | 0.6% |
| Turkish | 15 | 0.1% |
| Ukrainian | 14 | 0.1% |
| Venezuelan | 17 | 0.1% |
| Welsh | 58 | 0.5% | View All 62 Rows |
Immigrants in New Baltimore
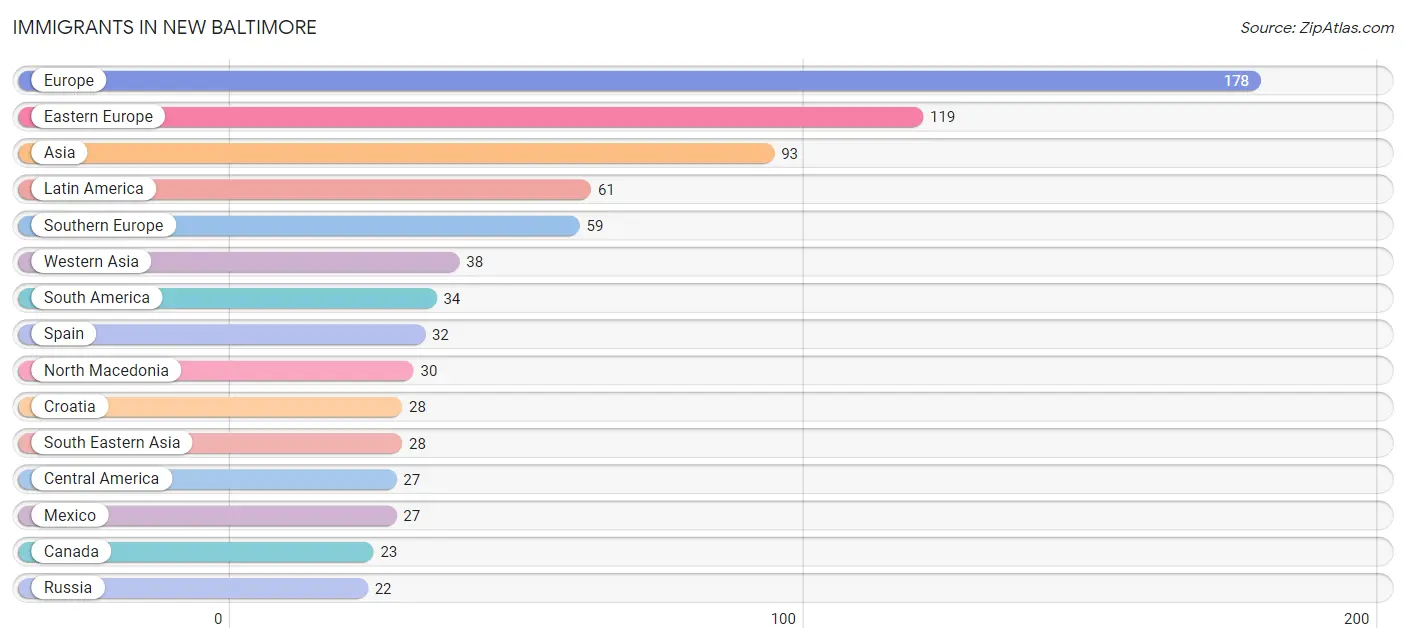
The most numerous immigrant groups reported in New Baltimore came from Europe (178 | 1.5%), Eastern Europe (119 | 1.0%), Asia (93 | 0.8%), Latin America (61 | 0.5%), and Southern Europe (59 | 0.5%), together accounting for 4.2% of all New Baltimore residents.
| Immigration Origin | # Population | % Population |
| Asia | 93 | 0.8% |
| Canada | 23 | 0.2% |
| Central America | 27 | 0.2% |
| Colombia | 1 | 0.0% |
| Croatia | 28 | 0.2% |
| Eastern Asia | 18 | 0.2% |
| Eastern Europe | 119 | 1.0% |
| Europe | 178 | 1.5% |
| Greece | 16 | 0.1% |
| Iran | 9 | 0.1% |
| Iraq | 19 | 0.2% |
| Italy | 11 | 0.1% |
| Korea | 18 | 0.2% |
| Latin America | 61 | 0.5% |
| Lebanon | 11 | 0.1% |
| Lithuania | 9 | 0.1% |
| Mexico | 27 | 0.2% |
| North Macedonia | 30 | 0.3% |
| Romania | 11 | 0.1% |
| Russia | 22 | 0.2% |
| South America | 34 | 0.3% |
| South Central Asia | 9 | 0.1% |
| South Eastern Asia | 28 | 0.2% |
| Southern Europe | 59 | 0.5% |
| Spain | 32 | 0.3% |
| Thailand | 13 | 0.1% |
| Turkey | 8 | 0.1% |
| Uruguay | 16 | 0.1% |
| Venezuela | 17 | 0.1% |
| Vietnam | 15 | 0.1% |
| Western Asia | 38 | 0.3% | View All 31 Rows |
Sex and Age in New Baltimore
Sex and Age in New Baltimore
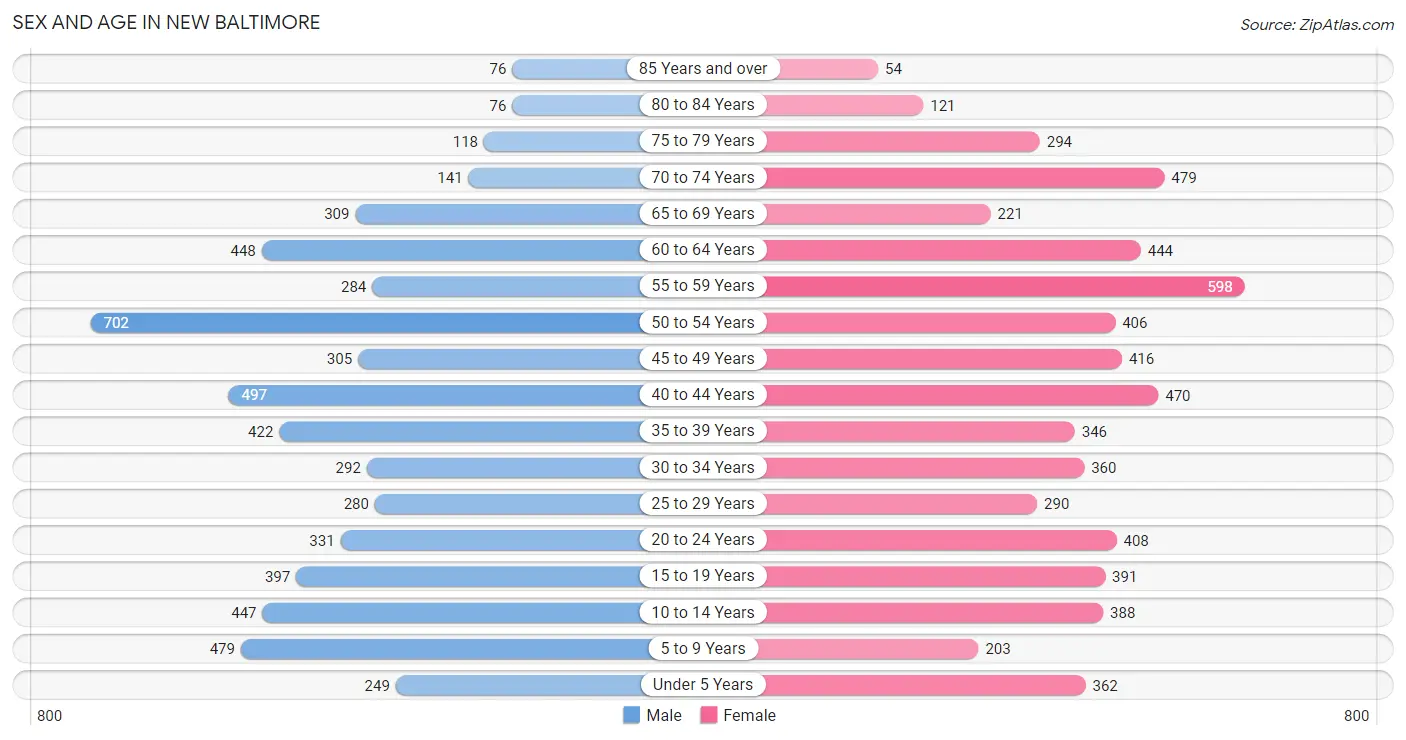
The most populous age groups in New Baltimore are 50 to 54 Years (702 | 12.0%) for men and 55 to 59 Years (598 | 9.6%) for women.
| Age Bracket | Male | Female |
| Under 5 Years | 249 (4.3%) | 362 (5.8%) |
| 5 to 9 Years | 479 (8.2%) | 203 (3.3%) |
| 10 to 14 Years | 447 (7.6%) | 388 (6.2%) |
| 15 to 19 Years | 397 (6.8%) | 391 (6.2%) |
| 20 to 24 Years | 331 (5.7%) | 408 (6.5%) |
| 25 to 29 Years | 280 (4.8%) | 290 (4.6%) |
| 30 to 34 Years | 292 (5.0%) | 360 (5.8%) |
| 35 to 39 Years | 422 (7.2%) | 346 (5.5%) |
| 40 to 44 Years | 497 (8.5%) | 470 (7.5%) |
| 45 to 49 Years | 305 (5.2%) | 416 (6.7%) |
| 50 to 54 Years | 702 (12.0%) | 406 (6.5%) |
| 55 to 59 Years | 284 (4.9%) | 598 (9.6%) |
| 60 to 64 Years | 448 (7.6%) | 444 (7.1%) |
| 65 to 69 Years | 309 (5.3%) | 221 (3.5%) |
| 70 to 74 Years | 141 (2.4%) | 479 (7.7%) |
| 75 to 79 Years | 118 (2.0%) | 294 (4.7%) |
| 80 to 84 Years | 76 (1.3%) | 121 (1.9%) |
| 85 Years and over | 76 (1.3%) | 54 (0.9%) |
| Total | 5,853 (100.0%) | 6,251 (100.0%) |
Families and Households in New Baltimore
Median Family Size in New Baltimore
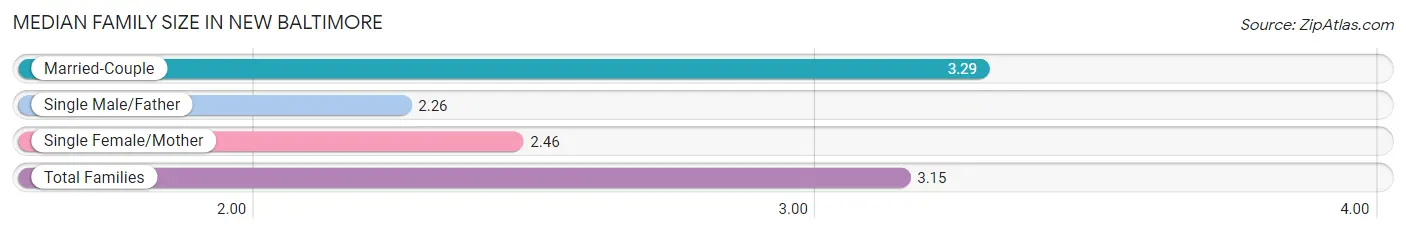
The median family size in New Baltimore is 3.15 persons per family, with married-couple families (2,687 | 83.8%) accounting for the largest median family size of 3.29 persons per family. On the other hand, single male/father families (107 | 3.3%) represent the smallest median family size with 2.26 persons per family.
| Family Type | # Families | Family Size |
| Married-Couple | 2,687 (83.8%) | 3.29 |
| Single Male/Father | 107 (3.3%) | 2.26 |
| Single Female/Mother | 411 (12.8%) | 2.46 |
| Total Families | 3,205 (100.0%) | 3.15 |
Median Household Size in New Baltimore
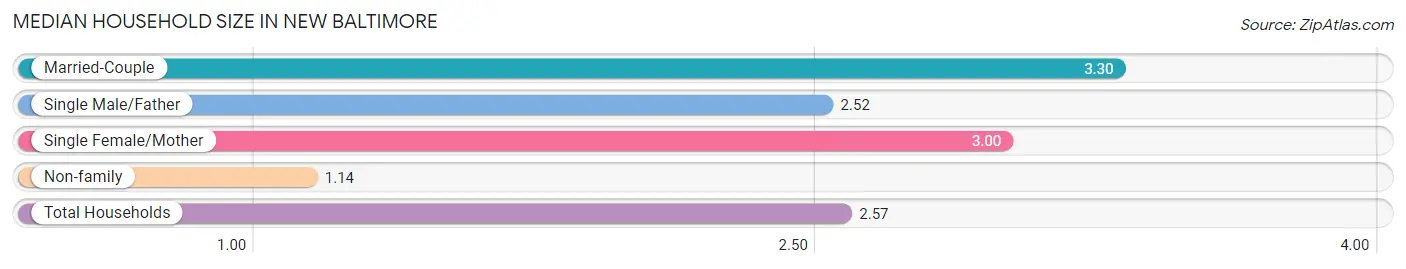
The median household size in New Baltimore is 2.57 persons per household, with married-couple households (2,687 | 57.3%) accounting for the largest median household size of 3.3 persons per household. non-family households (1,486 | 31.7%) represent the smallest median household size with 1.14 persons per household.
| Household Type | # Households | Household Size |
| Married-Couple | 2,687 (57.3%) | 3.30 |
| Single Male/Father | 107 (2.3%) | 2.52 |
| Single Female/Mother | 411 (8.8%) | 3.00 |
| Non-family | 1,486 (31.7%) | 1.14 |
| Total Households | 4,691 (100.0%) | 2.57 |
Household Size by Marriage Status in New Baltimore
Out of a total of 4,691 households in New Baltimore, 3,205 (68.3%) are family households, while 1,486 (31.7%) are nonfamily households. The most numerous type of family households are 2-person households, comprising 1,269, and the most common type of nonfamily households are 1-person households, comprising 1,313.
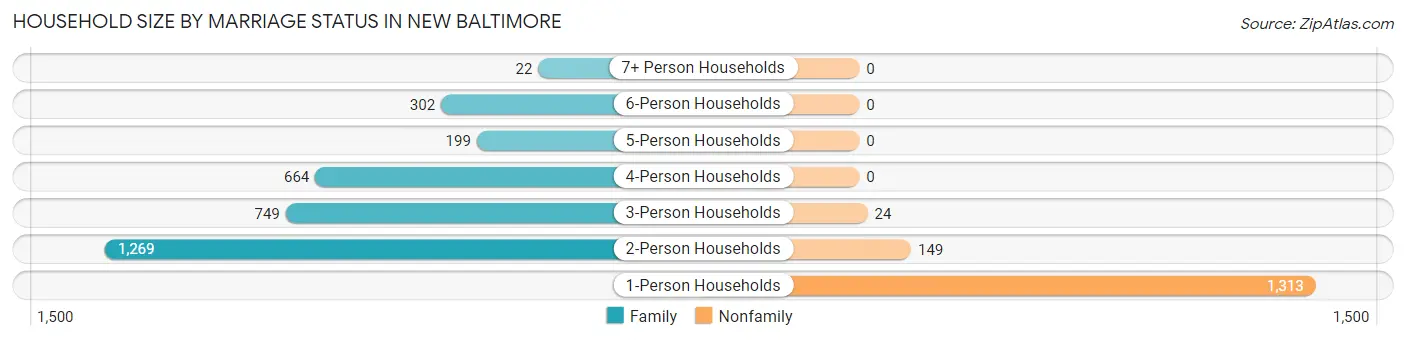
| Household Size | Family Households | Nonfamily Households |
| 1-Person Households | - | 1,313 (28.0%) |
| 2-Person Households | 1,269 (27.1%) | 149 (3.2%) |
| 3-Person Households | 749 (16.0%) | 24 (0.5%) |
| 4-Person Households | 664 (14.1%) | 0 (0.0%) |
| 5-Person Households | 199 (4.2%) | 0 (0.0%) |
| 6-Person Households | 302 (6.4%) | 0 (0.0%) |
| 7+ Person Households | 22 (0.5%) | 0 (0.0%) |
| Total | 3,205 (68.3%) | 1,486 (31.7%) |
Female Fertility in New Baltimore
Fertility by Age in New Baltimore
Average fertility rate in New Baltimore is 52.0 births per 1,000 women. Women in the age bracket of 20 to 34 years have the highest fertility rate with 131.0 births per 1,000 women. Women in the age bracket of 20 to 34 years acount for 96.5% of all women with births.
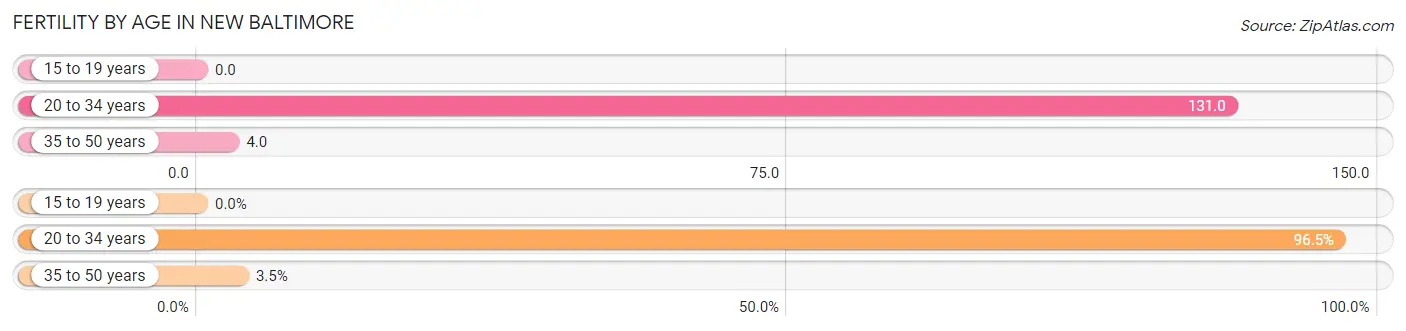
| Age Bracket | Women with Births | Births / 1,000 Women |
| 15 to 19 years | 0 (0.0%) | 0.0 |
| 20 to 34 years | 139 (96.5%) | 131.0 |
| 35 to 50 years | 5 (3.5%) | 4.0 |
| Total | 144 (100.0%) | 52.0 |
Fertility by Age by Marriage Status in New Baltimore
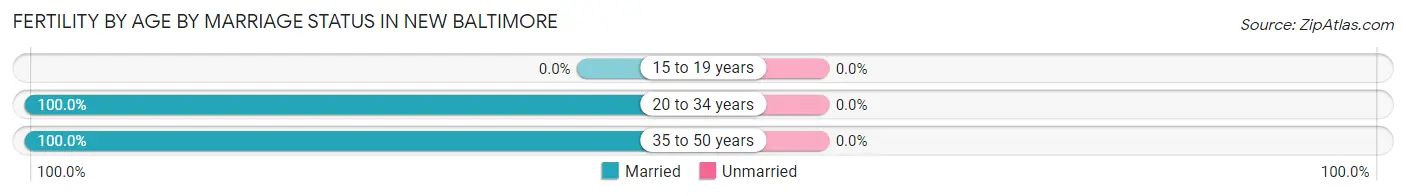
| Age Bracket | Married | Unmarried |
| 15 to 19 years | 0 (0.0%) | 0 (0.0%) |
| 20 to 34 years | 139 (100.0%) | 0 (0.0%) |
| 35 to 50 years | 5 (100.0%) | 0 (0.0%) |
| Total | 144 (100.0%) | 0 (0.0%) |
Fertility by Education in New Baltimore
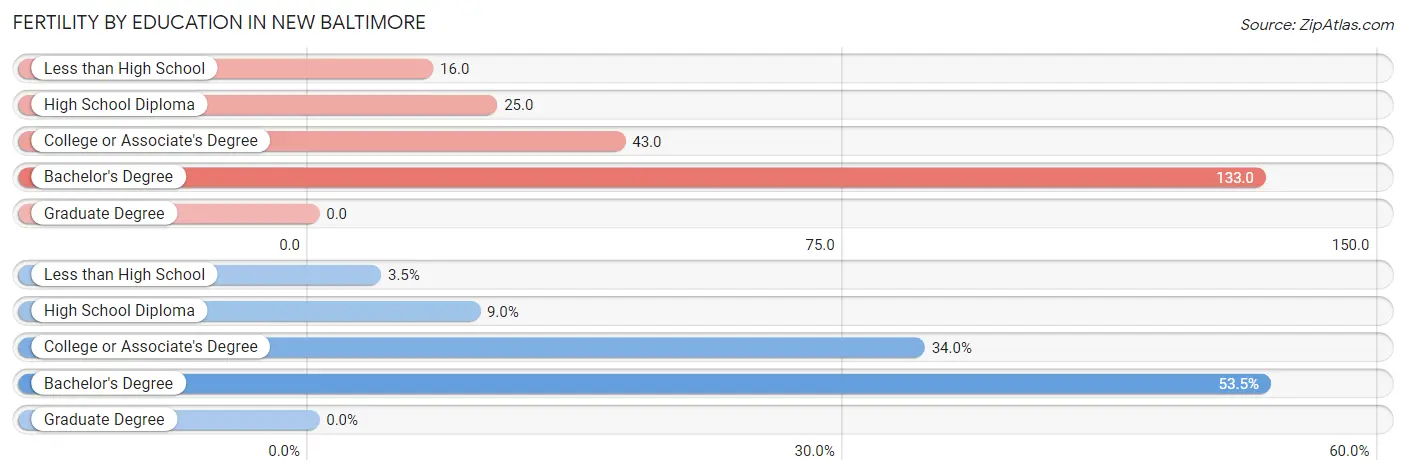
| Educational Attainment | Women with Births | Births / 1,000 Women |
| Less than High School | 5 (3.5%) | 16.0 |
| High School Diploma | 13 (9.0%) | 25.0 |
| College or Associate's Degree | 49 (34.0%) | 43.0 |
| Bachelor's Degree | 77 (53.5%) | 133.0 |
| Graduate Degree | 0 (0.0%) | 0.0 |
| Total | 144 (100.0%) | 52.0 |
Fertility by Education by Marriage Status in New Baltimore
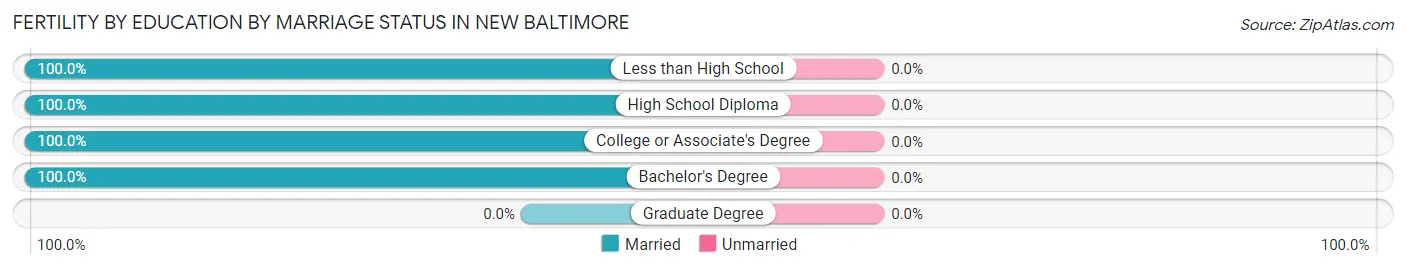
| Educational Attainment | Married | Unmarried |
| Less than High School | 5 (100.0%) | 0 (0.0%) |
| High School Diploma | 13 (100.0%) | 0 (0.0%) |
| College or Associate's Degree | 49 (100.0%) | 0 (0.0%) |
| Bachelor's Degree | 77 (100.0%) | 0 (0.0%) |
| Graduate Degree | 0 (0.0%) | 0 (0.0%) |
| Total | 144 (100.0%) | 0 (0.0%) |
Employment Characteristics in New Baltimore
Employment by Class of Employer in New Baltimore
Among the 5,916 employed individuals in New Baltimore, private company employees (4,291 | 72.5%), local government employees (556 | 9.4%), and not-for-profit organizations (315 | 5.3%) make up the most common classes of employment.
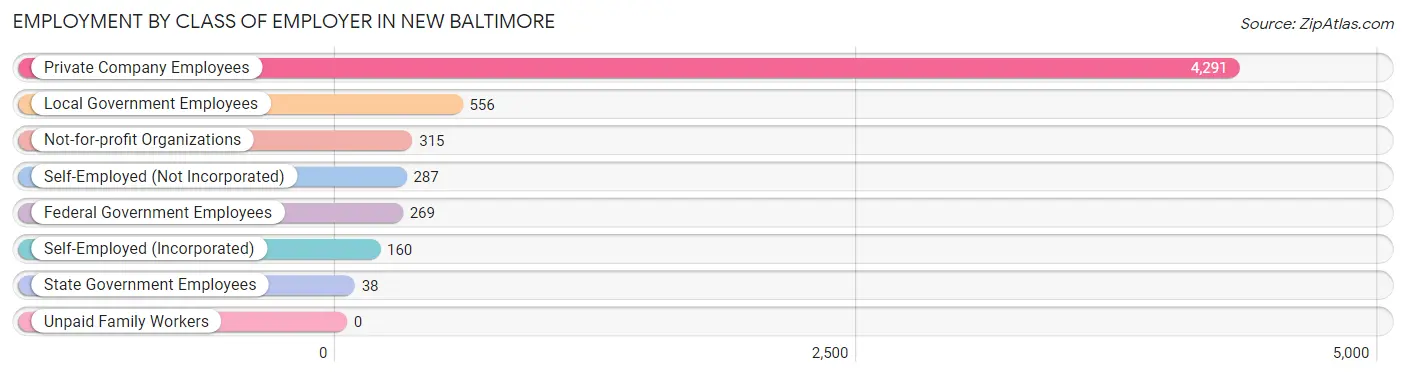
| Employer Class | # Employees | % Employees |
| Private Company Employees | 4,291 | 72.5% |
| Self-Employed (Incorporated) | 160 | 2.7% |
| Self-Employed (Not Incorporated) | 287 | 4.9% |
| Not-for-profit Organizations | 315 | 5.3% |
| Local Government Employees | 556 | 9.4% |
| State Government Employees | 38 | 0.6% |
| Federal Government Employees | 269 | 4.5% |
| Unpaid Family Workers | 0 | 0.0% |
| Total | 5,916 | 100.0% |
Employment Status by Age in New Baltimore
According to the labor force statistics for New Baltimore, out of the total population over 16 years of age (9,801), 65.2% or 6,390 individuals are in the labor force, with 4.3% or 275 of them unemployed. The age group with the highest labor force participation rate is 35 to 44 years, with 93.7% or 1,626 individuals in the labor force. Within the labor force, the 16 to 19 years age range has the highest percentage of unemployed individuals, with 17.4% or 45 of them being unemployed.
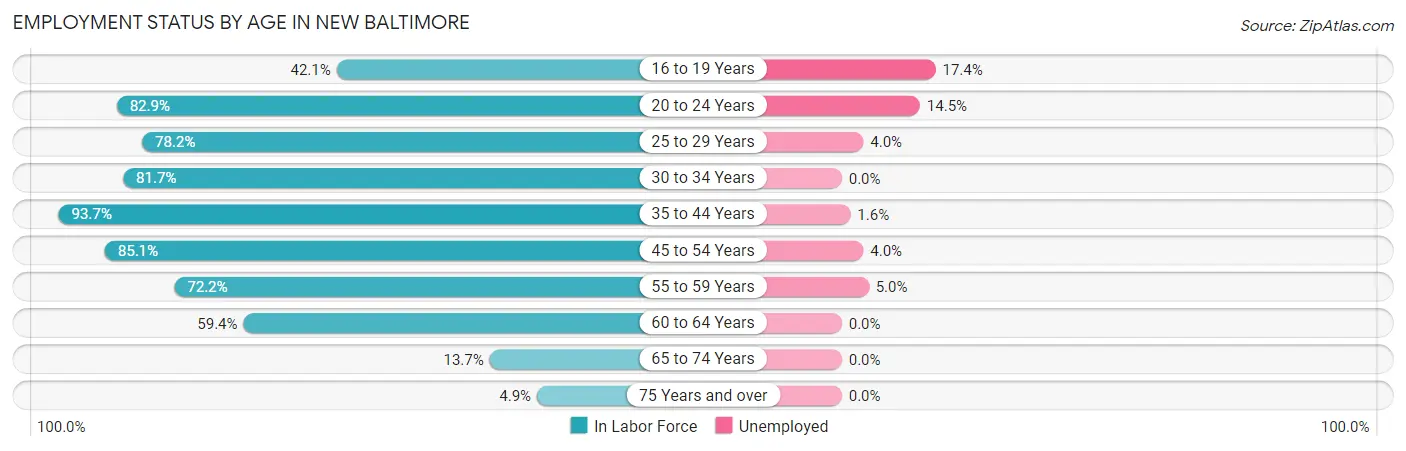
| Age Bracket | In Labor Force | Unemployed |
| 16 to 19 Years | 258 (42.1%) | 45 (17.4%) |
| 20 to 24 Years | 613 (82.9%) | 89 (14.5%) |
| 25 to 29 Years | 446 (78.2%) | 18 (4.0%) |
| 30 to 34 Years | 533 (81.7%) | 0 (0.0%) |
| 35 to 44 Years | 1,626 (93.7%) | 26 (1.6%) |
| 45 to 54 Years | 1,556 (85.1%) | 62 (4.0%) |
| 55 to 59 Years | 637 (72.2%) | 32 (5.0%) |
| 60 to 64 Years | 530 (59.4%) | 0 (0.0%) |
| 65 to 74 Years | 158 (13.7%) | 0 (0.0%) |
| 75 Years and over | 36 (4.9%) | 0 (0.0%) |
| Total | 6,390 (65.2%) | 275 (4.3%) |
Employment Status by Educational Attainment in New Baltimore
According to labor force statistics for New Baltimore, 81.2% of individuals (5,327) out of the total population between 25 and 64 years of age (6,560) are in the labor force, with 2.6% or 139 of them being unemployed. The group with the highest labor force participation rate are those with the educational attainment of bachelor's degree or higher, with 93.4% or 1,775 individuals in the labor force. Within the labor force, individuals with bachelor's degree or higher education have the highest percentage of unemployment, with 4.8% or 85 of them being unemployed.
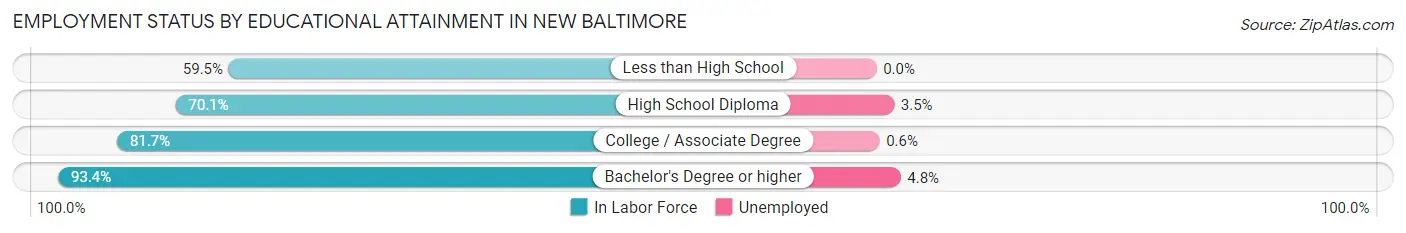
| Educational Attainment | In Labor Force | Unemployed |
| Less than High School | 231 (59.5%) | 0 (0.0%) |
| High School Diploma | 1,005 (70.1%) | 50 (3.5%) |
| College / Associate Degree | 2,319 (81.7%) | 17 (0.6%) |
| Bachelor's Degree or higher | 1,775 (93.4%) | 91 (4.8%) |
| Total | 5,327 (81.2%) | 171 (2.6%) |
Employment Occupations by Sex in New Baltimore
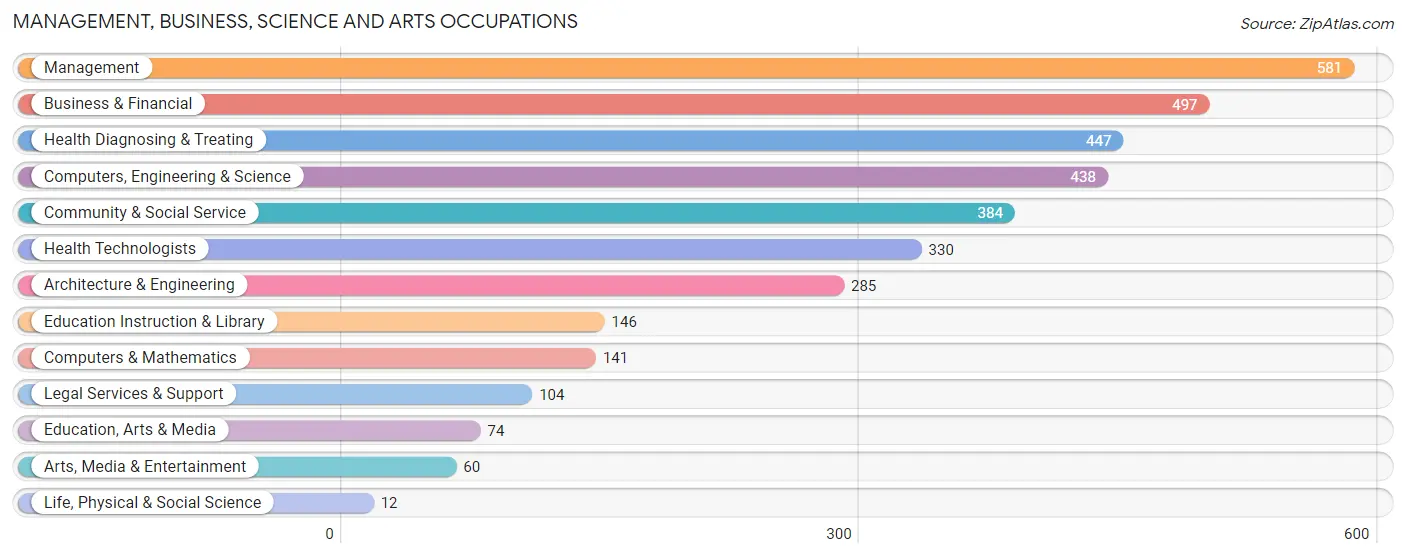
Management, Business, Science and Arts Occupations
The most common Management, Business, Science and Arts occupations in New Baltimore are Management (581 | 9.6%), Business & Financial (497 | 8.2%), Health Diagnosing & Treating (447 | 7.4%), Computers, Engineering & Science (438 | 7.3%), and Community & Social Service (384 | 6.4%).
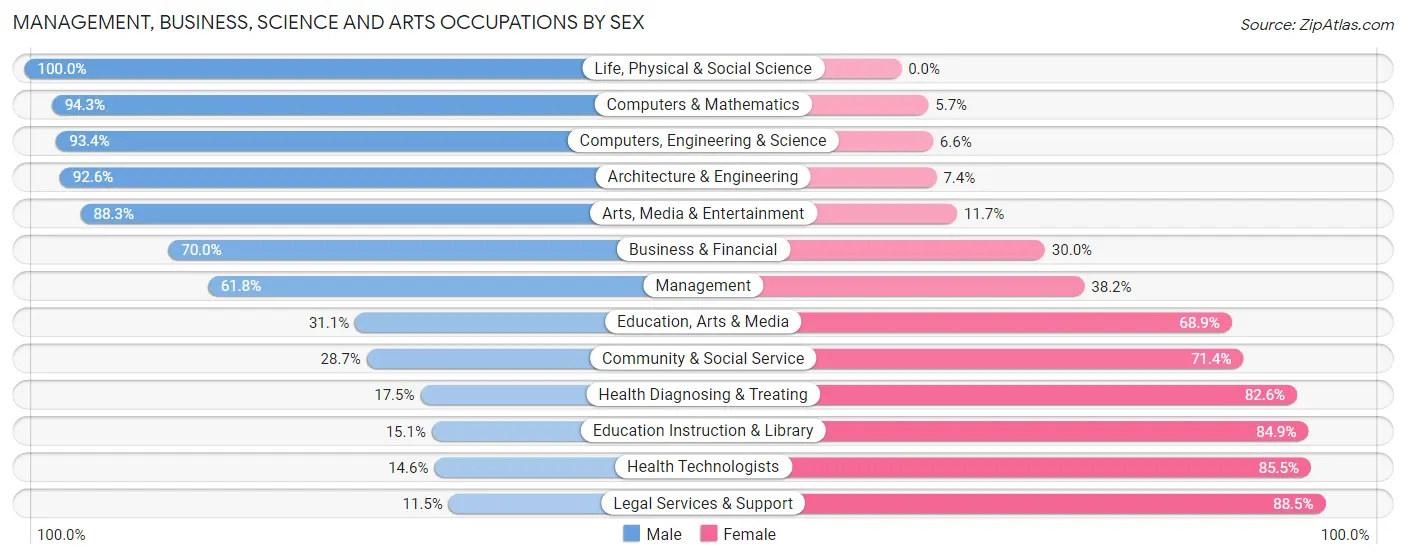
Management, Business, Science and Arts Occupations by Sex
Within the Management, Business, Science and Arts occupations in New Baltimore, the most male-oriented occupations are Life, Physical & Social Science (100.0%), Computers & Mathematics (94.3%), and Computers, Engineering & Science (93.4%), while the most female-oriented occupations are Legal Services & Support (88.5%), Health Technologists (85.5%), and Education Instruction & Library (84.9%).
| Occupation | Male | Female |
| Management | 359 (61.8%) | 222 (38.2%) |
| Business & Financial | 348 (70.0%) | 149 (30.0%) |
| Computers, Engineering & Science | 409 (93.4%) | 29 (6.6%) |
| Computers & Mathematics | 133 (94.3%) | 8 (5.7%) |
| Architecture & Engineering | 264 (92.6%) | 21 (7.4%) |
| Life, Physical & Social Science | 12 (100.0%) | 0 (0.0%) |
| Community & Social Service | 110 (28.6%) | 274 (71.4%) |
| Education, Arts & Media | 23 (31.1%) | 51 (68.9%) |
| Legal Services & Support | 12 (11.5%) | 92 (88.5%) |
| Education Instruction & Library | 22 (15.1%) | 124 (84.9%) |
| Arts, Media & Entertainment | 53 (88.3%) | 7 (11.7%) |
| Health Diagnosing & Treating | 78 (17.4%) | 369 (82.6%) |
| Health Technologists | 48 (14.5%) | 282 (85.5%) |
| Total (Category) | 1,304 (55.6%) | 1,043 (44.4%) |
| Total (Overall) | 3,068 (50.8%) | 2,967 (49.2%) |
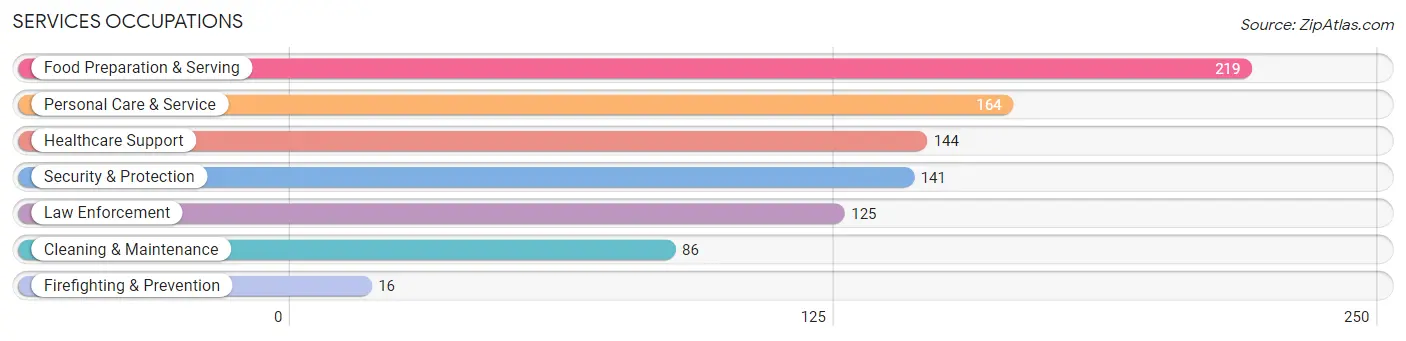
Services Occupations
The most common Services occupations in New Baltimore are Food Preparation & Serving (219 | 3.6%), Personal Care & Service (164 | 2.7%), Healthcare Support (144 | 2.4%), Security & Protection (141 | 2.3%), and Law Enforcement (125 | 2.1%).
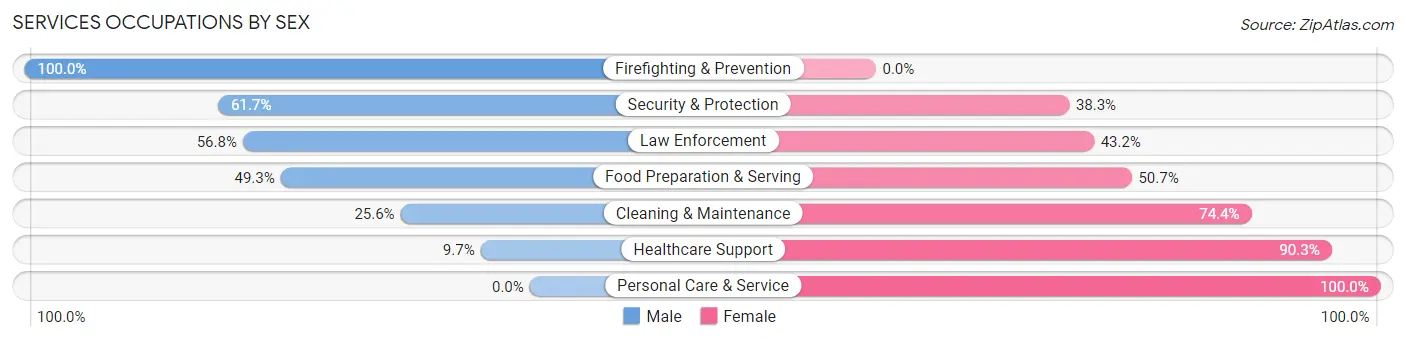
Services Occupations by Sex
Within the Services occupations in New Baltimore, the most male-oriented occupations are Firefighting & Prevention (100.0%), Security & Protection (61.7%), and Law Enforcement (56.8%), while the most female-oriented occupations are Personal Care & Service (100.0%), Healthcare Support (90.3%), and Cleaning & Maintenance (74.4%).
| Occupation | Male | Female |
| Healthcare Support | 14 (9.7%) | 130 (90.3%) |
| Security & Protection | 87 (61.7%) | 54 (38.3%) |
| Firefighting & Prevention | 16 (100.0%) | 0 (0.0%) |
| Law Enforcement | 71 (56.8%) | 54 (43.2%) |
| Food Preparation & Serving | 108 (49.3%) | 111 (50.7%) |
| Cleaning & Maintenance | 22 (25.6%) | 64 (74.4%) |
| Personal Care & Service | 0 (0.0%) | 164 (100.0%) |
| Total (Category) | 231 (30.6%) | 523 (69.4%) |
| Total (Overall) | 3,068 (50.8%) | 2,967 (49.2%) |
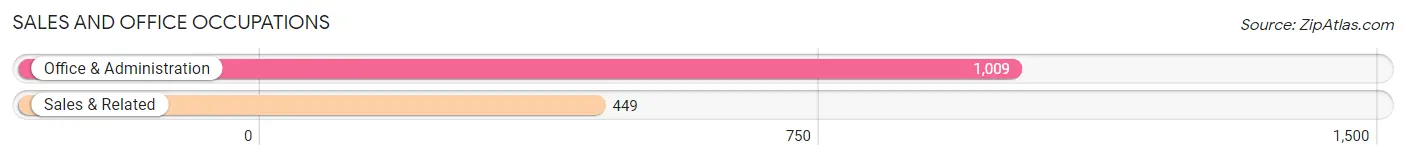
Sales and Office Occupations
The most common Sales and Office occupations in New Baltimore are Office & Administration (1,009 | 16.7%), and Sales & Related (449 | 7.4%).
Sales and Office Occupations by Sex
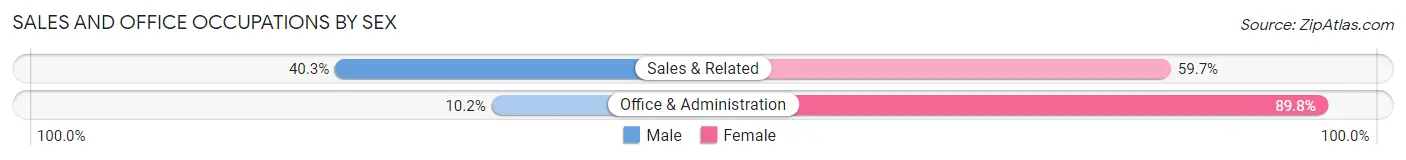
| Occupation | Male | Female |
| Sales & Related | 181 (40.3%) | 268 (59.7%) |
| Office & Administration | 103 (10.2%) | 906 (89.8%) |
| Total (Category) | 284 (19.5%) | 1,174 (80.5%) |
| Total (Overall) | 3,068 (50.8%) | 2,967 (49.2%) |
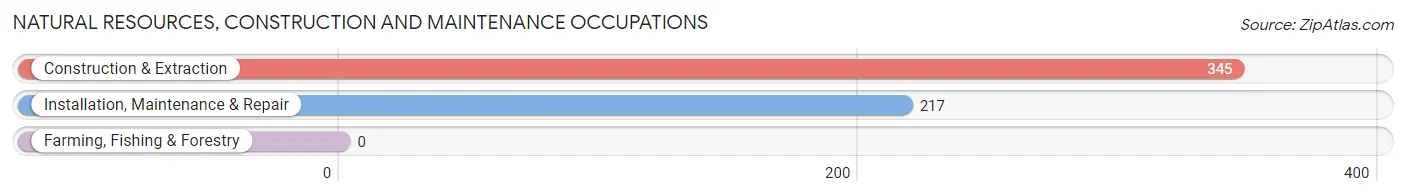
Natural Resources, Construction and Maintenance Occupations
The most common Natural Resources, Construction and Maintenance occupations in New Baltimore are Construction & Extraction (345 | 5.7%), and Installation, Maintenance & Repair (217 | 3.6%).
Natural Resources, Construction and Maintenance Occupations by Sex
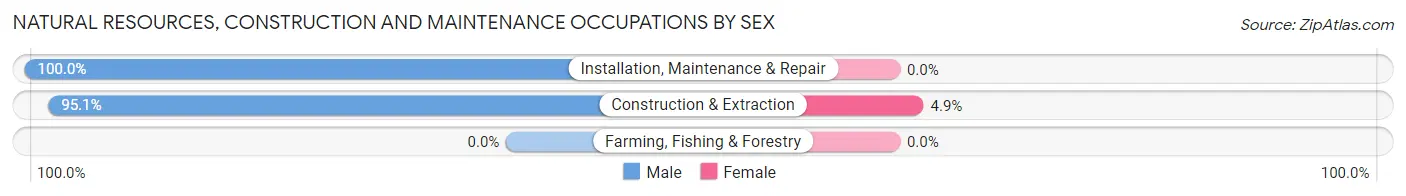
| Occupation | Male | Female |
| Farming, Fishing & Forestry | 0 (0.0%) | 0 (0.0%) |
| Construction & Extraction | 328 (95.1%) | 17 (4.9%) |
| Installation, Maintenance & Repair | 217 (100.0%) | 0 (0.0%) |
| Total (Category) | 545 (97.0%) | 17 (3.0%) |
| Total (Overall) | 3,068 (50.8%) | 2,967 (49.2%) |
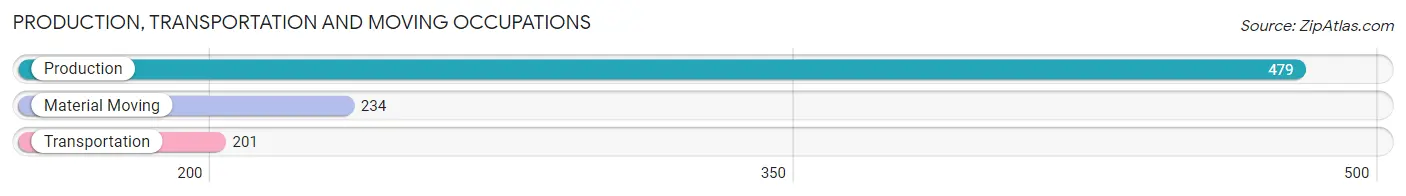
Production, Transportation and Moving Occupations
The most common Production, Transportation and Moving occupations in New Baltimore are Production (479 | 7.9%), Material Moving (234 | 3.9%), and Transportation (201 | 3.3%).
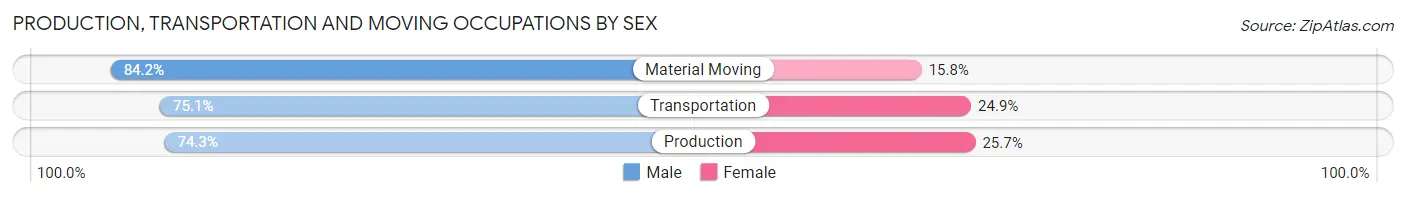
Production, Transportation and Moving Occupations by Sex
| Occupation | Male | Female |
| Production | 356 (74.3%) | 123 (25.7%) |
| Transportation | 151 (75.1%) | 50 (24.9%) |
| Material Moving | 197 (84.2%) | 37 (15.8%) |
| Total (Category) | 704 (77.0%) | 210 (23.0%) |
| Total (Overall) | 3,068 (50.8%) | 2,967 (49.2%) |
Employment Industries by Sex in New Baltimore
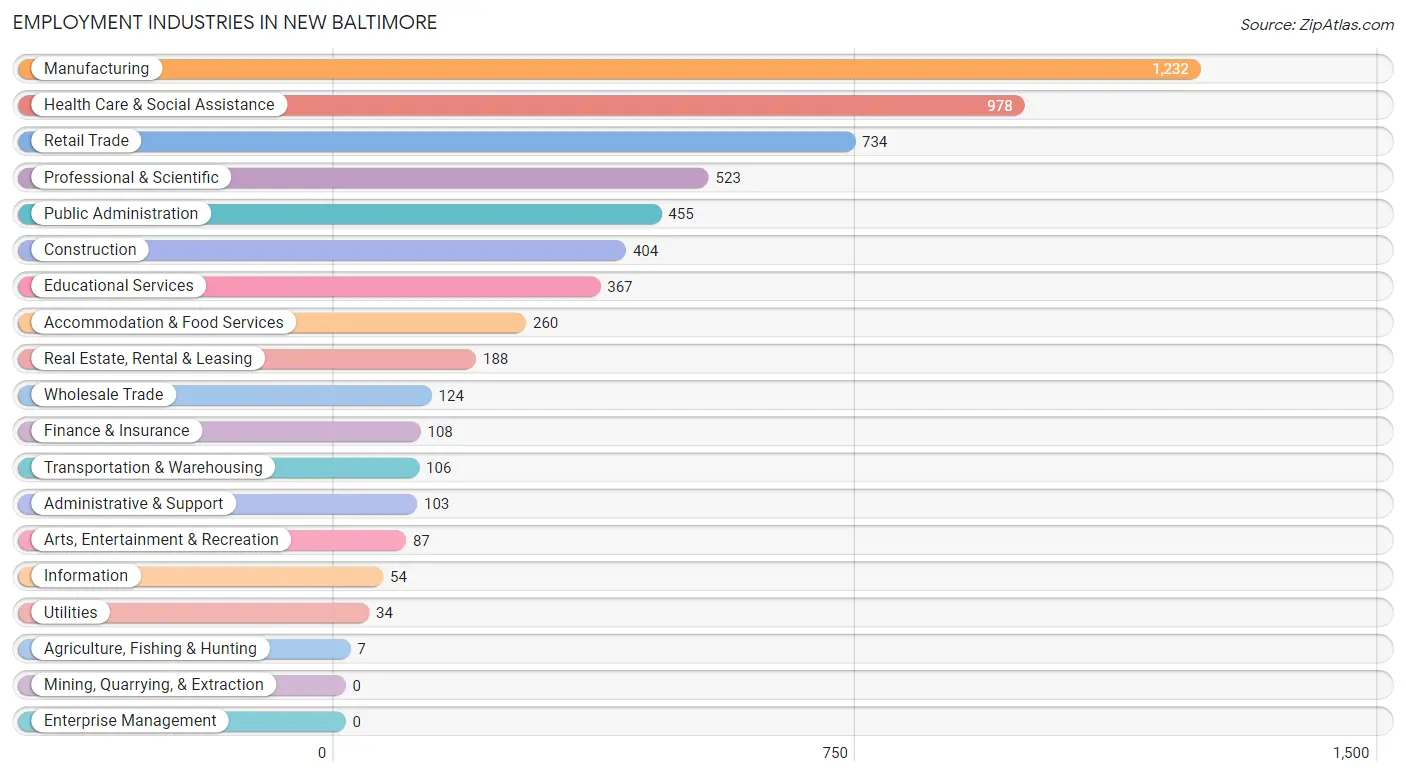
Employment Industries in New Baltimore
The major employment industries in New Baltimore include Manufacturing (1,232 | 20.4%), Health Care & Social Assistance (978 | 16.2%), Retail Trade (734 | 12.2%), Professional & Scientific (523 | 8.7%), and Public Administration (455 | 7.5%).
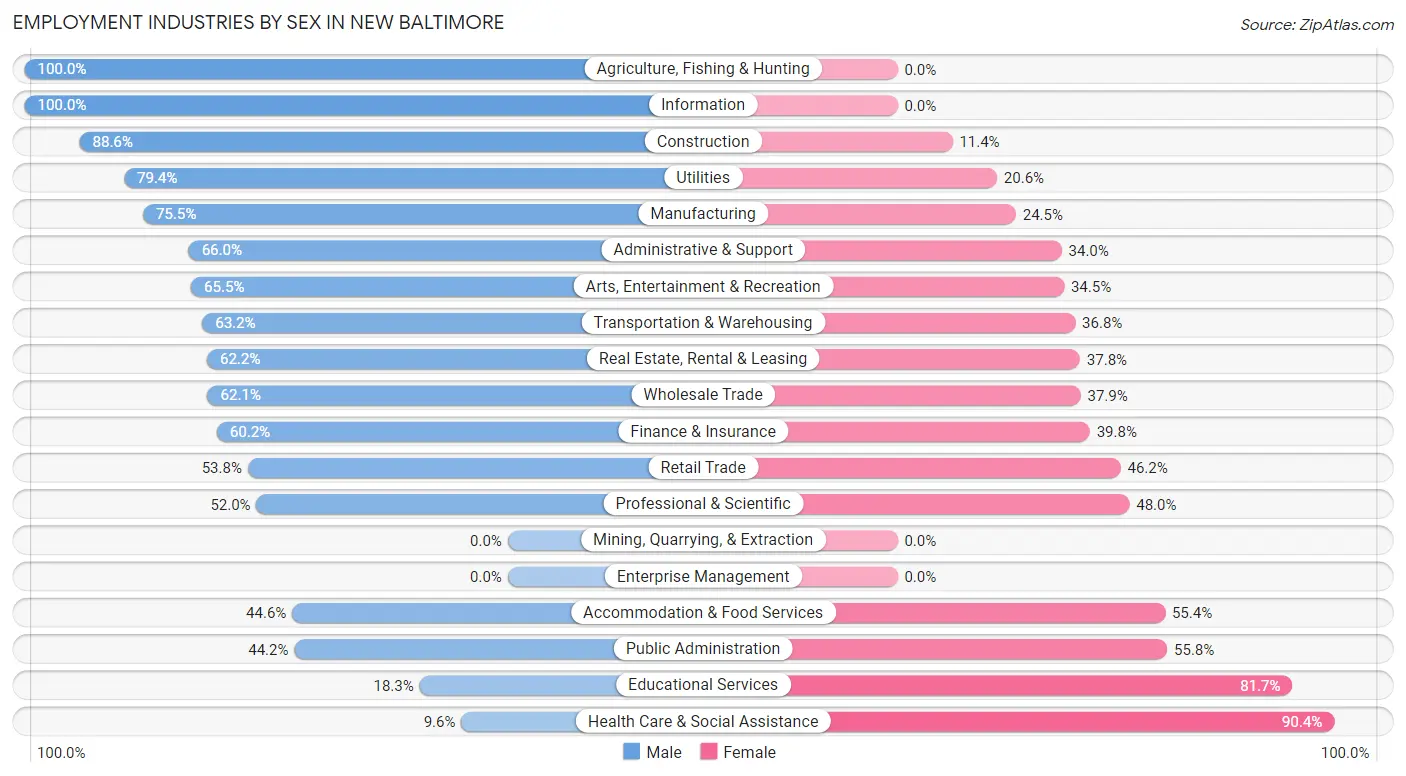
Employment Industries by Sex in New Baltimore
The New Baltimore industries that see more men than women are Agriculture, Fishing & Hunting (100.0%), Information (100.0%), and Construction (88.6%), whereas the industries that tend to have a higher number of women are Health Care & Social Assistance (90.4%), Educational Services (81.7%), and Public Administration (55.8%).
| Industry | Male | Female |
| Agriculture, Fishing & Hunting | 7 (100.0%) | 0 (0.0%) |
| Mining, Quarrying, & Extraction | 0 (0.0%) | 0 (0.0%) |
| Construction | 358 (88.6%) | 46 (11.4%) |
| Manufacturing | 930 (75.5%) | 302 (24.5%) |
| Wholesale Trade | 77 (62.1%) | 47 (37.9%) |
| Retail Trade | 395 (53.8%) | 339 (46.2%) |
| Transportation & Warehousing | 67 (63.2%) | 39 (36.8%) |
| Utilities | 27 (79.4%) | 7 (20.6%) |
| Information | 54 (100.0%) | 0 (0.0%) |
| Finance & Insurance | 65 (60.2%) | 43 (39.8%) |
| Real Estate, Rental & Leasing | 117 (62.2%) | 71 (37.8%) |
| Professional & Scientific | 272 (52.0%) | 251 (48.0%) |
| Enterprise Management | 0 (0.0%) | 0 (0.0%) |
| Administrative & Support | 68 (66.0%) | 35 (34.0%) |
| Educational Services | 67 (18.3%) | 300 (81.7%) |
| Health Care & Social Assistance | 94 (9.6%) | 884 (90.4%) |
| Arts, Entertainment & Recreation | 57 (65.5%) | 30 (34.5%) |
| Accommodation & Food Services | 116 (44.6%) | 144 (55.4%) |
| Public Administration | 201 (44.2%) | 254 (55.8%) |
| Total | 3,068 (50.8%) | 2,967 (49.2%) |
Education in New Baltimore
School Enrollment in New Baltimore
The most common levels of schooling among the 2,856 students in New Baltimore are high school (703 | 24.6%), middle school (657 | 23.0%), and college / undergraduate (575 | 20.1%).
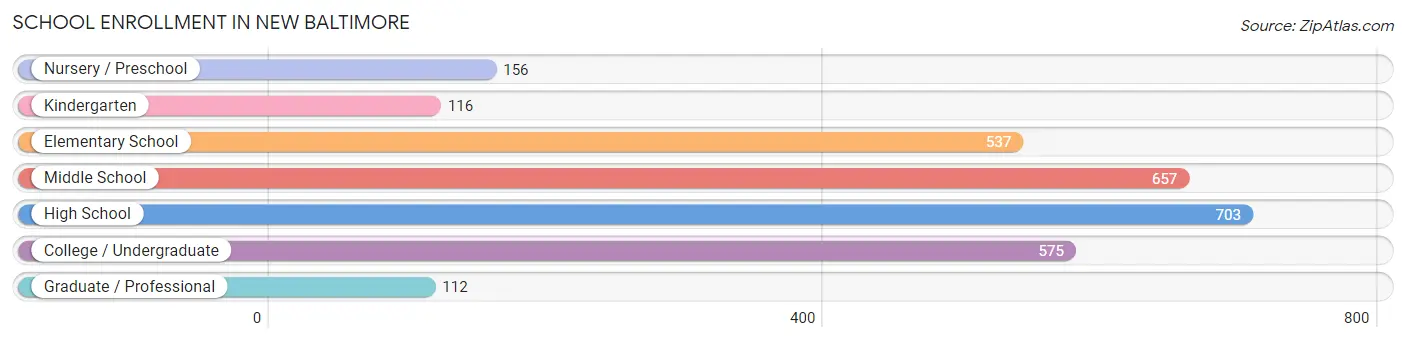
| School Level | # Students | % Students |
| Nursery / Preschool | 156 | 5.5% |
| Kindergarten | 116 | 4.1% |
| Elementary School | 537 | 18.8% |
| Middle School | 657 | 23.0% |
| High School | 703 | 24.6% |
| College / Undergraduate | 575 | 20.1% |
| Graduate / Professional | 112 | 3.9% |
| Total | 2,856 | 100.0% |
School Enrollment by Age by Funding Source in New Baltimore
Out of a total of 2,856 students who are enrolled in schools in New Baltimore, 283 (9.9%) attend a private institution, while the remaining 2,573 (90.1%) are enrolled in public schools. The age group of 3 to 4 year olds has the highest likelihood of being enrolled in private schools, with 53 (49.1% in the age bracket) enrolled. Conversely, the age group of 18 to 19 year olds has the lowest likelihood of being enrolled in a private school, with 202 (100.0% in the age bracket) attending a public institution.
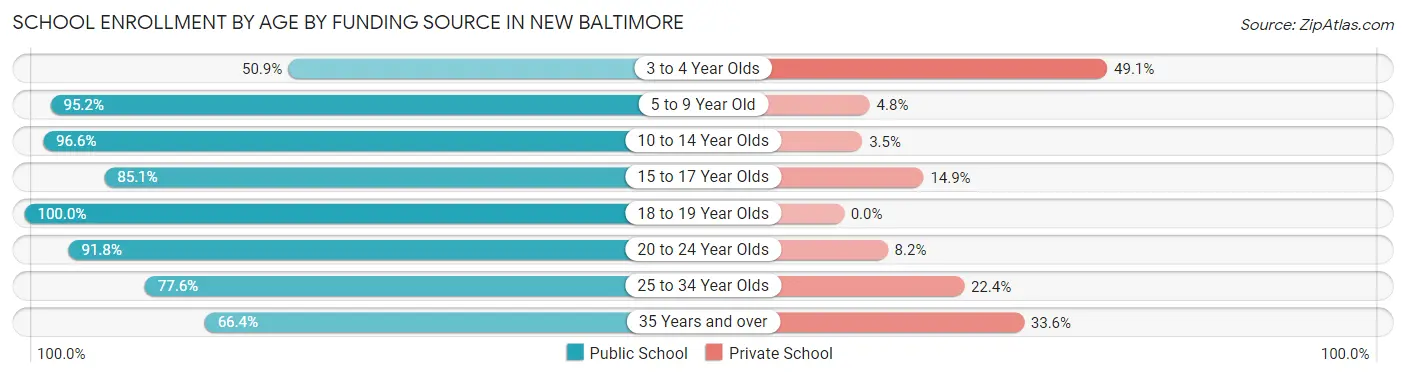
| Age Bracket | Public School | Private School |
| 3 to 4 Year Olds | 55 (50.9%) | 53 (49.1%) |
| 5 to 9 Year Old | 629 (95.2%) | 32 (4.8%) |
| 10 to 14 Year Olds | 783 (96.6%) | 28 (3.5%) |
| 15 to 17 Year Olds | 447 (85.1%) | 78 (14.9%) |
| 18 to 19 Year Olds | 202 (100.0%) | 0 (0.0%) |
| 20 to 24 Year Olds | 314 (91.8%) | 28 (8.2%) |
| 25 to 34 Year Olds | 45 (77.6%) | 13 (22.4%) |
| 35 Years and over | 99 (66.4%) | 50 (33.6%) |
| Total | 2,573 (90.1%) | 283 (9.9%) |
Educational Attainment by Field of Study in New Baltimore
Business (745 | 29.0%), science & technology (423 | 16.5%), education (337 | 13.1%), engineering (182 | 7.1%), and social sciences (168 | 6.5%) are the most common fields of study among 2,570 individuals in New Baltimore who have obtained a bachelor's degree or higher.
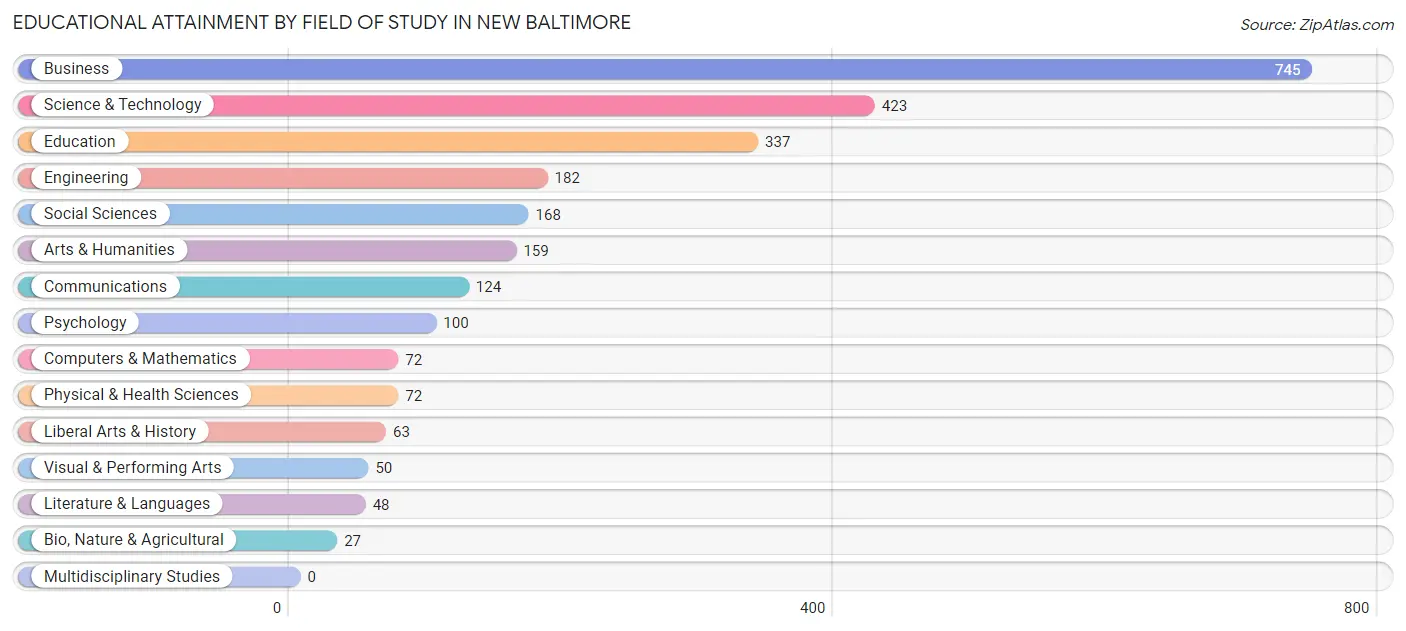
| Field of Study | # Graduates | % Graduates |
| Computers & Mathematics | 72 | 2.8% |
| Bio, Nature & Agricultural | 27 | 1.1% |
| Physical & Health Sciences | 72 | 2.8% |
| Psychology | 100 | 3.9% |
| Social Sciences | 168 | 6.5% |
| Engineering | 182 | 7.1% |
| Multidisciplinary Studies | 0 | 0.0% |
| Science & Technology | 423 | 16.5% |
| Business | 745 | 29.0% |
| Education | 337 | 13.1% |
| Literature & Languages | 48 | 1.9% |
| Liberal Arts & History | 63 | 2.5% |
| Visual & Performing Arts | 50 | 1.9% |
| Communications | 124 | 4.8% |
| Arts & Humanities | 159 | 6.2% |
| Total | 2,570 | 100.0% |
Transportation & Commute in New Baltimore
Vehicle Availability by Sex in New Baltimore
The most prevalent vehicle ownership categories in New Baltimore are males with 2 vehicles (1,511, accounting for 49.5%) and females with 2 vehicles (1,328, making up 52.8%).
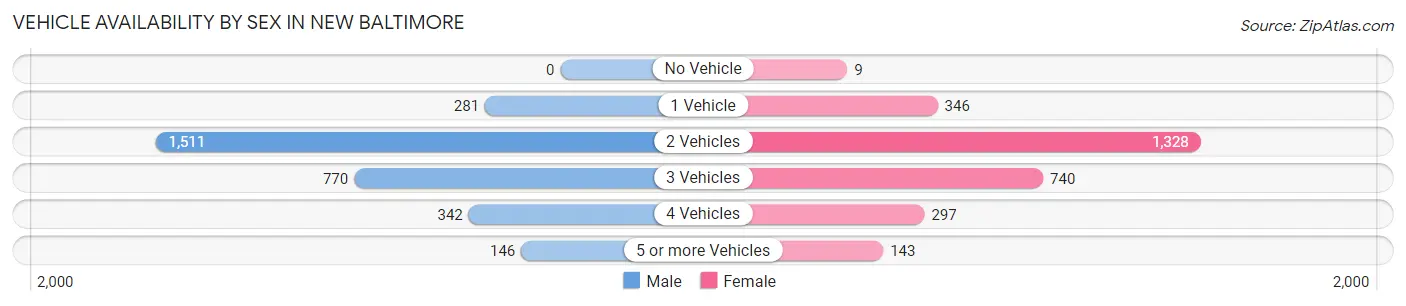
| Vehicles Available | Male | Female |
| No Vehicle | 0 (0.0%) | 9 (0.3%) |
| 1 Vehicle | 281 (9.2%) | 346 (12.1%) |
| 2 Vehicles | 1,511 (49.5%) | 1,328 (46.4%) |
| 3 Vehicles | 770 (25.3%) | 740 (25.9%) |
| 4 Vehicles | 342 (11.2%) | 297 (10.4%) |
| 5 or more Vehicles | 146 (4.8%) | 143 (5.0%) |
| Total | 3,050 (100.0%) | 2,863 (100.0%) |
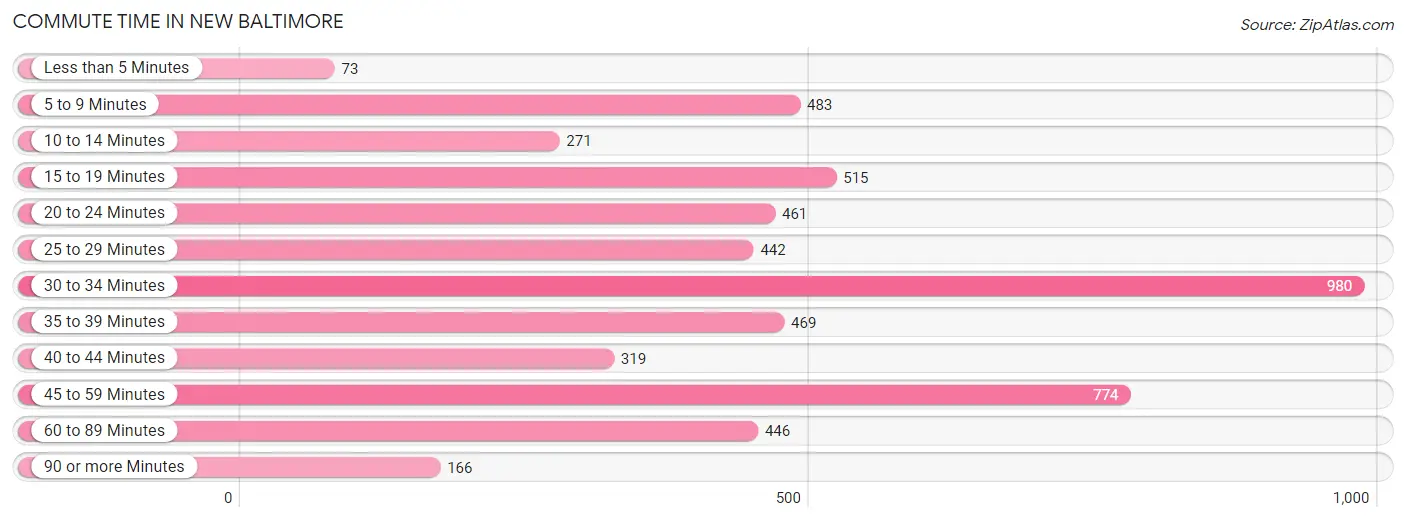
Commute Time in New Baltimore
The most frequently occuring commute durations in New Baltimore are 30 to 34 minutes (980 commuters, 18.1%), 45 to 59 minutes (774 commuters, 14.3%), and 15 to 19 minutes (515 commuters, 9.5%).
| Commute Time | # Commuters | % Commuters |
| Less than 5 Minutes | 73 | 1.3% |
| 5 to 9 Minutes | 483 | 8.9% |
| 10 to 14 Minutes | 271 | 5.0% |
| 15 to 19 Minutes | 515 | 9.5% |
| 20 to 24 Minutes | 461 | 8.5% |
| 25 to 29 Minutes | 442 | 8.2% |
| 30 to 34 Minutes | 980 | 18.1% |
| 35 to 39 Minutes | 469 | 8.7% |
| 40 to 44 Minutes | 319 | 5.9% |
| 45 to 59 Minutes | 774 | 14.3% |
| 60 to 89 Minutes | 446 | 8.3% |
| 90 or more Minutes | 166 | 3.1% |
Commute Time by Sex in New Baltimore
The most common commute times in New Baltimore are 30 to 34 minutes (447 commuters, 15.8%) for males and 30 to 34 minutes (533 commuters, 20.8%) for females.
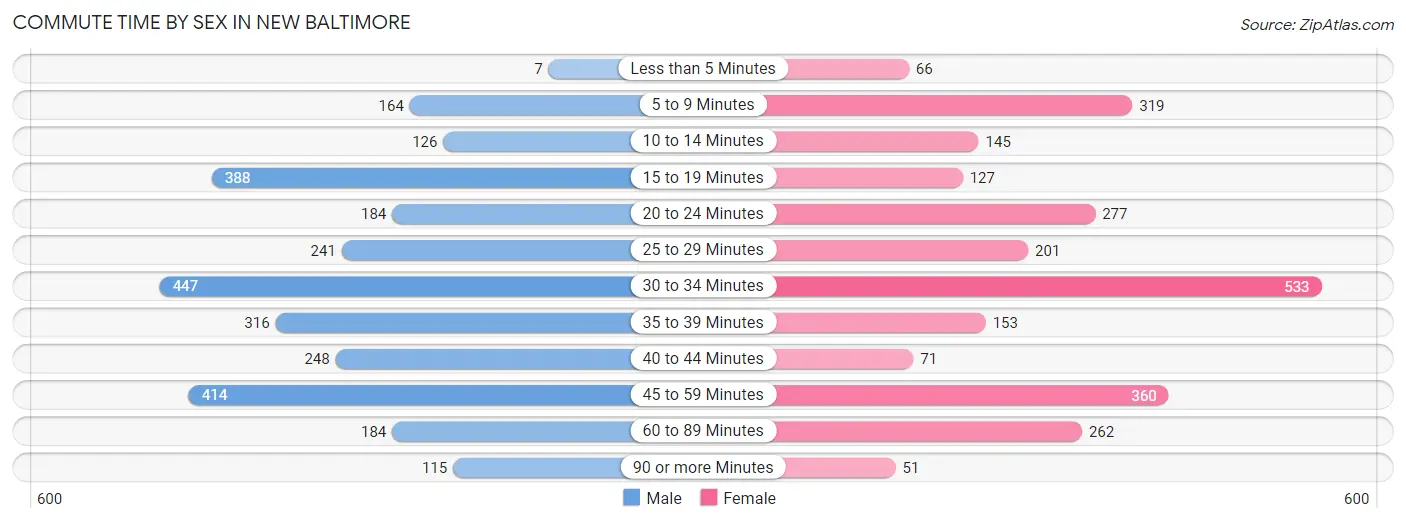
| Commute Time | Male | Female |
| Less than 5 Minutes | 7 (0.3%) | 66 (2.6%) |
| 5 to 9 Minutes | 164 (5.8%) | 319 (12.4%) |
| 10 to 14 Minutes | 126 (4.4%) | 145 (5.7%) |
| 15 to 19 Minutes | 388 (13.7%) | 127 (5.0%) |
| 20 to 24 Minutes | 184 (6.5%) | 277 (10.8%) |
| 25 to 29 Minutes | 241 (8.5%) | 201 (7.8%) |
| 30 to 34 Minutes | 447 (15.8%) | 533 (20.8%) |
| 35 to 39 Minutes | 316 (11.2%) | 153 (6.0%) |
| 40 to 44 Minutes | 248 (8.7%) | 71 (2.8%) |
| 45 to 59 Minutes | 414 (14.6%) | 360 (14.0%) |
| 60 to 89 Minutes | 184 (6.5%) | 262 (10.2%) |
| 90 or more Minutes | 115 (4.1%) | 51 (2.0%) |
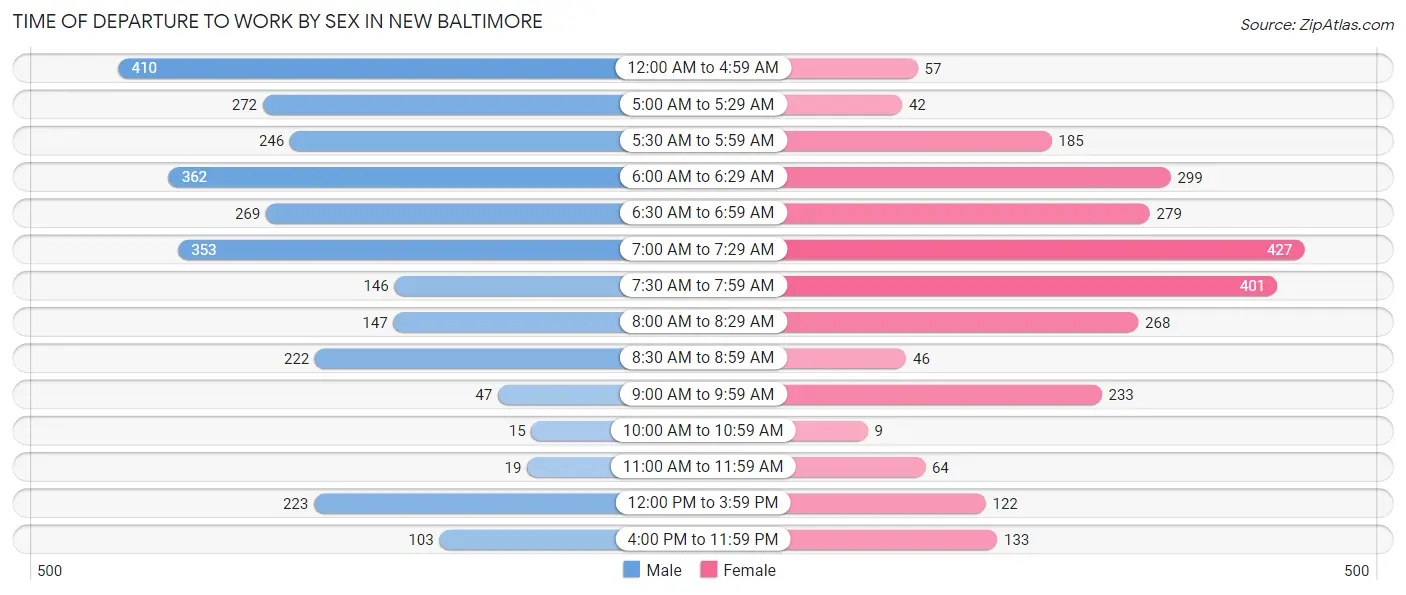
Time of Departure to Work by Sex in New Baltimore
The most frequent times of departure to work in New Baltimore are 12:00 AM to 4:59 AM (410, 14.5%) for males and 7:00 AM to 7:29 AM (427, 16.7%) for females.
| Time of Departure | Male | Female |
| 12:00 AM to 4:59 AM | 410 (14.5%) | 57 (2.2%) |
| 5:00 AM to 5:29 AM | 272 (9.6%) | 42 (1.6%) |
| 5:30 AM to 5:59 AM | 246 (8.7%) | 185 (7.2%) |
| 6:00 AM to 6:29 AM | 362 (12.8%) | 299 (11.7%) |
| 6:30 AM to 6:59 AM | 269 (9.5%) | 279 (10.9%) |
| 7:00 AM to 7:29 AM | 353 (12.5%) | 427 (16.7%) |
| 7:30 AM to 7:59 AM | 146 (5.1%) | 401 (15.6%) |
| 8:00 AM to 8:29 AM | 147 (5.2%) | 268 (10.4%) |
| 8:30 AM to 8:59 AM | 222 (7.8%) | 46 (1.8%) |
| 9:00 AM to 9:59 AM | 47 (1.7%) | 233 (9.1%) |
| 10:00 AM to 10:59 AM | 15 (0.5%) | 9 (0.4%) |
| 11:00 AM to 11:59 AM | 19 (0.7%) | 64 (2.5%) |
| 12:00 PM to 3:59 PM | 223 (7.9%) | 122 (4.8%) |
| 4:00 PM to 11:59 PM | 103 (3.6%) | 133 (5.2%) |
| Total | 2,834 (100.0%) | 2,565 (100.0%) |
Housing Occupancy in New Baltimore
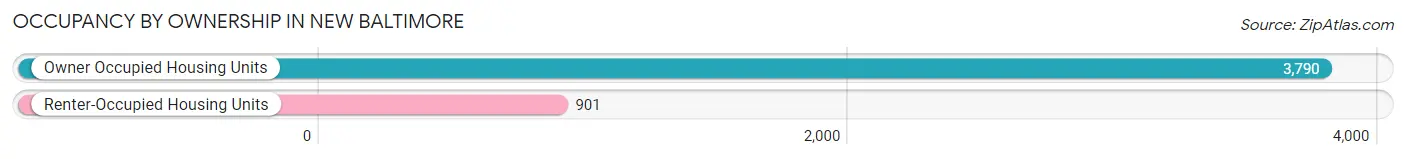
Occupancy by Ownership in New Baltimore
Of the total 4,691 dwellings in New Baltimore, owner-occupied units account for 3,790 (80.8%), while renter-occupied units make up 901 (19.2%).
| Occupancy | # Housing Units | % Housing Units |
| Owner Occupied Housing Units | 3,790 | 80.8% |
| Renter-Occupied Housing Units | 901 | 19.2% |
| Total Occupied Housing Units | 4,691 | 100.0% |
Occupancy by Household Size in New Baltimore
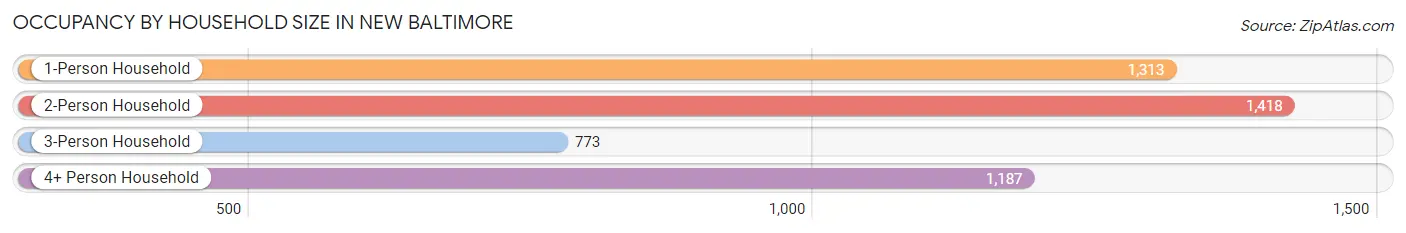
| Household Size | # Housing Units | % Housing Units |
| 1-Person Household | 1,313 | 28.0% |
| 2-Person Household | 1,418 | 30.2% |
| 3-Person Household | 773 | 16.5% |
| 4+ Person Household | 1,187 | 25.3% |
| Total Housing Units | 4,691 | 100.0% |
Occupancy by Ownership by Household Size in New Baltimore
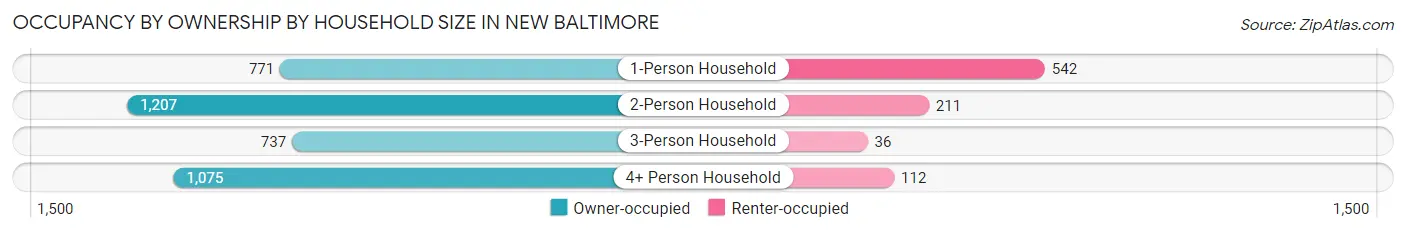
| Household Size | Owner-occupied | Renter-occupied |
| 1-Person Household | 771 (58.7%) | 542 (41.3%) |
| 2-Person Household | 1,207 (85.1%) | 211 (14.9%) |
| 3-Person Household | 737 (95.3%) | 36 (4.7%) |
| 4+ Person Household | 1,075 (90.6%) | 112 (9.4%) |
| Total Housing Units | 3,790 (80.8%) | 901 (19.2%) |
Occupancy by Educational Attainment in New Baltimore
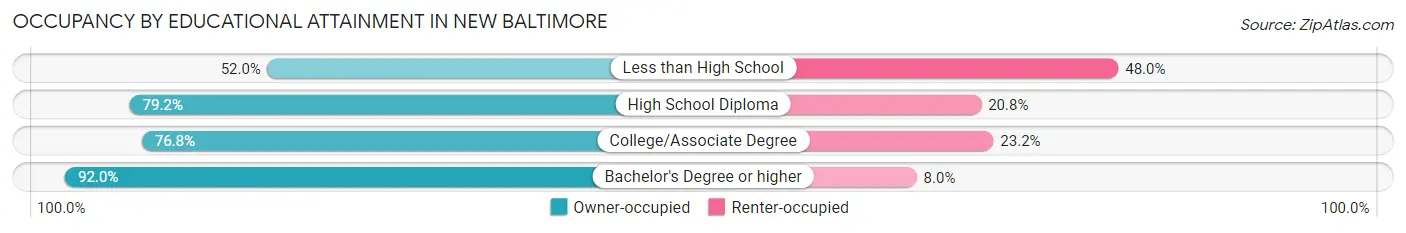
| Household Size | Owner-occupied | Renter-occupied |
| Less than High School | 117 (52.0%) | 108 (48.0%) |
| High School Diploma | 821 (79.2%) | 216 (20.8%) |
| College/Associate Degree | 1,523 (76.8%) | 461 (23.2%) |
| Bachelor's Degree or higher | 1,329 (92.0%) | 116 (8.0%) |
Occupancy by Age of Householder in New Baltimore
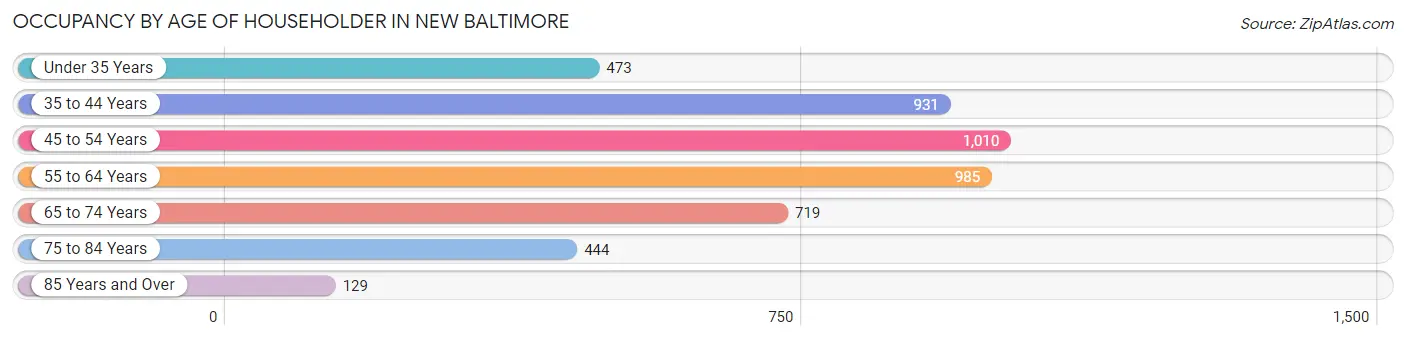
| Age Bracket | # Households | % Households |
| Under 35 Years | 473 | 10.1% |
| 35 to 44 Years | 931 | 19.9% |
| 45 to 54 Years | 1,010 | 21.5% |
| 55 to 64 Years | 985 | 21.0% |
| 65 to 74 Years | 719 | 15.3% |
| 75 to 84 Years | 444 | 9.5% |
| 85 Years and Over | 129 | 2.8% |
| Total | 4,691 | 100.0% |
Housing Finances in New Baltimore
Median Income by Occupancy in New Baltimore
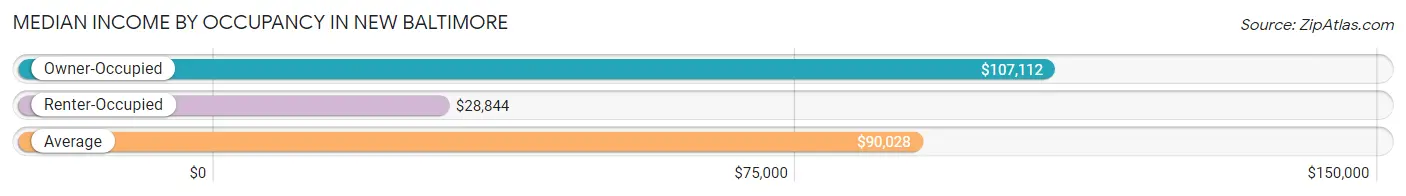
| Occupancy Type | # Households | Median Income |
| Owner-Occupied | 3,790 (80.8%) | $107,112 |
| Renter-Occupied | 901 (19.2%) | $28,844 |
| Average | 4,691 (100.0%) | $90,028 |
Occupancy by Householder Income Bracket in New Baltimore
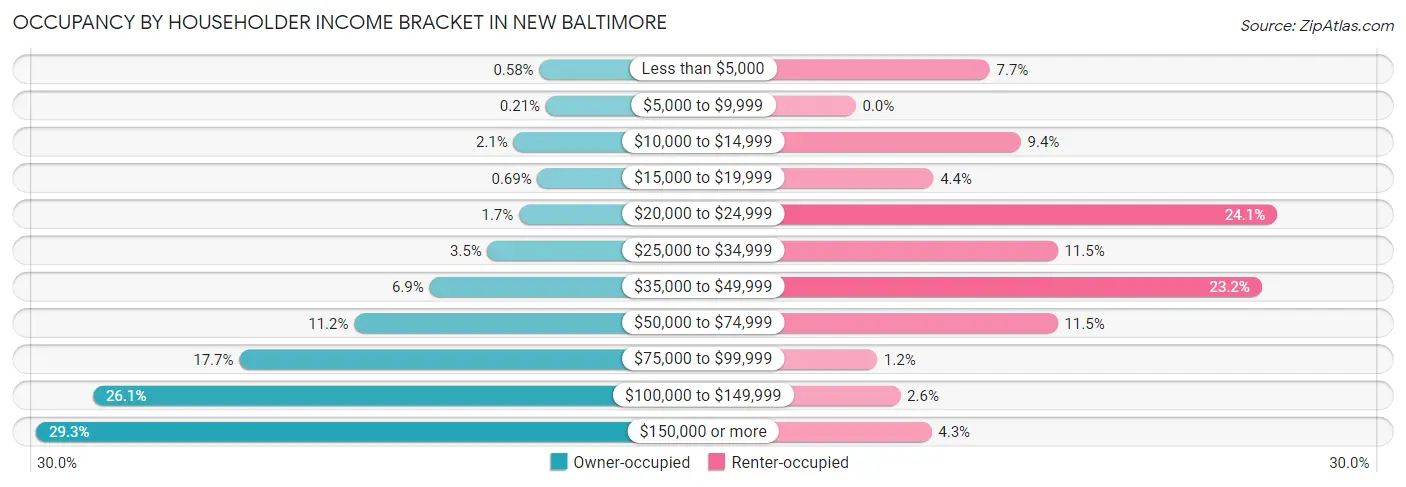
| Income Bracket | Owner-occupied | Renter-occupied |
| Less than $5,000 | 22 (0.6%) | 69 (7.7%) |
| $5,000 to $9,999 | 8 (0.2%) | 0 (0.0%) |
| $10,000 to $14,999 | 78 (2.1%) | 85 (9.4%) |
| $15,000 to $19,999 | 26 (0.7%) | 40 (4.4%) |
| $20,000 to $24,999 | 66 (1.7%) | 217 (24.1%) |
| $25,000 to $34,999 | 134 (3.5%) | 104 (11.5%) |
| $35,000 to $49,999 | 260 (6.9%) | 209 (23.2%) |
| $50,000 to $74,999 | 423 (11.2%) | 104 (11.5%) |
| $75,000 to $99,999 | 672 (17.7%) | 11 (1.2%) |
| $100,000 to $149,999 | 989 (26.1%) | 23 (2.5%) |
| $150,000 or more | 1,112 (29.3%) | 39 (4.3%) |
| Total | 3,790 (100.0%) | 901 (100.0%) |
Monthly Housing Cost Tiers in New Baltimore
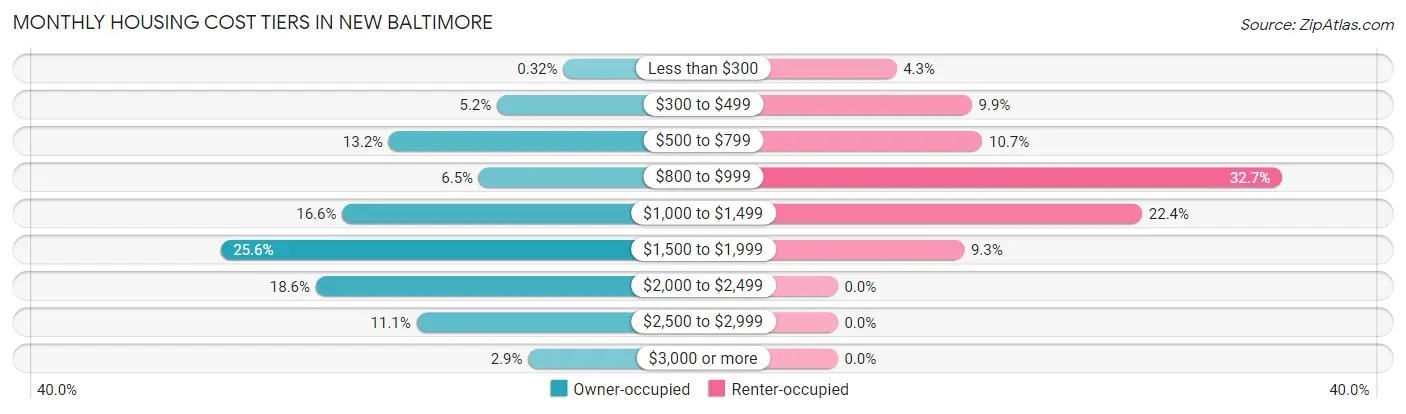
| Monthly Cost | Owner-occupied | Renter-occupied |
| Less than $300 | 12 (0.3%) | 39 (4.3%) |
| $300 to $499 | 197 (5.2%) | 89 (9.9%) |
| $500 to $799 | 499 (13.2%) | 96 (10.6%) |
| $800 to $999 | 248 (6.5%) | 295 (32.7%) |
| $1,000 to $1,499 | 629 (16.6%) | 202 (22.4%) |
| $1,500 to $1,999 | 970 (25.6%) | 84 (9.3%) |
| $2,000 to $2,499 | 703 (18.5%) | 0 (0.0%) |
| $2,500 to $2,999 | 422 (11.1%) | 0 (0.0%) |
| $3,000 or more | 110 (2.9%) | 0 (0.0%) |
| Total | 3,790 (100.0%) | 901 (100.0%) |
Physical Housing Characteristics in New Baltimore
Housing Structures in New Baltimore
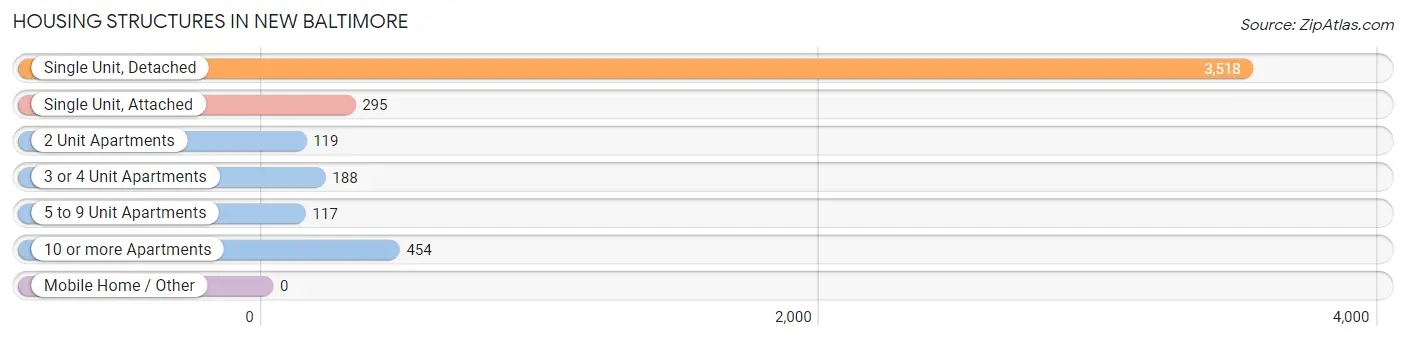
| Structure Type | # Housing Units | % Housing Units |
| Single Unit, Detached | 3,518 | 75.0% |
| Single Unit, Attached | 295 | 6.3% |
| 2 Unit Apartments | 119 | 2.5% |
| 3 or 4 Unit Apartments | 188 | 4.0% |
| 5 to 9 Unit Apartments | 117 | 2.5% |
| 10 or more Apartments | 454 | 9.7% |
| Mobile Home / Other | 0 | 0.0% |
| Total | 4,691 | 100.0% |
Housing Structures by Occupancy in New Baltimore
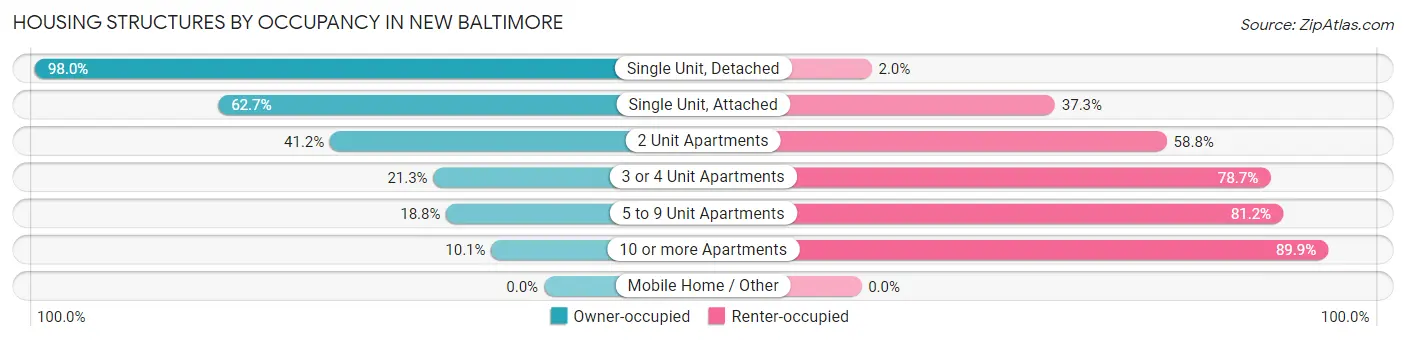
| Structure Type | Owner-occupied | Renter-occupied |
| Single Unit, Detached | 3,448 (98.0%) | 70 (2.0%) |
| Single Unit, Attached | 185 (62.7%) | 110 (37.3%) |
| 2 Unit Apartments | 49 (41.2%) | 70 (58.8%) |
| 3 or 4 Unit Apartments | 40 (21.3%) | 148 (78.7%) |
| 5 to 9 Unit Apartments | 22 (18.8%) | 95 (81.2%) |
| 10 or more Apartments | 46 (10.1%) | 408 (89.9%) |
| Mobile Home / Other | 0 (0.0%) | 0 (0.0%) |
| Total | 3,790 (80.8%) | 901 (19.2%) |
Housing Structures by Number of Rooms in New Baltimore
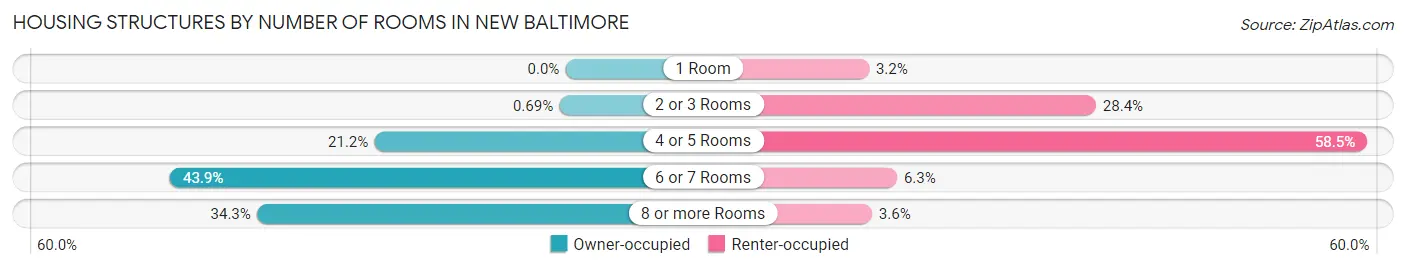
| Number of Rooms | Owner-occupied | Renter-occupied |
| 1 Room | 0 (0.0%) | 29 (3.2%) |
| 2 or 3 Rooms | 26 (0.7%) | 256 (28.4%) |
| 4 or 5 Rooms | 804 (21.2%) | 527 (58.5%) |
| 6 or 7 Rooms | 1,662 (43.9%) | 57 (6.3%) |
| 8 or more Rooms | 1,298 (34.3%) | 32 (3.5%) |
| Total | 3,790 (100.0%) | 901 (100.0%) |
Housing Structure by Heating Type in New Baltimore
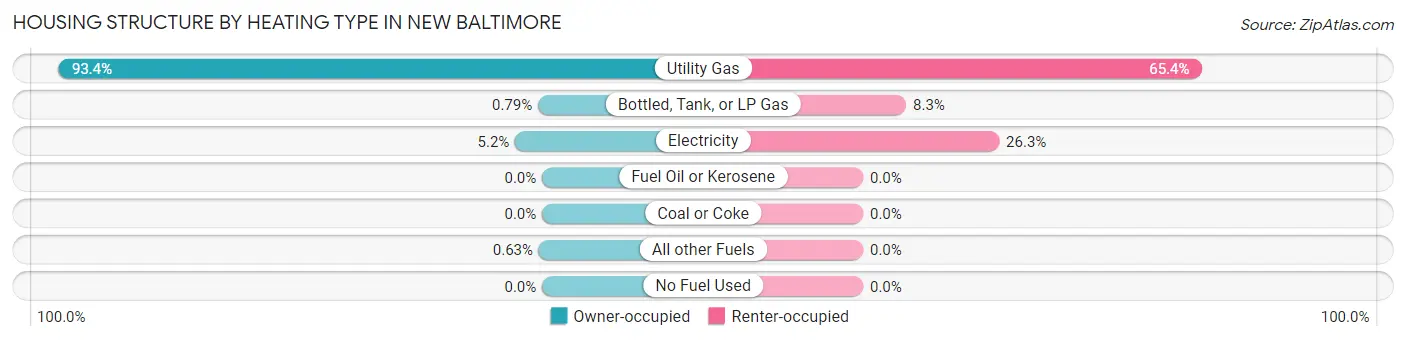
| Heating Type | Owner-occupied | Renter-occupied |
| Utility Gas | 3,539 (93.4%) | 589 (65.4%) |
| Bottled, Tank, or LP Gas | 30 (0.8%) | 75 (8.3%) |
| Electricity | 197 (5.2%) | 237 (26.3%) |
| Fuel Oil or Kerosene | 0 (0.0%) | 0 (0.0%) |
| Coal or Coke | 0 (0.0%) | 0 (0.0%) |
| All other Fuels | 24 (0.6%) | 0 (0.0%) |
| No Fuel Used | 0 (0.0%) | 0 (0.0%) |
| Total | 3,790 (100.0%) | 901 (100.0%) |
Household Vehicle Usage in New Baltimore
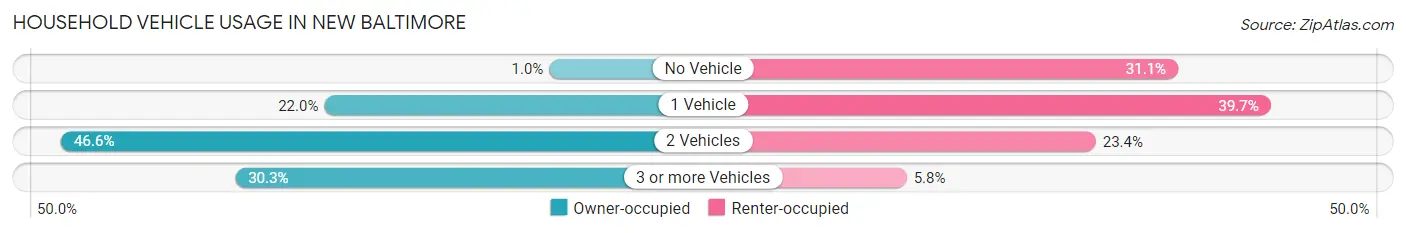
| Vehicles per Household | Owner-occupied | Renter-occupied |
| No Vehicle | 39 (1.0%) | 280 (31.1%) |
| 1 Vehicle | 835 (22.0%) | 358 (39.7%) |
| 2 Vehicles | 1,766 (46.6%) | 211 (23.4%) |
| 3 or more Vehicles | 1,150 (30.3%) | 52 (5.8%) |
| Total | 3,790 (100.0%) | 901 (100.0%) |
Real Estate & Mortgages in New Baltimore
Real Estate and Mortgage Overview in New Baltimore
| Characteristic | Without Mortgage | With Mortgage |
| Housing Units | 1,014 | 2,776 |
| Median Property Value | $231,700 | $303,000 |
| Median Household Income | $85,530 | $847 |
| Monthly Housing Costs | $729 | $102 |
| Real Estate Taxes | $3,594 | $20 |
Property Value by Mortgage Status in New Baltimore
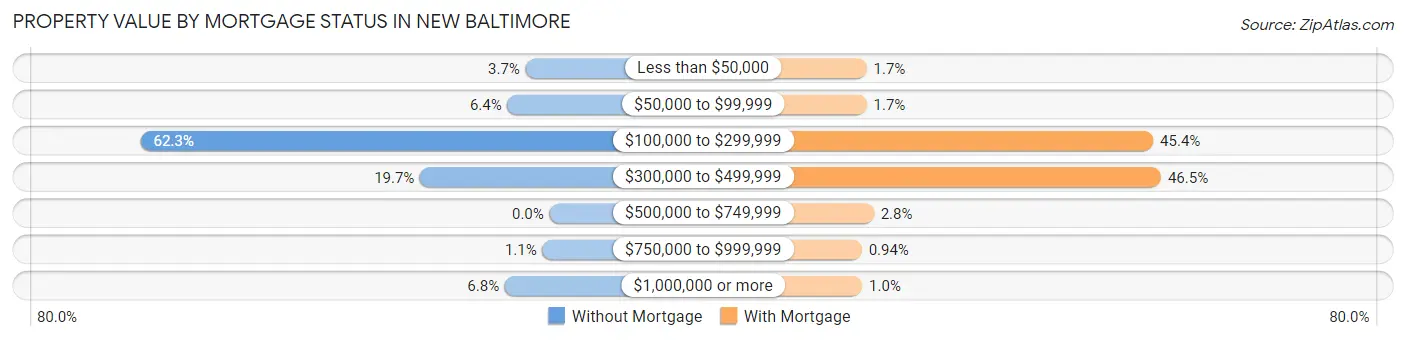
| Property Value | Without Mortgage | With Mortgage |
| Less than $50,000 | 37 (3.6%) | 47 (1.7%) |
| $50,000 to $99,999 | 65 (6.4%) | 47 (1.7%) |
| $100,000 to $299,999 | 632 (62.3%) | 1,259 (45.4%) |
| $300,000 to $499,999 | 200 (19.7%) | 1,292 (46.5%) |
| $500,000 to $749,999 | 0 (0.0%) | 77 (2.8%) |
| $750,000 to $999,999 | 11 (1.1%) | 26 (0.9%) |
| $1,000,000 or more | 69 (6.8%) | 28 (1.0%) |
| Total | 1,014 (100.0%) | 2,776 (100.0%) |
Household Income by Mortgage Status in New Baltimore
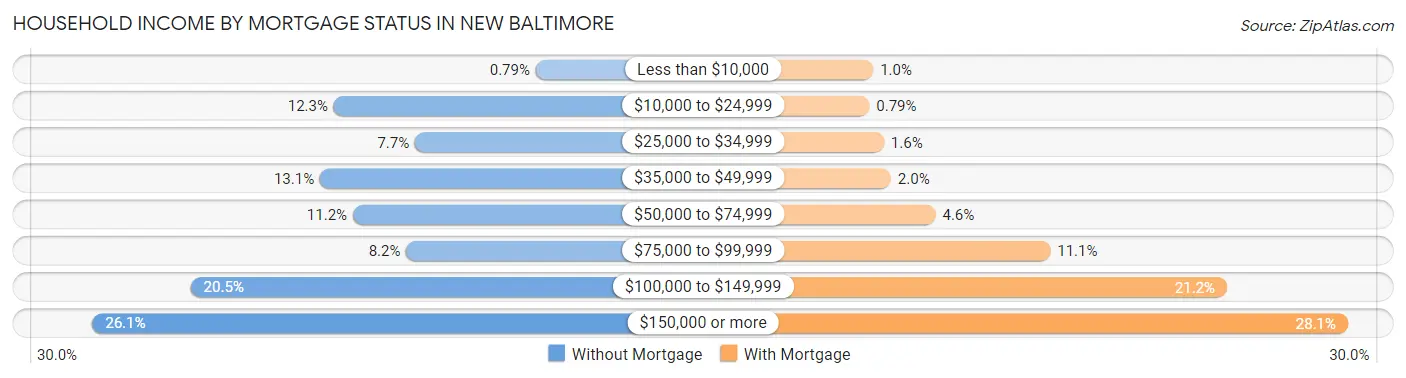
| Household Income | Without Mortgage | With Mortgage |
| Less than $10,000 | 8 (0.8%) | 28 (1.0%) |
| $10,000 to $24,999 | 125 (12.3%) | 22 (0.8%) |
| $25,000 to $34,999 | 78 (7.7%) | 45 (1.6%) |
| $35,000 to $49,999 | 133 (13.1%) | 56 (2.0%) |
| $50,000 to $74,999 | 114 (11.2%) | 127 (4.6%) |
| $75,000 to $99,999 | 83 (8.2%) | 309 (11.1%) |
| $100,000 to $149,999 | 208 (20.5%) | 589 (21.2%) |
| $150,000 or more | 265 (26.1%) | 781 (28.1%) |
| Total | 1,014 (100.0%) | 2,776 (100.0%) |
Property Value to Household Income Ratio in New Baltimore
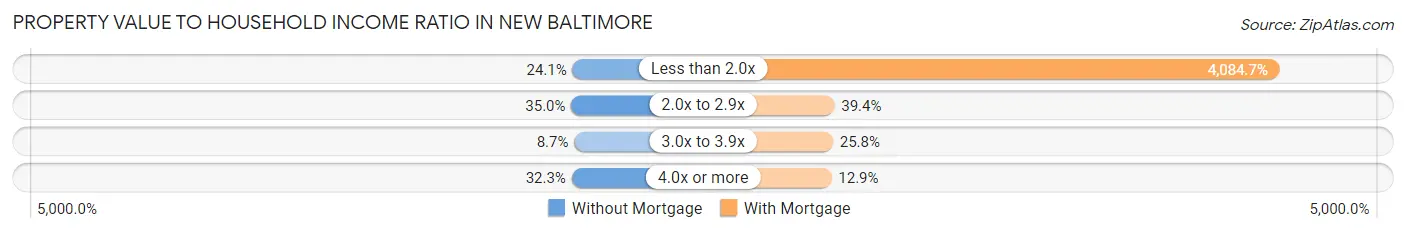
| Value-to-Income Ratio | Without Mortgage | With Mortgage |
| Less than 2.0x | 244 (24.1%) | 113,390 (4,084.6%) |
| 2.0x to 2.9x | 355 (35.0%) | 1,094 (39.4%) |
| 3.0x to 3.9x | 88 (8.7%) | 715 (25.8%) |
| 4.0x or more | 327 (32.3%) | 358 (12.9%) |
| Total | 1,014 (100.0%) | 2,776 (100.0%) |
Real Estate Taxes by Mortgage Status in New Baltimore
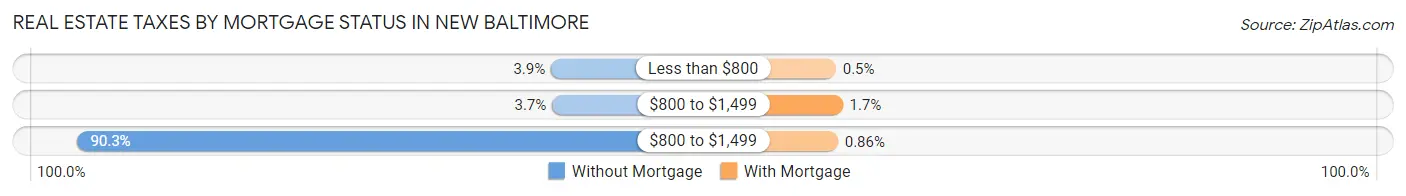
| Property Taxes | Without Mortgage | With Mortgage |
| Less than $800 | 39 (3.8%) | 14 (0.5%) |
| $800 to $1,499 | 37 (3.6%) | 48 (1.7%) |
| $800 to $1,499 | 916 (90.3%) | 24 (0.9%) |
| Total | 1,014 (100.0%) | 2,776 (100.0%) |
Health & Disability in New Baltimore
Health Insurance Coverage by Age in New Baltimore
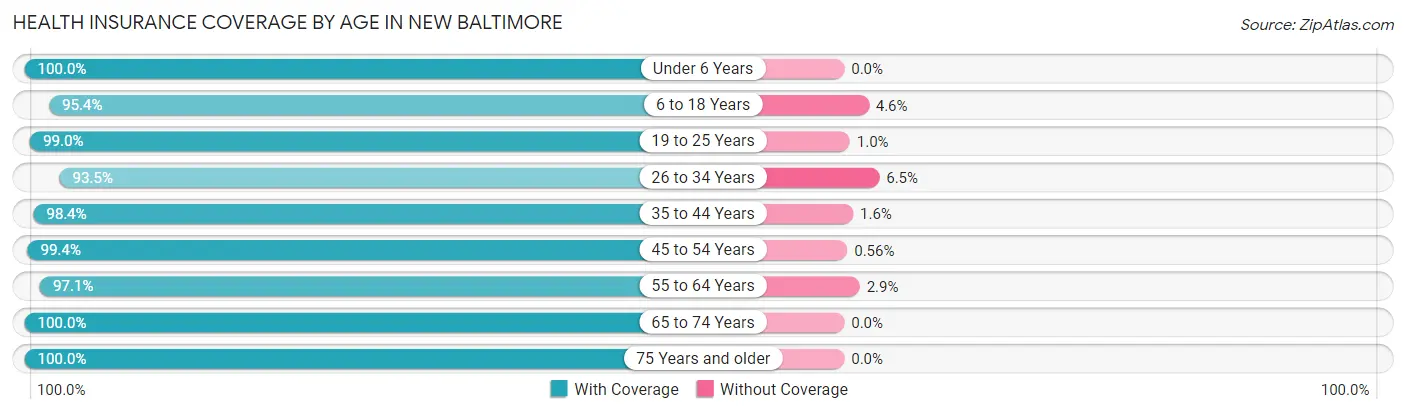
| Age Bracket | With Coverage | Without Coverage |
| Under 6 Years | 757 (100.0%) | 0 (0.0%) |
| 6 to 18 Years | 1,921 (95.4%) | 92 (4.6%) |
| 19 to 25 Years | 1,042 (99.0%) | 11 (1.0%) |
| 26 to 34 Years | 973 (93.5%) | 68 (6.5%) |
| 35 to 44 Years | 1,681 (98.4%) | 28 (1.6%) |
| 45 to 54 Years | 1,763 (99.4%) | 10 (0.6%) |
| 55 to 64 Years | 1,722 (97.1%) | 51 (2.9%) |
| 65 to 74 Years | 1,147 (100.0%) | 0 (0.0%) |
| 75 Years and older | 739 (100.0%) | 0 (0.0%) |
| Total | 11,745 (97.8%) | 260 (2.2%) |
Health Insurance Coverage by Citizenship Status in New Baltimore
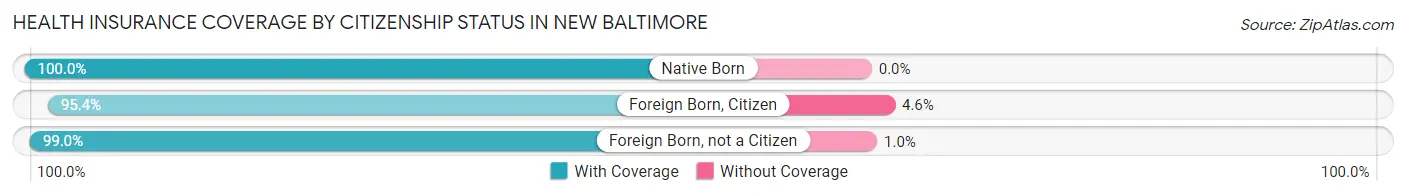
| Citizenship Status | With Coverage | Without Coverage |
| Native Born | 757 (100.0%) | 0 (0.0%) |
| Foreign Born, Citizen | 1,921 (95.4%) | 92 (4.6%) |
| Foreign Born, not a Citizen | 1,042 (99.0%) | 11 (1.0%) |
Health Insurance Coverage by Household Income in New Baltimore
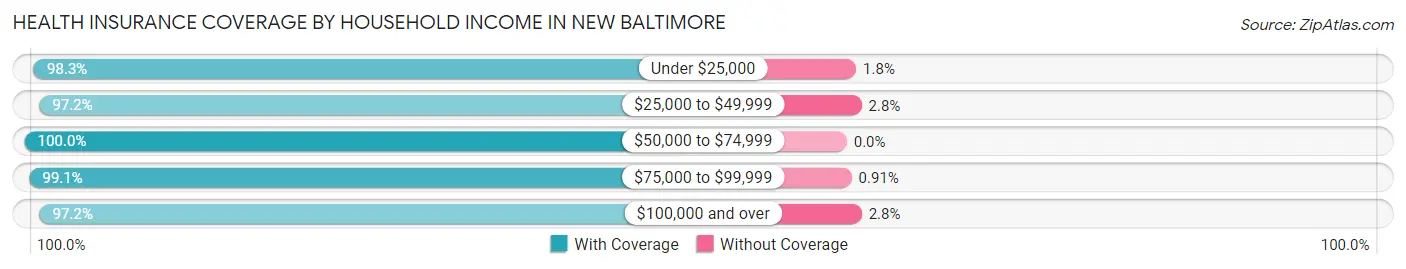
| Household Income | With Coverage | Without Coverage |
| Under $25,000 | 788 (98.3%) | 14 (1.8%) |
| $25,000 to $49,999 | 1,229 (97.2%) | 35 (2.8%) |
| $50,000 to $74,999 | 1,174 (100.0%) | 0 (0.0%) |
| $75,000 to $99,999 | 1,738 (99.1%) | 16 (0.9%) |
| $100,000 and over | 6,778 (97.2%) | 195 (2.8%) |
Public vs Private Health Insurance Coverage by Age in New Baltimore
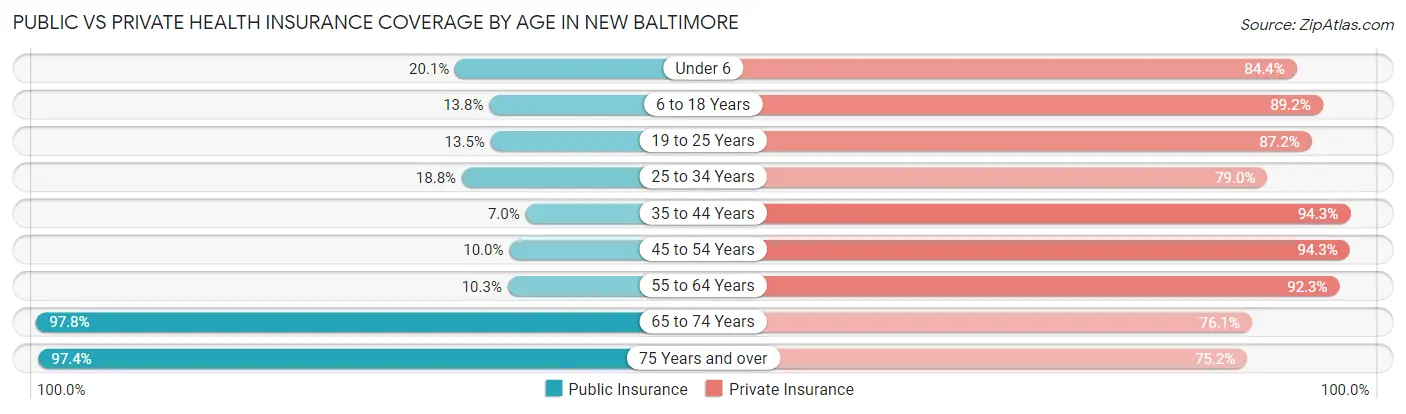
| Age Bracket | Public Insurance | Private Insurance |
| Under 6 | 152 (20.1%) | 639 (84.4%) |
| 6 to 18 Years | 277 (13.8%) | 1,796 (89.2%) |
| 19 to 25 Years | 142 (13.5%) | 918 (87.2%) |
| 25 to 34 Years | 196 (18.8%) | 822 (79.0%) |
| 35 to 44 Years | 120 (7.0%) | 1,612 (94.3%) |
| 45 to 54 Years | 178 (10.0%) | 1,671 (94.3%) |
| 55 to 64 Years | 183 (10.3%) | 1,637 (92.3%) |
| 65 to 74 Years | 1,122 (97.8%) | 873 (76.1%) |
| 75 Years and over | 720 (97.4%) | 556 (75.2%) |
| Total | 3,090 (25.7%) | 10,524 (87.7%) |
Disability Status by Sex by Age in New Baltimore
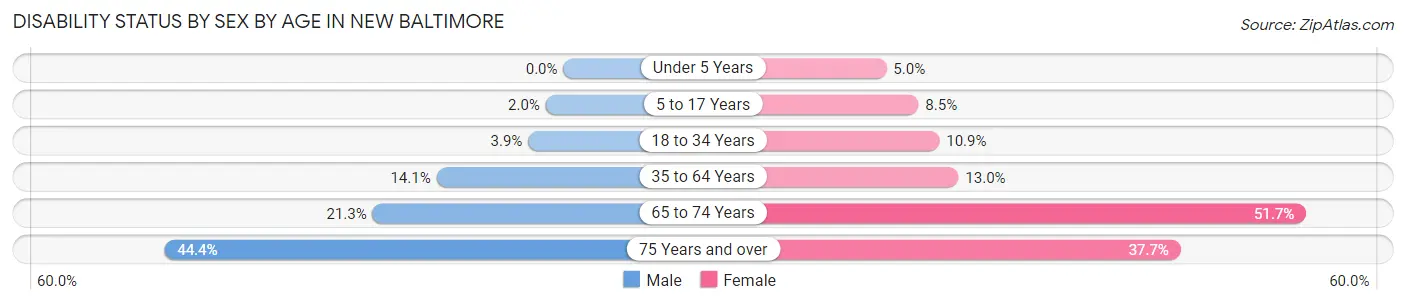
| Age Bracket | Male | Female |
| Under 5 Years | 0 (0.0%) | 18 (5.0%) |
| 5 to 17 Years | 24 (2.0%) | 70 (8.5%) |
| 18 to 34 Years | 39 (3.9%) | 132 (10.9%) |
| 35 to 64 Years | 364 (14.1%) | 348 (13.0%) |
| 65 to 74 Years | 95 (21.2%) | 362 (51.7%) |
| 75 Years and over | 120 (44.4%) | 177 (37.7%) |
Disability Class by Sex by Age in New Baltimore
Disability Class: Hearing Difficulty
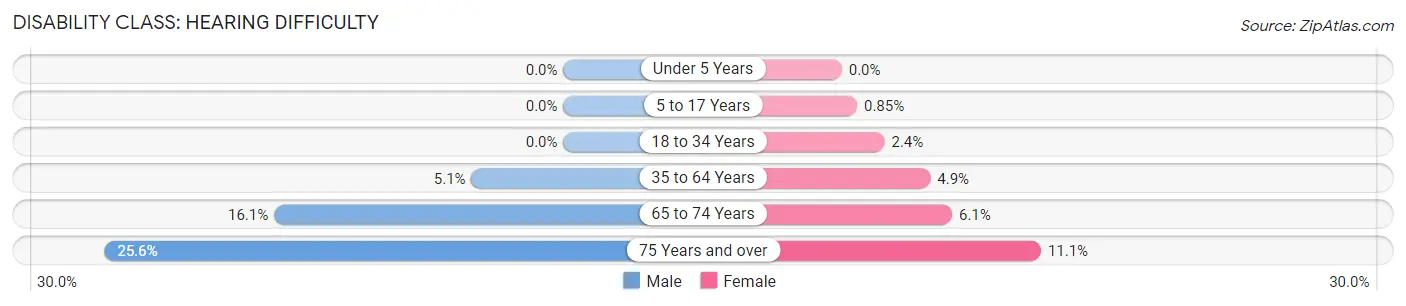
| Age Bracket | Male | Female |
| Under 5 Years | 0 (0.0%) | 0 (0.0%) |
| 5 to 17 Years | 0 (0.0%) | 7 (0.9%) |
| 18 to 34 Years | 0 (0.0%) | 29 (2.4%) |
| 35 to 64 Years | 132 (5.1%) | 132 (4.9%) |
| 65 to 74 Years | 72 (16.1%) | 43 (6.1%) |
| 75 Years and over | 69 (25.6%) | 52 (11.1%) |
Disability Class: Vision Difficulty
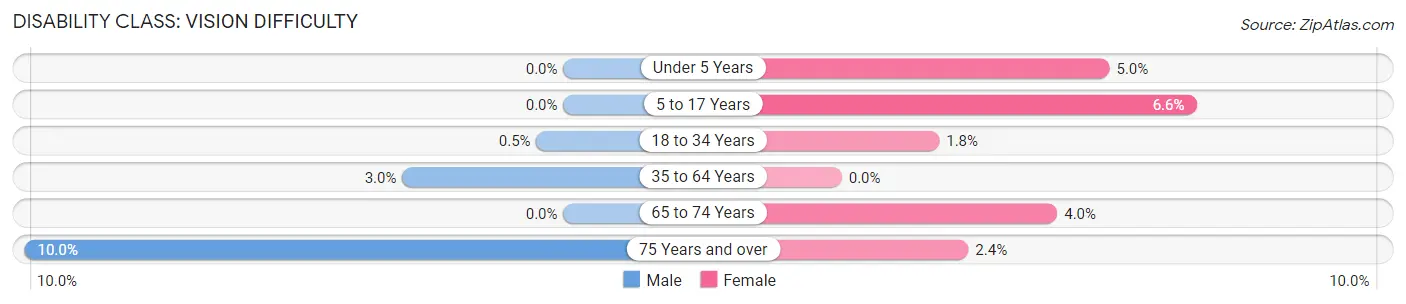
| Age Bracket | Male | Female |
| Under 5 Years | 0 (0.0%) | 18 (5.0%) |
| 5 to 17 Years | 0 (0.0%) | 54 (6.6%) |
| 18 to 34 Years | 5 (0.5%) | 22 (1.8%) |
| 35 to 64 Years | 77 (3.0%) | 0 (0.0%) |
| 65 to 74 Years | 0 (0.0%) | 28 (4.0%) |
| 75 Years and over | 27 (10.0%) | 11 (2.4%) |
Disability Class: Cognitive Difficulty
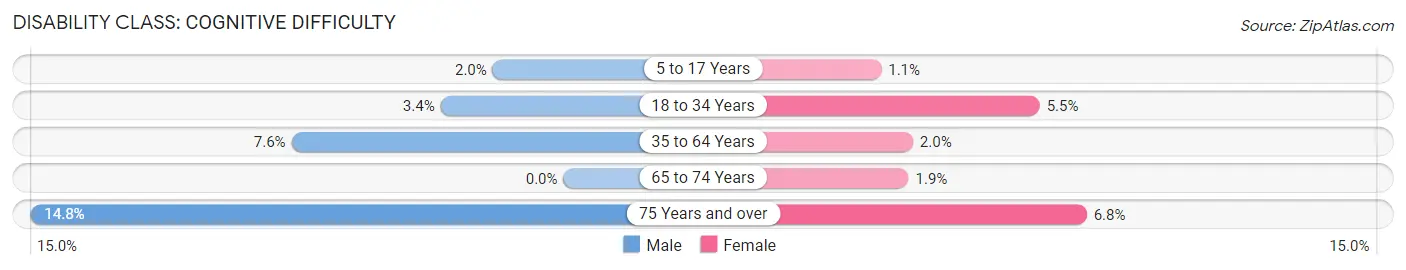
| Age Bracket | Male | Female |
| 5 to 17 Years | 24 (2.0%) | 9 (1.1%) |
| 18 to 34 Years | 34 (3.4%) | 67 (5.5%) |
| 35 to 64 Years | 195 (7.6%) | 53 (2.0%) |
| 65 to 74 Years | 0 (0.0%) | 13 (1.9%) |
| 75 Years and over | 40 (14.8%) | 32 (6.8%) |
Disability Class: Ambulatory Difficulty
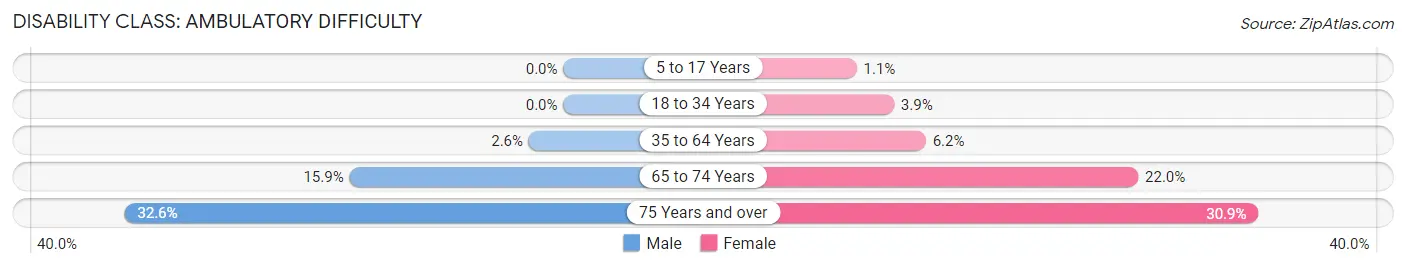
| Age Bracket | Male | Female |
| 5 to 17 Years | 0 (0.0%) | 9 (1.1%) |
| 18 to 34 Years | 0 (0.0%) | 47 (3.9%) |
| 35 to 64 Years | 66 (2.6%) | 167 (6.2%) |
| 65 to 74 Years | 71 (15.9%) | 154 (22.0%) |
| 75 Years and over | 88 (32.6%) | 145 (30.9%) |
Disability Class: Self-Care Difficulty
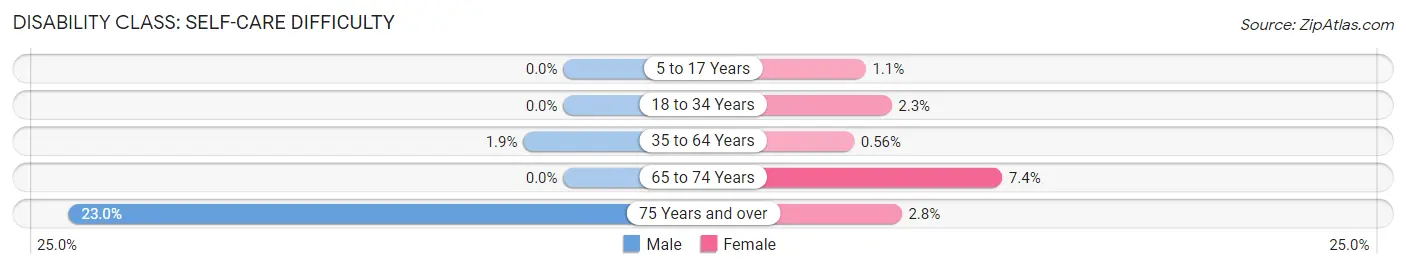
| Age Bracket | Male | Female |
| 5 to 17 Years | 0 (0.0%) | 9 (1.1%) |
| 18 to 34 Years | 0 (0.0%) | 28 (2.3%) |
| 35 to 64 Years | 48 (1.9%) | 15 (0.6%) |
| 65 to 74 Years | 0 (0.0%) | 52 (7.4%) |
| 75 Years and over | 62 (23.0%) | 13 (2.8%) |
Technology Access in New Baltimore
Computing Device Access in New Baltimore
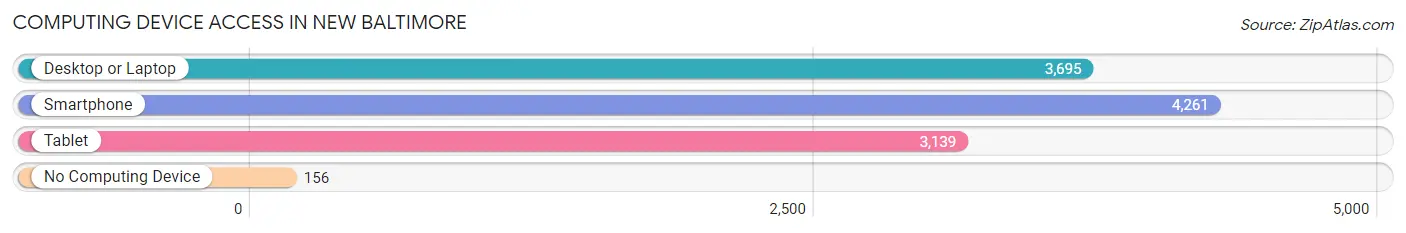
| Device Type | # Households | % Households |
| Desktop or Laptop | 3,695 | 78.8% |
| Smartphone | 4,261 | 90.8% |
| Tablet | 3,139 | 66.9% |
| No Computing Device | 156 | 3.3% |
| Total | 4,691 | 100.0% |
Internet Access in New Baltimore
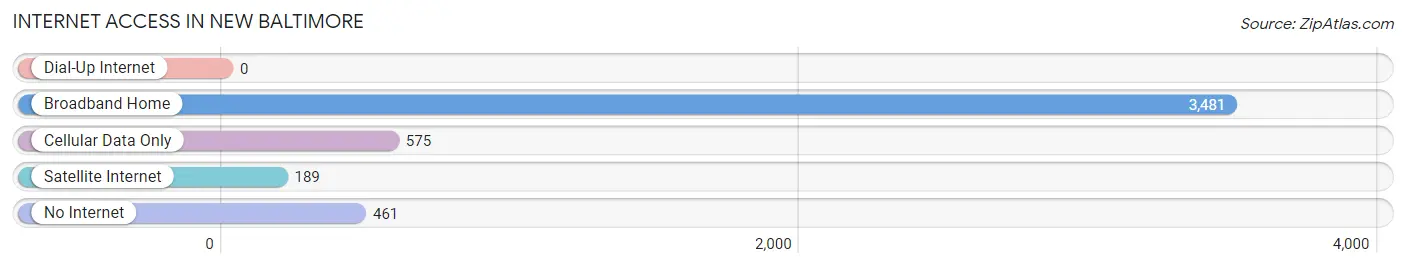
| Internet Type | # Households | % Households |
| Dial-Up Internet | 0 | 0.0% |
| Broadband Home | 3,481 | 74.2% |
| Cellular Data Only | 575 | 12.3% |
| Satellite Internet | 189 | 4.0% |
| No Internet | 461 | 9.8% |
| Total | 4,691 | 100.0% |
New Baltimore Summary
New Baltimore is a city located in Macomb County, Michigan. It is situated along the shores of Lake St. Clair, just north of Detroit. The city has a population of 12,084 as of the 2010 census.
History
The area that is now New Baltimore was first settled in 1818 by a group of French-Canadian immigrants. The settlement was originally known as “Chesterfield”, and was later renamed “New Baltimore” in 1837. The name was chosen to honor the city of Baltimore, Maryland, which was the hometown of many of the settlers.
The city was officially incorporated in 1867, and the first mayor was elected in 1868. The city grew rapidly in the late 19th and early 20th centuries, and by the 1920s it had become a popular summer resort destination.
Geography
New Baltimore is located at 42°41′N 82°51′W (42.68, -82.85). According to the United States Census Bureau, the city has a total area of 4.2 square miles (10.8 km2), of which 4.1 square miles (10.6 km2) is land and 0.1 square miles (0.2 km2) is water.
The city is situated along the shores of Lake St. Clair, and is bordered by the cities of Chesterfield Township to the north, Harrison Township to the east, and Clinton Township to the south.
Economy
The economy of New Baltimore is largely based on manufacturing and retail. The city is home to several large manufacturing companies, including General Motors, Chrysler, and Ford. The city also has a large retail sector, with several shopping centers and malls located in the city.
The city is also home to several small businesses, including restaurants, bars, and other service-oriented businesses.
Demographics
As of the 2010 census, there were 12,084 people, 4,845 households, and 3,092 families residing in the city. The population density was 2,919.3 people per square mile (1,127.2/km2). There were 5,093 housing units at an average density of 1,238.3 per square mile (477.7/km2). The racial makeup of the city was 87.2% White, 8.2% African American, 0.4% Native American, 1.2% Asian, 0.7% from other races, and 2.3% from two or more races. Hispanic or Latino of any race were 2.7% of the population.
There were 4,845 households, out of which 28.3% had children under the age of 18 living with them, 44.2% were married couples living together, 14.3% had a female householder with no husband present, and 36.2% were non-families. 30.2% of all households were made up of individuals, and 10.2% had someone living alone who was 65 years of age or older. The average household size was 2.45 and the average family size was 3.06.
In the city, the population was spread out, with 24.2% under the age of 18, 8.2% from 18 to 24, 30.2% from 25 to 44, 23.2% from 45 to 64, and 14.2% who were 65 years of age or older. The median age was 37 years. For every 100 females, there were 92.2 males. For every 100 females age 18 and over, there were 88.3 males.
The median income for a household in the city was $45,945, and the median income for a family was $54,945. Males had a median income of $41,945 versus $30,945 for females. The per capita income for the city was $22,945. About 6.2% of families and 8.2% of the population were below the poverty line, including 11.2% of those under age 18 and 6.2% of those age 65 or over.
Common Questions
What is Per Capita Income in New Baltimore?
Per Capita income in New Baltimore is $40,391.
What is the Median Family Income in New Baltimore?
Median Family Income in New Baltimore is $112,943.
What is the Median Household income in New Baltimore?
Median Household Income in New Baltimore is $90,028.
What is Income or Wage Gap in New Baltimore?
Income or Wage Gap in New Baltimore is 50.5%.
Women in New Baltimore earn 49.5 cents for every dollar earned by a man.
What is Inequality or Gini Index in New Baltimore?
Inequality or Gini Index in New Baltimore is 0.38.
What is the Total Population of New Baltimore?
Total Population of New Baltimore is 12,104.
What is the Total Male Population of New Baltimore?
Total Male Population of New Baltimore is 5,853.
What is the Total Female Population of New Baltimore?
Total Female Population of New Baltimore is 6,251.
What is the Ratio of Males per 100 Females in New Baltimore?
There are 93.63 Males per 100 Females in New Baltimore.
What is the Ratio of Females per 100 Males in New Baltimore?
There are 106.80 Females per 100 Males in New Baltimore.
What is the Median Population Age in New Baltimore?
Median Population Age in New Baltimore is 41.9 Years.
What is the Average Family Size in New Baltimore
Average Family Size in New Baltimore is 3.1 People.
What is the Average Household Size in New Baltimore
Average Household Size in New Baltimore is 2.6 People.
How Large is the Labor Force in New Baltimore?
There are 6,390 People in the Labor Forcein in New Baltimore.
What is the Percentage of People in the Labor Force in New Baltimore?
65.2% of People are in the Labor Force in New Baltimore.
What is the Unemployment Rate in New Baltimore?
Unemployment Rate in New Baltimore is 4.3%.