Cities with the Highest Percentage of Assyrian / Chaldean / Syriac Population in Michigan
RELATED REPORTS & OPTIONS
Assyrian / Chaldean / Syriac
Michigan
Compare Cities
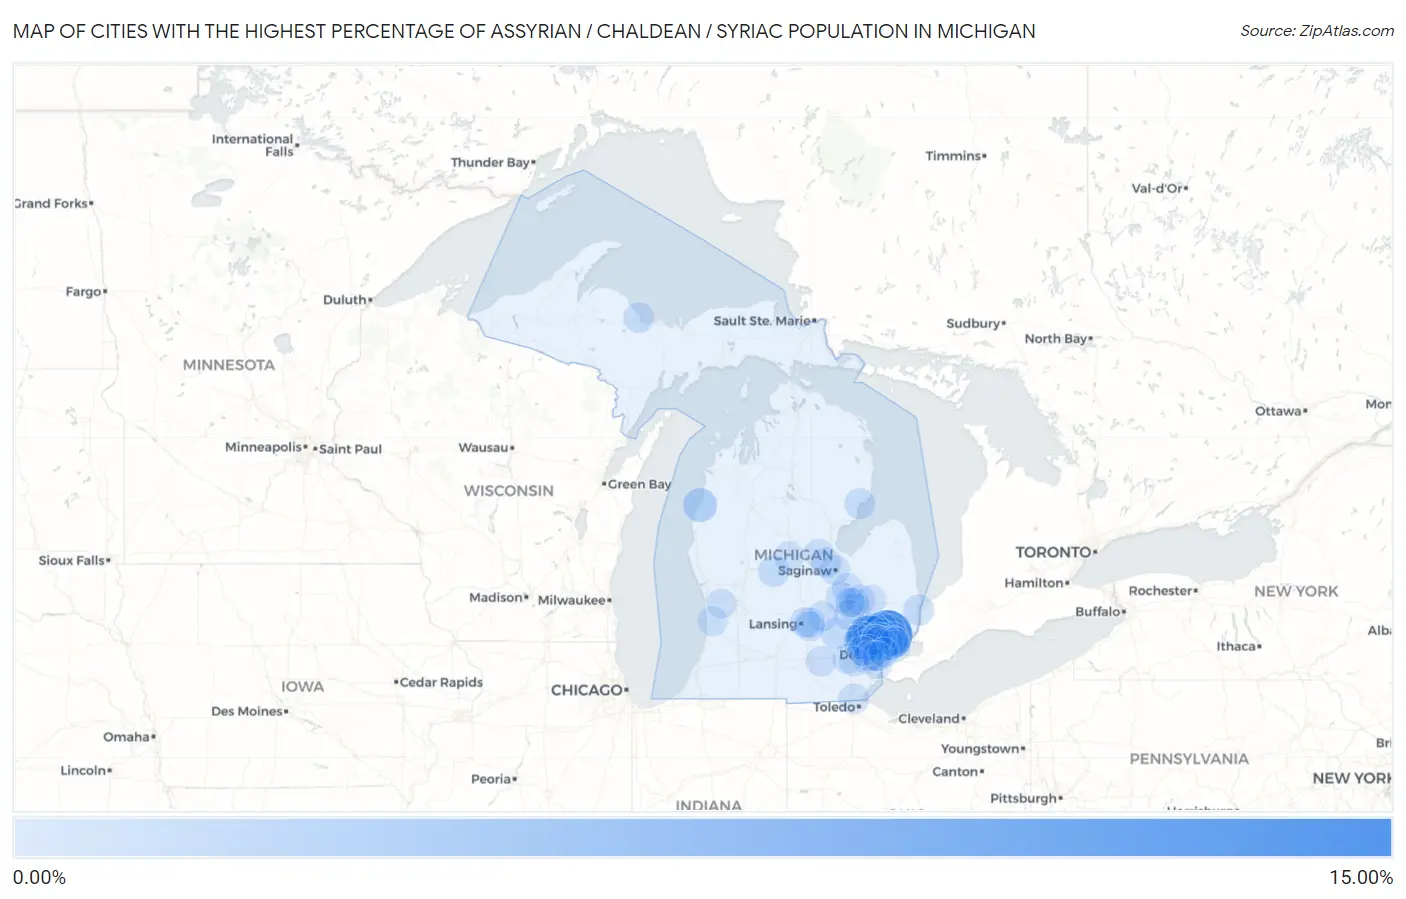
Map of Cities with the Highest Percentage of Assyrian / Chaldean / Syriac Population in Michigan
0.00%
15.00%
Cities with the Highest Percentage of Assyrian / Chaldean / Syriac Population in Michigan
| City | Assyrian / Chaldean / Syriac | vs State | vs National | |
| 1. | Sterling Heights | 11.50% | 0.42%(+11.1)#1 | 0.029%(+11.5)#1 |
| 2. | Orchard Lake Village | 6.32% | 0.42%(+5.90)#2 | 0.029%(+6.29)#4 |
| 3. | Bloomfield Hills | 5.16% | 0.42%(+4.74)#3 | 0.029%(+5.13)#6 |
| 4. | Keego Harbor | 3.79% | 0.42%(+3.37)#4 | 0.029%(+3.76)#13 |
| 5. | Sylvan Lake | 2.49% | 0.42%(+2.07)#5 | 0.029%(+2.46)#19 |
| 6. | Madison Heights | 2.46% | 0.42%(+2.04)#6 | 0.029%(+2.43)#20 |
| 7. | Manistee | 2.19% | 0.42%(+1.77)#7 | 0.029%(+2.16)#21 |
| 8. | Farmington Hills | 2.18% | 0.42%(+1.76)#8 | 0.029%(+2.15)#22 |
| 9. | Walled Lake | 1.89% | 0.42%(+1.47)#9 | 0.029%(+1.86)#23 |
| 10. | Warren | 1.87% | 0.42%(+1.45)#10 | 0.029%(+1.84)#24 |
| 11. | Utica | 1.81% | 0.42%(+1.39)#11 | 0.029%(+1.78)#26 |
| 12. | Fraser | 1.63% | 0.42%(+1.21)#12 | 0.029%(+1.60)#32 |
| 13. | Novi | 1.45% | 0.42%(+1.03)#13 | 0.029%(+1.42)#34 |
| 14. | Rochester Hills | 1.34% | 0.42%(+0.921)#14 | 0.029%(+1.31)#38 |
| 15. | Hazel Park | 1.15% | 0.42%(+0.730)#15 | 0.029%(+1.12)#45 |
| 16. | Troy | 0.82% | 0.42%(+0.401)#16 | 0.029%(+0.790)#55 |
| 17. | Oak Park | 0.71% | 0.42%(+0.287)#17 | 0.029%(+0.676)#59 |
| 18. | Howell | 0.64% | 0.42%(+0.218)#18 | 0.029%(+0.607)#61 |
| 19. | Southfield | 0.62% | 0.42%(+0.203)#19 | 0.029%(+0.592)#63 |
| 20. | Edmore | 0.61% | 0.42%(+0.193)#20 | 0.029%(+0.581)#65 |
| 21. | Grosse Pointe Woods | 0.60% | 0.42%(+0.182)#21 | 0.029%(+0.571)#66 |
| 22. | Wixom | 0.58% | 0.42%(+0.158)#22 | 0.029%(+0.547)#68 |
| 23. | Wolverine Lake | 0.53% | 0.42%(+0.116)#23 | 0.029%(+0.505)#75 |
| 24. | Marysville | 0.51% | 0.42%(+0.093)#24 | 0.029%(+0.482)#80 |
| 25. | Auburn Hills | 0.51% | 0.42%(+0.090)#25 | 0.029%(+0.479)#81 |
| 26. | Clawson | 0.50% | 0.42%(+0.082)#26 | 0.029%(+0.471)#85 |
| 27. | Ferndale | 0.49% | 0.42%(+0.070)#27 | 0.029%(+0.459)#87 |
| 28. | Tawas City | 0.46% | 0.42%(+0.039)#28 | 0.029%(+0.428)#90 |
| 29. | Flushing | 0.46% | 0.42%(+0.037)#29 | 0.029%(+0.426)#91 |
| 30. | Bingham Farms | 0.43% | 0.42%(+0.013)#30 | 0.029%(+0.402)#96 |
| 31. | Farmington | 0.42% | 0.42%(-0.000)#31 | 0.029%(+0.389)#101 |
| 32. | Clio | 0.40% | 0.42%(-0.022)#32 | 0.029%(+0.366)#105 |
| 33. | Lathrup Village | 0.37% | 0.42%(-0.050)#33 | 0.029%(+0.339)#110 |
| 34. | Marquette | 0.33% | 0.42%(-0.084)#34 | 0.029%(+0.305)#117 |
| 35. | Lambertville | 0.28% | 0.42%(-0.134)#35 | 0.029%(+0.255)#124 |
| 36. | Center Line | 0.27% | 0.42%(-0.147)#36 | 0.029%(+0.242)#130 |
| 37. | Birmingham | 0.26% | 0.42%(-0.160)#37 | 0.029%(+0.228)#137 |
| 38. | Royal Oak | 0.26% | 0.42%(-0.161)#38 | 0.029%(+0.228)#139 |
| 39. | Grand Blanc | 0.25% | 0.42%(-0.169)#39 | 0.029%(+0.220)#142 |
| 40. | Grass Lake | 0.25% | 0.42%(-0.173)#40 | 0.029%(+0.216)#144 |
| 41. | Davison | 0.22% | 0.42%(-0.203)#41 | 0.029%(+0.186)#154 |
| 42. | Morrice | 0.18% | 0.42%(-0.238)#42 | 0.029%(+0.151)#168 |
| 43. | Garden City | 0.18% | 0.42%(-0.242)#43 | 0.029%(+0.147)#172 |
| 44. | Wayne | 0.17% | 0.42%(-0.247)#44 | 0.029%(+0.142)#176 |
| 45. | East Lansing | 0.17% | 0.42%(-0.248)#45 | 0.029%(+0.140)#178 |
| 46. | Freeland | 0.16% | 0.42%(-0.255)#46 | 0.029%(+0.134)#180 |
| 47. | Lake Fenton | 0.16% | 0.42%(-0.260)#47 | 0.029%(+0.129)#183 |
| 48. | Roseville | 0.12% | 0.42%(-0.296)#48 | 0.029%(+0.093)#221 |
| 49. | Southgate | 0.10% | 0.42%(-0.315)#49 | 0.029%(+0.074)#241 |
| 50. | Burton | 0.095% | 0.42%(-0.323)#50 | 0.029%(+0.066)#251 |
| 51. | Haslett | 0.089% | 0.42%(-0.329)#51 | 0.029%(+0.060)#260 |
| 52. | Beverly Hills | 0.085% | 0.42%(-0.333)#52 | 0.029%(+0.056)#265 |
| 53. | Westland | 0.077% | 0.42%(-0.341)#53 | 0.029%(+0.048)#283 |
| 54. | Mount Pleasant | 0.073% | 0.42%(-0.345)#54 | 0.029%(+0.044)#288 |
| 55. | Ann Arbor | 0.072% | 0.42%(-0.346)#55 | 0.029%(+0.043)#292 |
| 56. | Livonia | 0.072% | 0.42%(-0.346)#56 | 0.029%(+0.043)#293 |
| 57. | Ypsilanti | 0.069% | 0.42%(-0.349)#57 | 0.029%(+0.040)#298 |
| 58. | Lapeer | 0.066% | 0.42%(-0.352)#58 | 0.029%(+0.037)#301 |
| 59. | Dearborn Heights | 0.058% | 0.42%(-0.360)#59 | 0.029%(+0.029)#315 |
| 60. | Okemos | 0.047% | 0.42%(-0.371)#60 | 0.029%(+0.018)#349 |
| 61. | Plymouth | 0.043% | 0.42%(-0.375)#61 | 0.029%(+0.014)#358 |
| 62. | St Clair Shores | 0.031% | 0.42%(-0.387)#62 | 0.029%(+0.002)#398 |
| 63. | Holland | 0.029% | 0.42%(-0.389)#63 | 0.029%(+0.000)#403 |
| 64. | Saginaw | 0.025% | 0.42%(-0.393)#64 | 0.029%(-0.004)#422 |
| 65. | Dearborn | 0.023% | 0.42%(-0.395)#65 | 0.029%(-0.006)#433 |
| 66. | Allendale | 0.020% | 0.42%(-0.398)#66 | 0.029%(-0.009)#460 |
| 67. | Flint | 0.0098% | 0.42%(-0.408)#67 | 0.029%(-0.019)#534 |
| 68. | Midland | 0.0094% | 0.42%(-0.409)#68 | 0.029%(-0.020)#538 |
| 69. | Detroit | 0.0088% | 0.42%(-0.409)#69 | 0.029%(-0.020)#543 |
Common Questions
What are the Top 10 Cities with the Highest Percentage of Assyrian / Chaldean / Syriac Population in Michigan?
Top 10 Cities with the Highest Percentage of Assyrian / Chaldean / Syriac Population in Michigan are:
#1
11.50%
#2
6.32%
#3
5.16%
#4
3.79%
#5
2.49%
#6
2.46%
#7
2.19%
#8
2.18%
#9
1.89%
#10
1.87%
What city has the Highest Percentage of Assyrian / Chaldean / Syriac Population in Michigan?
Sterling Heights has the Highest Percentage of Assyrian / Chaldean / Syriac Population in Michigan with 11.50%.
What is the Percentage of Assyrian / Chaldean / Syriac Population in the State of Michigan?
Percentage of Assyrian / Chaldean / Syriac Population in Michigan is 0.42%.
What is the Percentage of Assyrian / Chaldean / Syriac Population in the United States?
Percentage of Assyrian / Chaldean / Syriac Population in the United States is 0.029%.