St Joseph, MI Map & Demographics
St Joseph Map
St Joseph Overview
$55,047
PER CAPITA INCOME
$122,321
AVG FAMILY INCOME
$79,103
AVG HOUSEHOLD INCOME
43.6%
WAGE / INCOME GAP [ % ]
56.4¢/ $1
WAGE / INCOME GAP [ $ ]
0.46
INEQUALITY / GINI INDEX
7,852
TOTAL POPULATION
3,917
MALE POPULATION
3,935
FEMALE POPULATION
99.54
MALES / 100 FEMALES
100.46
FEMALES / 100 MALES
45.1
MEDIAN AGE
2.7
AVG FAMILY SIZE
1.9
AVG HOUSEHOLD SIZE
4,203
LABOR FORCE [ PEOPLE ]
61.6%
PERCENT IN LABOR FORCE
1.4%
UNEMPLOYMENT RATE
Income in St Joseph
Income Overview in St Joseph
Per Capita Income in St Joseph is $55,047, while median incomes of families and households are $122,321 and $79,103 respectively.
| Characteristic | Number | Measure |
| Per Capita Income | 7,852 | $55,047 |
| Median Family Income | 1,864 | $122,321 |
| Mean Family Income | 1,864 | $148,085 |
| Median Household Income | 3,994 | $79,103 |
| Mean Household Income | 3,994 | $106,540 |
| Income Deficit | 1,864 | $0 |
| Wage / Income Gap (%) | 7,852 | 43.62% |
| Wage / Income Gap ($) | 7,852 | 56.38¢ per $1 |
| Gini / Inequality Index | 7,852 | 0.46 |
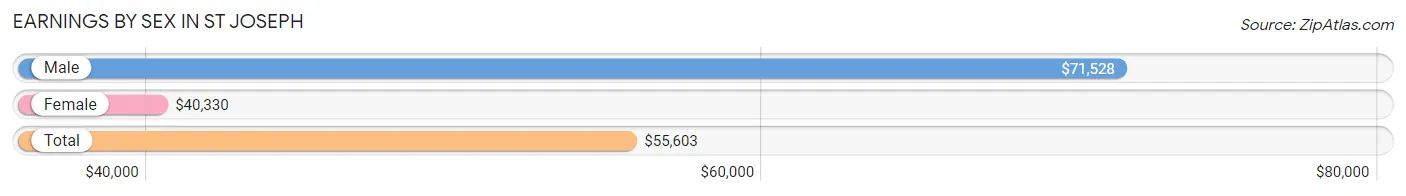
Earnings by Sex in St Joseph
Average Earnings in St Joseph are $55,603, $71,528 for men and $40,330 for women, a difference of 43.6%.
| Sex | Number | Average Earnings |
| Male | 2,439 (54.2%) | $71,528 |
| Female | 2,061 (45.8%) | $40,330 |
| Total | 4,500 (100.0%) | $55,603 |
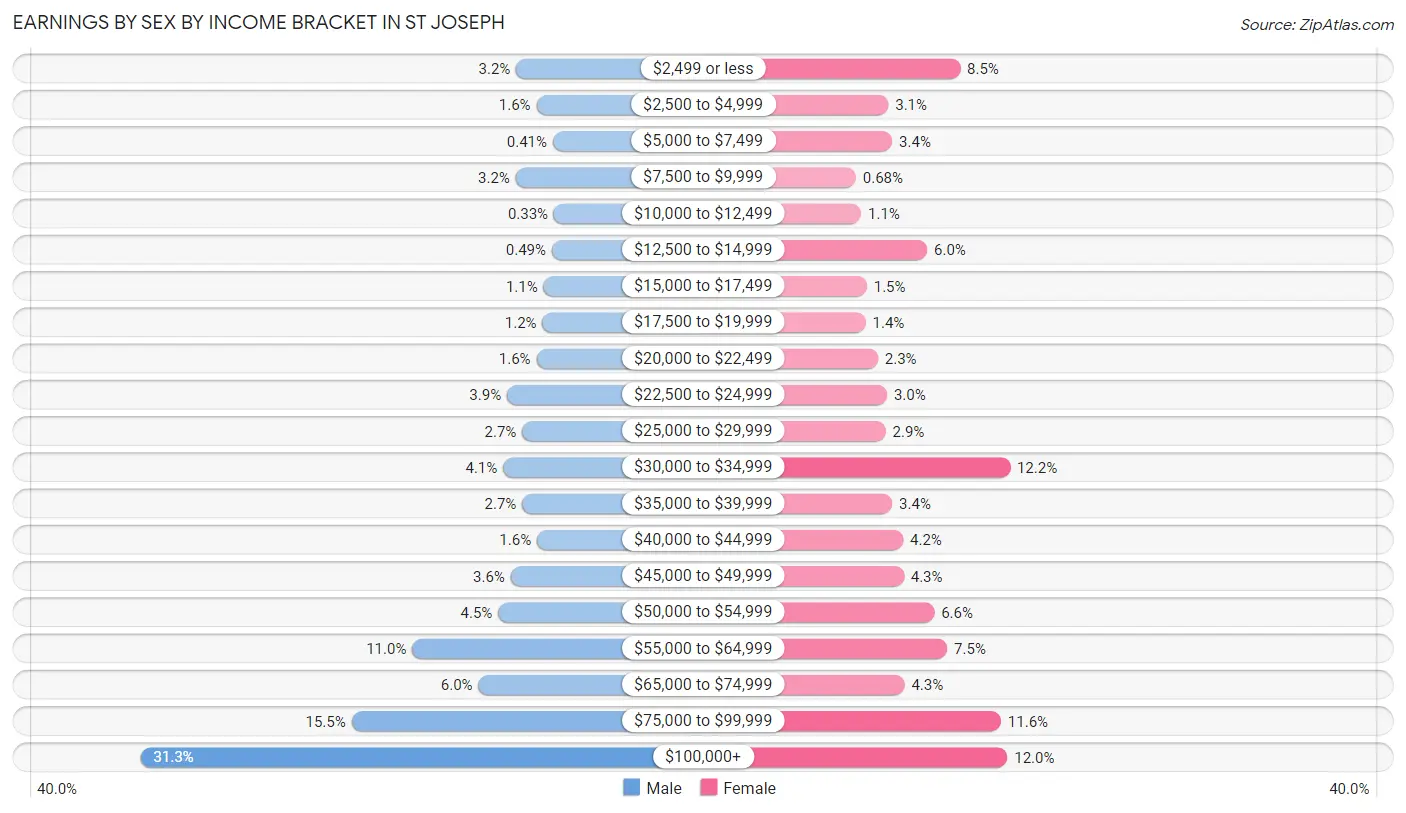
Earnings by Sex by Income Bracket in St Joseph
The most common earnings brackets in St Joseph are $100,000+ for men (764 | 31.3%) and $30,000 to $34,999 for women (252 | 12.2%).
| Income | Male | Female |
| $2,499 or less | 77 (3.2%) | 175 (8.5%) |
| $2,500 to $4,999 | 40 (1.6%) | 64 (3.1%) |
| $5,000 to $7,499 | 10 (0.4%) | 70 (3.4%) |
| $7,500 to $9,999 | 78 (3.2%) | 14 (0.7%) |
| $10,000 to $12,499 | 8 (0.3%) | 22 (1.1%) |
| $12,500 to $14,999 | 12 (0.5%) | 124 (6.0%) |
| $15,000 to $17,499 | 27 (1.1%) | 31 (1.5%) |
| $17,500 to $19,999 | 29 (1.2%) | 29 (1.4%) |
| $20,000 to $22,499 | 40 (1.6%) | 48 (2.3%) |
| $22,500 to $24,999 | 94 (3.8%) | 62 (3.0%) |
| $25,000 to $29,999 | 66 (2.7%) | 60 (2.9%) |
| $30,000 to $34,999 | 101 (4.1%) | 252 (12.2%) |
| $35,000 to $39,999 | 66 (2.7%) | 70 (3.4%) |
| $40,000 to $44,999 | 39 (1.6%) | 87 (4.2%) |
| $45,000 to $49,999 | 87 (3.6%) | 88 (4.3%) |
| $50,000 to $54,999 | 110 (4.5%) | 135 (6.6%) |
| $55,000 to $64,999 | 267 (11.0%) | 155 (7.5%) |
| $65,000 to $74,999 | 146 (6.0%) | 89 (4.3%) |
| $75,000 to $99,999 | 378 (15.5%) | 238 (11.6%) |
| $100,000+ | 764 (31.3%) | 248 (12.0%) |
| Total | 2,439 (100.0%) | 2,061 (100.0%) |
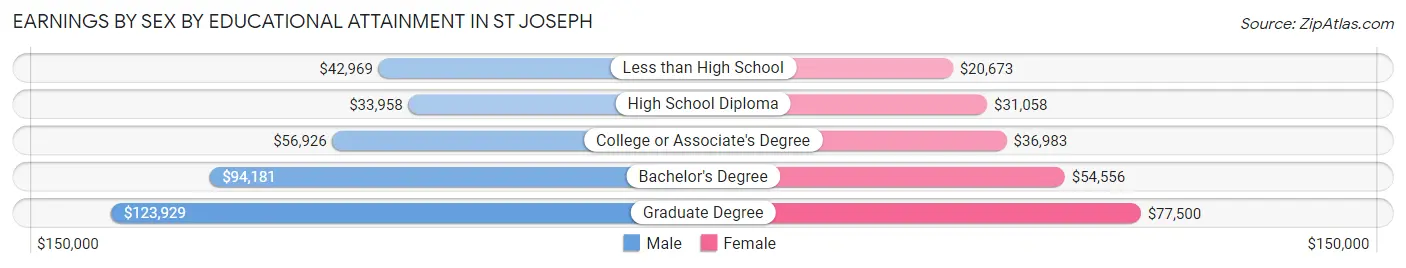
Earnings by Sex by Educational Attainment in St Joseph
Average earnings in St Joseph are $74,291 for men and $49,107 for women, a difference of 33.9%. Men with an educational attainment of graduate degree enjoy the highest average annual earnings of $123,929, while those with high school diploma education earn the least with $33,958. Women with an educational attainment of graduate degree earn the most with the average annual earnings of $77,500, while those with less than high school education have the smallest earnings of $20,673.
| Educational Attainment | Male Income | Female Income |
| Less than High School | $42,969 | $20,673 |
| High School Diploma | $33,958 | $31,058 |
| College or Associate's Degree | $56,926 | $36,983 |
| Bachelor's Degree | $94,181 | $54,556 |
| Graduate Degree | $123,929 | $77,500 |
| Total | $74,291 | $49,107 |
Family Income in St Joseph
Family Income Brackets in St Joseph
According to the St Joseph family income data, there are 501 families falling into the $100,000 to $149,999 income range, which is the most common income bracket and makes up 26.9% of all families. Conversely, the $10,000 to $14,999 income bracket is the least frequent group with only 7 families (0.4%) belonging to this category.
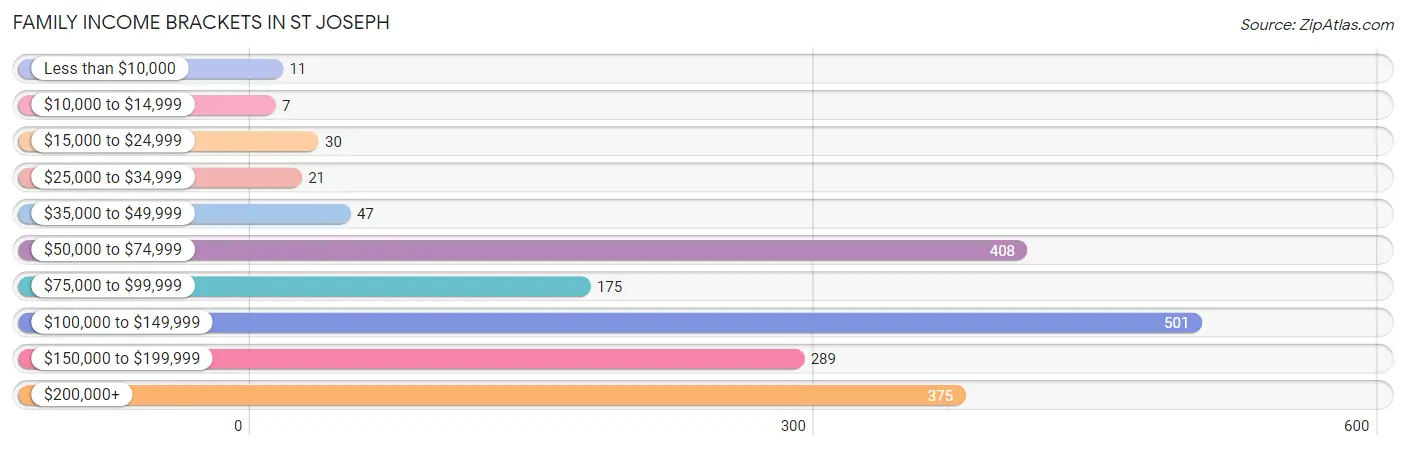
| Income Bracket | # Families | % Families |
| Less than $10,000 | 11 | 0.6% |
| $10,000 to $14,999 | 7 | 0.4% |
| $15,000 to $24,999 | 30 | 1.6% |
| $25,000 to $34,999 | 21 | 1.1% |
| $35,000 to $49,999 | 47 | 2.5% |
| $50,000 to $74,999 | 408 | 21.9% |
| $75,000 to $99,999 | 175 | 9.4% |
| $100,000 to $149,999 | 501 | 26.9% |
| $150,000 to $199,999 | 289 | 15.5% |
| $200,000+ | 375 | 20.1% |
Family Income by Famaliy Size in St Joseph
5-person families (35 | 1.9%) account for the highest median family income in St Joseph with $173,355 per family, while 2-person families (1,101 | 59.1%) have the highest median income of $52,580 per family member.
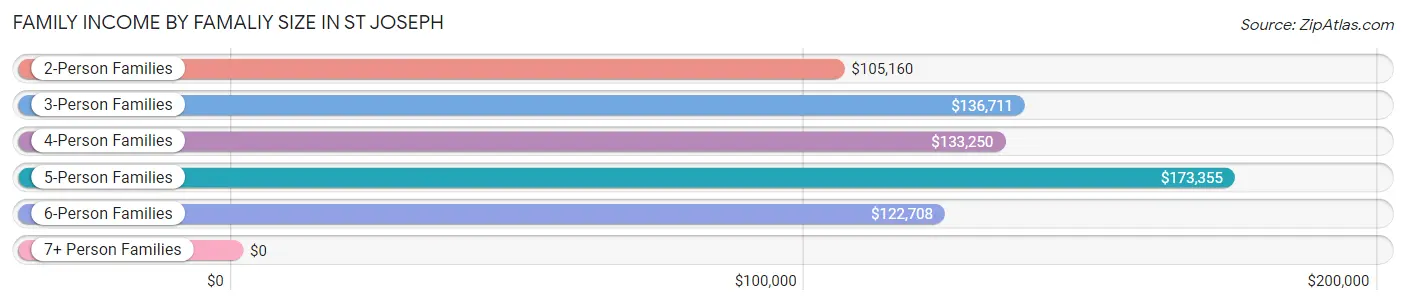
| Income Bracket | # Families | Median Income |
| 2-Person Families | 1,101 (59.1%) | $105,160 |
| 3-Person Families | 366 (19.6%) | $136,711 |
| 4-Person Families | 266 (14.3%) | $133,250 |
| 5-Person Families | 35 (1.9%) | $173,355 |
| 6-Person Families | 69 (3.7%) | $122,708 |
| 7+ Person Families | 27 (1.5%) | $0 |
| Total | 1,864 (100.0%) | $122,321 |
Family Income by Number of Earners in St Joseph
The median family income in St Joseph is $122,321, with families comprising 3+ earners (64) having the highest median family income of $198,889, while families with no earners (370) have the lowest median family income of $81,523, accounting for 3.4% and 19.9% of families, respectively.
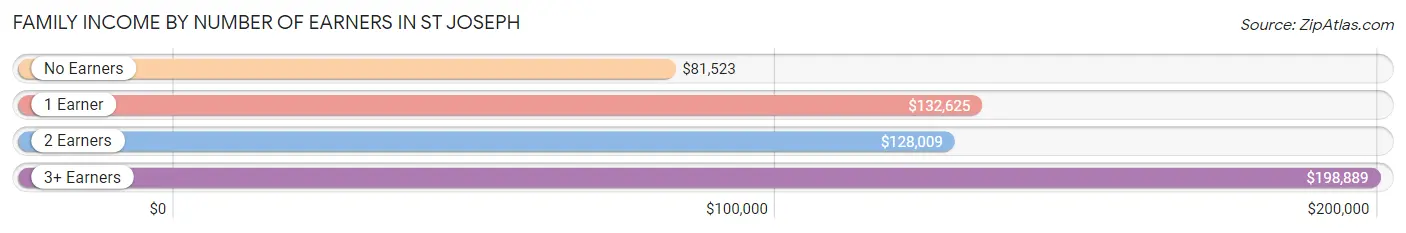
| Number of Earners | # Families | Median Income |
| No Earners | 370 (19.9%) | $81,523 |
| 1 Earner | 489 (26.2%) | $132,625 |
| 2 Earners | 941 (50.5%) | $128,009 |
| 3+ Earners | 64 (3.4%) | $198,889 |
| Total | 1,864 (100.0%) | $122,321 |
Household Income in St Joseph
Household Income Brackets in St Joseph
With 771 households falling in the category, the $100,000 to $149,999 income range is the most frequent in St Joseph, accounting for 19.3% of all households. In contrast, only 136 households (3.4%) fall into the $10,000 to $14,999 income bracket, making it the least populous group.
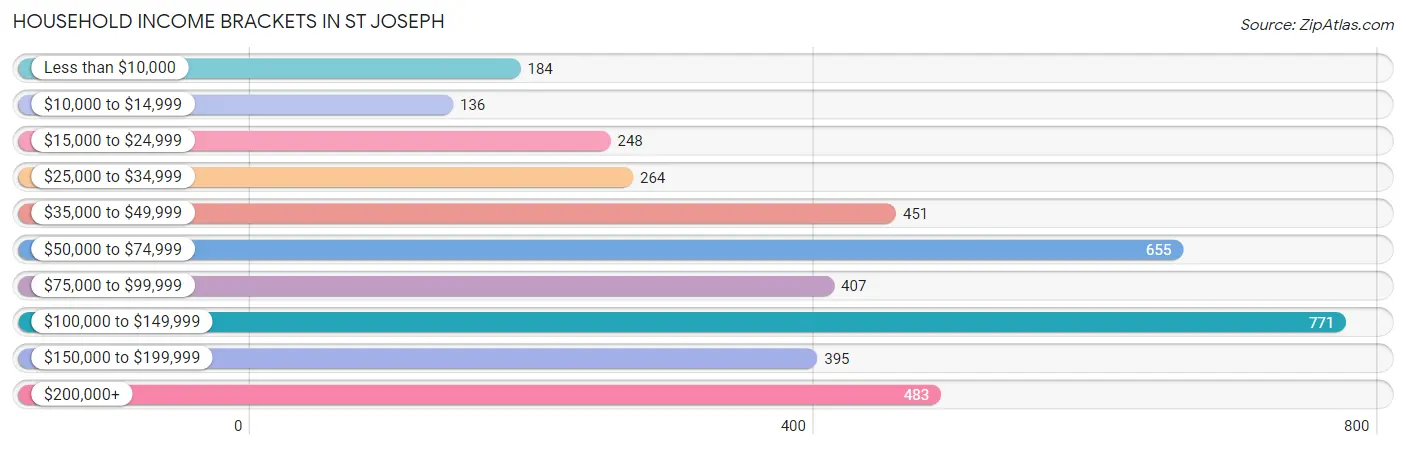
| Income Bracket | # Households | % Households |
| Less than $10,000 | 184 | 4.6% |
| $10,000 to $14,999 | 136 | 3.4% |
| $15,000 to $24,999 | 248 | 6.2% |
| $25,000 to $34,999 | 264 | 6.6% |
| $35,000 to $49,999 | 451 | 11.3% |
| $50,000 to $74,999 | 655 | 16.4% |
| $75,000 to $99,999 | 407 | 10.2% |
| $100,000 to $149,999 | 771 | 19.3% |
| $150,000 to $199,999 | 395 | 9.9% |
| $200,000+ | 483 | 12.1% |
Household Income by Householder Age in St Joseph
The median household income in St Joseph is $79,103, with the highest median household income of $113,639 found in the 25 to 44 years age bracket for the primary householder. A total of 1,161 households (29.1%) fall into this category. Meanwhile, the 15 to 24 years age bracket for the primary householder has the lowest median household income of $34,520, with 301 households (7.5%) in this group.
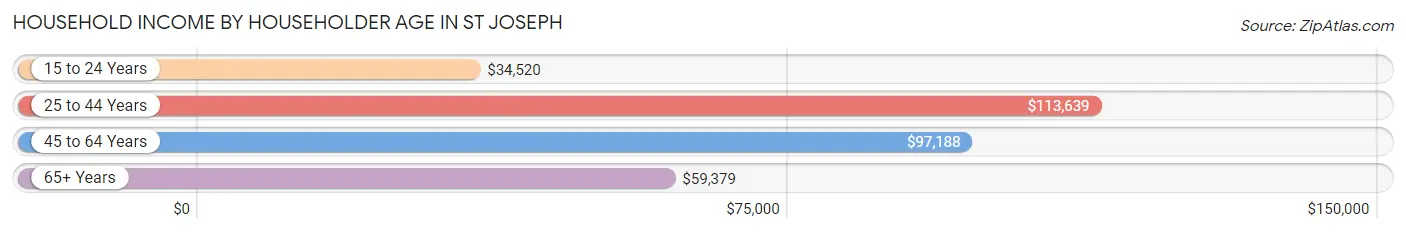
| Income Bracket | # Households | Median Income |
| 15 to 24 Years | 301 (7.5%) | $34,520 |
| 25 to 44 Years | 1,161 (29.1%) | $113,639 |
| 45 to 64 Years | 1,383 (34.6%) | $97,188 |
| 65+ Years | 1,149 (28.8%) | $59,379 |
| Total | 3,994 (100.0%) | $79,103 |
Poverty in St Joseph
Income Below Poverty by Sex and Age in St Joseph
With 4.6% poverty level for males and 6.8% for females among the residents of St Joseph, 35 to 44 year old males and 18 to 24 year old females are the most vulnerable to poverty, with 49 males (10.9%) and 118 females (28.5%) in their respective age groups living below the poverty level.
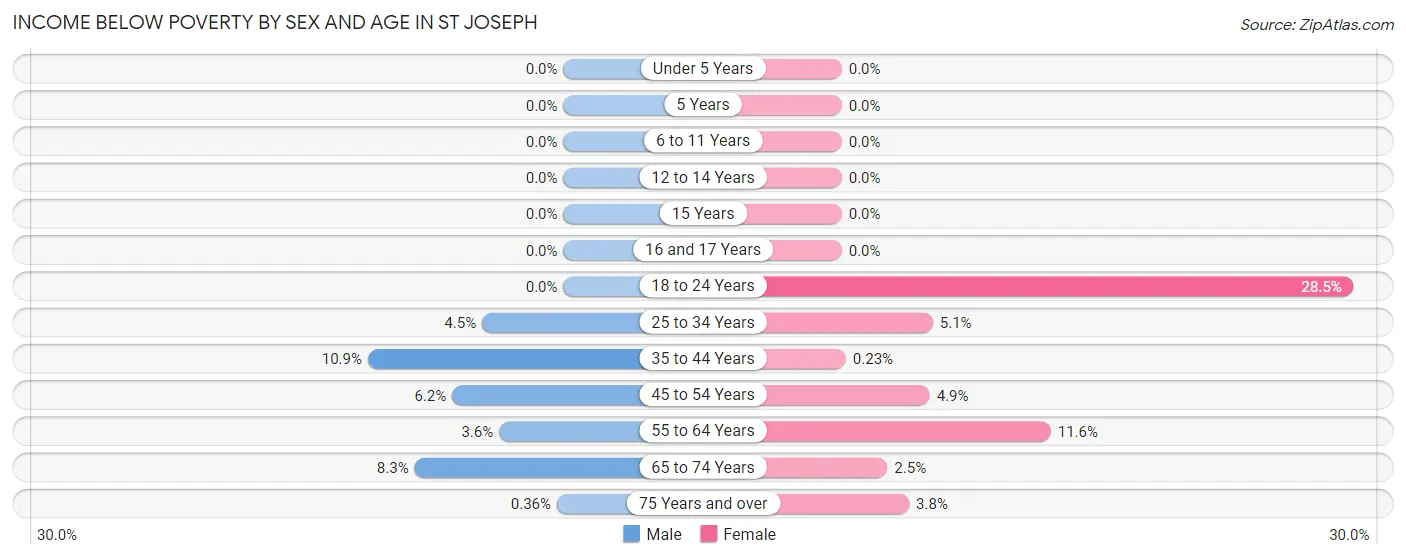
| Age Bracket | Male | Female |
| Under 5 Years | 0 (0.0%) | 0 (0.0%) |
| 5 Years | 0 (0.0%) | 0 (0.0%) |
| 6 to 11 Years | 0 (0.0%) | 0 (0.0%) |
| 12 to 14 Years | 0 (0.0%) | 0 (0.0%) |
| 15 Years | 0 (0.0%) | 0 (0.0%) |
| 16 and 17 Years | 0 (0.0%) | 0 (0.0%) |
| 18 to 24 Years | 0 (0.0%) | 118 (28.5%) |
| 25 to 34 Years | 27 (4.5%) | 23 (5.1%) |
| 35 to 44 Years | 49 (10.9%) | 1 (0.2%) |
| 45 to 54 Years | 30 (6.2%) | 23 (4.9%) |
| 55 to 64 Years | 19 (3.6%) | 66 (11.6%) |
| 65 to 74 Years | 43 (8.3%) | 12 (2.5%) |
| 75 Years and over | 1 (0.4%) | 17 (3.7%) |
| Total | 169 (4.6%) | 260 (6.8%) |
Income Above Poverty by Sex and Age in St Joseph
According to the poverty statistics in St Joseph, males aged under 5 years and females aged under 5 years are the age groups that are most secure financially, with 100.0% of males and 100.0% of females in these age groups living above the poverty line.
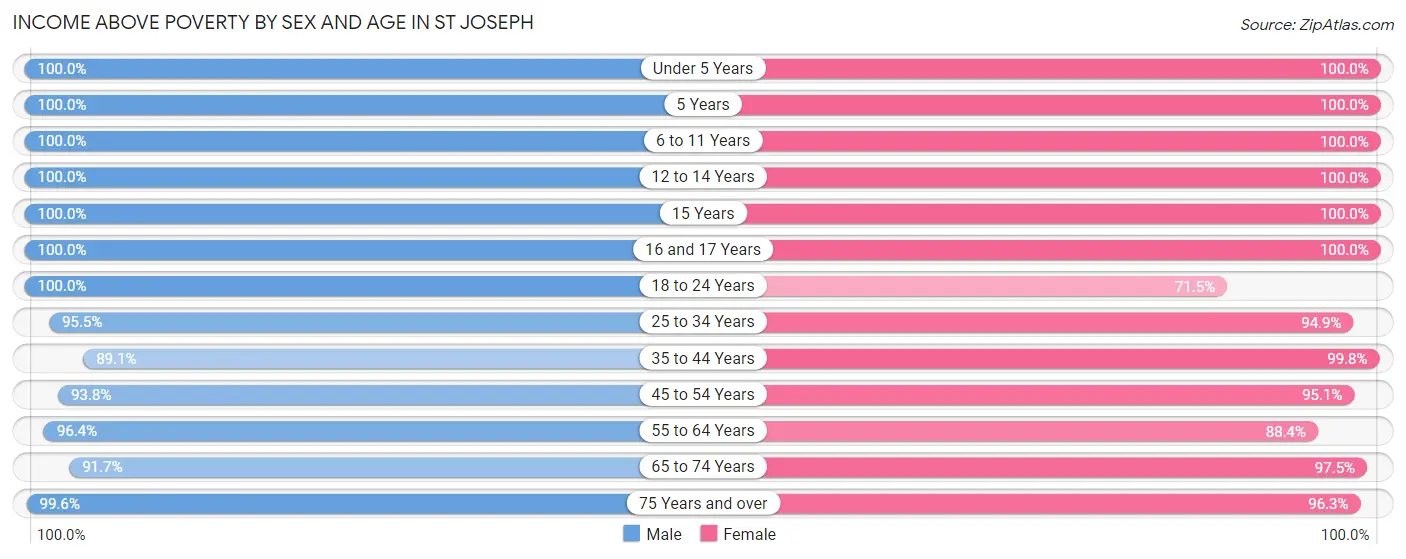
| Age Bracket | Male | Female |
| Under 5 Years | 112 (100.0%) | 183 (100.0%) |
| 5 Years | 95 (100.0%) | 69 (100.0%) |
| 6 to 11 Years | 173 (100.0%) | 125 (100.0%) |
| 12 to 14 Years | 86 (100.0%) | 134 (100.0%) |
| 15 Years | 18 (100.0%) | 29 (100.0%) |
| 16 and 17 Years | 73 (100.0%) | 19 (100.0%) |
| 18 to 24 Years | 213 (100.0%) | 296 (71.5%) |
| 25 to 34 Years | 569 (95.5%) | 431 (94.9%) |
| 35 to 44 Years | 401 (89.1%) | 435 (99.8%) |
| 45 to 54 Years | 454 (93.8%) | 446 (95.1%) |
| 55 to 64 Years | 512 (96.4%) | 501 (88.4%) |
| 65 to 74 Years | 476 (91.7%) | 461 (97.5%) |
| 75 Years and over | 280 (99.6%) | 436 (96.3%) |
| Total | 3,462 (95.4%) | 3,565 (93.2%) |
Income Below Poverty Among Married-Couple Families in St Joseph
The poverty statistics for married-couple families in St Joseph show that 1.2% or 19 of the total 1,571 families live below the poverty line. Families with no children have the highest poverty rate of 1.9%, comprising of 19 families. On the other hand, families with 1 or 2 children have the lowest poverty rate of 0.0%, which includes 0 families.
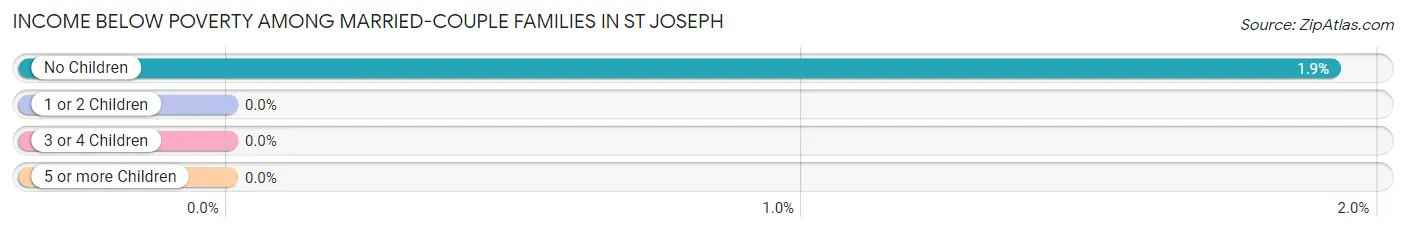
| Children | Above Poverty | Below Poverty |
| No Children | 970 (98.1%) | 19 (1.9%) |
| 1 or 2 Children | 451 (100.0%) | 0 (0.0%) |
| 3 or 4 Children | 104 (100.0%) | 0 (0.0%) |
| 5 or more Children | 27 (100.0%) | 0 (0.0%) |
| Total | 1,552 (98.8%) | 19 (1.2%) |
Income Below Poverty Among Single-Parent Households in St Joseph
| Children | Single Father | Single Mother |
| No Children | 0 (0.0%) | 0 (0.0%) |
| 1 or 2 Children | 0 (0.0%) | 0 (0.0%) |
| 3 or 4 Children | 0 (0.0%) | 0 (0.0%) |
| 5 or more Children | 0 (0.0%) | 0 (0.0%) |
| Total | 0 (0.0%) | 0 (0.0%) |
Income Below Poverty Among Married-Couple vs Single-Parent Households in St Joseph
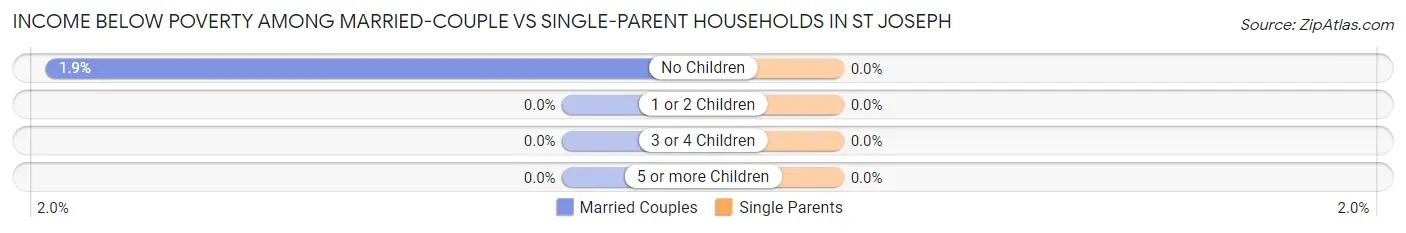
| Children | Married-Couple Families | Single-Parent Households |
| No Children | 19 (1.9%) | 0 (0.0%) |
| 1 or 2 Children | 0 (0.0%) | 0 (0.0%) |
| 3 or 4 Children | 0 (0.0%) | 0 (0.0%) |
| 5 or more Children | 0 (0.0%) | 0 (0.0%) |
| Total | 19 (1.2%) | 0 (0.0%) |
Race in St Joseph
The most populous races in St Joseph are White / Caucasian (6,622 | 84.3%), Two or more Races (354 | 4.5%), and Asian (342 | 4.4%).
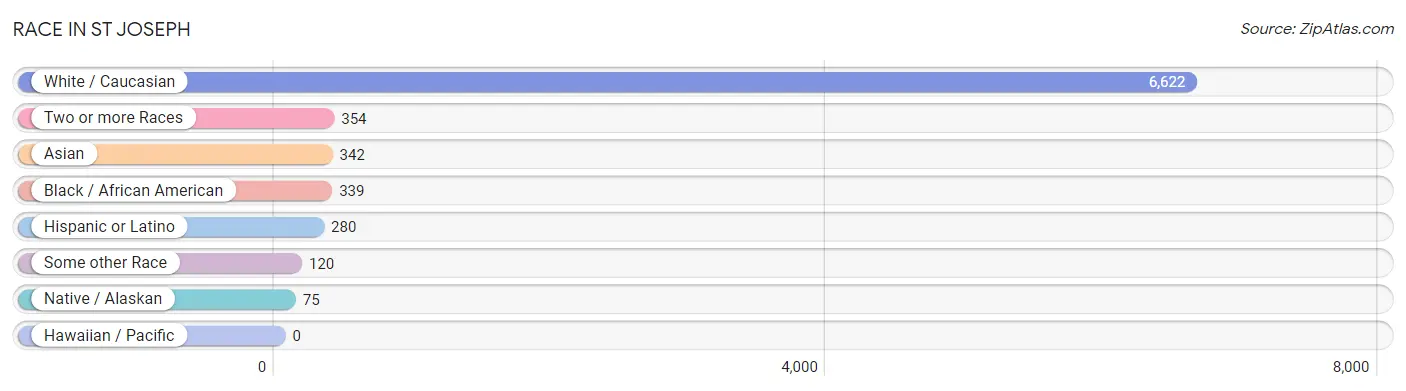
| Race | # Population | % Population |
| Asian | 342 | 4.4% |
| Black / African American | 339 | 4.3% |
| Hawaiian / Pacific | 0 | 0.0% |
| Hispanic or Latino | 280 | 3.6% |
| Native / Alaskan | 75 | 1.0% |
| White / Caucasian | 6,622 | 84.3% |
| Two or more Races | 354 | 4.5% |
| Some other Race | 120 | 1.5% |
| Total | 7,852 | 100.0% |
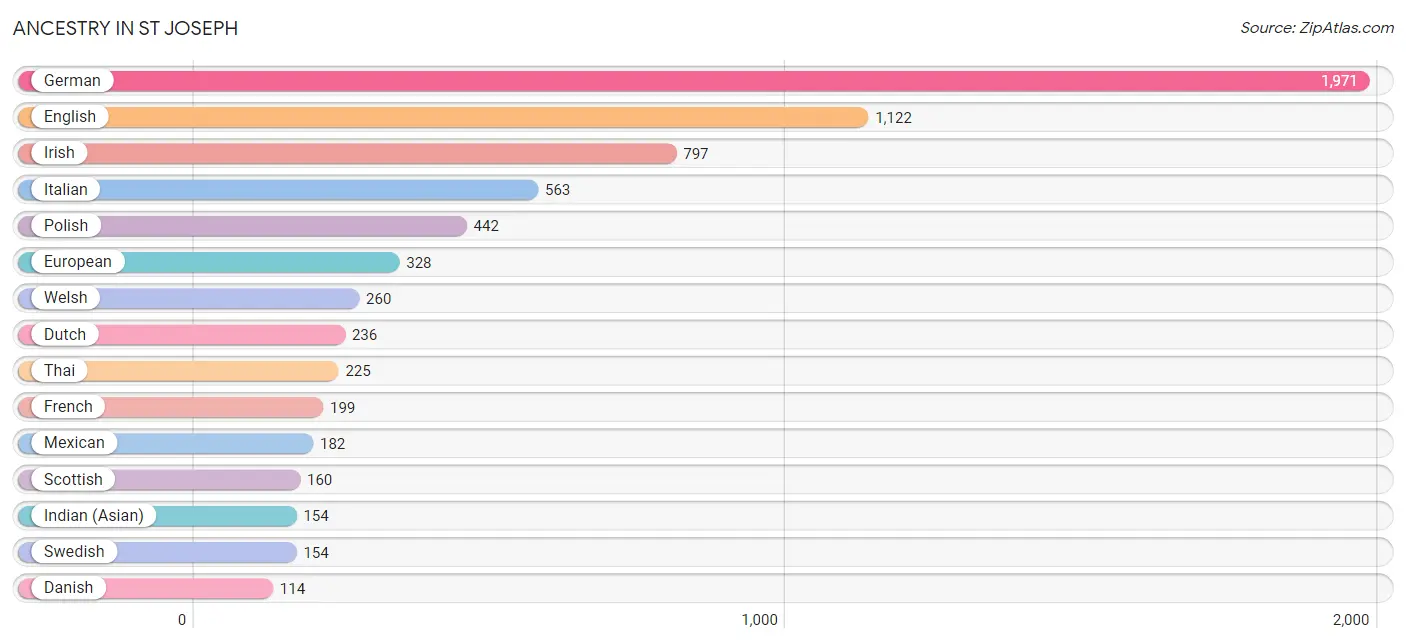
Ancestry in St Joseph
The most populous ancestries reported in St Joseph are German (1,971 | 25.1%), English (1,122 | 14.3%), Irish (797 | 10.2%), Italian (563 | 7.2%), and Polish (442 | 5.6%), together accounting for 62.3% of all St Joseph residents.
| Ancestry | # Population | % Population |
| African | 15 | 0.2% |
| American | 104 | 1.3% |
| Argentinean | 17 | 0.2% |
| Belgian | 7 | 0.1% |
| Belizean | 13 | 0.2% |
| Brazilian | 33 | 0.4% |
| British | 34 | 0.4% |
| Burmese | 60 | 0.8% |
| Canadian | 21 | 0.3% |
| Central American Indian | 13 | 0.2% |
| Cherokee | 15 | 0.2% |
| Chippewa | 75 | 1.0% |
| Colombian | 1 | 0.0% |
| Croatian | 6 | 0.1% |
| Cuban | 72 | 0.9% |
| Czech | 87 | 1.1% |
| Danish | 114 | 1.5% |
| Dutch | 236 | 3.0% |
| Eastern European | 10 | 0.1% |
| English | 1,122 | 14.3% |
| European | 328 | 4.2% |
| Finnish | 23 | 0.3% |
| French | 199 | 2.5% |
| French Canadian | 72 | 0.9% |
| German | 1,971 | 25.1% |
| Greek | 45 | 0.6% |
| Hungarian | 12 | 0.2% |
| Indian (Asian) | 154 | 2.0% |
| Irish | 797 | 10.2% |
| Italian | 563 | 7.2% |
| Japanese | 1 | 0.0% |
| Korean | 24 | 0.3% |
| Latvian | 7 | 0.1% |
| Lithuanian | 66 | 0.8% |
| Luxembourger | 14 | 0.2% |
| Mexican | 182 | 2.3% |
| Norwegian | 87 | 1.1% |
| Peruvian | 8 | 0.1% |
| Polish | 442 | 5.6% |
| Potawatomi | 3 | 0.0% |
| Romanian | 31 | 0.4% |
| Russian | 34 | 0.4% |
| Scandinavian | 7 | 0.1% |
| Scotch-Irish | 34 | 0.4% |
| Scottish | 160 | 2.0% |
| Serbian | 5 | 0.1% |
| Slovak | 12 | 0.2% |
| South American | 26 | 0.3% |
| Subsaharan African | 15 | 0.2% |
| Swedish | 154 | 2.0% |
| Swiss | 29 | 0.4% |
| Thai | 225 | 2.9% |
| Ukrainian | 25 | 0.3% |
| Welsh | 260 | 3.3% |
| Yugoslavian | 12 | 0.2% | View All 55 Rows |
Immigrants in St Joseph
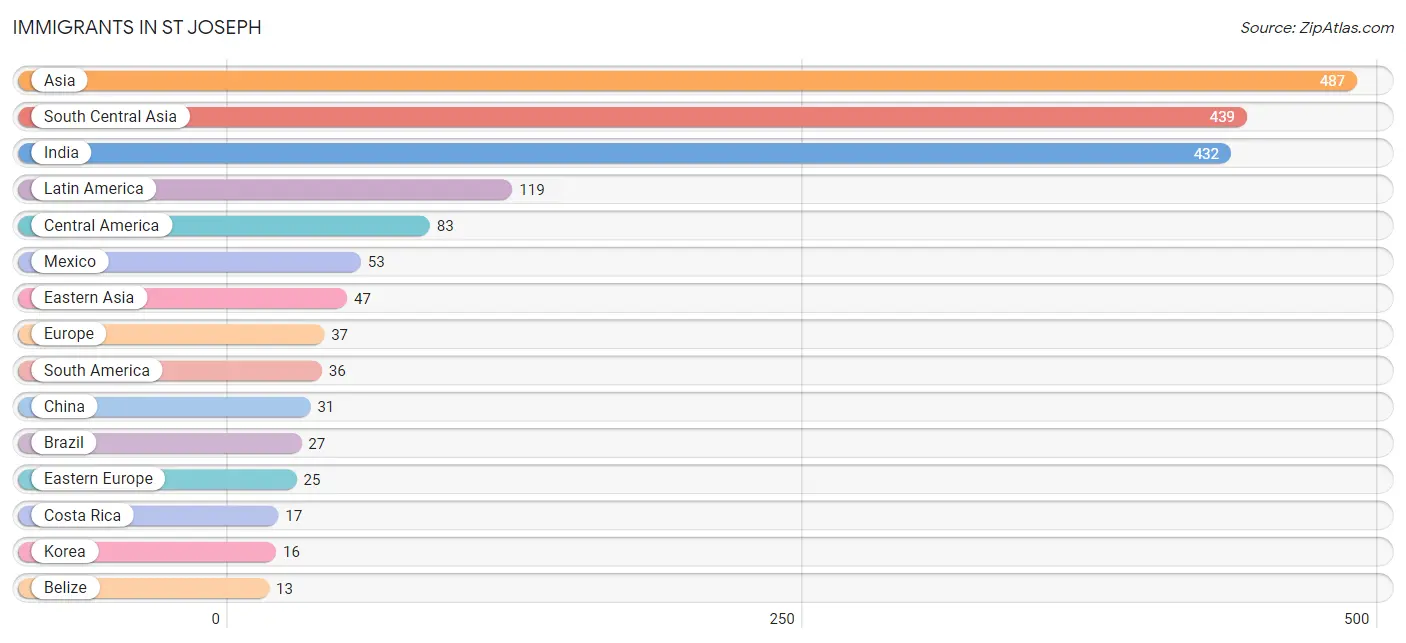
The most numerous immigrant groups reported in St Joseph came from Asia (487 | 6.2%), South Central Asia (439 | 5.6%), India (432 | 5.5%), Latin America (119 | 1.5%), and Central America (83 | 1.1%), together accounting for 19.9% of all St Joseph residents.
| Immigration Origin | # Population | % Population |
| Asia | 487 | 6.2% |
| Belize | 13 | 0.2% |
| Brazil | 27 | 0.3% |
| Cambodia | 1 | 0.0% |
| Canada | 7 | 0.1% |
| Central America | 83 | 1.1% |
| China | 31 | 0.4% |
| Colombia | 1 | 0.0% |
| Costa Rica | 17 | 0.2% |
| Eastern Asia | 47 | 0.6% |
| Eastern Europe | 25 | 0.3% |
| Europe | 37 | 0.5% |
| Germany | 5 | 0.1% |
| India | 432 | 5.5% |
| Italy | 7 | 0.1% |
| Korea | 16 | 0.2% |
| Latin America | 119 | 1.5% |
| Mexico | 53 | 0.7% |
| Peru | 8 | 0.1% |
| Poland | 12 | 0.2% |
| Romania | 13 | 0.2% |
| South America | 36 | 0.5% |
| South Central Asia | 439 | 5.6% |
| South Eastern Asia | 1 | 0.0% |
| Southern Europe | 7 | 0.1% |
| Sri Lanka | 7 | 0.1% |
| Western Europe | 5 | 0.1% | View All 27 Rows |
Sex and Age in St Joseph
Sex and Age in St Joseph
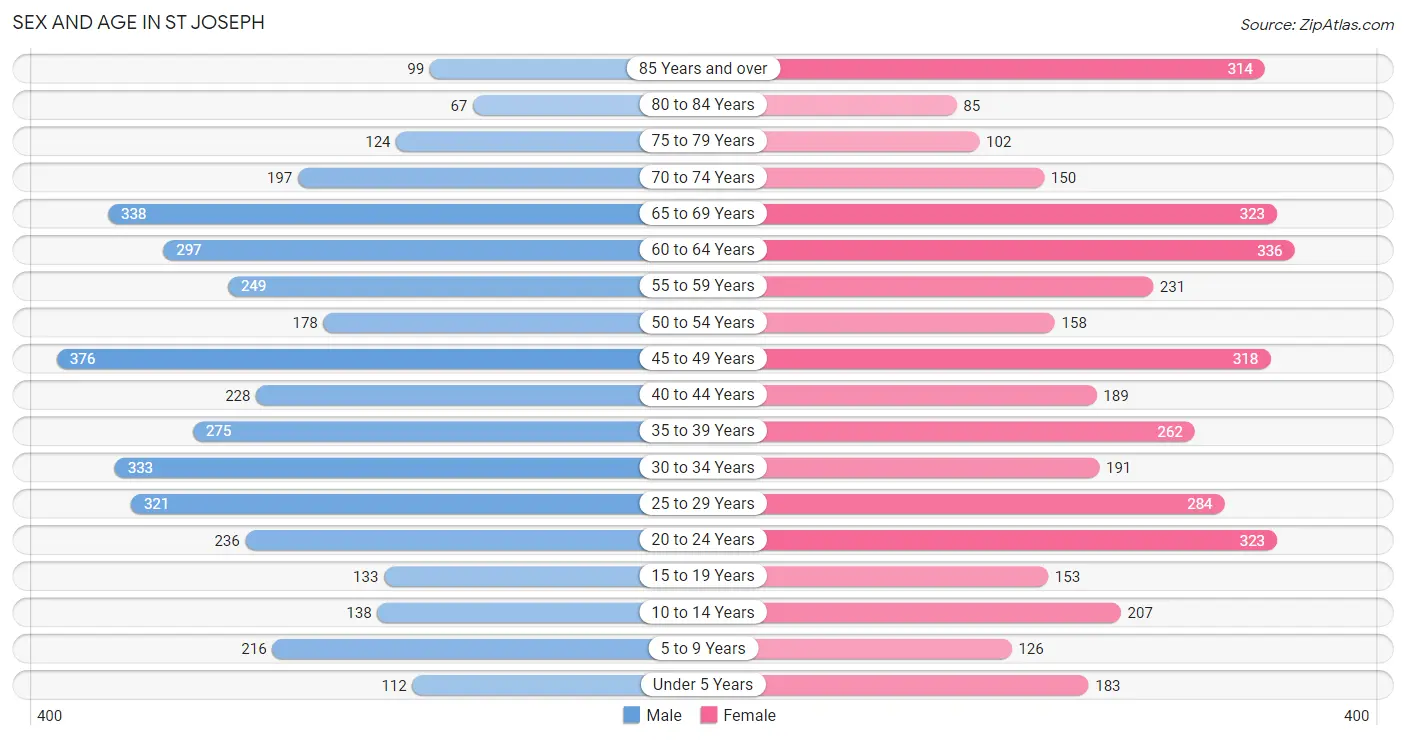
The most populous age groups in St Joseph are 45 to 49 Years (376 | 9.6%) for men and 60 to 64 Years (336 | 8.5%) for women.
| Age Bracket | Male | Female |
| Under 5 Years | 112 (2.9%) | 183 (4.6%) |
| 5 to 9 Years | 216 (5.5%) | 126 (3.2%) |
| 10 to 14 Years | 138 (3.5%) | 207 (5.3%) |
| 15 to 19 Years | 133 (3.4%) | 153 (3.9%) |
| 20 to 24 Years | 236 (6.0%) | 323 (8.2%) |
| 25 to 29 Years | 321 (8.2%) | 284 (7.2%) |
| 30 to 34 Years | 333 (8.5%) | 191 (4.9%) |
| 35 to 39 Years | 275 (7.0%) | 262 (6.7%) |
| 40 to 44 Years | 228 (5.8%) | 189 (4.8%) |
| 45 to 49 Years | 376 (9.6%) | 318 (8.1%) |
| 50 to 54 Years | 178 (4.5%) | 158 (4.0%) |
| 55 to 59 Years | 249 (6.4%) | 231 (5.9%) |
| 60 to 64 Years | 297 (7.6%) | 336 (8.5%) |
| 65 to 69 Years | 338 (8.6%) | 323 (8.2%) |
| 70 to 74 Years | 197 (5.0%) | 150 (3.8%) |
| 75 to 79 Years | 124 (3.2%) | 102 (2.6%) |
| 80 to 84 Years | 67 (1.7%) | 85 (2.2%) |
| 85 Years and over | 99 (2.5%) | 314 (8.0%) |
| Total | 3,917 (100.0%) | 3,935 (100.0%) |
Families and Households in St Joseph
Median Family Size in St Joseph
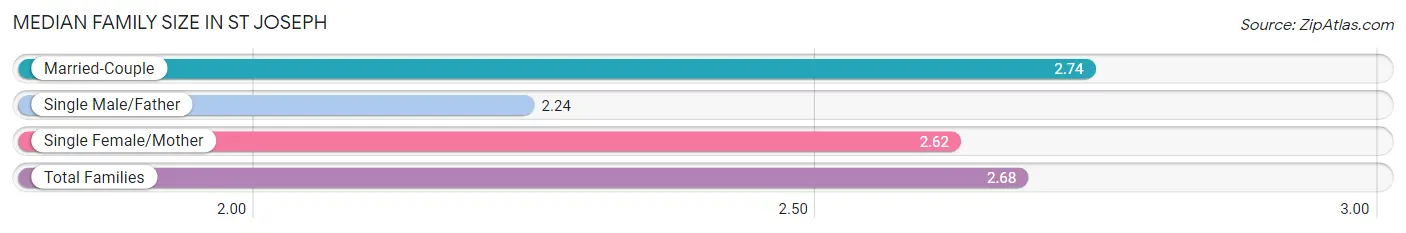
The median family size in St Joseph is 2.68 persons per family, with married-couple families (1,571 | 84.3%) accounting for the largest median family size of 2.74 persons per family. On the other hand, single male/father families (176 | 9.4%) represent the smallest median family size with 2.24 persons per family.
| Family Type | # Families | Family Size |
| Married-Couple | 1,571 (84.3%) | 2.74 |
| Single Male/Father | 176 (9.4%) | 2.24 |
| Single Female/Mother | 117 (6.3%) | 2.62 |
| Total Families | 1,864 (100.0%) | 2.68 |
Median Household Size in St Joseph
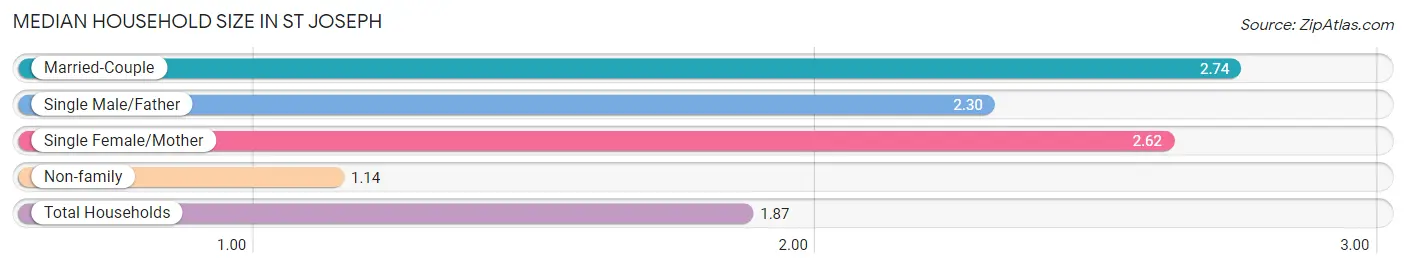
The median household size in St Joseph is 1.87 persons per household, with married-couple households (1,571 | 39.3%) accounting for the largest median household size of 2.74 persons per household. non-family households (2,130 | 53.3%) represent the smallest median household size with 1.14 persons per household.
| Household Type | # Households | Household Size |
| Married-Couple | 1,571 (39.3%) | 2.74 |
| Single Male/Father | 176 (4.4%) | 2.30 |
| Single Female/Mother | 117 (2.9%) | 2.62 |
| Non-family | 2,130 (53.3%) | 1.14 |
| Total Households | 3,994 (100.0%) | 1.87 |
Household Size by Marriage Status in St Joseph
Out of a total of 3,994 households in St Joseph, 1,864 (46.7%) are family households, while 2,130 (53.3%) are nonfamily households. The most numerous type of family households are 2-person households, comprising 1,101, and the most common type of nonfamily households are 1-person households, comprising 1,837.
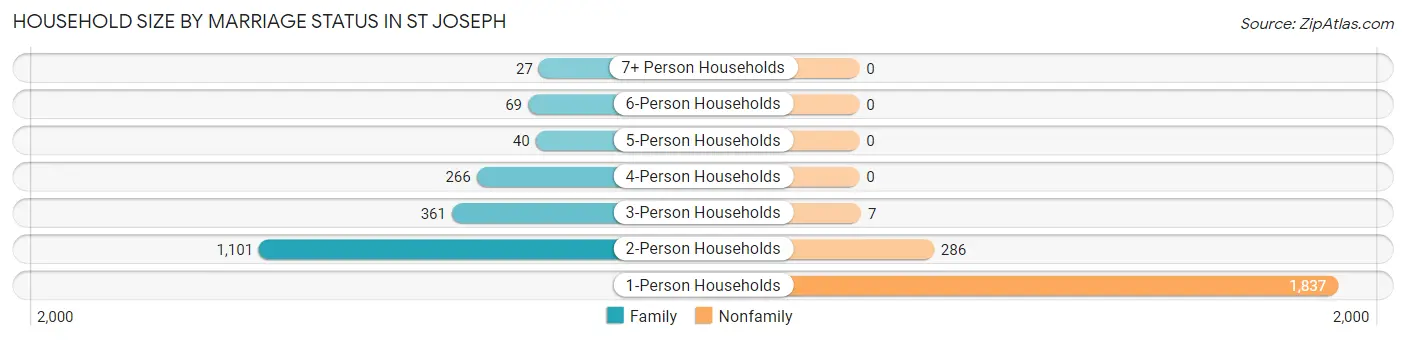
| Household Size | Family Households | Nonfamily Households |
| 1-Person Households | - | 1,837 (46.0%) |
| 2-Person Households | 1,101 (27.6%) | 286 (7.2%) |
| 3-Person Households | 361 (9.0%) | 7 (0.2%) |
| 4-Person Households | 266 (6.7%) | 0 (0.0%) |
| 5-Person Households | 40 (1.0%) | 0 (0.0%) |
| 6-Person Households | 69 (1.7%) | 0 (0.0%) |
| 7+ Person Households | 27 (0.7%) | 0 (0.0%) |
| Total | 1,864 (46.7%) | 2,130 (53.3%) |
Female Fertility in St Joseph
Fertility by Age in St Joseph
Average fertility rate in St Joseph is 44.0 births per 1,000 women. Women in the age bracket of 15 to 19 years have the highest fertility rate with 190.0 births per 1,000 women. Women in the age bracket of 15 to 19 years acount for 38.2% of all women with births.
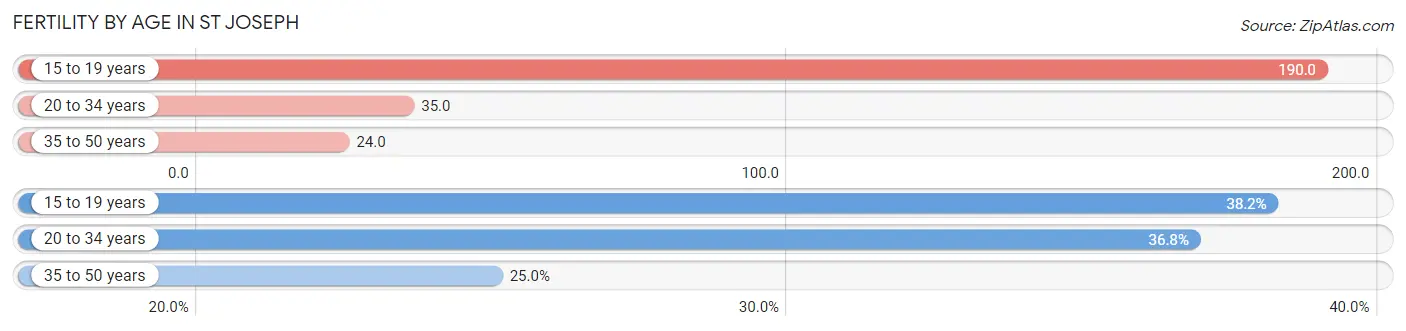
| Age Bracket | Women with Births | Births / 1,000 Women |
| 15 to 19 years | 29 (38.2%) | 190.0 |
| 20 to 34 years | 28 (36.8%) | 35.0 |
| 35 to 50 years | 19 (25.0%) | 24.0 |
| Total | 76 (100.0%) | 44.0 |
Fertility by Age by Marriage Status in St Joseph
61.8% of women with births (76) in St Joseph are married. The highest percentage of unmarried women with births falls into 15 to 19 years age bracket with 100.0% of them unmarried at the time of birth, while the lowest percentage of unmarried women with births belong to 20 to 34 years age bracket with 0.0% of them unmarried.
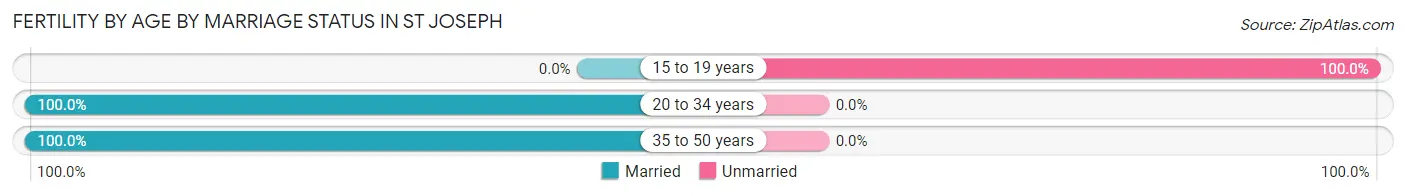
| Age Bracket | Married | Unmarried |
| 15 to 19 years | 0 (0.0%) | 29 (100.0%) |
| 20 to 34 years | 28 (100.0%) | 0 (0.0%) |
| 35 to 50 years | 19 (100.0%) | 0 (0.0%) |
| Total | 47 (61.8%) | 29 (38.2%) |
Fertility by Education in St Joseph
Average fertility rate in St Joseph is 44.0 births per 1,000 women. Women with the education attainment of less than high school have the highest fertility rate of 537.0 births per 1,000 women, while women with the education attainment of high school diploma have the lowest fertility at 15.0 births per 1,000 women. Women with the education attainment of less than high school represent 38.2% of all women with births.
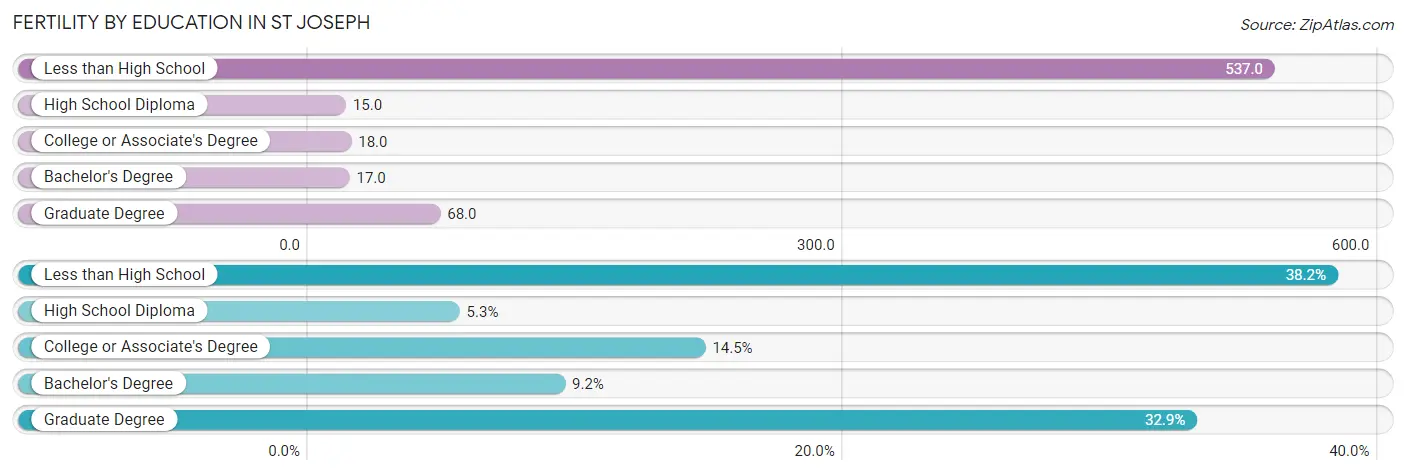
| Educational Attainment | Women with Births | Births / 1,000 Women |
| Less than High School | 29 (38.2%) | 537.0 |
| High School Diploma | 4 (5.3%) | 15.0 |
| College or Associate's Degree | 11 (14.5%) | 18.0 |
| Bachelor's Degree | 7 (9.2%) | 17.0 |
| Graduate Degree | 25 (32.9%) | 68.0 |
| Total | 76 (100.0%) | 44.0 |
Fertility by Education by Marriage Status in St Joseph
38.2% of women with births in St Joseph are unmarried. Women with the educational attainment of high school diploma are most likely to be married with 100.0% of them married at childbirth, while women with the educational attainment of less than high school are least likely to be married with 100.0% of them unmarried at childbirth.
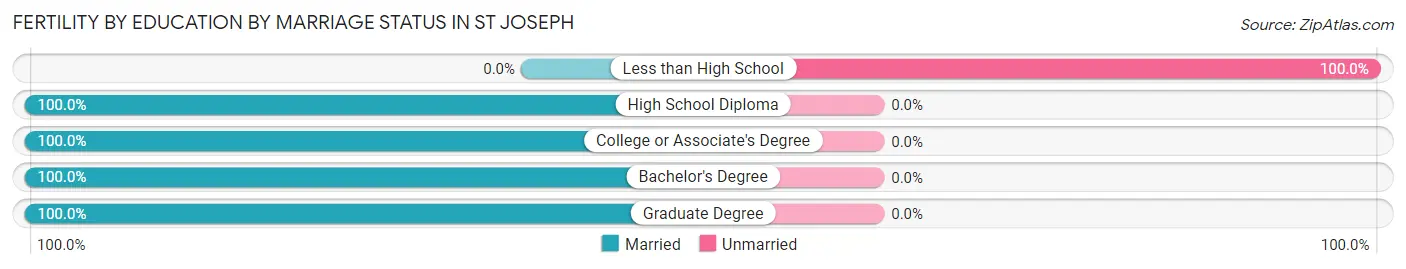
| Educational Attainment | Married | Unmarried |
| Less than High School | 0 (0.0%) | 29 (100.0%) |
| High School Diploma | 4 (100.0%) | 0 (0.0%) |
| College or Associate's Degree | 11 (100.0%) | 0 (0.0%) |
| Bachelor's Degree | 7 (100.0%) | 0 (0.0%) |
| Graduate Degree | 25 (100.0%) | 0 (0.0%) |
| Total | 47 (61.8%) | 29 (38.2%) |
Employment Characteristics in St Joseph
Employment by Class of Employer in St Joseph
Among the 4,021 employed individuals in St Joseph, private company employees (2,803 | 69.7%), not-for-profit organizations (559 | 13.9%), and local government employees (229 | 5.7%) make up the most common classes of employment.
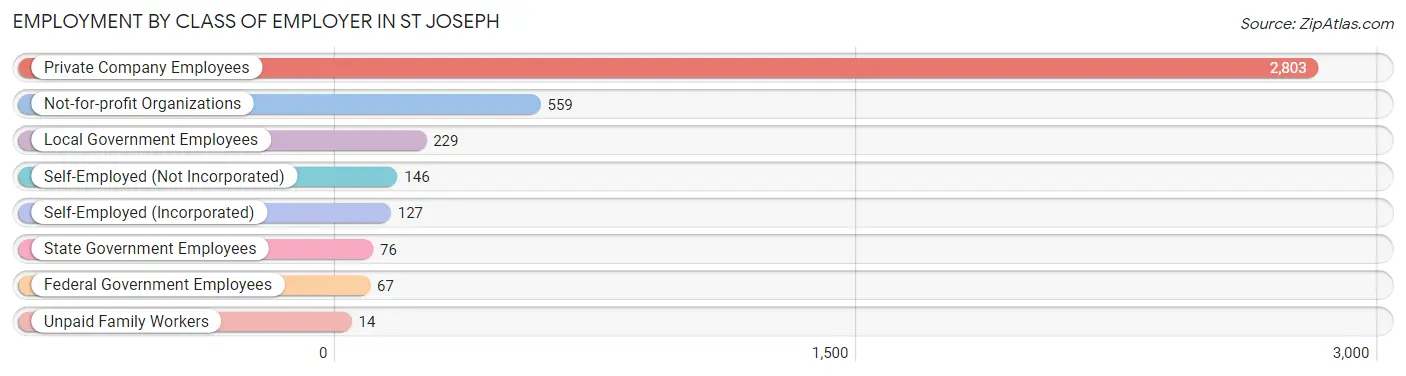
| Employer Class | # Employees | % Employees |
| Private Company Employees | 2,803 | 69.7% |
| Self-Employed (Incorporated) | 127 | 3.2% |
| Self-Employed (Not Incorporated) | 146 | 3.6% |
| Not-for-profit Organizations | 559 | 13.9% |
| Local Government Employees | 229 | 5.7% |
| State Government Employees | 76 | 1.9% |
| Federal Government Employees | 67 | 1.7% |
| Unpaid Family Workers | 14 | 0.4% |
| Total | 4,021 | 100.0% |
Employment Status by Age in St Joseph
According to the labor force statistics for St Joseph, out of the total population over 16 years of age (6,823), 61.6% or 4,203 individuals are in the labor force, with 1.4% or 59 of them unemployed. The age group with the highest labor force participation rate is 30 to 34 years, with 90.6% or 475 individuals in the labor force. Within the labor force, the 25 to 29 years age range has the highest percentage of unemployed individuals, with 3.7% or 20 of them being unemployed.
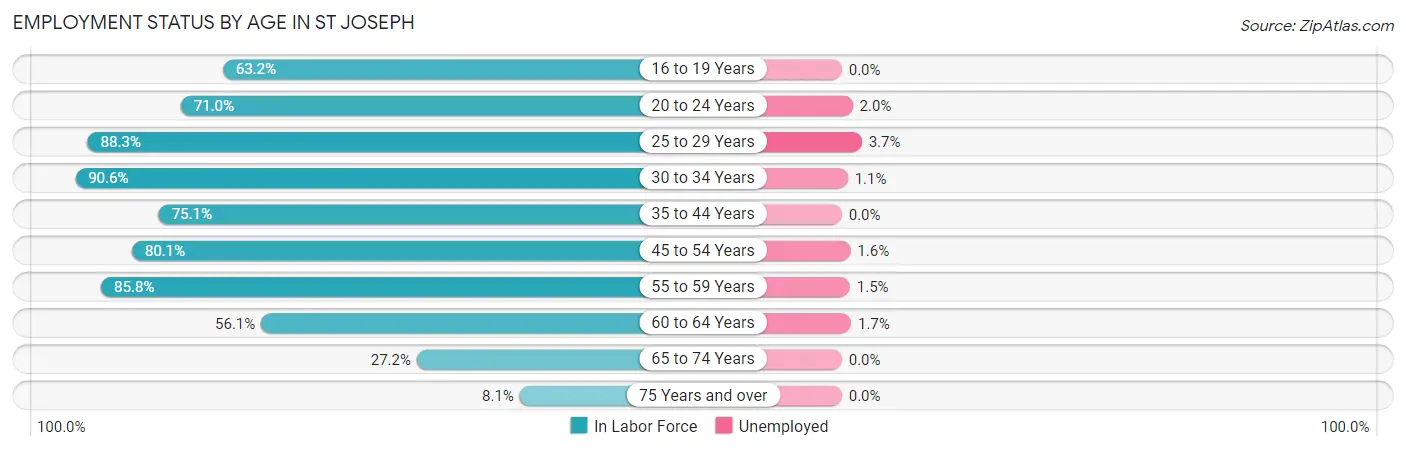
| Age Bracket | In Labor Force | Unemployed |
| 16 to 19 Years | 151 (63.2%) | 0 (0.0%) |
| 20 to 24 Years | 397 (71.0%) | 8 (2.0%) |
| 25 to 29 Years | 534 (88.3%) | 20 (3.7%) |
| 30 to 34 Years | 475 (90.6%) | 5 (1.1%) |
| 35 to 44 Years | 716 (75.1%) | 0 (0.0%) |
| 45 to 54 Years | 825 (80.1%) | 13 (1.6%) |
| 55 to 59 Years | 412 (85.8%) | 6 (1.5%) |
| 60 to 64 Years | 355 (56.1%) | 6 (1.7%) |
| 65 to 74 Years | 274 (27.2%) | 0 (0.0%) |
| 75 Years and over | 64 (8.1%) | 0 (0.0%) |
| Total | 4,203 (61.6%) | 59 (1.4%) |
Employment Status by Educational Attainment in St Joseph
According to labor force statistics for St Joseph, 78.5% of individuals (3,317) out of the total population between 25 and 64 years of age (4,226) are in the labor force, with 1.5% or 50 of them being unemployed. The group with the highest labor force participation rate are those with the educational attainment of bachelor's degree or higher, with 85.2% or 1,977 individuals in the labor force. Within the labor force, individuals with high school diploma education have the highest percentage of unemployment, with 4.7% or 16 of them being unemployed.
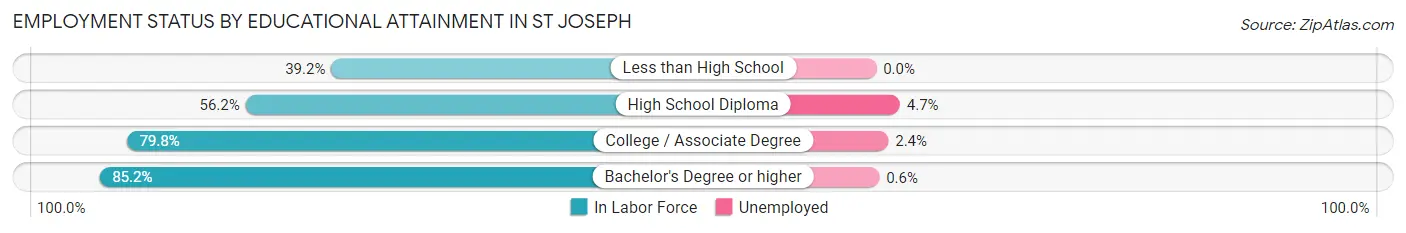
| Educational Attainment | In Labor Force | Unemployed |
| Less than High School | 38 (39.2%) | 0 (0.0%) |
| High School Diploma | 339 (56.2%) | 28 (4.7%) |
| College / Associate Degree | 962 (79.8%) | 29 (2.4%) |
| Bachelor's Degree or higher | 1,977 (85.2%) | 14 (0.6%) |
| Total | 3,317 (78.5%) | 63 (1.5%) |
Employment Occupations by Sex in St Joseph
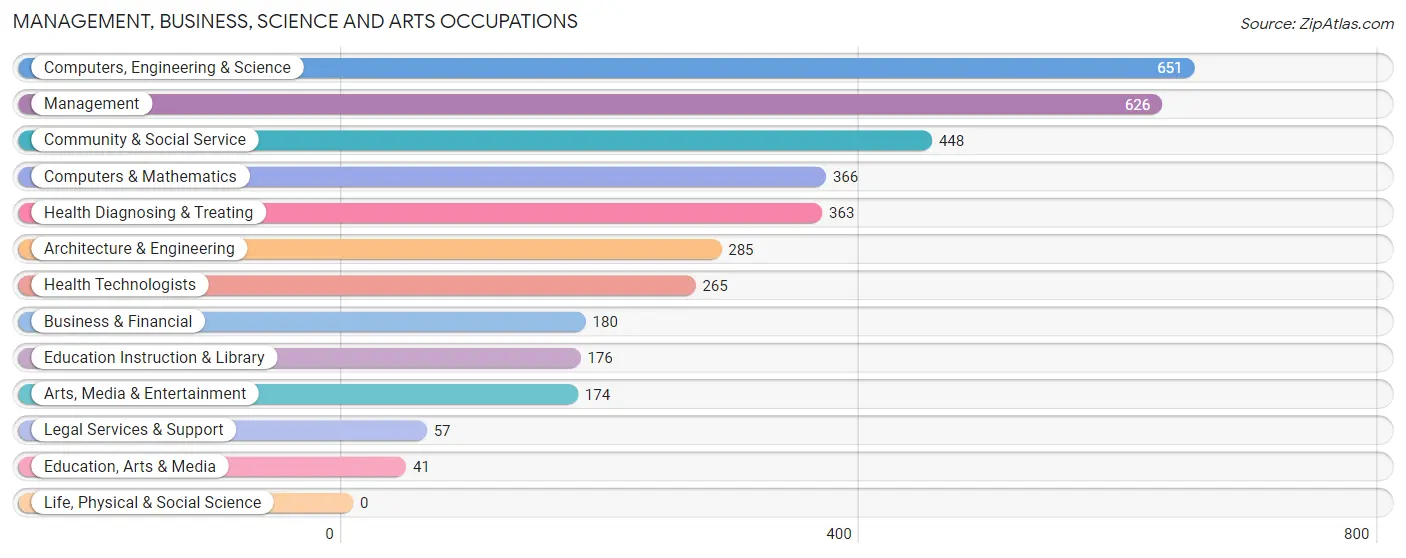
Management, Business, Science and Arts Occupations
The most common Management, Business, Science and Arts occupations in St Joseph are Computers, Engineering & Science (651 | 15.7%), Management (626 | 15.1%), Community & Social Service (448 | 10.8%), Computers & Mathematics (366 | 8.8%), and Health Diagnosing & Treating (363 | 8.8%).
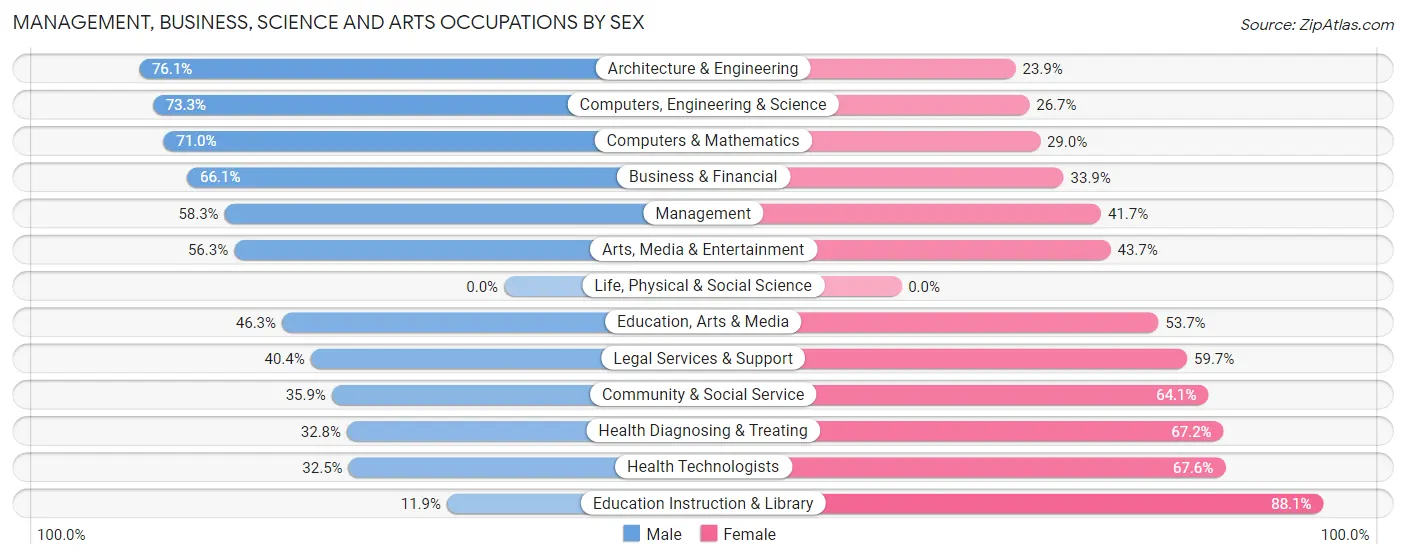
Management, Business, Science and Arts Occupations by Sex
Within the Management, Business, Science and Arts occupations in St Joseph, the most male-oriented occupations are Architecture & Engineering (76.1%), Computers, Engineering & Science (73.3%), and Computers & Mathematics (71.0%), while the most female-oriented occupations are Education Instruction & Library (88.1%), Health Technologists (67.5%), and Health Diagnosing & Treating (67.2%).
| Occupation | Male | Female |
| Management | 365 (58.3%) | 261 (41.7%) |
| Business & Financial | 119 (66.1%) | 61 (33.9%) |
| Computers, Engineering & Science | 477 (73.3%) | 174 (26.7%) |
| Computers & Mathematics | 260 (71.0%) | 106 (29.0%) |
| Architecture & Engineering | 217 (76.1%) | 68 (23.9%) |
| Life, Physical & Social Science | 0 (0.0%) | 0 (0.0%) |
| Community & Social Service | 161 (35.9%) | 287 (64.1%) |
| Education, Arts & Media | 19 (46.3%) | 22 (53.7%) |
| Legal Services & Support | 23 (40.4%) | 34 (59.7%) |
| Education Instruction & Library | 21 (11.9%) | 155 (88.1%) |
| Arts, Media & Entertainment | 98 (56.3%) | 76 (43.7%) |
| Health Diagnosing & Treating | 119 (32.8%) | 244 (67.2%) |
| Health Technologists | 86 (32.5%) | 179 (67.5%) |
| Total (Category) | 1,241 (54.7%) | 1,027 (45.3%) |
| Total (Overall) | 2,276 (54.9%) | 1,869 (45.1%) |
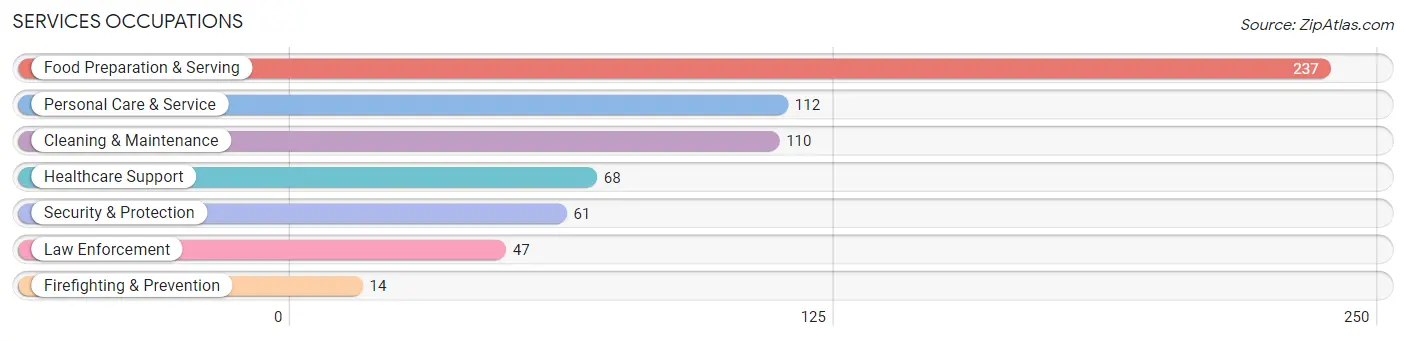
Services Occupations
The most common Services occupations in St Joseph are Food Preparation & Serving (237 | 5.7%), Personal Care & Service (112 | 2.7%), Cleaning & Maintenance (110 | 2.6%), Healthcare Support (68 | 1.6%), and Security & Protection (61 | 1.5%).
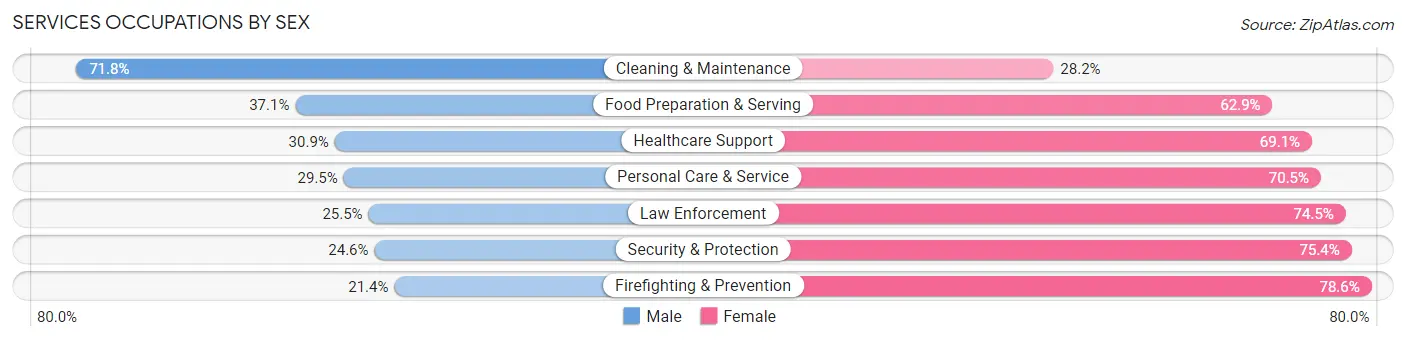
Services Occupations by Sex
Within the Services occupations in St Joseph, the most male-oriented occupations are Cleaning & Maintenance (71.8%), Food Preparation & Serving (37.1%), and Healthcare Support (30.9%), while the most female-oriented occupations are Firefighting & Prevention (78.6%), Security & Protection (75.4%), and Law Enforcement (74.5%).
| Occupation | Male | Female |
| Healthcare Support | 21 (30.9%) | 47 (69.1%) |
| Security & Protection | 15 (24.6%) | 46 (75.4%) |
| Firefighting & Prevention | 3 (21.4%) | 11 (78.6%) |
| Law Enforcement | 12 (25.5%) | 35 (74.5%) |
| Food Preparation & Serving | 88 (37.1%) | 149 (62.9%) |
| Cleaning & Maintenance | 79 (71.8%) | 31 (28.2%) |
| Personal Care & Service | 33 (29.5%) | 79 (70.5%) |
| Total (Category) | 236 (40.1%) | 352 (59.9%) |
| Total (Overall) | 2,276 (54.9%) | 1,869 (45.1%) |
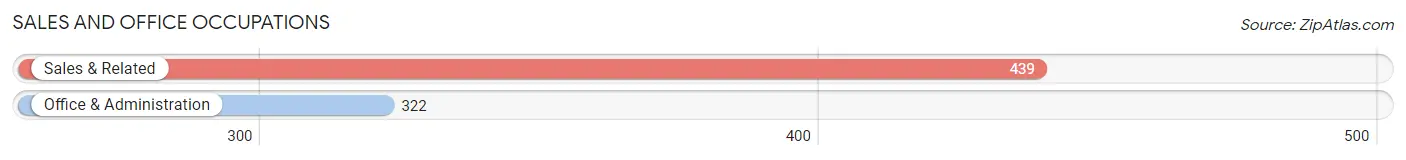
Sales and Office Occupations
The most common Sales and Office occupations in St Joseph are Sales & Related (439 | 10.6%), and Office & Administration (322 | 7.8%).
Sales and Office Occupations by Sex
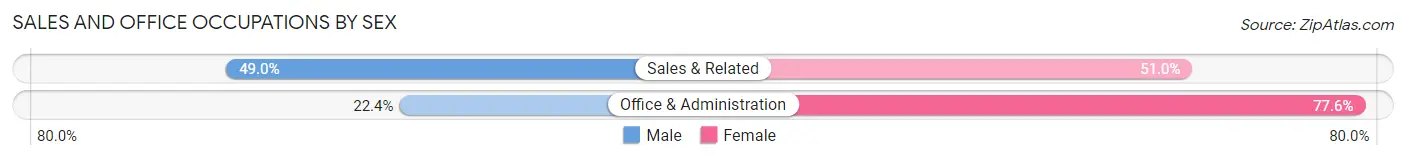
| Occupation | Male | Female |
| Sales & Related | 215 (49.0%) | 224 (51.0%) |
| Office & Administration | 72 (22.4%) | 250 (77.6%) |
| Total (Category) | 287 (37.7%) | 474 (62.3%) |
| Total (Overall) | 2,276 (54.9%) | 1,869 (45.1%) |
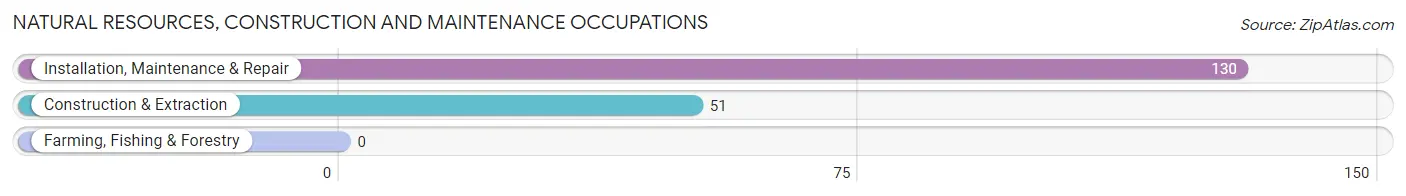
Natural Resources, Construction and Maintenance Occupations
The most common Natural Resources, Construction and Maintenance occupations in St Joseph are Installation, Maintenance & Repair (130 | 3.1%), and Construction & Extraction (51 | 1.2%).
Natural Resources, Construction and Maintenance Occupations by Sex
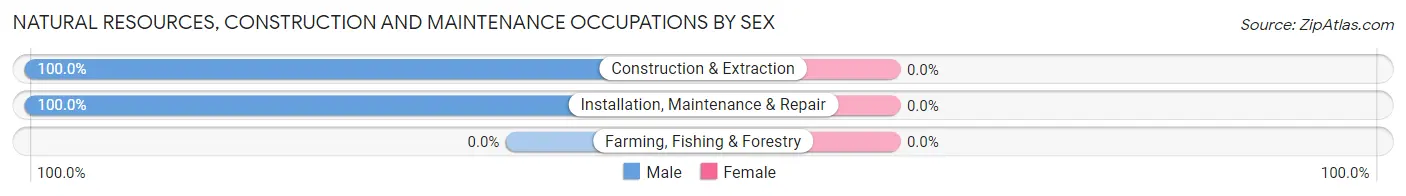
| Occupation | Male | Female |
| Farming, Fishing & Forestry | 0 (0.0%) | 0 (0.0%) |
| Construction & Extraction | 51 (100.0%) | 0 (0.0%) |
| Installation, Maintenance & Repair | 130 (100.0%) | 0 (0.0%) |
| Total (Category) | 181 (100.0%) | 0 (0.0%) |
| Total (Overall) | 2,276 (54.9%) | 1,869 (45.1%) |
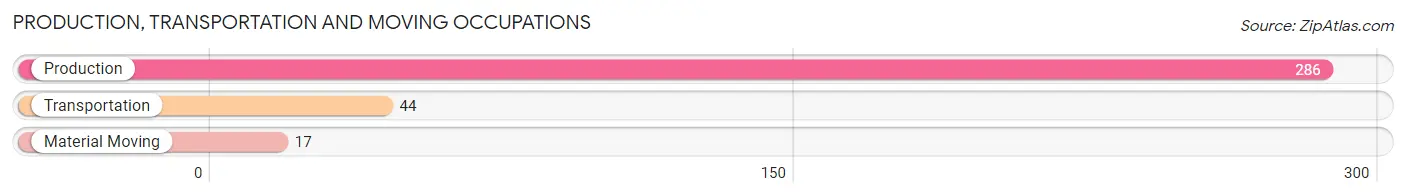
Production, Transportation and Moving Occupations
The most common Production, Transportation and Moving occupations in St Joseph are Production (286 | 6.9%), Transportation (44 | 1.1%), and Material Moving (17 | 0.4%).
Production, Transportation and Moving Occupations by Sex
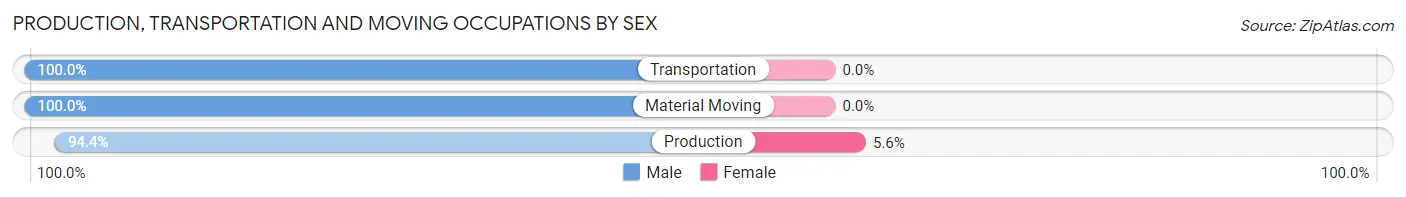
| Occupation | Male | Female |
| Production | 270 (94.4%) | 16 (5.6%) |
| Transportation | 44 (100.0%) | 0 (0.0%) |
| Material Moving | 17 (100.0%) | 0 (0.0%) |
| Total (Category) | 331 (95.4%) | 16 (4.6%) |
| Total (Overall) | 2,276 (54.9%) | 1,869 (45.1%) |
Employment Industries by Sex in St Joseph
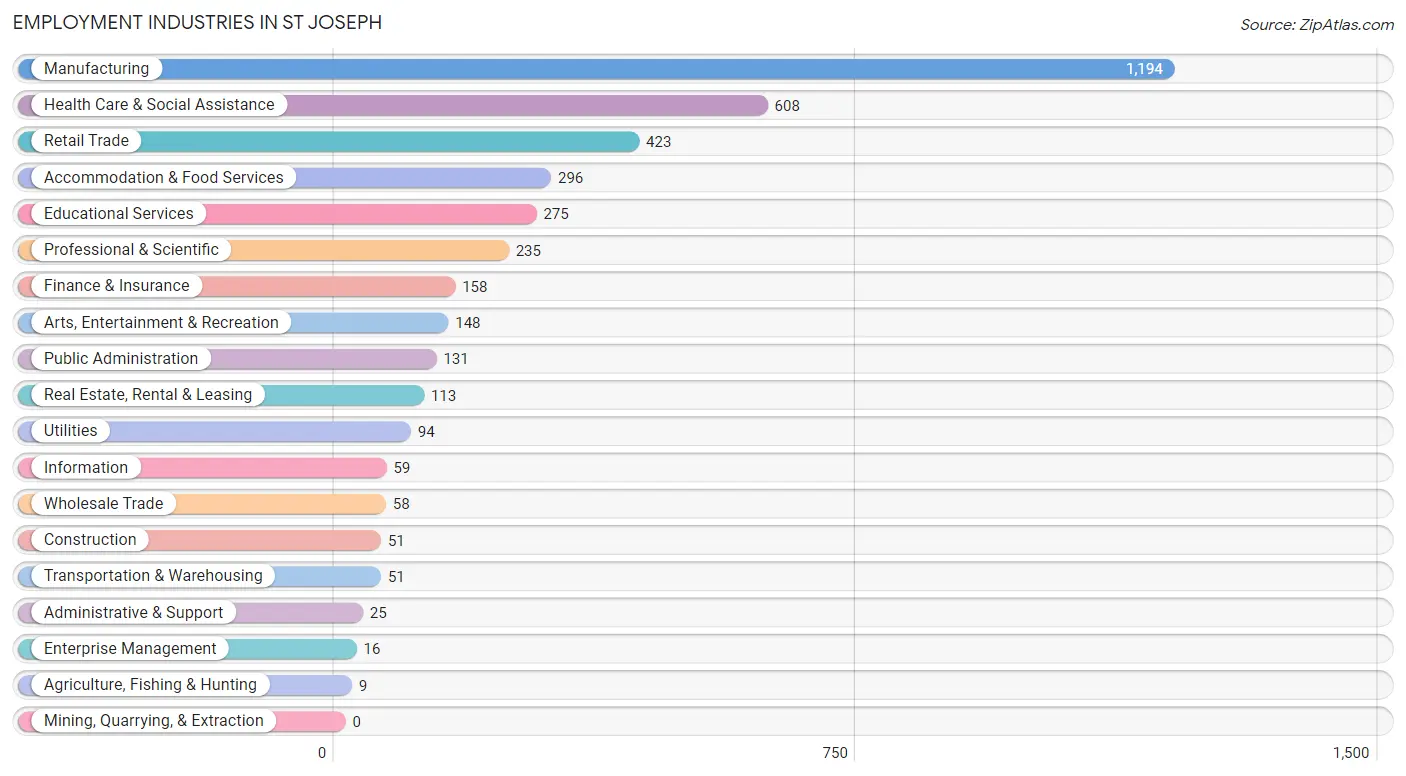
Employment Industries in St Joseph
The major employment industries in St Joseph include Manufacturing (1,194 | 28.8%), Health Care & Social Assistance (608 | 14.7%), Retail Trade (423 | 10.2%), Accommodation & Food Services (296 | 7.1%), and Educational Services (275 | 6.6%).
Employment Industries by Sex in St Joseph
The St Joseph industries that see more men than women are Agriculture, Fishing & Hunting (100.0%), Transportation & Warehousing (94.1%), and Utilities (93.6%), whereas the industries that tend to have a higher number of women are Enterprise Management (100.0%), Information (86.4%), and Health Care & Social Assistance (75.3%).
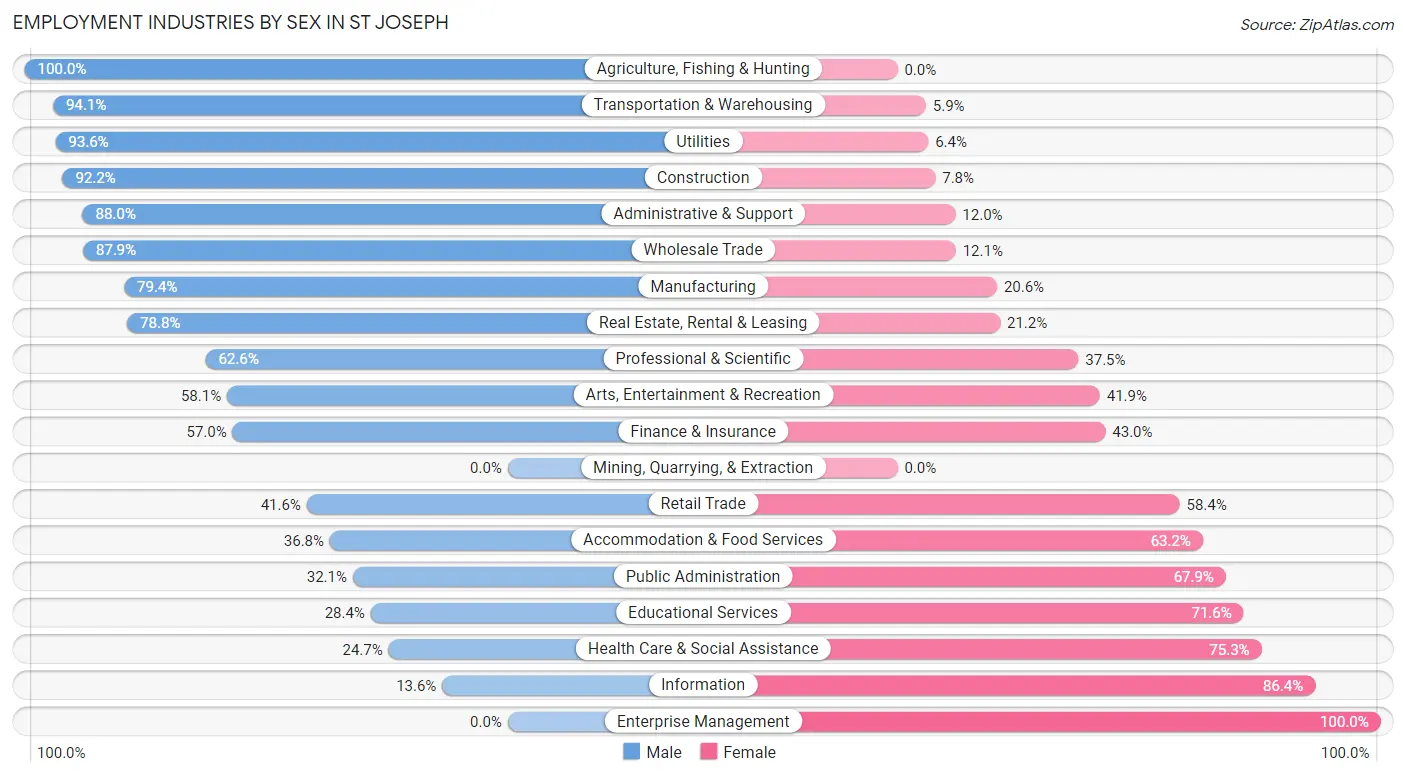
| Industry | Male | Female |
| Agriculture, Fishing & Hunting | 9 (100.0%) | 0 (0.0%) |
| Mining, Quarrying, & Extraction | 0 (0.0%) | 0 (0.0%) |
| Construction | 47 (92.2%) | 4 (7.8%) |
| Manufacturing | 948 (79.4%) | 246 (20.6%) |
| Wholesale Trade | 51 (87.9%) | 7 (12.1%) |
| Retail Trade | 176 (41.6%) | 247 (58.4%) |
| Transportation & Warehousing | 48 (94.1%) | 3 (5.9%) |
| Utilities | 88 (93.6%) | 6 (6.4%) |
| Information | 8 (13.6%) | 51 (86.4%) |
| Finance & Insurance | 90 (57.0%) | 68 (43.0%) |
| Real Estate, Rental & Leasing | 89 (78.8%) | 24 (21.2%) |
| Professional & Scientific | 147 (62.5%) | 88 (37.4%) |
| Enterprise Management | 0 (0.0%) | 16 (100.0%) |
| Administrative & Support | 22 (88.0%) | 3 (12.0%) |
| Educational Services | 78 (28.4%) | 197 (71.6%) |
| Health Care & Social Assistance | 150 (24.7%) | 458 (75.3%) |
| Arts, Entertainment & Recreation | 86 (58.1%) | 62 (41.9%) |
| Accommodation & Food Services | 109 (36.8%) | 187 (63.2%) |
| Public Administration | 42 (32.1%) | 89 (67.9%) |
| Total | 2,276 (54.9%) | 1,869 (45.1%) |
Education in St Joseph
School Enrollment in St Joseph
The most common levels of schooling among the 1,308 students in St Joseph are college / undergraduate (403 | 30.8%), middle school (296 | 22.6%), and elementary school (171 | 13.1%).
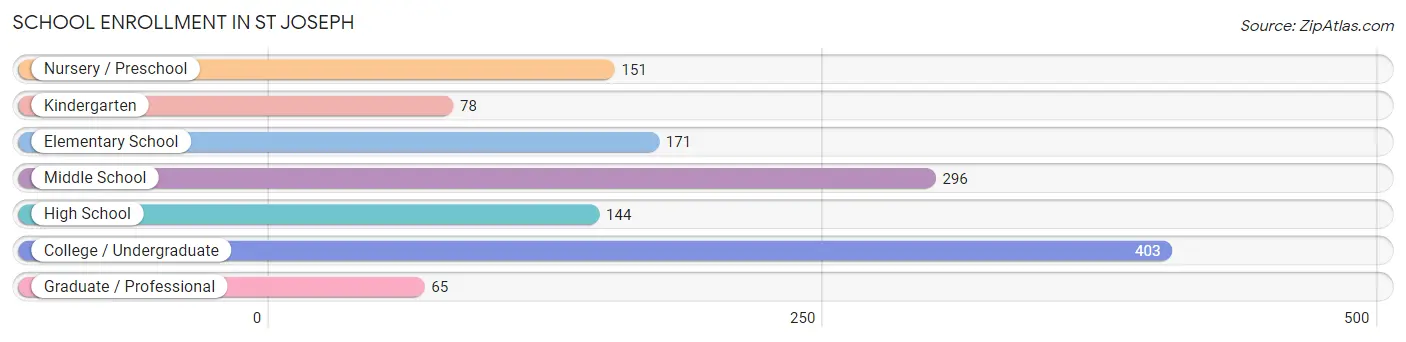
| School Level | # Students | % Students |
| Nursery / Preschool | 151 | 11.5% |
| Kindergarten | 78 | 6.0% |
| Elementary School | 171 | 13.1% |
| Middle School | 296 | 22.6% |
| High School | 144 | 11.0% |
| College / Undergraduate | 403 | 30.8% |
| Graduate / Professional | 65 | 5.0% |
| Total | 1,308 | 100.0% |
School Enrollment by Age by Funding Source in St Joseph
Out of a total of 1,308 students who are enrolled in schools in St Joseph, 211 (16.1%) attend a private institution, while the remaining 1,097 (83.9%) are enrolled in public schools. The age group of 5 to 9 year old has the highest likelihood of being enrolled in private schools, with 129 (38.9% in the age bracket) enrolled. Conversely, the age group of 20 to 24 year olds has the lowest likelihood of being enrolled in a private school, with 167 (100.0% in the age bracket) attending a public institution.
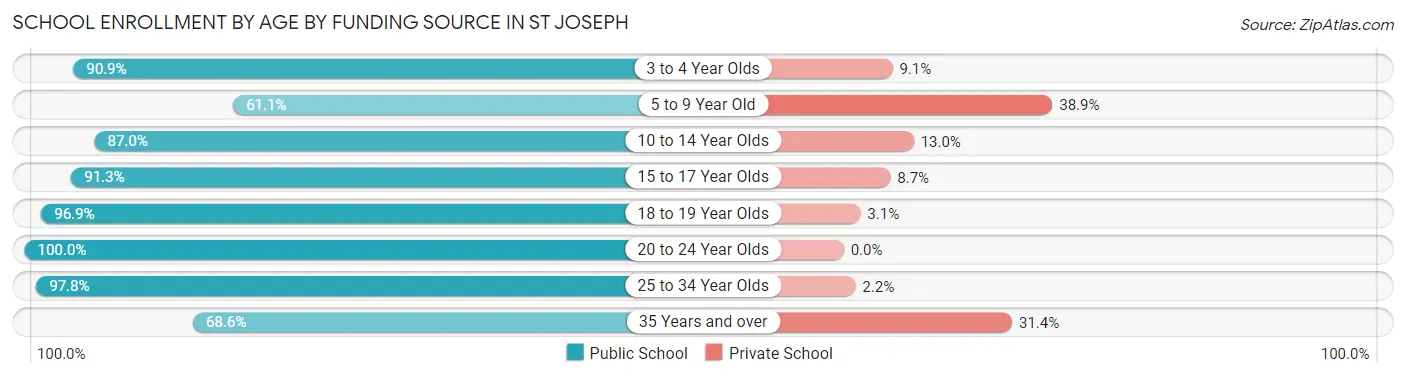
| Age Bracket | Public School | Private School |
| 3 to 4 Year Olds | 30 (90.9%) | 3 (9.1%) |
| 5 to 9 Year Old | 203 (61.1%) | 129 (38.9%) |
| 10 to 14 Year Olds | 300 (87.0%) | 45 (13.0%) |
| 15 to 17 Year Olds | 105 (91.3%) | 10 (8.7%) |
| 18 to 19 Year Olds | 124 (96.9%) | 4 (3.1%) |
| 20 to 24 Year Olds | 167 (100.0%) | 0 (0.0%) |
| 25 to 34 Year Olds | 134 (97.8%) | 3 (2.2%) |
| 35 Years and over | 35 (68.6%) | 16 (31.4%) |
| Total | 1,097 (83.9%) | 211 (16.1%) |
Educational Attainment by Field of Study in St Joseph
Business (646 | 18.9%), engineering (387 | 11.3%), education (369 | 10.8%), arts & humanities (303 | 8.8%), and computers & mathematics (296 | 8.6%) are the most common fields of study among 3,426 individuals in St Joseph who have obtained a bachelor's degree or higher.
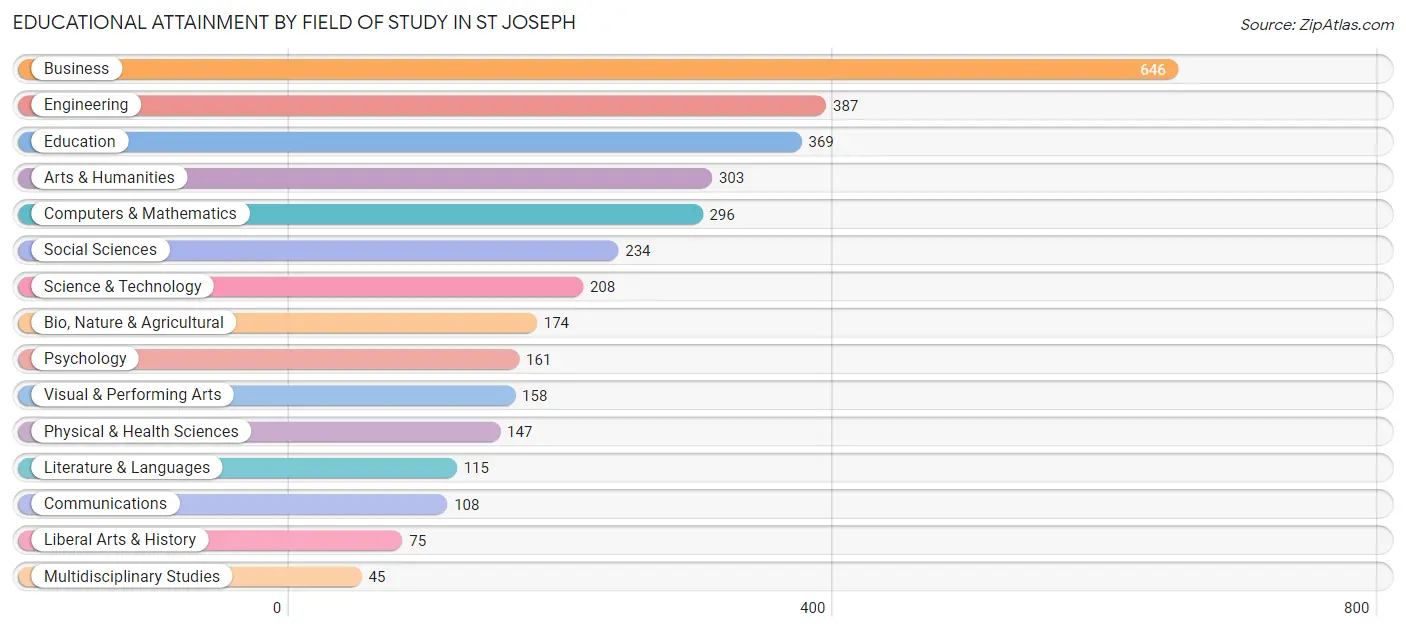
| Field of Study | # Graduates | % Graduates |
| Computers & Mathematics | 296 | 8.6% |
| Bio, Nature & Agricultural | 174 | 5.1% |
| Physical & Health Sciences | 147 | 4.3% |
| Psychology | 161 | 4.7% |
| Social Sciences | 234 | 6.8% |
| Engineering | 387 | 11.3% |
| Multidisciplinary Studies | 45 | 1.3% |
| Science & Technology | 208 | 6.1% |
| Business | 646 | 18.9% |
| Education | 369 | 10.8% |
| Literature & Languages | 115 | 3.4% |
| Liberal Arts & History | 75 | 2.2% |
| Visual & Performing Arts | 158 | 4.6% |
| Communications | 108 | 3.2% |
| Arts & Humanities | 303 | 8.8% |
| Total | 3,426 | 100.0% |
Transportation & Commute in St Joseph
Vehicle Availability by Sex in St Joseph
The most prevalent vehicle ownership categories in St Joseph are males with 2 vehicles (1,111, accounting for 51.3%) and females with 2 vehicles (1,003, making up 59.9%).
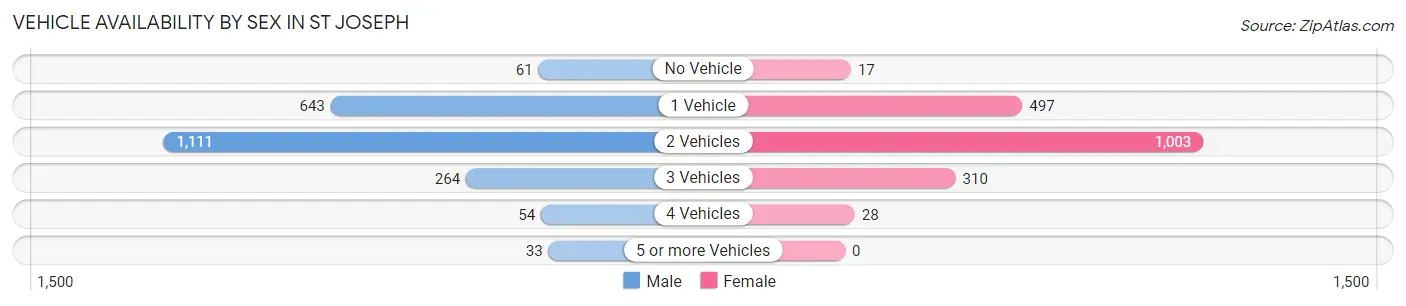
| Vehicles Available | Male | Female |
| No Vehicle | 61 (2.8%) | 17 (0.9%) |
| 1 Vehicle | 643 (29.7%) | 497 (26.8%) |
| 2 Vehicles | 1,111 (51.3%) | 1,003 (54.1%) |
| 3 Vehicles | 264 (12.2%) | 310 (16.7%) |
| 4 Vehicles | 54 (2.5%) | 28 (1.5%) |
| 5 or more Vehicles | 33 (1.5%) | 0 (0.0%) |
| Total | 2,166 (100.0%) | 1,855 (100.0%) |
Commute Time in St Joseph
The most frequently occuring commute durations in St Joseph are 5 to 9 minutes (838 commuters, 23.2%), 10 to 14 minutes (810 commuters, 22.4%), and 15 to 19 minutes (611 commuters, 16.9%).
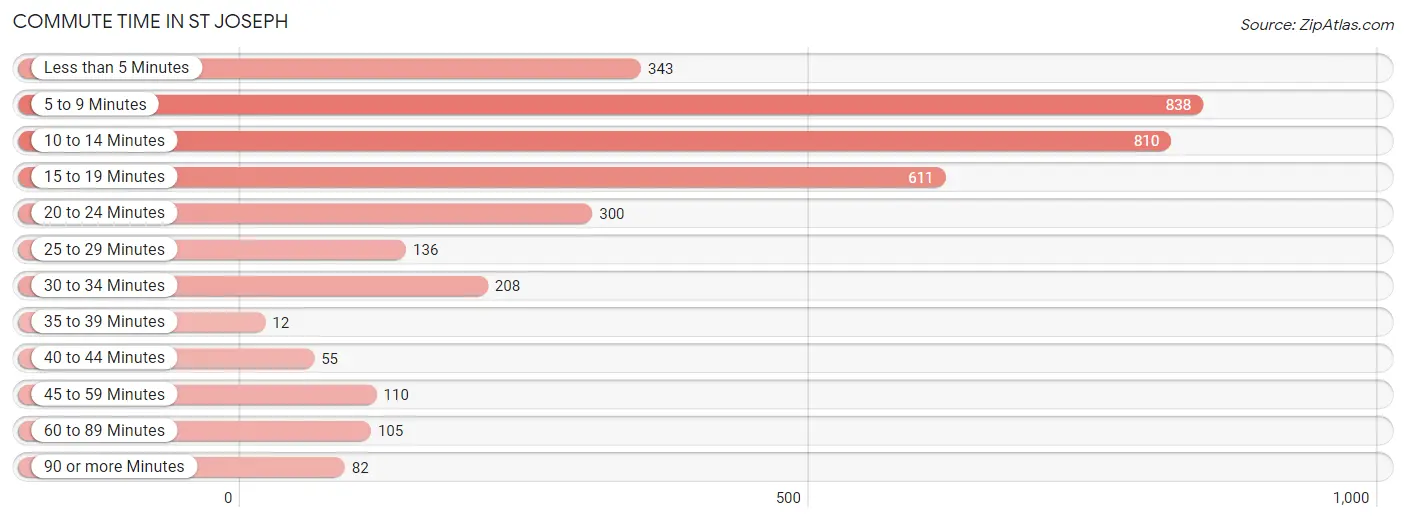
| Commute Time | # Commuters | % Commuters |
| Less than 5 Minutes | 343 | 9.5% |
| 5 to 9 Minutes | 838 | 23.2% |
| 10 to 14 Minutes | 810 | 22.4% |
| 15 to 19 Minutes | 611 | 16.9% |
| 20 to 24 Minutes | 300 | 8.3% |
| 25 to 29 Minutes | 136 | 3.8% |
| 30 to 34 Minutes | 208 | 5.8% |
| 35 to 39 Minutes | 12 | 0.3% |
| 40 to 44 Minutes | 55 | 1.5% |
| 45 to 59 Minutes | 110 | 3.0% |
| 60 to 89 Minutes | 105 | 2.9% |
| 90 or more Minutes | 82 | 2.3% |
Commute Time by Sex in St Joseph
The most common commute times in St Joseph are 5 to 9 minutes (476 commuters, 24.3%) for males and 10 to 14 minutes (442 commuters, 26.8%) for females.
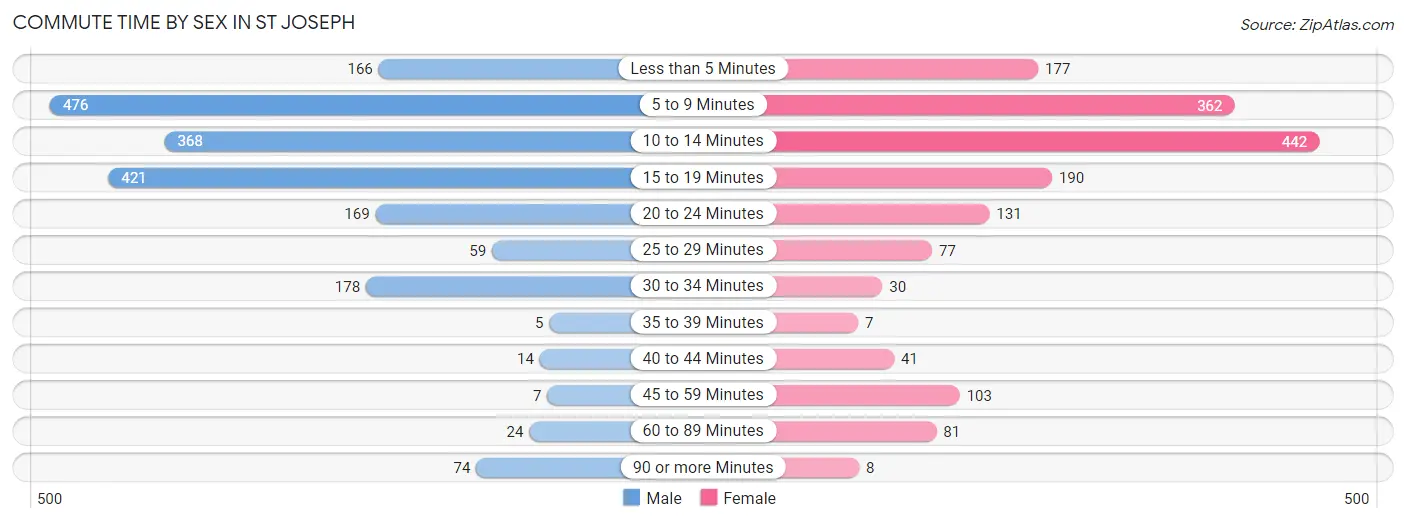
| Commute Time | Male | Female |
| Less than 5 Minutes | 166 (8.5%) | 177 (10.7%) |
| 5 to 9 Minutes | 476 (24.3%) | 362 (22.0%) |
| 10 to 14 Minutes | 368 (18.8%) | 442 (26.8%) |
| 15 to 19 Minutes | 421 (21.5%) | 190 (11.5%) |
| 20 to 24 Minutes | 169 (8.6%) | 131 (7.9%) |
| 25 to 29 Minutes | 59 (3.0%) | 77 (4.7%) |
| 30 to 34 Minutes | 178 (9.1%) | 30 (1.8%) |
| 35 to 39 Minutes | 5 (0.3%) | 7 (0.4%) |
| 40 to 44 Minutes | 14 (0.7%) | 41 (2.5%) |
| 45 to 59 Minutes | 7 (0.4%) | 103 (6.2%) |
| 60 to 89 Minutes | 24 (1.2%) | 81 (4.9%) |
| 90 or more Minutes | 74 (3.8%) | 8 (0.5%) |
Time of Departure to Work by Sex in St Joseph
The most frequent times of departure to work in St Joseph are 7:30 AM to 7:59 AM (407, 20.7%) for males and 7:30 AM to 7:59 AM (275, 16.7%) for females.
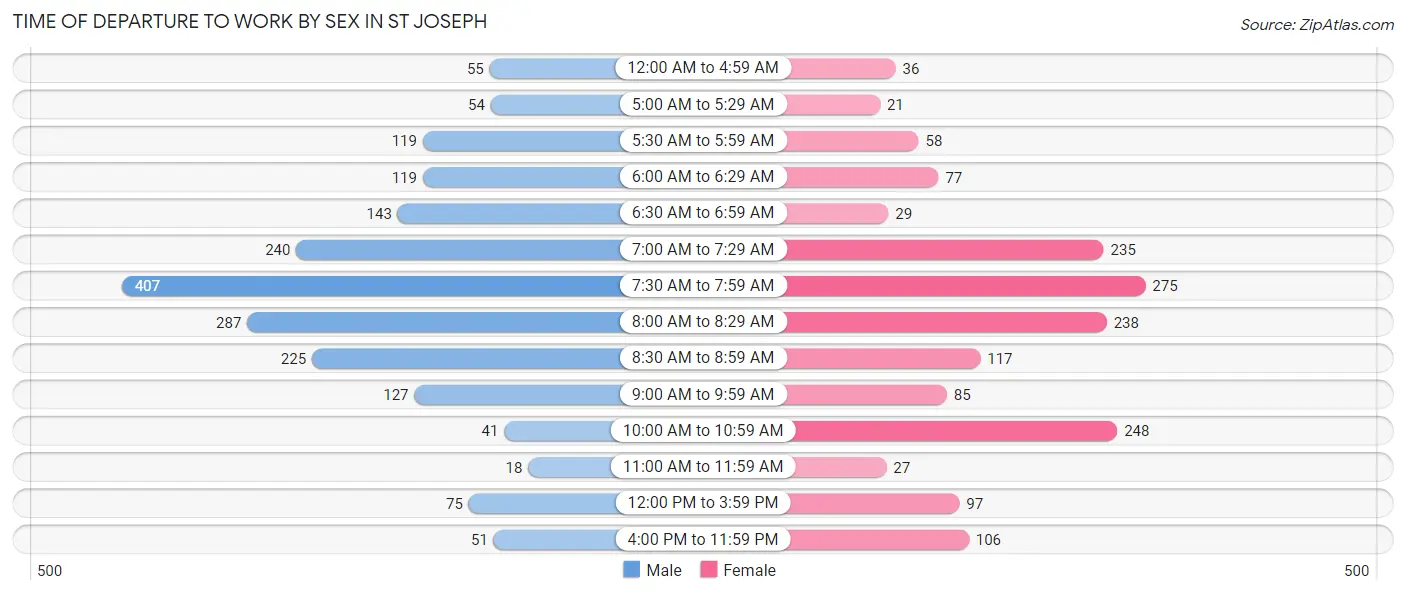
| Time of Departure | Male | Female |
| 12:00 AM to 4:59 AM | 55 (2.8%) | 36 (2.2%) |
| 5:00 AM to 5:29 AM | 54 (2.8%) | 21 (1.3%) |
| 5:30 AM to 5:59 AM | 119 (6.1%) | 58 (3.5%) |
| 6:00 AM to 6:29 AM | 119 (6.1%) | 77 (4.7%) |
| 6:30 AM to 6:59 AM | 143 (7.3%) | 29 (1.8%) |
| 7:00 AM to 7:29 AM | 240 (12.2%) | 235 (14.2%) |
| 7:30 AM to 7:59 AM | 407 (20.7%) | 275 (16.7%) |
| 8:00 AM to 8:29 AM | 287 (14.6%) | 238 (14.4%) |
| 8:30 AM to 8:59 AM | 225 (11.5%) | 117 (7.1%) |
| 9:00 AM to 9:59 AM | 127 (6.5%) | 85 (5.1%) |
| 10:00 AM to 10:59 AM | 41 (2.1%) | 248 (15.0%) |
| 11:00 AM to 11:59 AM | 18 (0.9%) | 27 (1.6%) |
| 12:00 PM to 3:59 PM | 75 (3.8%) | 97 (5.9%) |
| 4:00 PM to 11:59 PM | 51 (2.6%) | 106 (6.4%) |
| Total | 1,961 (100.0%) | 1,649 (100.0%) |
Housing Occupancy in St Joseph
Occupancy by Ownership in St Joseph
Of the total 3,994 dwellings in St Joseph, owner-occupied units account for 2,485 (62.2%), while renter-occupied units make up 1,509 (37.8%).
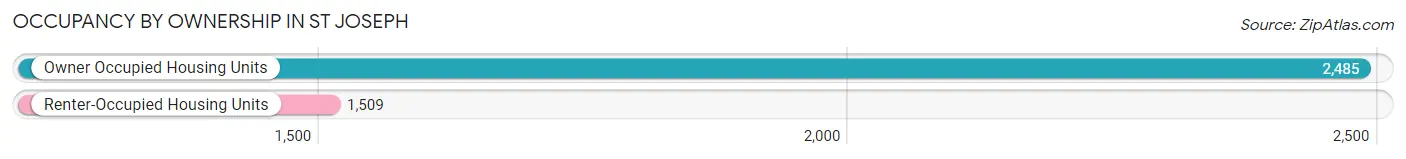
| Occupancy | # Housing Units | % Housing Units |
| Owner Occupied Housing Units | 2,485 | 62.2% |
| Renter-Occupied Housing Units | 1,509 | 37.8% |
| Total Occupied Housing Units | 3,994 | 100.0% |
Occupancy by Household Size in St Joseph
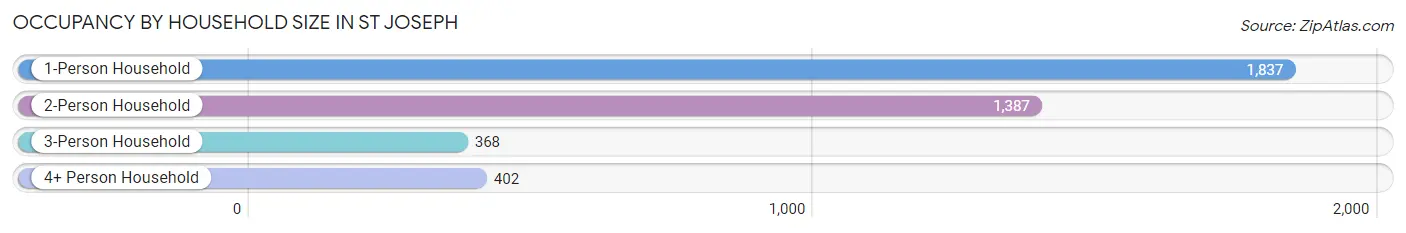
| Household Size | # Housing Units | % Housing Units |
| 1-Person Household | 1,837 | 46.0% |
| 2-Person Household | 1,387 | 34.7% |
| 3-Person Household | 368 | 9.2% |
| 4+ Person Household | 402 | 10.1% |
| Total Housing Units | 3,994 | 100.0% |
Occupancy by Ownership by Household Size in St Joseph
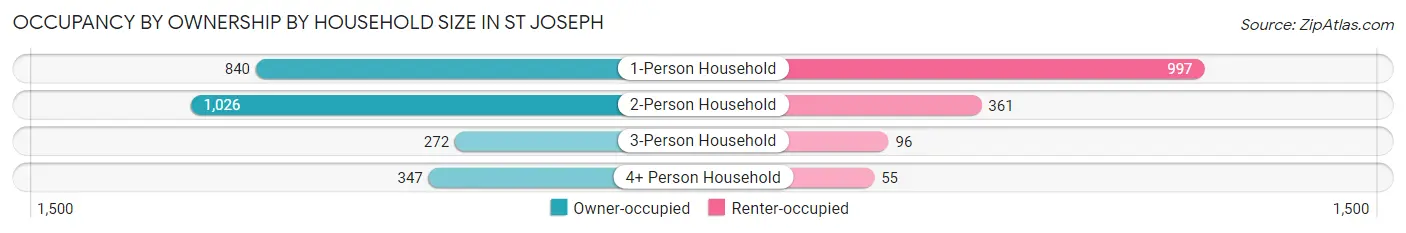
| Household Size | Owner-occupied | Renter-occupied |
| 1-Person Household | 840 (45.7%) | 997 (54.3%) |
| 2-Person Household | 1,026 (74.0%) | 361 (26.0%) |
| 3-Person Household | 272 (73.9%) | 96 (26.1%) |
| 4+ Person Household | 347 (86.3%) | 55 (13.7%) |
| Total Housing Units | 2,485 (62.2%) | 1,509 (37.8%) |
Occupancy by Educational Attainment in St Joseph
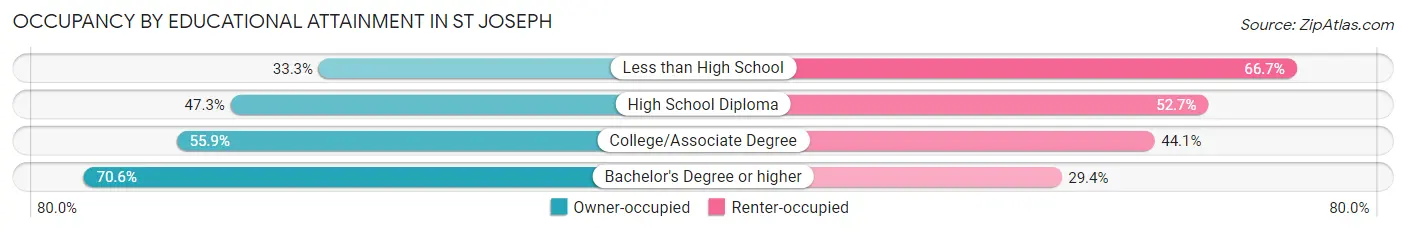
| Household Size | Owner-occupied | Renter-occupied |
| Less than High School | 23 (33.3%) | 46 (66.7%) |
| High School Diploma | 282 (47.3%) | 314 (52.7%) |
| College/Associate Degree | 650 (55.9%) | 513 (44.1%) |
| Bachelor's Degree or higher | 1,530 (70.6%) | 636 (29.4%) |
Occupancy by Age of Householder in St Joseph
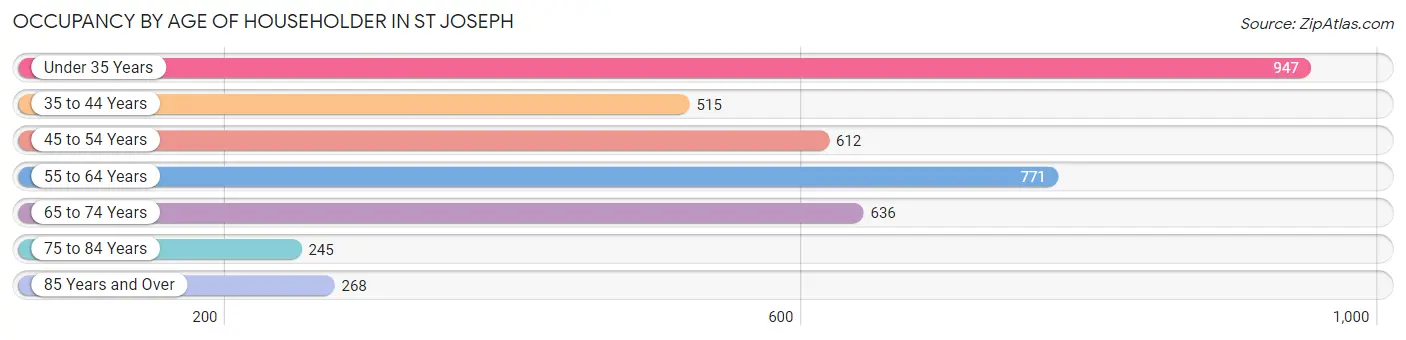
| Age Bracket | # Households | % Households |
| Under 35 Years | 947 | 23.7% |
| 35 to 44 Years | 515 | 12.9% |
| 45 to 54 Years | 612 | 15.3% |
| 55 to 64 Years | 771 | 19.3% |
| 65 to 74 Years | 636 | 15.9% |
| 75 to 84 Years | 245 | 6.1% |
| 85 Years and Over | 268 | 6.7% |
| Total | 3,994 | 100.0% |
Housing Finances in St Joseph
Median Income by Occupancy in St Joseph
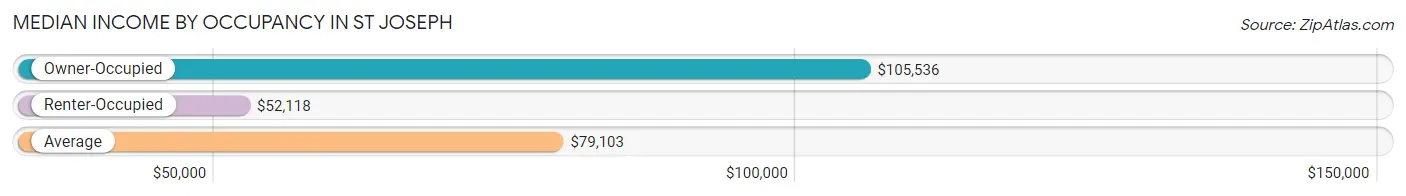
| Occupancy Type | # Households | Median Income |
| Owner-Occupied | 2,485 (62.2%) | $105,536 |
| Renter-Occupied | 1,509 (37.8%) | $52,118 |
| Average | 3,994 (100.0%) | $79,103 |
Occupancy by Householder Income Bracket in St Joseph
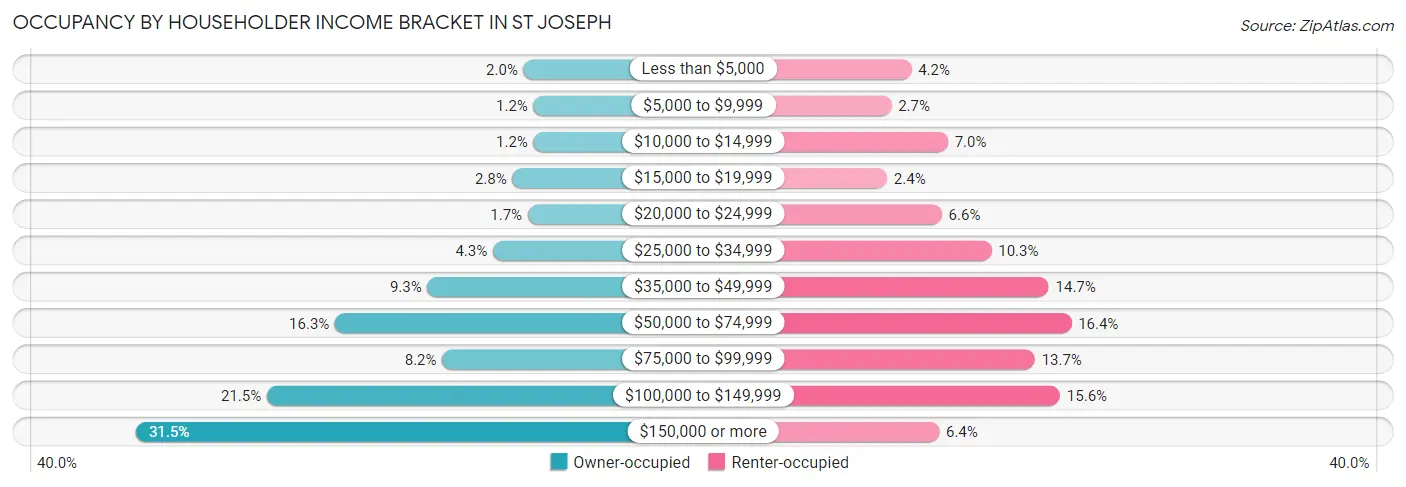
| Income Bracket | Owner-occupied | Renter-occupied |
| Less than $5,000 | 49 (2.0%) | 64 (4.2%) |
| $5,000 to $9,999 | 30 (1.2%) | 41 (2.7%) |
| $10,000 to $14,999 | 30 (1.2%) | 106 (7.0%) |
| $15,000 to $19,999 | 70 (2.8%) | 36 (2.4%) |
| $20,000 to $24,999 | 41 (1.7%) | 99 (6.6%) |
| $25,000 to $34,999 | 107 (4.3%) | 156 (10.3%) |
| $35,000 to $49,999 | 231 (9.3%) | 222 (14.7%) |
| $50,000 to $74,999 | 406 (16.3%) | 248 (16.4%) |
| $75,000 to $99,999 | 203 (8.2%) | 206 (13.7%) |
| $100,000 to $149,999 | 535 (21.5%) | 235 (15.6%) |
| $150,000 or more | 783 (31.5%) | 96 (6.4%) |
| Total | 2,485 (100.0%) | 1,509 (100.0%) |
Monthly Housing Cost Tiers in St Joseph
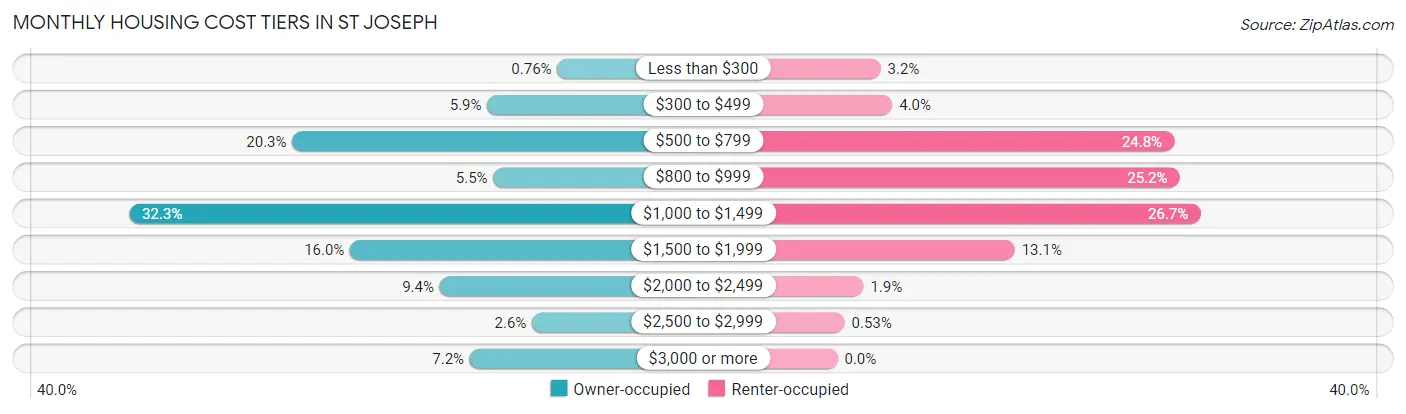
| Monthly Cost | Owner-occupied | Renter-occupied |
| Less than $300 | 19 (0.8%) | 48 (3.2%) |
| $300 to $499 | 147 (5.9%) | 61 (4.0%) |
| $500 to $799 | 504 (20.3%) | 374 (24.8%) |
| $800 to $999 | 136 (5.5%) | 380 (25.2%) |
| $1,000 to $1,499 | 803 (32.3%) | 403 (26.7%) |
| $1,500 to $1,999 | 398 (16.0%) | 197 (13.1%) |
| $2,000 to $2,499 | 234 (9.4%) | 29 (1.9%) |
| $2,500 to $2,999 | 65 (2.6%) | 8 (0.5%) |
| $3,000 or more | 179 (7.2%) | 0 (0.0%) |
| Total | 2,485 (100.0%) | 1,509 (100.0%) |
Physical Housing Characteristics in St Joseph
Housing Structures in St Joseph
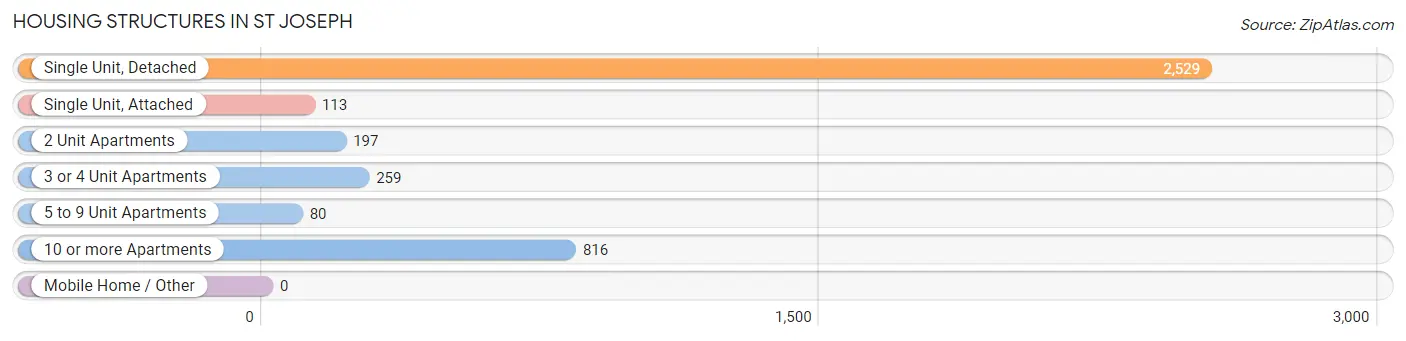
| Structure Type | # Housing Units | % Housing Units |
| Single Unit, Detached | 2,529 | 63.3% |
| Single Unit, Attached | 113 | 2.8% |
| 2 Unit Apartments | 197 | 4.9% |
| 3 or 4 Unit Apartments | 259 | 6.5% |
| 5 to 9 Unit Apartments | 80 | 2.0% |
| 10 or more Apartments | 816 | 20.4% |
| Mobile Home / Other | 0 | 0.0% |
| Total | 3,994 | 100.0% |
Housing Structures by Occupancy in St Joseph
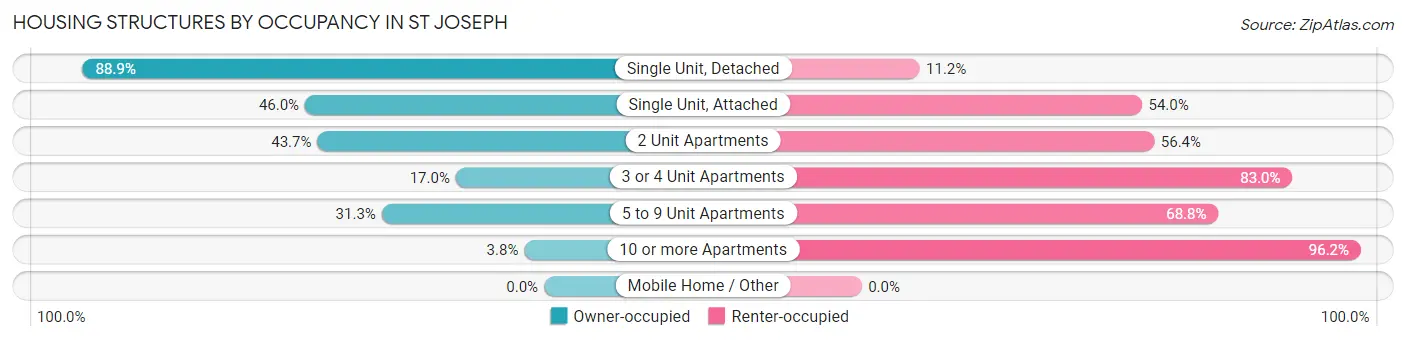
| Structure Type | Owner-occupied | Renter-occupied |
| Single Unit, Detached | 2,247 (88.8%) | 282 (11.2%) |
| Single Unit, Attached | 52 (46.0%) | 61 (54.0%) |
| 2 Unit Apartments | 86 (43.6%) | 111 (56.4%) |
| 3 or 4 Unit Apartments | 44 (17.0%) | 215 (83.0%) |
| 5 to 9 Unit Apartments | 25 (31.2%) | 55 (68.8%) |
| 10 or more Apartments | 31 (3.8%) | 785 (96.2%) |
| Mobile Home / Other | 0 (0.0%) | 0 (0.0%) |
| Total | 2,485 (62.2%) | 1,509 (37.8%) |
Housing Structures by Number of Rooms in St Joseph
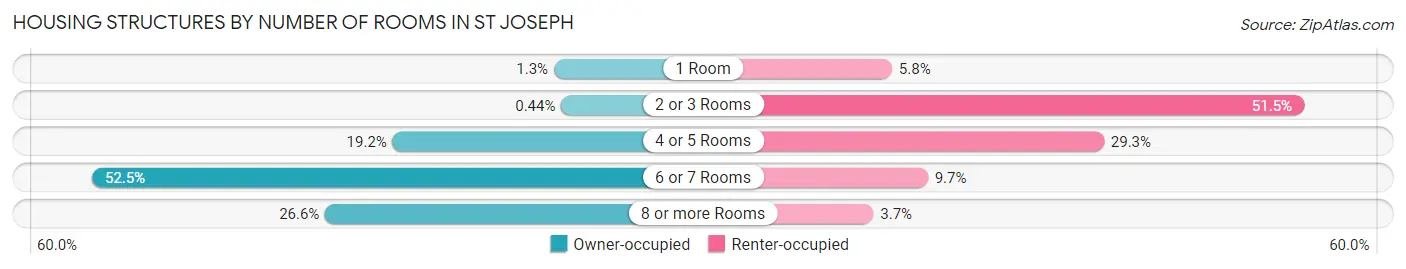
| Number of Rooms | Owner-occupied | Renter-occupied |
| 1 Room | 31 (1.3%) | 87 (5.8%) |
| 2 or 3 Rooms | 11 (0.4%) | 777 (51.5%) |
| 4 or 5 Rooms | 476 (19.2%) | 442 (29.3%) |
| 6 or 7 Rooms | 1,305 (52.5%) | 147 (9.7%) |
| 8 or more Rooms | 662 (26.6%) | 56 (3.7%) |
| Total | 2,485 (100.0%) | 1,509 (100.0%) |
Housing Structure by Heating Type in St Joseph
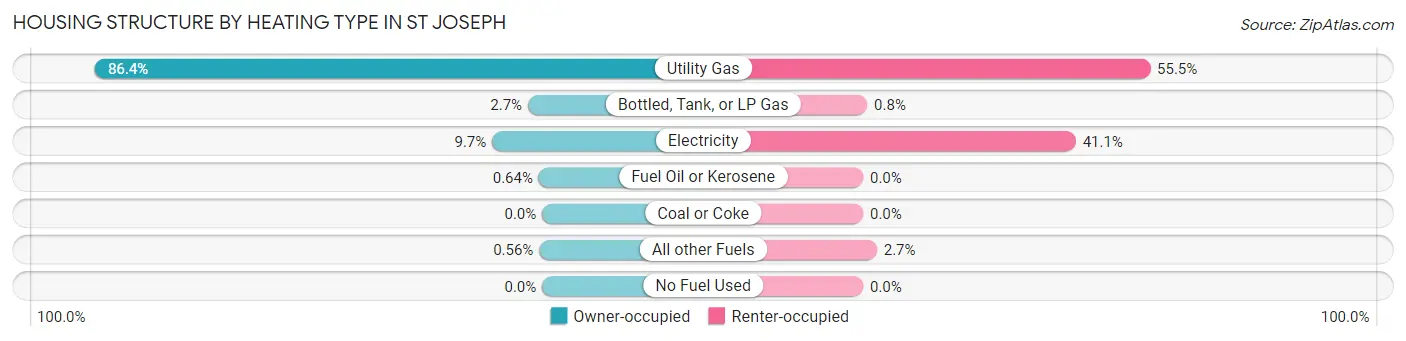
| Heating Type | Owner-occupied | Renter-occupied |
| Utility Gas | 2,147 (86.4%) | 837 (55.5%) |
| Bottled, Tank, or LP Gas | 68 (2.7%) | 12 (0.8%) |
| Electricity | 240 (9.7%) | 620 (41.1%) |
| Fuel Oil or Kerosene | 16 (0.6%) | 0 (0.0%) |
| Coal or Coke | 0 (0.0%) | 0 (0.0%) |
| All other Fuels | 14 (0.6%) | 40 (2.6%) |
| No Fuel Used | 0 (0.0%) | 0 (0.0%) |
| Total | 2,485 (100.0%) | 1,509 (100.0%) |
Household Vehicle Usage in St Joseph
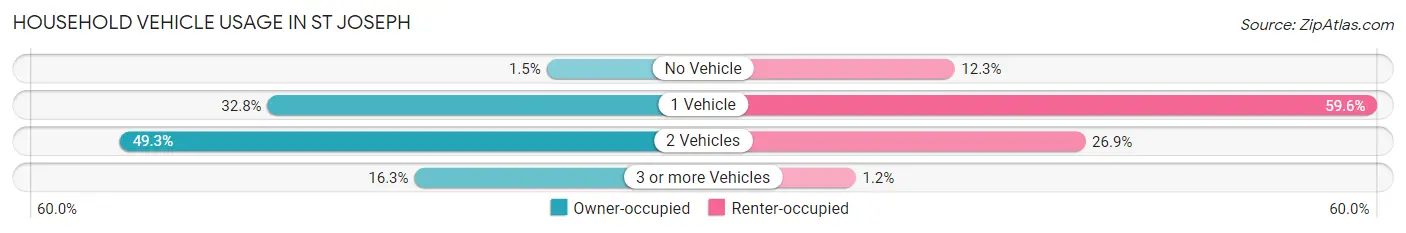
| Vehicles per Household | Owner-occupied | Renter-occupied |
| No Vehicle | 38 (1.5%) | 185 (12.3%) |
| 1 Vehicle | 815 (32.8%) | 900 (59.6%) |
| 2 Vehicles | 1,226 (49.3%) | 406 (26.9%) |
| 3 or more Vehicles | 406 (16.3%) | 18 (1.2%) |
| Total | 2,485 (100.0%) | 1,509 (100.0%) |
Real Estate & Mortgages in St Joseph
Real Estate and Mortgage Overview in St Joseph
| Characteristic | Without Mortgage | With Mortgage |
| Housing Units | 872 | 1,613 |
| Median Property Value | $273,200 | $245,100 |
| Median Household Income | $83,611 | $530 |
| Monthly Housing Costs | $657 | $164 |
| Real Estate Taxes | $3,925 | $23 |
Property Value by Mortgage Status in St Joseph
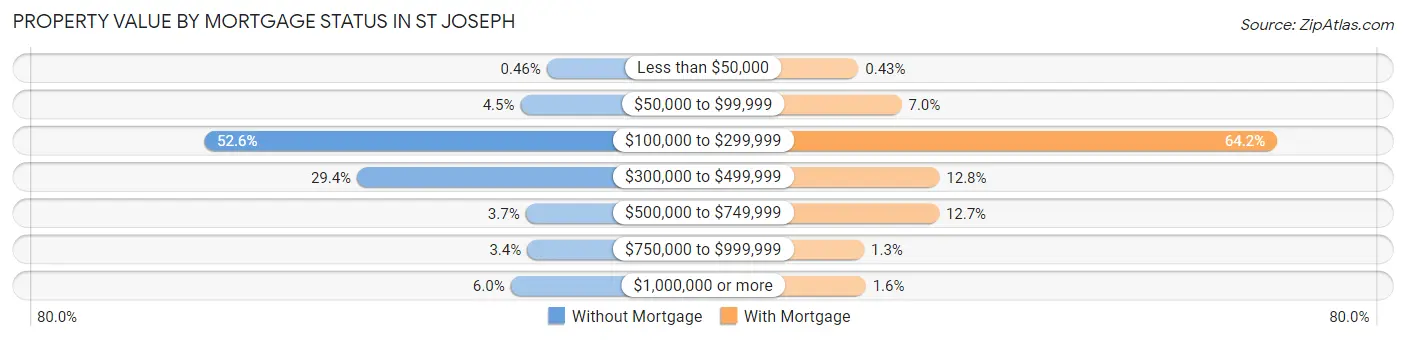
| Property Value | Without Mortgage | With Mortgage |
| Less than $50,000 | 4 (0.5%) | 7 (0.4%) |
| $50,000 to $99,999 | 39 (4.5%) | 113 (7.0%) |
| $100,000 to $299,999 | 459 (52.6%) | 1,036 (64.2%) |
| $300,000 to $499,999 | 256 (29.4%) | 206 (12.8%) |
| $500,000 to $749,999 | 32 (3.7%) | 205 (12.7%) |
| $750,000 to $999,999 | 30 (3.4%) | 21 (1.3%) |
| $1,000,000 or more | 52 (6.0%) | 25 (1.5%) |
| Total | 872 (100.0%) | 1,613 (100.0%) |
Household Income by Mortgage Status in St Joseph
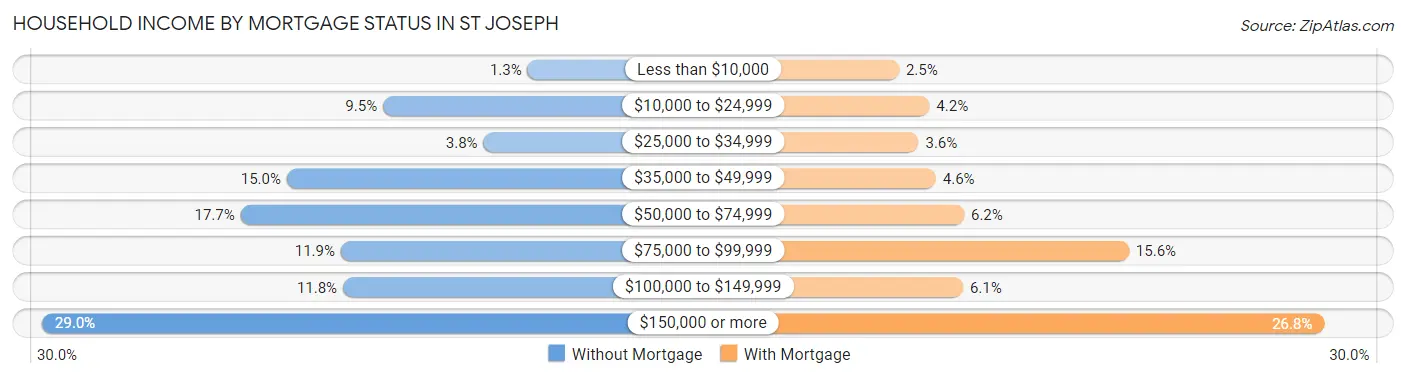
| Household Income | Without Mortgage | With Mortgage |
| Less than $10,000 | 11 (1.3%) | 40 (2.5%) |
| $10,000 to $24,999 | 83 (9.5%) | 68 (4.2%) |
| $25,000 to $34,999 | 33 (3.8%) | 58 (3.6%) |
| $35,000 to $49,999 | 131 (15.0%) | 74 (4.6%) |
| $50,000 to $74,999 | 154 (17.7%) | 100 (6.2%) |
| $75,000 to $99,999 | 104 (11.9%) | 252 (15.6%) |
| $100,000 to $149,999 | 103 (11.8%) | 99 (6.1%) |
| $150,000 or more | 253 (29.0%) | 432 (26.8%) |
| Total | 872 (100.0%) | 1,613 (100.0%) |
Property Value to Household Income Ratio in St Joseph
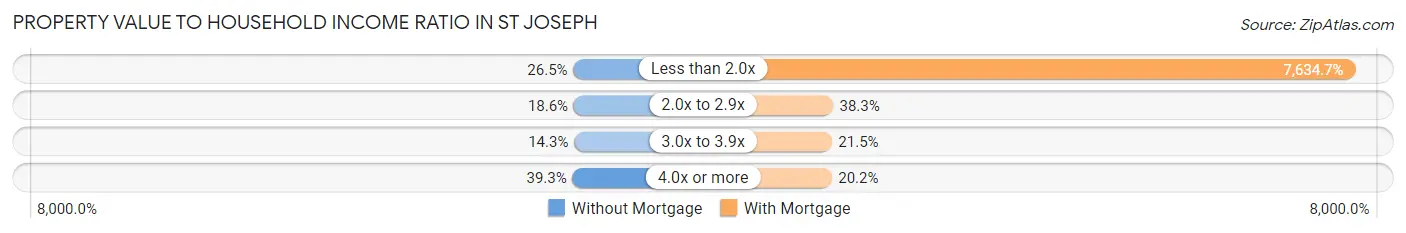
| Value-to-Income Ratio | Without Mortgage | With Mortgage |
| Less than 2.0x | 231 (26.5%) | 123,147 (7,634.7%) |
| 2.0x to 2.9x | 162 (18.6%) | 617 (38.3%) |
| 3.0x to 3.9x | 125 (14.3%) | 347 (21.5%) |
| 4.0x or more | 343 (39.3%) | 325 (20.2%) |
| Total | 872 (100.0%) | 1,613 (100.0%) |
Real Estate Taxes by Mortgage Status in St Joseph
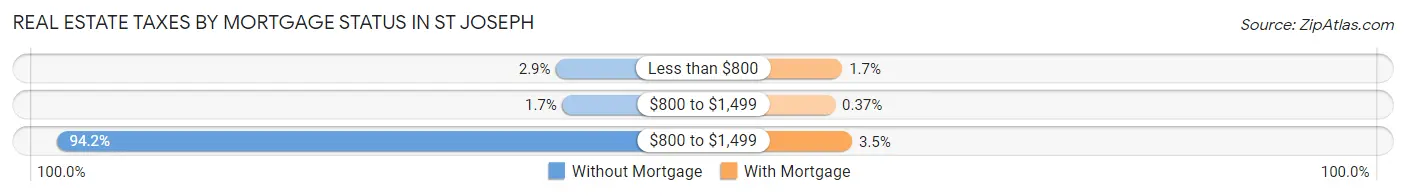
| Property Taxes | Without Mortgage | With Mortgage |
| Less than $800 | 25 (2.9%) | 27 (1.7%) |
| $800 to $1,499 | 15 (1.7%) | 6 (0.4%) |
| $800 to $1,499 | 821 (94.2%) | 56 (3.5%) |
| Total | 872 (100.0%) | 1,613 (100.0%) |
Health & Disability in St Joseph
Health Insurance Coverage by Age in St Joseph
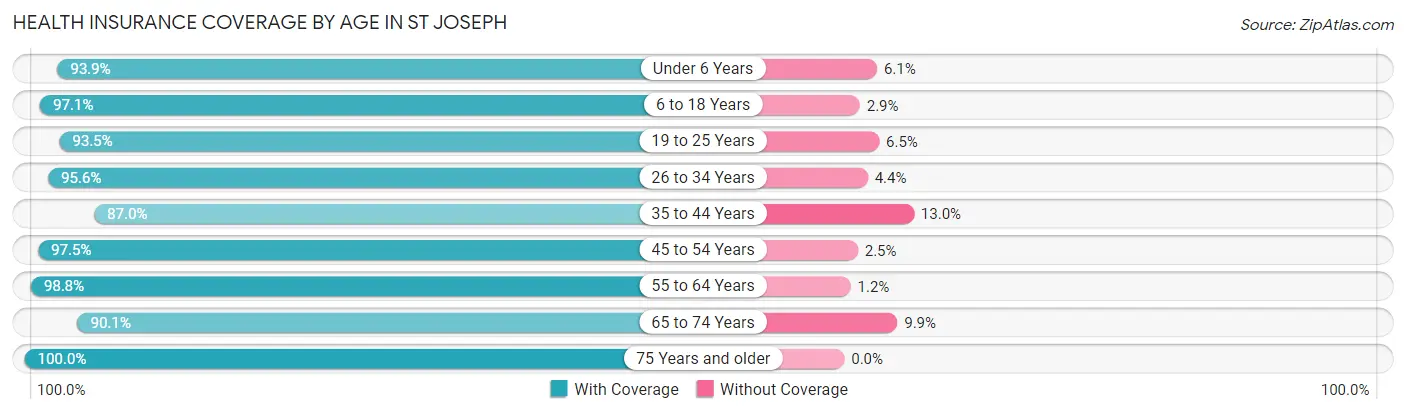
| Age Bracket | With Coverage | Without Coverage |
| Under 6 Years | 431 (93.9%) | 28 (6.1%) |
| 6 to 18 Years | 672 (97.1%) | 20 (2.9%) |
| 19 to 25 Years | 663 (93.5%) | 46 (6.5%) |
| 26 to 34 Years | 897 (95.6%) | 41 (4.4%) |
| 35 to 44 Years | 771 (87.0%) | 115 (13.0%) |
| 45 to 54 Years | 929 (97.5%) | 24 (2.5%) |
| 55 to 64 Years | 1,085 (98.8%) | 13 (1.2%) |
| 65 to 74 Years | 894 (90.1%) | 98 (9.9%) |
| 75 Years and older | 734 (100.0%) | 0 (0.0%) |
| Total | 7,076 (94.8%) | 385 (5.2%) |
Health Insurance Coverage by Citizenship Status in St Joseph
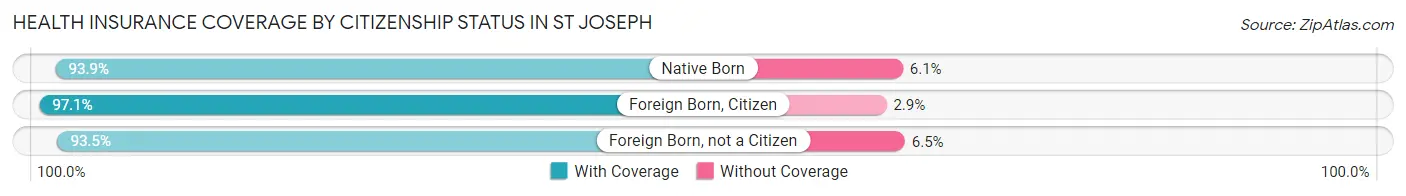
| Citizenship Status | With Coverage | Without Coverage |
| Native Born | 431 (93.9%) | 28 (6.1%) |
| Foreign Born, Citizen | 672 (97.1%) | 20 (2.9%) |
| Foreign Born, not a Citizen | 663 (93.5%) | 46 (6.5%) |
Health Insurance Coverage by Household Income in St Joseph
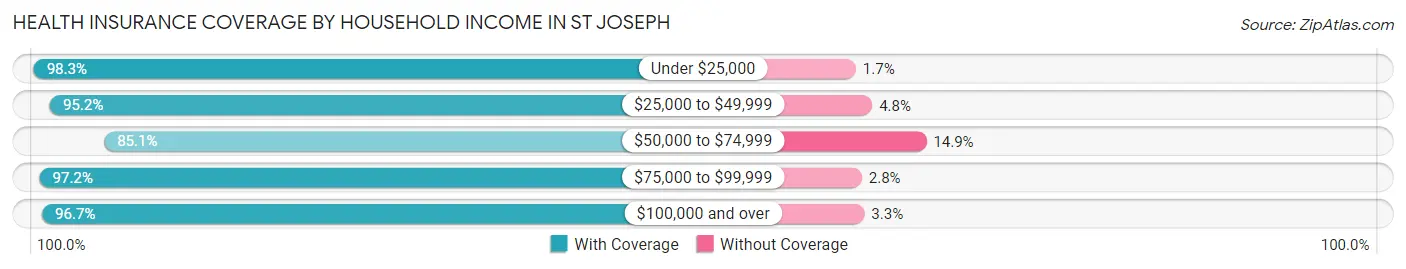
| Household Income | With Coverage | Without Coverage |
| Under $25,000 | 632 (98.3%) | 11 (1.7%) |
| $25,000 to $49,999 | 800 (95.2%) | 40 (4.8%) |
| $50,000 to $74,999 | 1,015 (85.1%) | 178 (14.9%) |
| $75,000 to $99,999 | 725 (97.2%) | 21 (2.8%) |
| $100,000 and over | 3,895 (96.7%) | 133 (3.3%) |
Public vs Private Health Insurance Coverage by Age in St Joseph
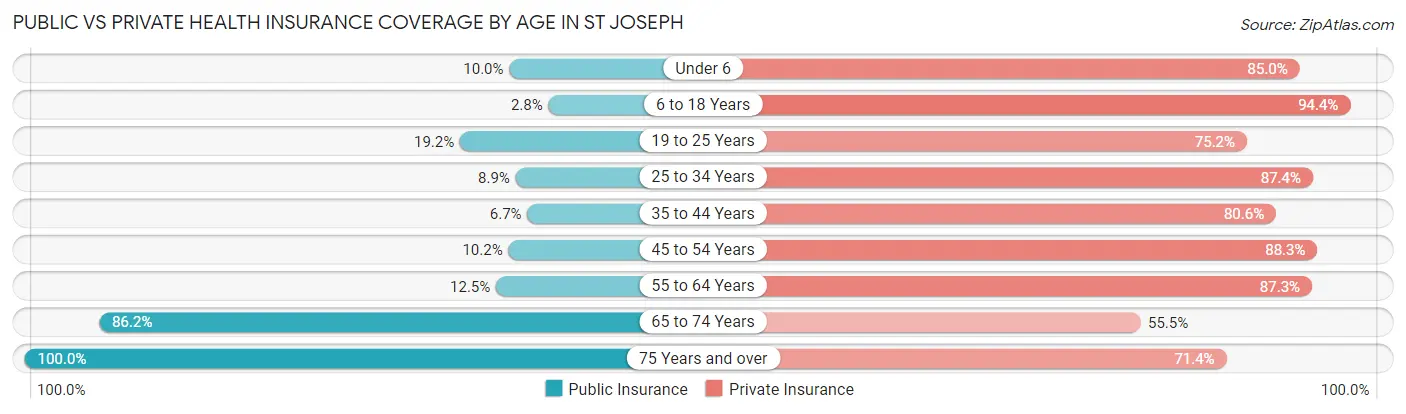
| Age Bracket | Public Insurance | Private Insurance |
| Under 6 | 46 (10.0%) | 390 (85.0%) |
| 6 to 18 Years | 19 (2.8%) | 653 (94.4%) |
| 19 to 25 Years | 136 (19.2%) | 533 (75.2%) |
| 25 to 34 Years | 83 (8.8%) | 820 (87.4%) |
| 35 to 44 Years | 59 (6.7%) | 714 (80.6%) |
| 45 to 54 Years | 97 (10.2%) | 841 (88.2%) |
| 55 to 64 Years | 137 (12.5%) | 958 (87.3%) |
| 65 to 74 Years | 855 (86.2%) | 551 (55.5%) |
| 75 Years and over | 734 (100.0%) | 524 (71.4%) |
| Total | 2,166 (29.0%) | 5,984 (80.2%) |
Disability Status by Sex by Age in St Joseph
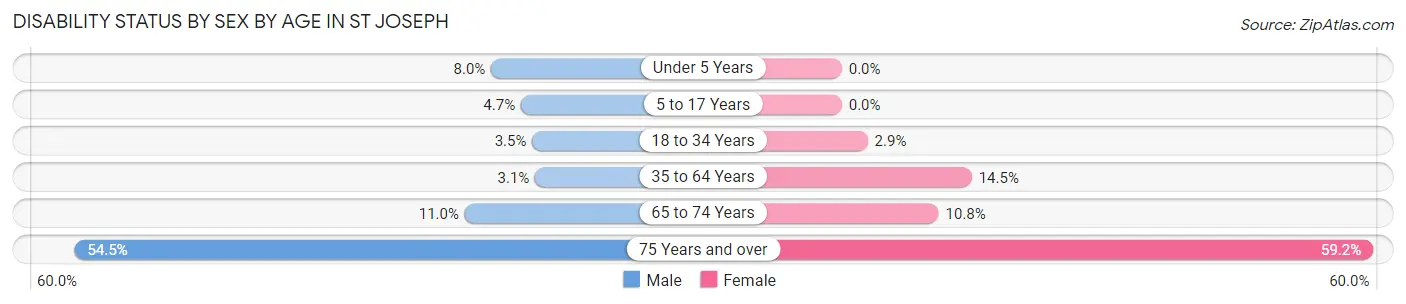
| Age Bracket | Male | Female |
| Under 5 Years | 9 (8.0%) | 0 (0.0%) |
| 5 to 17 Years | 21 (4.7%) | 0 (0.0%) |
| 18 to 34 Years | 28 (3.5%) | 25 (2.9%) |
| 35 to 64 Years | 46 (3.1%) | 213 (14.5%) |
| 65 to 74 Years | 57 (11.0%) | 51 (10.8%) |
| 75 Years and over | 153 (54.4%) | 268 (59.2%) |
Disability Class by Sex by Age in St Joseph
Disability Class: Hearing Difficulty
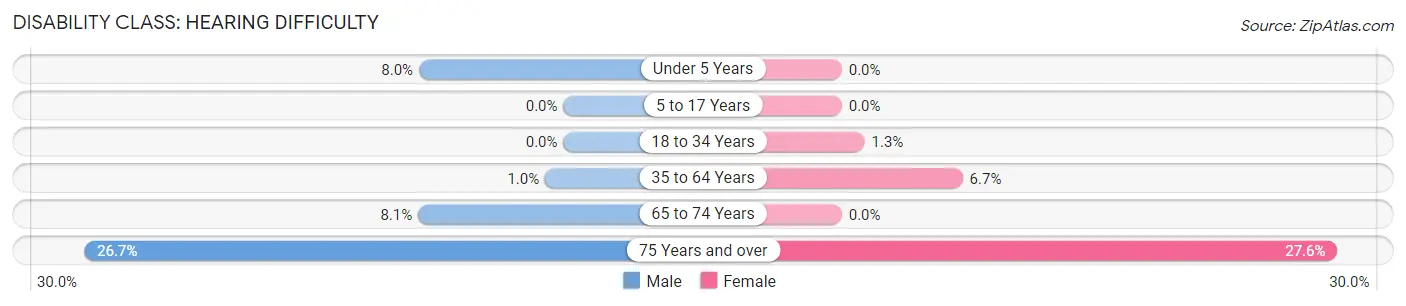
| Age Bracket | Male | Female |
| Under 5 Years | 9 (8.0%) | 0 (0.0%) |
| 5 to 17 Years | 0 (0.0%) | 0 (0.0%) |
| 18 to 34 Years | 0 (0.0%) | 11 (1.3%) |
| 35 to 64 Years | 15 (1.0%) | 99 (6.7%) |
| 65 to 74 Years | 42 (8.1%) | 0 (0.0%) |
| 75 Years and over | 75 (26.7%) | 125 (27.6%) |
Disability Class: Vision Difficulty
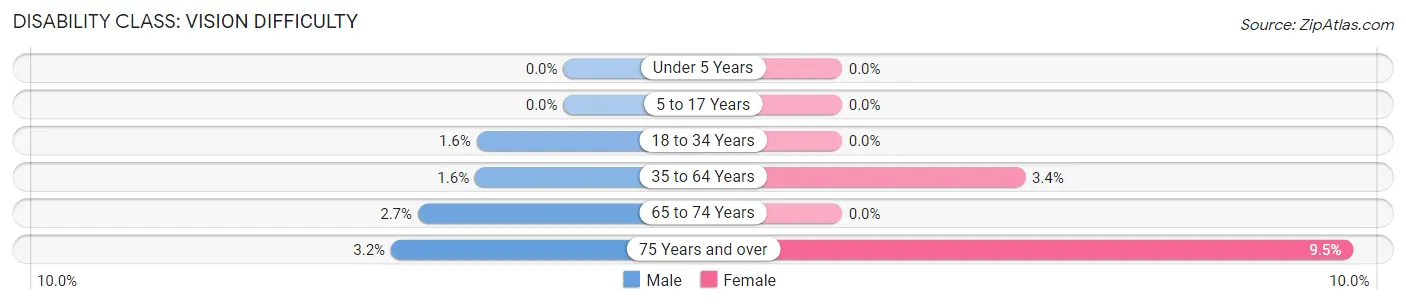
| Age Bracket | Male | Female |
| Under 5 Years | 0 (0.0%) | 0 (0.0%) |
| 5 to 17 Years | 0 (0.0%) | 0 (0.0%) |
| 18 to 34 Years | 13 (1.6%) | 0 (0.0%) |
| 35 to 64 Years | 24 (1.6%) | 50 (3.4%) |
| 65 to 74 Years | 14 (2.7%) | 0 (0.0%) |
| 75 Years and over | 9 (3.2%) | 43 (9.5%) |
Disability Class: Cognitive Difficulty
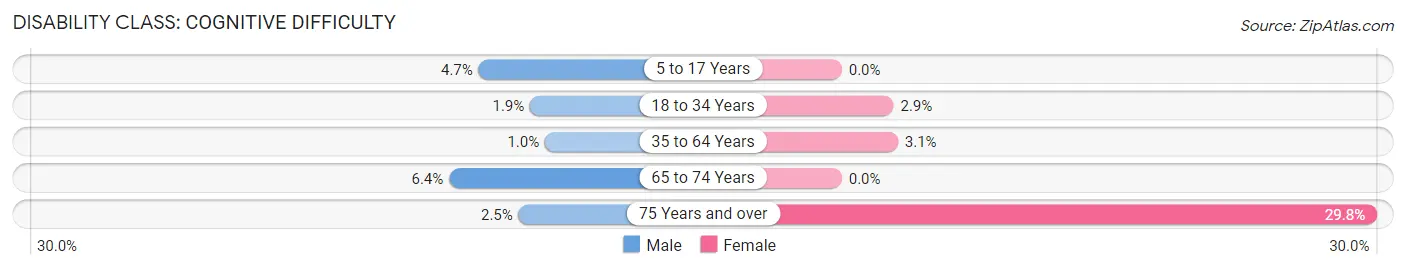
| Age Bracket | Male | Female |
| 5 to 17 Years | 21 (4.7%) | 0 (0.0%) |
| 18 to 34 Years | 15 (1.8%) | 25 (2.9%) |
| 35 to 64 Years | 15 (1.0%) | 46 (3.1%) |
| 65 to 74 Years | 33 (6.4%) | 0 (0.0%) |
| 75 Years and over | 7 (2.5%) | 135 (29.8%) |
Disability Class: Ambulatory Difficulty
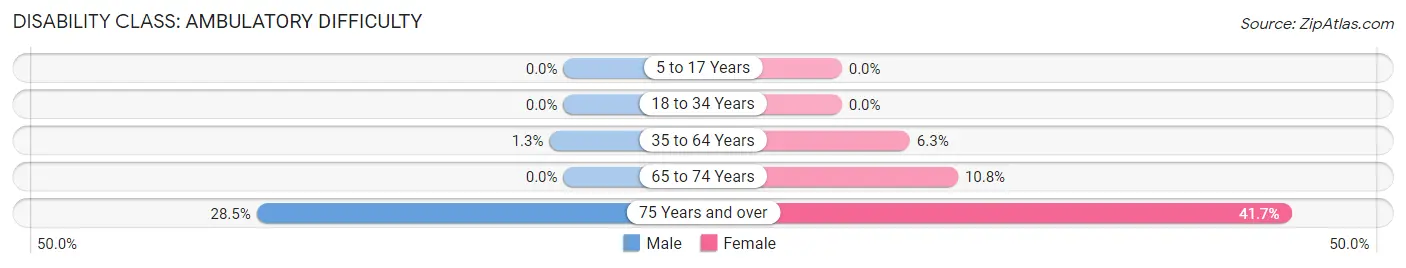
| Age Bracket | Male | Female |
| 5 to 17 Years | 0 (0.0%) | 0 (0.0%) |
| 18 to 34 Years | 0 (0.0%) | 0 (0.0%) |
| 35 to 64 Years | 19 (1.3%) | 93 (6.3%) |
| 65 to 74 Years | 0 (0.0%) | 51 (10.8%) |
| 75 Years and over | 80 (28.5%) | 189 (41.7%) |
Disability Class: Self-Care Difficulty
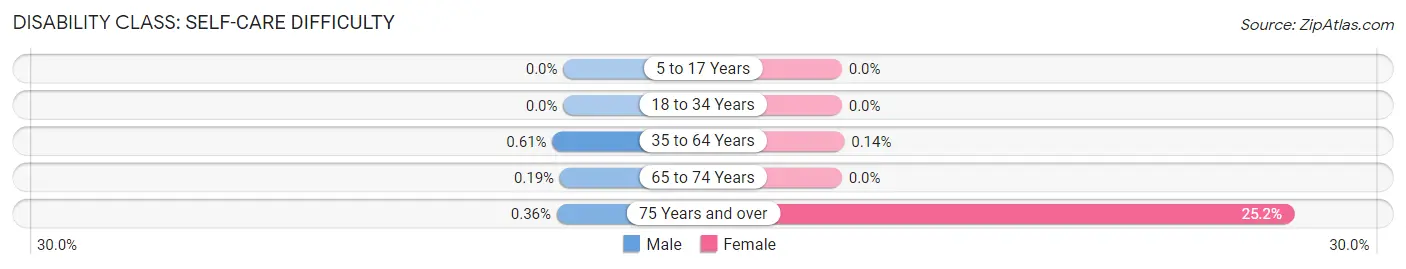
| Age Bracket | Male | Female |
| 5 to 17 Years | 0 (0.0%) | 0 (0.0%) |
| 18 to 34 Years | 0 (0.0%) | 0 (0.0%) |
| 35 to 64 Years | 9 (0.6%) | 2 (0.1%) |
| 65 to 74 Years | 1 (0.2%) | 0 (0.0%) |
| 75 Years and over | 1 (0.4%) | 114 (25.2%) |
Technology Access in St Joseph
Computing Device Access in St Joseph
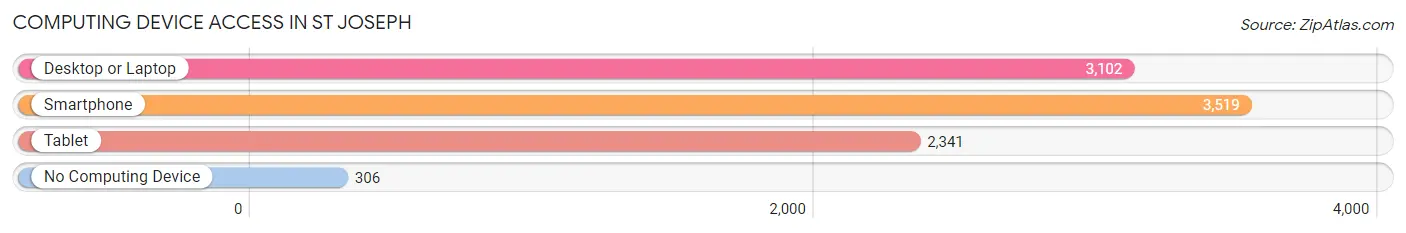
| Device Type | # Households | % Households |
| Desktop or Laptop | 3,102 | 77.7% |
| Smartphone | 3,519 | 88.1% |
| Tablet | 2,341 | 58.6% |
| No Computing Device | 306 | 7.7% |
| Total | 3,994 | 100.0% |
Internet Access in St Joseph
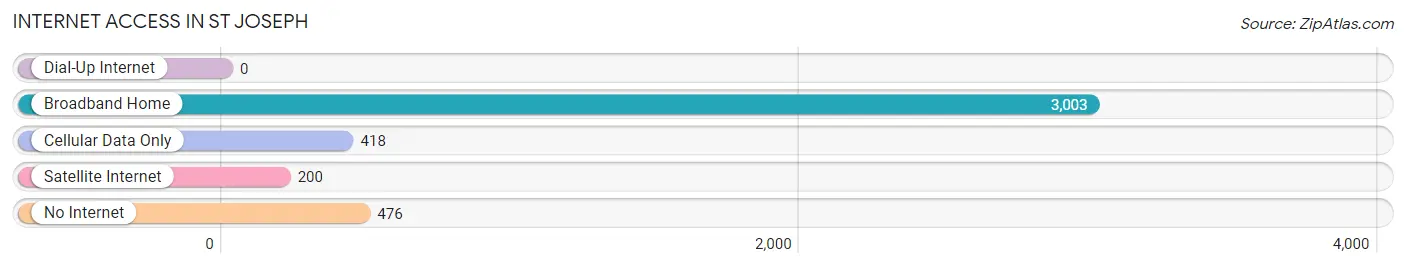
| Internet Type | # Households | % Households |
| Dial-Up Internet | 0 | 0.0% |
| Broadband Home | 3,003 | 75.2% |
| Cellular Data Only | 418 | 10.5% |
| Satellite Internet | 200 | 5.0% |
| No Internet | 476 | 11.9% |
| Total | 3,994 | 100.0% |
St Joseph Summary
St. Joseph, Michigan is a city located in Berrien County, Michigan, United States. It is situated on the shores of Lake Michigan, and is part of the larger metropolitan area of Southwestern Michigan. The city has a population of 8,365 as of the 2010 census, and is the county seat of Berrien County.
History
St. Joseph was first settled in 1834 by a group of settlers from New York. The city was named after the patron saint of the Catholic Church, St. Joseph. The city was incorporated in 1891, and has since grown to become the largest city in Berrien County.
The city has a long history of industry and commerce. In the late 19th century, the city was home to a number of lumber mills, and was a major port for the Great Lakes shipping industry. The city also had a thriving fishing industry, and was home to a number of canneries.
In the early 20th century, the city was home to a number of manufacturing plants, including a paper mill, a steel mill, and a number of automotive parts plants. The city was also home to a number of resorts, and was a popular destination for tourists.
Geography
St. Joseph is located in the southwestern corner of Michigan, on the shores of Lake Michigan. The city is situated on the St. Joseph River, which flows into the lake. The city is bordered by the cities of Benton Harbor to the north, and Stevensville to the south.
The city has a total area of 8.3 square miles, of which 8.2 square miles is land and 0.1 square miles is water. The city has a humid continental climate, with cold winters and hot, humid summers.
Economy
St. Joseph has a diverse economy, with a number of industries represented. The city is home to a number of manufacturing plants, including a paper mill, a steel mill, and a number of automotive parts plants. The city is also home to a number of retail stores, restaurants, and other businesses.
The city is also home to a number of resorts, and is a popular destination for tourists. The city is home to a number of marinas, and is a popular destination for boaters. The city is also home to a number of wineries, and is a popular destination for wine enthusiasts.
Demographics
As of the 2010 census, the city had a population of 8,365. The racial makeup of the city was 87.3% White, 8.2% African American, 0.4% Native American, 0.7% Asian, 0.1% Pacific Islander, 1.2% from other races, and 2.1% from two or more races. Hispanic or Latino of any race were 3.7% of the population.
The median income for a household in the city was $41,945, and the median income for a family was $50,945. The per capita income for the city was $21,945. About 11.3% of families and 14.2% of the population were below the poverty line, including 19.2% of those under age 18 and 8.2% of those age 65 or over.
Common Questions
What is Per Capita Income in St Joseph?
Per Capita income in St Joseph is $55,047.
What is the Median Family Income in St Joseph?
Median Family Income in St Joseph is $122,321.
What is the Median Household income in St Joseph?
Median Household Income in St Joseph is $79,103.
What is Income or Wage Gap in St Joseph?
Income or Wage Gap in St Joseph is 43.6%.
Women in St Joseph earn 56.4 cents for every dollar earned by a man.
What is Inequality or Gini Index in St Joseph?
Inequality or Gini Index in St Joseph is 0.46.
What is the Total Population of St Joseph?
Total Population of St Joseph is 7,852.
What is the Total Male Population of St Joseph?
Total Male Population of St Joseph is 3,917.
What is the Total Female Population of St Joseph?
Total Female Population of St Joseph is 3,935.
What is the Ratio of Males per 100 Females in St Joseph?
There are 99.54 Males per 100 Females in St Joseph.
What is the Ratio of Females per 100 Males in St Joseph?
There are 100.46 Females per 100 Males in St Joseph.
What is the Median Population Age in St Joseph?
Median Population Age in St Joseph is 45.1 Years.
What is the Average Family Size in St Joseph
Average Family Size in St Joseph is 2.7 People.
What is the Average Household Size in St Joseph
Average Household Size in St Joseph is 1.9 People.
How Large is the Labor Force in St Joseph?
There are 4,203 People in the Labor Forcein in St Joseph.
What is the Percentage of People in the Labor Force in St Joseph?
61.6% of People are in the Labor Force in St Joseph.
What is the Unemployment Rate in St Joseph?
Unemployment Rate in St Joseph is 1.4%.