Milford, MI Map & Demographics
Milford Map
Milford Overview
$51,555
PER CAPITA INCOME
$124,132
AVG FAMILY INCOME
$98,054
AVG HOUSEHOLD INCOME
48.4%
WAGE / INCOME GAP [ % ]
51.6¢/ $1
WAGE / INCOME GAP [ $ ]
0.44
INEQUALITY / GINI INDEX
6,483
TOTAL POPULATION
3,146
MALE POPULATION
3,337
FEMALE POPULATION
94.28
MALES / 100 FEMALES
106.07
FEMALES / 100 MALES
41.5
MEDIAN AGE
3.1
AVG FAMILY SIZE
2.5
AVG HOUSEHOLD SIZE
3,225
LABOR FORCE [ PEOPLE ]
63.6%
PERCENT IN LABOR FORCE
3.0%
UNEMPLOYMENT RATE
Income in Milford
Income Overview in Milford
Per Capita Income in Milford is $51,555, while median incomes of families and households are $124,132 and $98,054 respectively.
| Characteristic | Number | Measure |
| Per Capita Income | 6,483 | $51,555 |
| Median Family Income | 1,639 | $124,132 |
| Mean Family Income | 1,639 | $150,515 |
| Median Household Income | 2,616 | $98,054 |
| Mean Household Income | 2,616 | $125,885 |
| Income Deficit | 1,639 | $0 |
| Wage / Income Gap (%) | 6,483 | 48.41% |
| Wage / Income Gap ($) | 6,483 | 51.59¢ per $1 |
| Gini / Inequality Index | 6,483 | 0.44 |
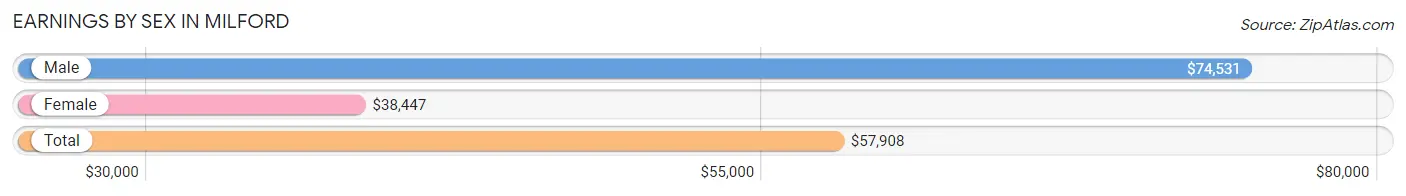
Earnings by Sex in Milford
Average Earnings in Milford are $57,908, $74,531 for men and $38,447 for women, a difference of 48.4%.
| Sex | Number | Average Earnings |
| Male | 1,815 (51.9%) | $74,531 |
| Female | 1,679 (48.0%) | $38,447 |
| Total | 3,494 (100.0%) | $57,908 |
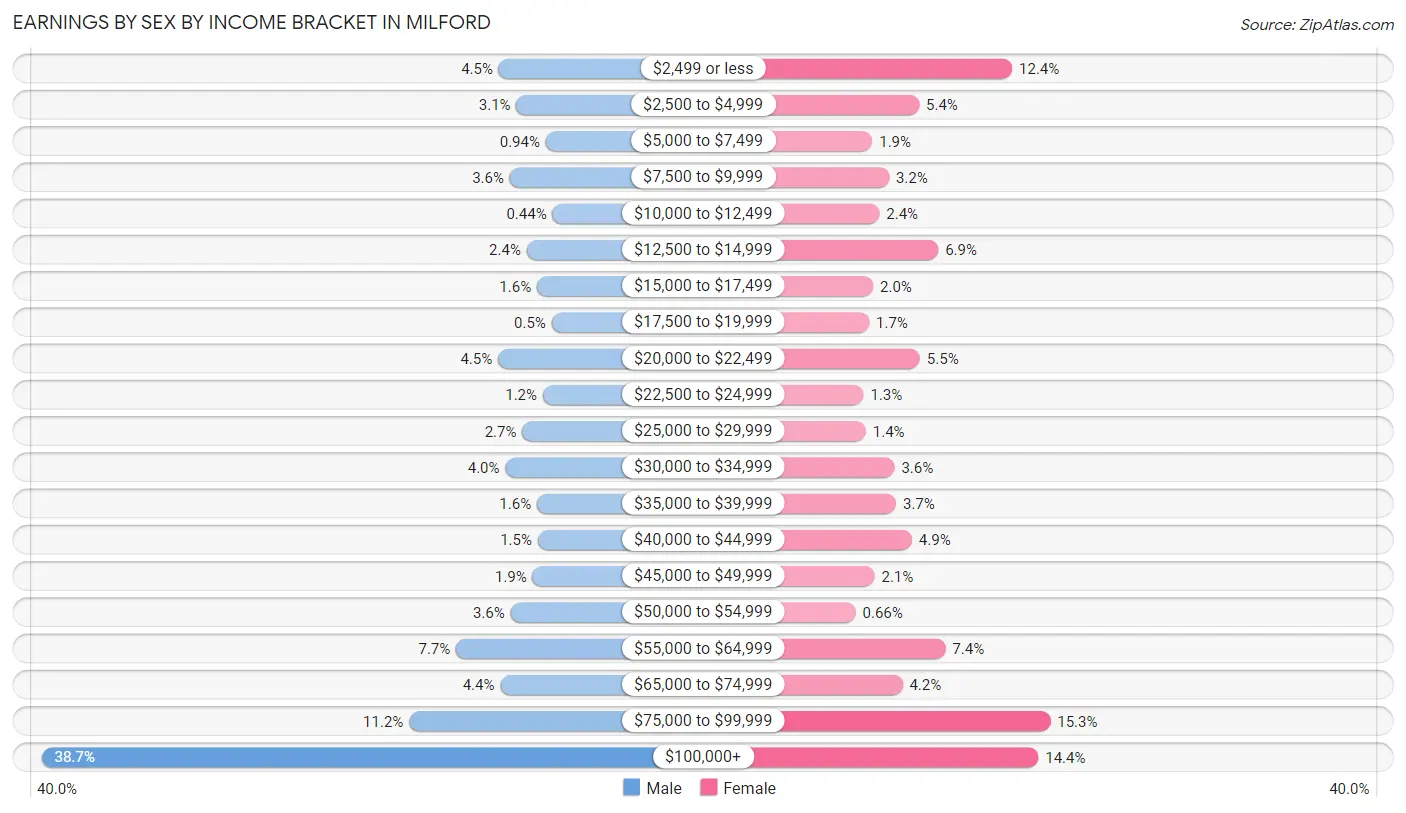
Earnings by Sex by Income Bracket in Milford
The most common earnings brackets in Milford are $100,000+ for men (703 | 38.7%) and $75,000 to $99,999 for women (256 | 15.2%).
| Income | Male | Female |
| $2,499 or less | 81 (4.5%) | 208 (12.4%) |
| $2,500 to $4,999 | 57 (3.1%) | 91 (5.4%) |
| $5,000 to $7,499 | 17 (0.9%) | 32 (1.9%) |
| $7,500 to $9,999 | 66 (3.6%) | 53 (3.2%) |
| $10,000 to $12,499 | 8 (0.4%) | 41 (2.4%) |
| $12,500 to $14,999 | 43 (2.4%) | 115 (6.9%) |
| $15,000 to $17,499 | 29 (1.6%) | 33 (2.0%) |
| $17,500 to $19,999 | 9 (0.5%) | 28 (1.7%) |
| $20,000 to $22,499 | 82 (4.5%) | 92 (5.5%) |
| $22,500 to $24,999 | 21 (1.2%) | 21 (1.3%) |
| $25,000 to $29,999 | 49 (2.7%) | 24 (1.4%) |
| $30,000 to $34,999 | 72 (4.0%) | 60 (3.6%) |
| $35,000 to $39,999 | 29 (1.6%) | 62 (3.7%) |
| $40,000 to $44,999 | 28 (1.5%) | 82 (4.9%) |
| $45,000 to $49,999 | 35 (1.9%) | 35 (2.1%) |
| $50,000 to $54,999 | 65 (3.6%) | 11 (0.7%) |
| $55,000 to $64,999 | 139 (7.7%) | 124 (7.4%) |
| $65,000 to $74,999 | 79 (4.3%) | 70 (4.2%) |
| $75,000 to $99,999 | 203 (11.2%) | 256 (15.2%) |
| $100,000+ | 703 (38.7%) | 241 (14.3%) |
| Total | 1,815 (100.0%) | 1,679 (100.0%) |
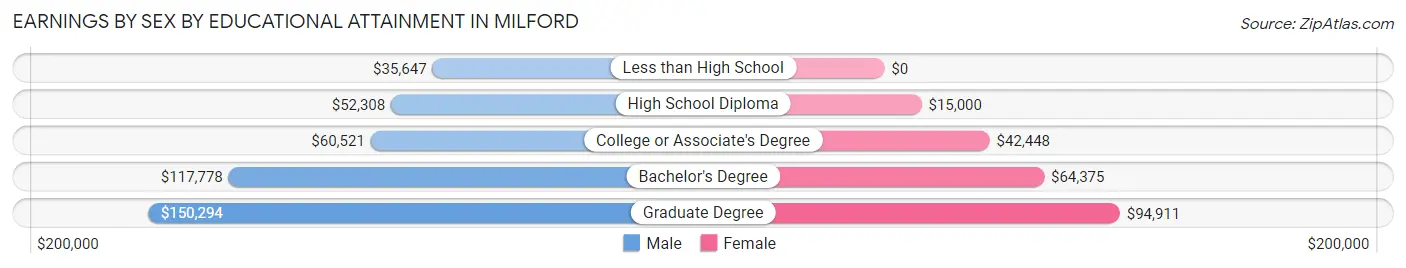
Earnings by Sex by Educational Attainment in Milford
Average earnings in Milford are $84,615 for men and $46,736 for women, a difference of 44.8%. Men with an educational attainment of graduate degree enjoy the highest average annual earnings of $150,294, while those with less than high school education earn the least with $35,647. Women with an educational attainment of graduate degree earn the most with the average annual earnings of $94,911, while those with high school diploma education have the smallest earnings of $15,000.
| Educational Attainment | Male Income | Female Income |
| Less than High School | $35,647 | $0 |
| High School Diploma | $52,308 | $15,000 |
| College or Associate's Degree | $60,521 | $42,448 |
| Bachelor's Degree | $117,778 | $64,375 |
| Graduate Degree | $150,294 | $94,911 |
| Total | $84,615 | $46,736 |
Family Income in Milford
Family Income Brackets in Milford
According to the Milford family income data, there are 426 families falling into the $200,000+ income range, which is the most common income bracket and makes up 26.0% of all families. Conversely, the $25,000 to $34,999 income bracket is the least frequent group with only 20 families (1.2%) belonging to this category.
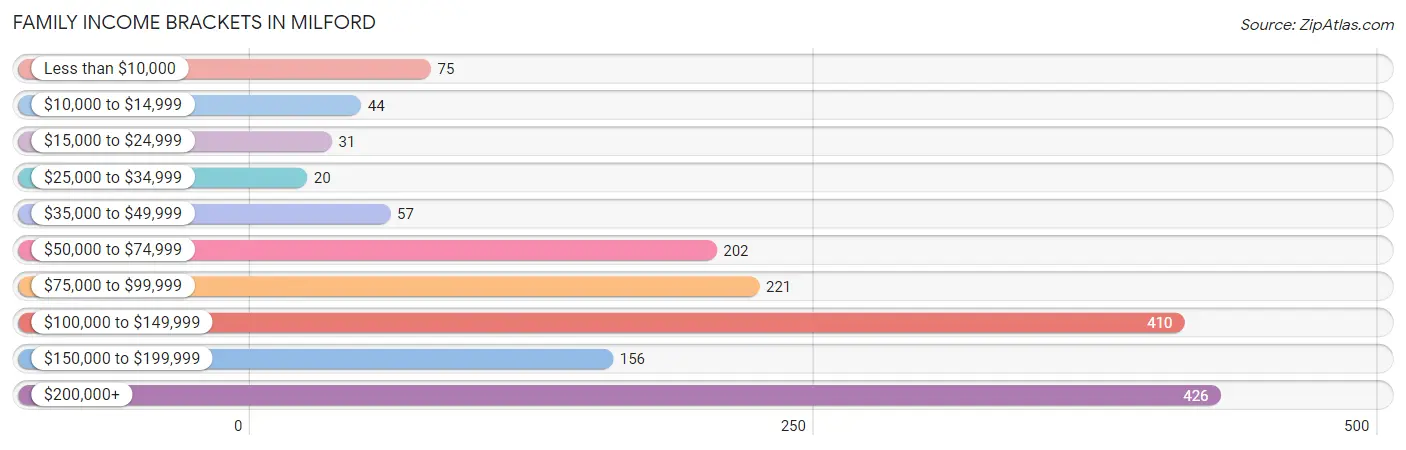
| Income Bracket | # Families | % Families |
| Less than $10,000 | 75 | 4.6% |
| $10,000 to $14,999 | 44 | 2.7% |
| $15,000 to $24,999 | 31 | 1.9% |
| $25,000 to $34,999 | 20 | 1.2% |
| $35,000 to $49,999 | 57 | 3.5% |
| $50,000 to $74,999 | 202 | 12.3% |
| $75,000 to $99,999 | 221 | 13.5% |
| $100,000 to $149,999 | 410 | 25.0% |
| $150,000 to $199,999 | 156 | 9.5% |
| $200,000+ | 426 | 26.0% |
Family Income by Famaliy Size in Milford
5-person families (245 | 14.9%) account for the highest median family income in Milford with $156,750 per family, while 2-person families (736 | 44.9%) have the highest median income of $49,375 per family member.
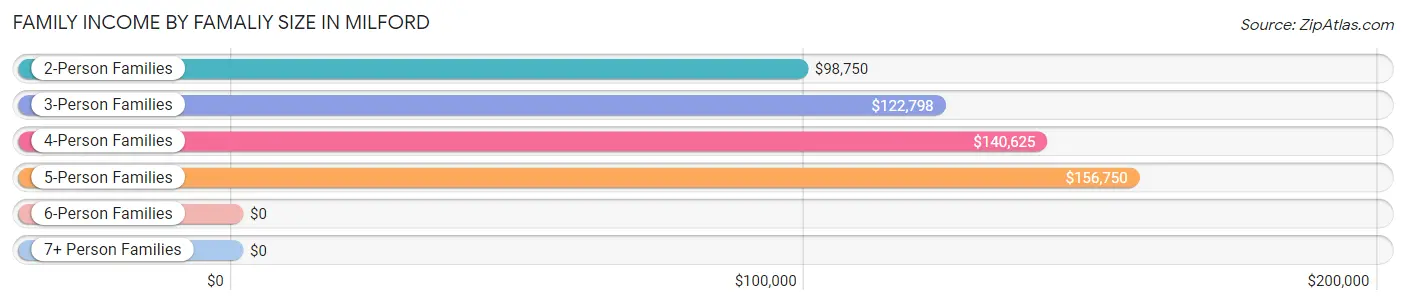
| Income Bracket | # Families | Median Income |
| 2-Person Families | 736 (44.9%) | $98,750 |
| 3-Person Families | 311 (19.0%) | $122,798 |
| 4-Person Families | 340 (20.7%) | $140,625 |
| 5-Person Families | 245 (14.9%) | $156,750 |
| 6-Person Families | 7 (0.4%) | $0 |
| 7+ Person Families | 0 (0.0%) | $0 |
| Total | 1,639 (100.0%) | $124,132 |
Family Income by Number of Earners in Milford
The median family income in Milford is $124,132, with families comprising 3+ earners (293) having the highest median family income of $222,330, while families with no earners (285) have the lowest median family income of $54,632, accounting for 17.9% and 17.4% of families, respectively.
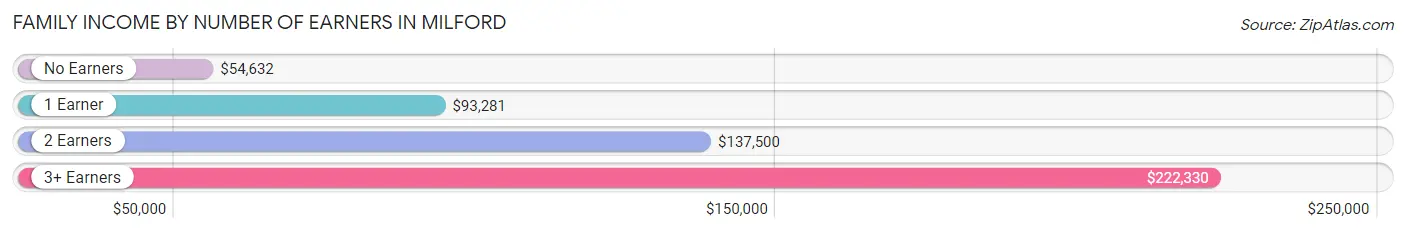
| Number of Earners | # Families | Median Income |
| No Earners | 285 (17.4%) | $54,632 |
| 1 Earner | 489 (29.8%) | $93,281 |
| 2 Earners | 572 (34.9%) | $137,500 |
| 3+ Earners | 293 (17.9%) | $222,330 |
| Total | 1,639 (100.0%) | $124,132 |
Household Income in Milford
Household Income Brackets in Milford
With 526 households falling in the category, the $200,000+ income range is the most frequent in Milford, accounting for 20.1% of all households. In contrast, only 26 households (1.0%) fall into the $10,000 to $14,999 income bracket, making it the least populous group.
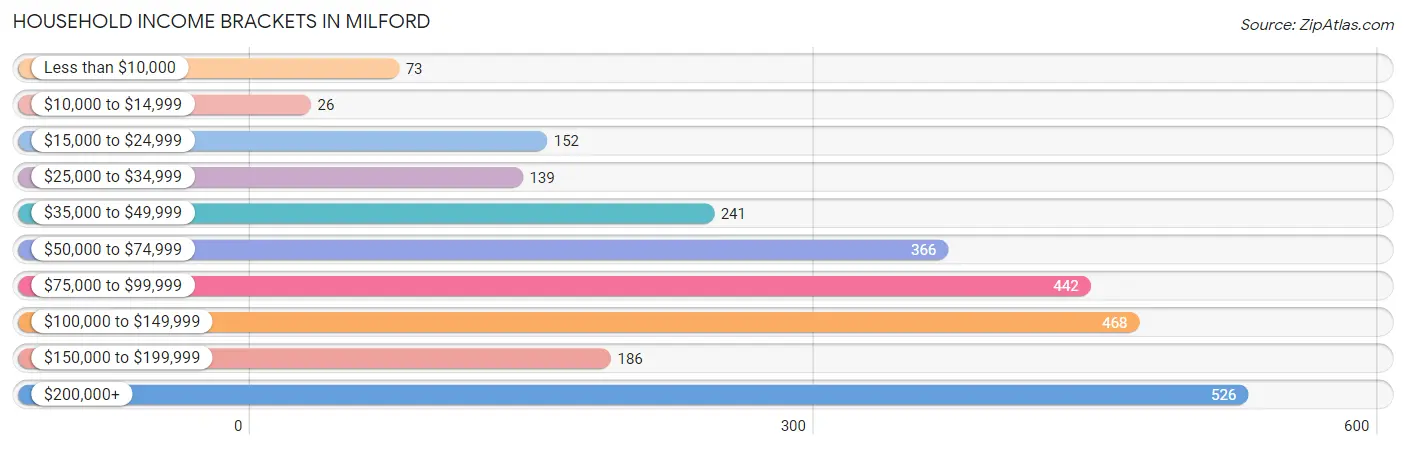
| Income Bracket | # Households | % Households |
| Less than $10,000 | 73 | 2.8% |
| $10,000 to $14,999 | 26 | 1.0% |
| $15,000 to $24,999 | 152 | 5.8% |
| $25,000 to $34,999 | 139 | 5.3% |
| $35,000 to $49,999 | 241 | 9.2% |
| $50,000 to $74,999 | 366 | 14.0% |
| $75,000 to $99,999 | 442 | 16.9% |
| $100,000 to $149,999 | 468 | 17.9% |
| $150,000 to $199,999 | 186 | 7.1% |
| $200,000+ | 526 | 20.1% |
Household Income by Householder Age in Milford
The median household income in Milford is $98,054, with the highest median household income of $123,988 found in the 45 to 64 years age bracket for the primary householder. A total of 1,121 households (42.8%) fall into this category. Meanwhile, the 15 to 24 years age bracket for the primary householder has the lowest median household income of $0, with 20 households (0.8%) in this group.
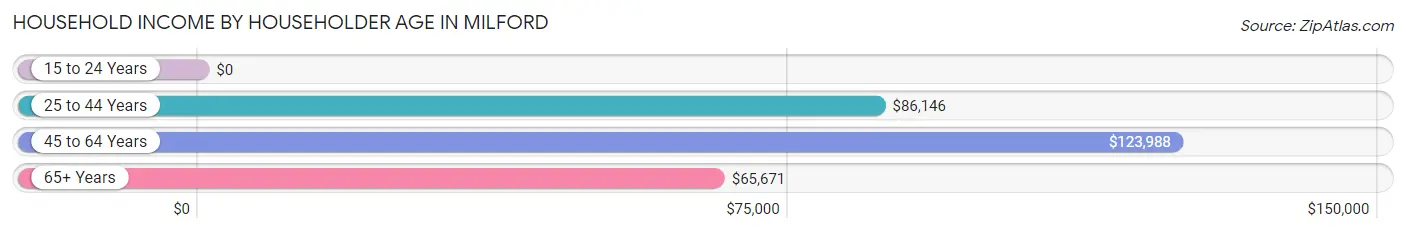
| Income Bracket | # Households | Median Income |
| 15 to 24 Years | 20 (0.8%) | $0 |
| 25 to 44 Years | 723 (27.6%) | $86,146 |
| 45 to 64 Years | 1,121 (42.8%) | $123,988 |
| 65+ Years | 752 (28.7%) | $65,671 |
| Total | 2,616 (100.0%) | $98,054 |
Poverty in Milford
Income Below Poverty by Sex and Age in Milford
With 7.5% poverty level for males and 13.0% for females among the residents of Milford, 5 year old males and 6 to 11 year old females are the most vulnerable to poverty, with 18 males (39.1%) and 75 females (35.5%) in their respective age groups living below the poverty level.
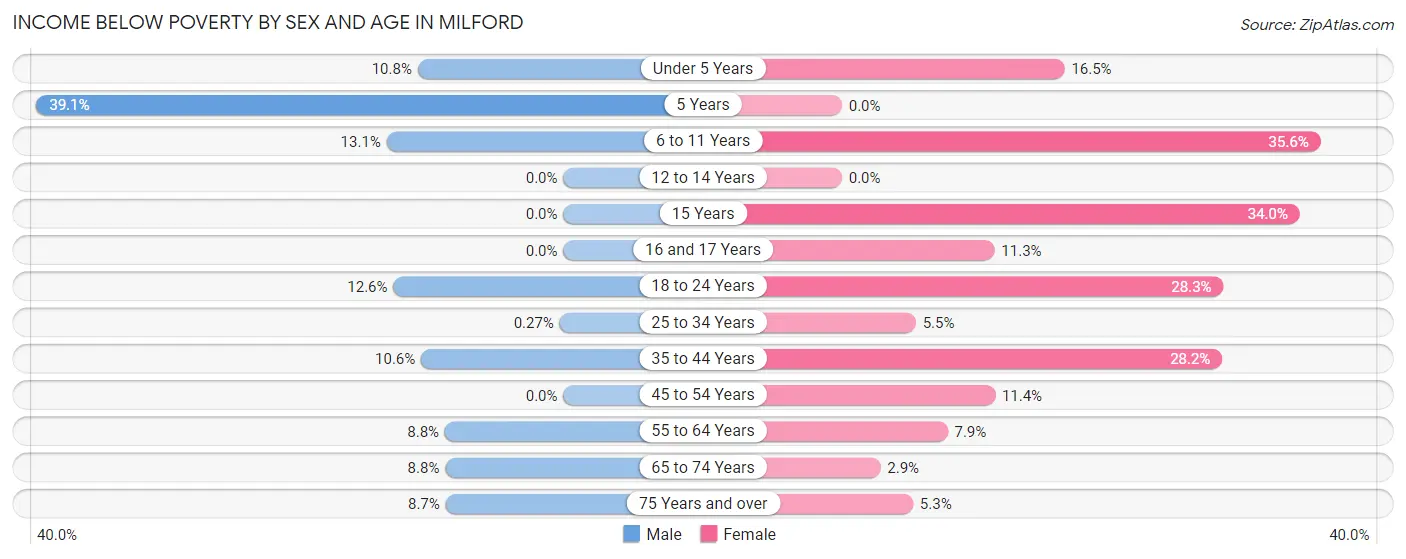
| Age Bracket | Male | Female |
| Under 5 Years | 20 (10.8%) | 39 (16.5%) |
| 5 Years | 18 (39.1%) | 0 (0.0%) |
| 6 to 11 Years | 37 (13.1%) | 75 (35.5%) |
| 12 to 14 Years | 0 (0.0%) | 0 (0.0%) |
| 15 Years | 0 (0.0%) | 17 (34.0%) |
| 16 and 17 Years | 0 (0.0%) | 17 (11.3%) |
| 18 to 24 Years | 26 (12.6%) | 34 (28.3%) |
| 25 to 34 Years | 1 (0.3%) | 15 (5.5%) |
| 35 to 44 Years | 45 (10.6%) | 111 (28.2%) |
| 45 to 54 Years | 0 (0.0%) | 49 (11.4%) |
| 55 to 64 Years | 45 (8.8%) | 45 (7.9%) |
| 65 to 74 Years | 27 (8.8%) | 11 (2.9%) |
| 75 Years and over | 16 (8.7%) | 14 (5.3%) |
| Total | 235 (7.5%) | 427 (13.0%) |
Income Above Poverty by Sex and Age in Milford
According to the poverty statistics in Milford, males aged 12 to 14 years and females aged 5 years are the age groups that are most secure financially, with 100.0% of males and 100.0% of females in these age groups living above the poverty line.
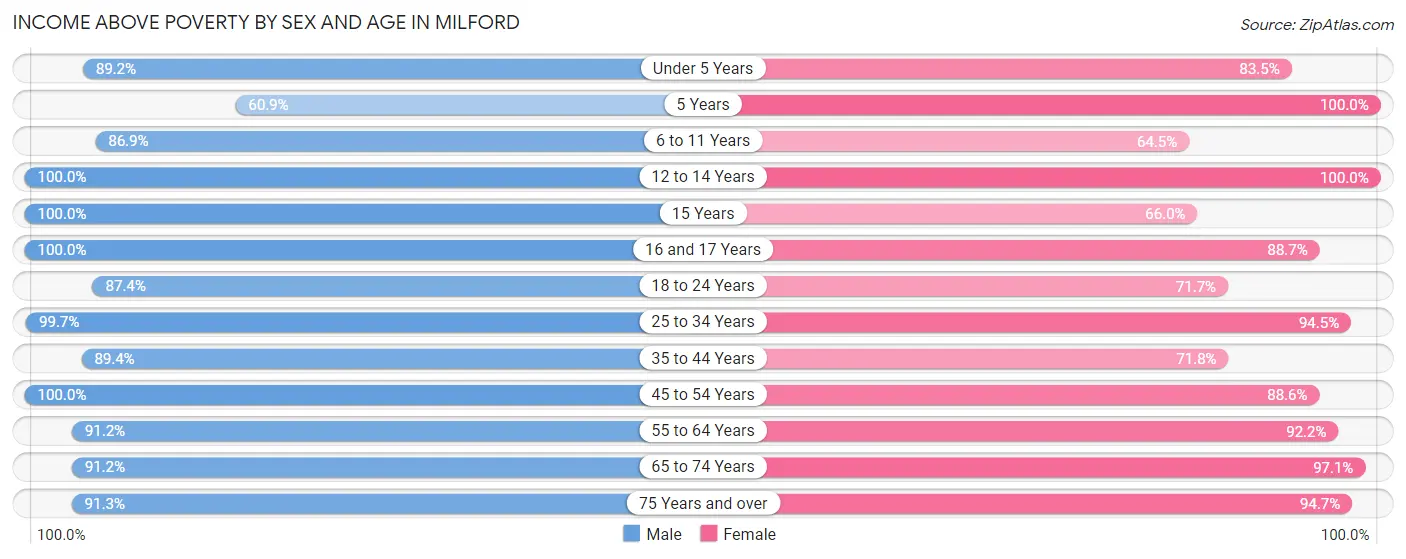
| Age Bracket | Male | Female |
| Under 5 Years | 165 (89.2%) | 197 (83.5%) |
| 5 Years | 28 (60.9%) | 46 (100.0%) |
| 6 to 11 Years | 245 (86.9%) | 136 (64.4%) |
| 12 to 14 Years | 90 (100.0%) | 163 (100.0%) |
| 15 Years | 104 (100.0%) | 33 (66.0%) |
| 16 and 17 Years | 94 (100.0%) | 133 (88.7%) |
| 18 to 24 Years | 180 (87.4%) | 86 (71.7%) |
| 25 to 34 Years | 368 (99.7%) | 258 (94.5%) |
| 35 to 44 Years | 381 (89.4%) | 282 (71.8%) |
| 45 to 54 Years | 341 (100.0%) | 382 (88.6%) |
| 55 to 64 Years | 467 (91.2%) | 528 (92.1%) |
| 65 to 74 Years | 281 (91.2%) | 373 (97.1%) |
| 75 Years and over | 167 (91.3%) | 251 (94.7%) |
| Total | 2,911 (92.5%) | 2,868 (87.0%) |
Income Below Poverty Among Married-Couple Families in Milford
The poverty statistics for married-couple families in Milford show that 3.8% or 50 of the total 1,314 families live below the poverty line. Families with 3 or 4 children have the highest poverty rate of 17.2%, comprising of 36 families. On the other hand, families with 1 or 2 children have the lowest poverty rate of 0.0%, which includes 0 families.

| Children | Above Poverty | Below Poverty |
| No Children | 701 (98.0%) | 14 (2.0%) |
| 1 or 2 Children | 390 (100.0%) | 0 (0.0%) |
| 3 or 4 Children | 173 (82.8%) | 36 (17.2%) |
| 5 or more Children | 0 (0.0%) | 0 (0.0%) |
| Total | 1,264 (96.2%) | 50 (3.8%) |
Income Below Poverty Among Single-Parent Households in Milford
According to the poverty data in Milford, 21.7% or 23 single-father households and 40.6% or 89 single-mother households are living below the poverty line. Among single-father households, those with 1 or 2 children have the highest poverty rate, with 23 households (31.1%) experiencing poverty. Likewise, among single-mother households, those with 1 or 2 children have the highest poverty rate, with 65 households (57.0%) falling below the poverty line.
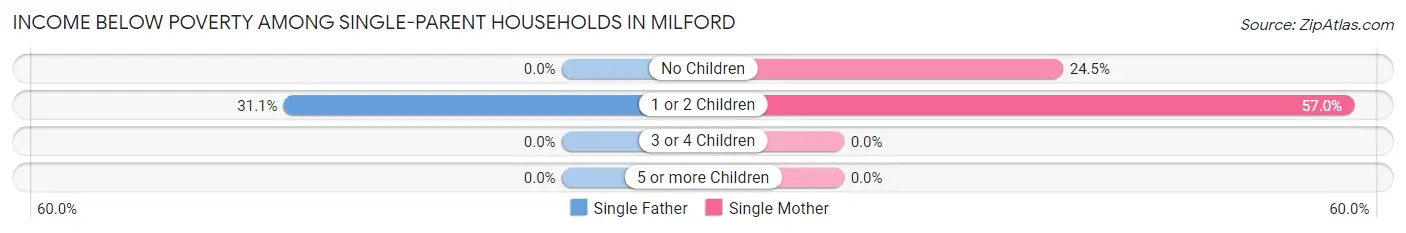
| Children | Single Father | Single Mother |
| No Children | 0 (0.0%) | 24 (24.5%) |
| 1 or 2 Children | 23 (31.1%) | 65 (57.0%) |
| 3 or 4 Children | 0 (0.0%) | 0 (0.0%) |
| 5 or more Children | 0 (0.0%) | 0 (0.0%) |
| Total | 23 (21.7%) | 89 (40.6%) |
Income Below Poverty Among Married-Couple vs Single-Parent Households in Milford
The poverty data for Milford shows that 50 of the married-couple family households (3.8%) and 112 of the single-parent households (34.5%) are living below the poverty level. Within the married-couple family households, those with 3 or 4 children have the highest poverty rate, with 36 households (17.2%) falling below the poverty line. Among the single-parent households, those with 1 or 2 children have the highest poverty rate, with 88 household (46.8%) living below poverty.
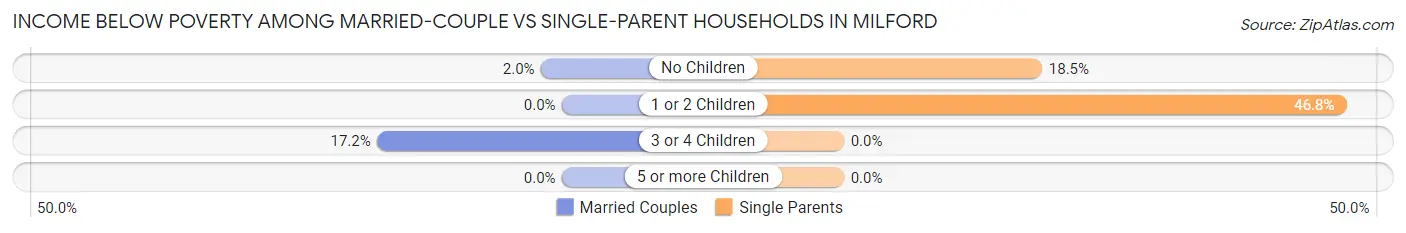
| Children | Married-Couple Families | Single-Parent Households |
| No Children | 14 (2.0%) | 24 (18.5%) |
| 1 or 2 Children | 0 (0.0%) | 88 (46.8%) |
| 3 or 4 Children | 36 (17.2%) | 0 (0.0%) |
| 5 or more Children | 0 (0.0%) | 0 (0.0%) |
| Total | 50 (3.8%) | 112 (34.5%) |
Race in Milford
The most populous races in Milford are White / Caucasian (5,780 | 89.2%), Two or more Races (515 | 7.9%), and Hispanic or Latino (225 | 3.5%).
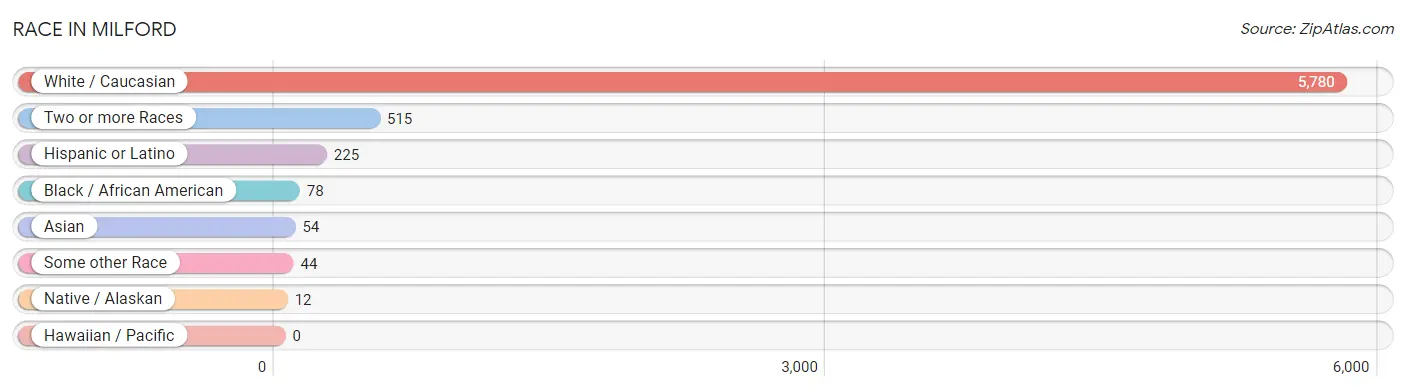
| Race | # Population | % Population |
| Asian | 54 | 0.8% |
| Black / African American | 78 | 1.2% |
| Hawaiian / Pacific | 0 | 0.0% |
| Hispanic or Latino | 225 | 3.5% |
| Native / Alaskan | 12 | 0.2% |
| White / Caucasian | 5,780 | 89.2% |
| Two or more Races | 515 | 7.9% |
| Some other Race | 44 | 0.7% |
| Total | 6,483 | 100.0% |
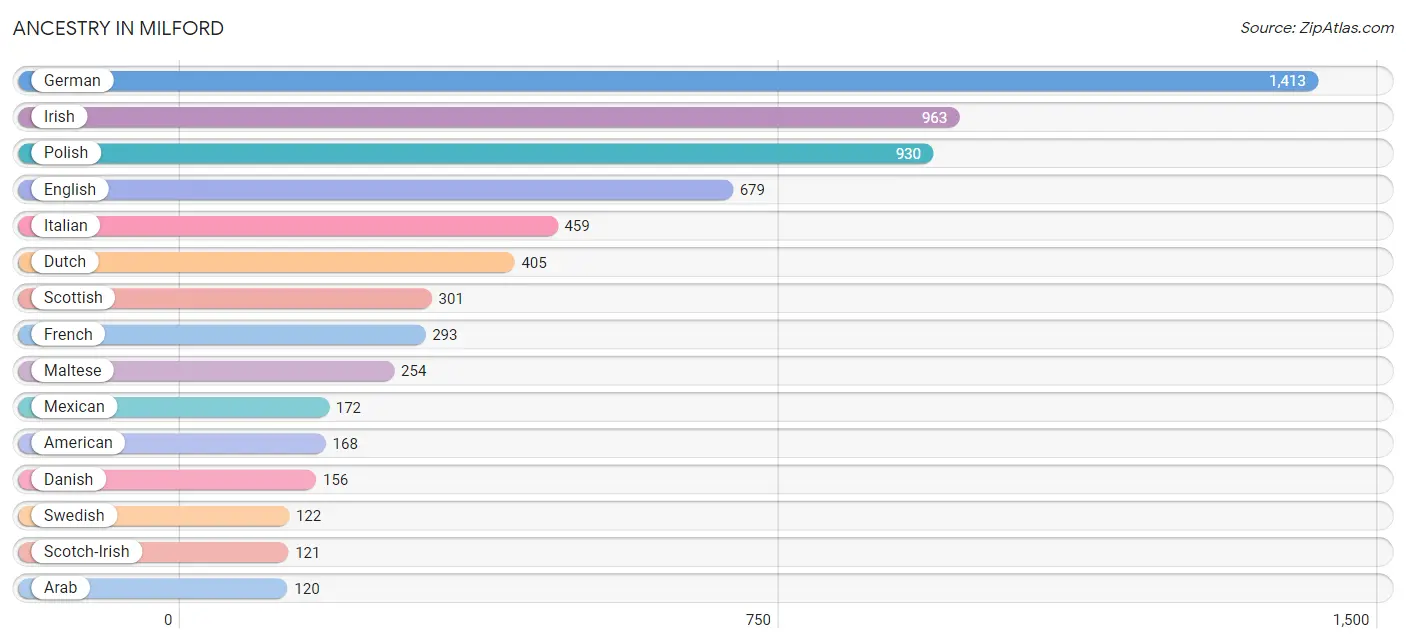
Ancestry in Milford
The most populous ancestries reported in Milford are German (1,413 | 21.8%), Irish (963 | 14.8%), Polish (930 | 14.3%), English (679 | 10.5%), and Italian (459 | 7.1%), together accounting for 68.5% of all Milford residents.
| Ancestry | # Population | % Population |
| Albanian | 15 | 0.2% |
| American | 168 | 2.6% |
| Apache | 15 | 0.2% |
| Arab | 120 | 1.8% |
| Armenian | 9 | 0.1% |
| Austrian | 22 | 0.3% |
| Belgian | 19 | 0.3% |
| Bhutanese | 112 | 1.7% |
| British | 46 | 0.7% |
| Burmese | 94 | 1.5% |
| Canadian | 28 | 0.4% |
| Cherokee | 49 | 0.8% |
| Chippewa | 10 | 0.2% |
| Comanche | 15 | 0.2% |
| Croatian | 13 | 0.2% |
| Cypriot | 6 | 0.1% |
| Czech | 9 | 0.1% |
| Czechoslovakian | 6 | 0.1% |
| Danish | 156 | 2.4% |
| Dutch | 405 | 6.2% |
| Eastern European | 15 | 0.2% |
| English | 679 | 10.5% |
| European | 81 | 1.3% |
| Finnish | 115 | 1.8% |
| French | 293 | 4.5% |
| French Canadian | 53 | 0.8% |
| German | 1,413 | 21.8% |
| Greek | 36 | 0.6% |
| Hungarian | 22 | 0.3% |
| Indian (Asian) | 28 | 0.4% |
| Irish | 963 | 14.8% |
| Italian | 459 | 7.1% |
| Lebanese | 76 | 1.2% |
| Lithuanian | 13 | 0.2% |
| Maltese | 254 | 3.9% |
| Mexican | 172 | 2.6% |
| Mexican American Indian | 23 | 0.4% |
| Norwegian | 42 | 0.6% |
| Polish | 930 | 14.3% |
| Puerto Rican | 25 | 0.4% |
| Romanian | 11 | 0.2% |
| Russian | 79 | 1.2% |
| Scandinavian | 2 | 0.0% |
| Scotch-Irish | 121 | 1.9% |
| Scottish | 301 | 4.6% |
| Serbian | 24 | 0.4% |
| Slovak | 88 | 1.4% |
| Spanish | 28 | 0.4% |
| Swedish | 122 | 1.9% |
| Thai | 17 | 0.3% |
| Ukrainian | 25 | 0.4% |
| Welsh | 41 | 0.6% | View All 52 Rows |
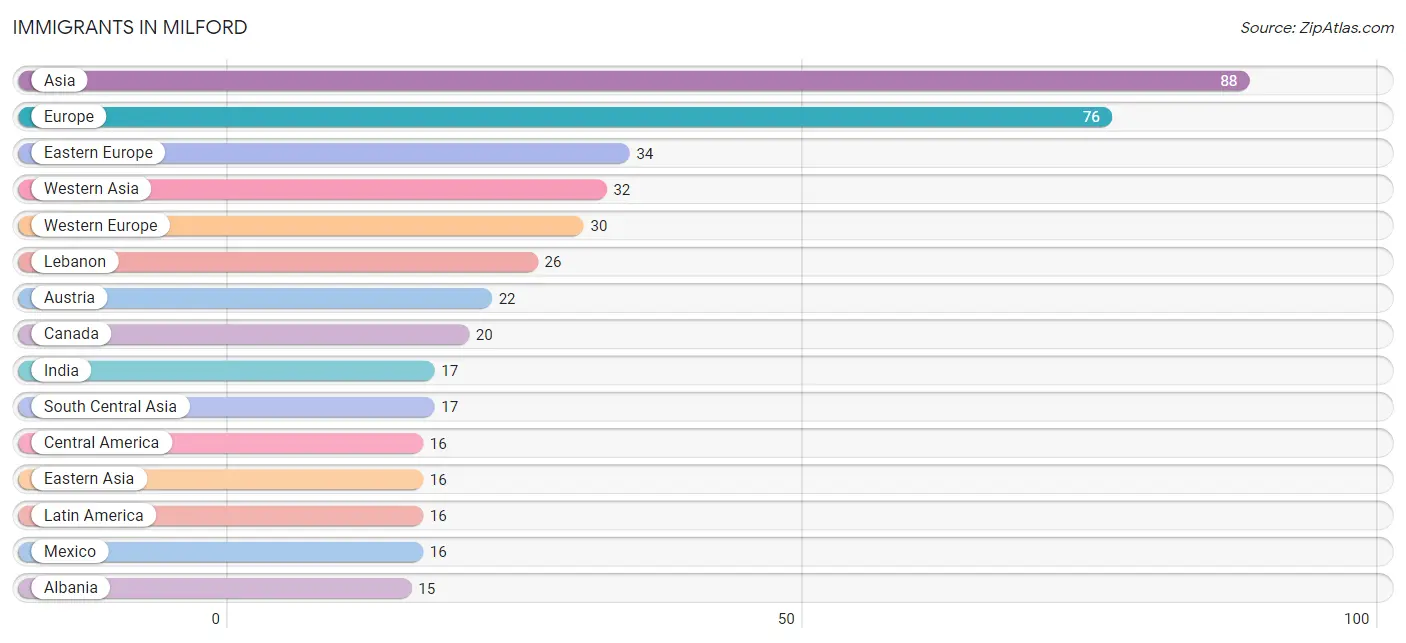
Immigrants in Milford
The most numerous immigrant groups reported in Milford came from Asia (88 | 1.4%), Europe (76 | 1.2%), Eastern Europe (34 | 0.5%), Western Asia (32 | 0.5%), and Western Europe (30 | 0.5%), together accounting for 4.0% of all Milford residents.
| Immigration Origin | # Population | % Population |
| Albania | 15 | 0.2% |
| Asia | 88 | 1.4% |
| Austria | 22 | 0.3% |
| Canada | 20 | 0.3% |
| Central America | 16 | 0.3% |
| China | 14 | 0.2% |
| Czechoslovakia | 8 | 0.1% |
| Eastern Asia | 16 | 0.3% |
| Eastern Europe | 34 | 0.5% |
| England | 6 | 0.1% |
| Europe | 76 | 1.2% |
| Germany | 8 | 0.1% |
| Greece | 6 | 0.1% |
| India | 17 | 0.3% |
| Indonesia | 14 | 0.2% |
| Korea | 2 | 0.0% |
| Latin America | 16 | 0.3% |
| Lebanon | 26 | 0.4% |
| Mexico | 16 | 0.3% |
| Northern Europe | 6 | 0.1% |
| Russia | 11 | 0.2% |
| South Central Asia | 17 | 0.3% |
| South Eastern Asia | 14 | 0.2% |
| Southern Europe | 6 | 0.1% |
| Western Asia | 32 | 0.5% |
| Western Europe | 30 | 0.5% | View All 26 Rows |
Sex and Age in Milford
Sex and Age in Milford
The most populous age groups in Milford are 15 to 19 Years (269 | 8.6%) for men and 60 to 64 Years (326 | 9.8%) for women.
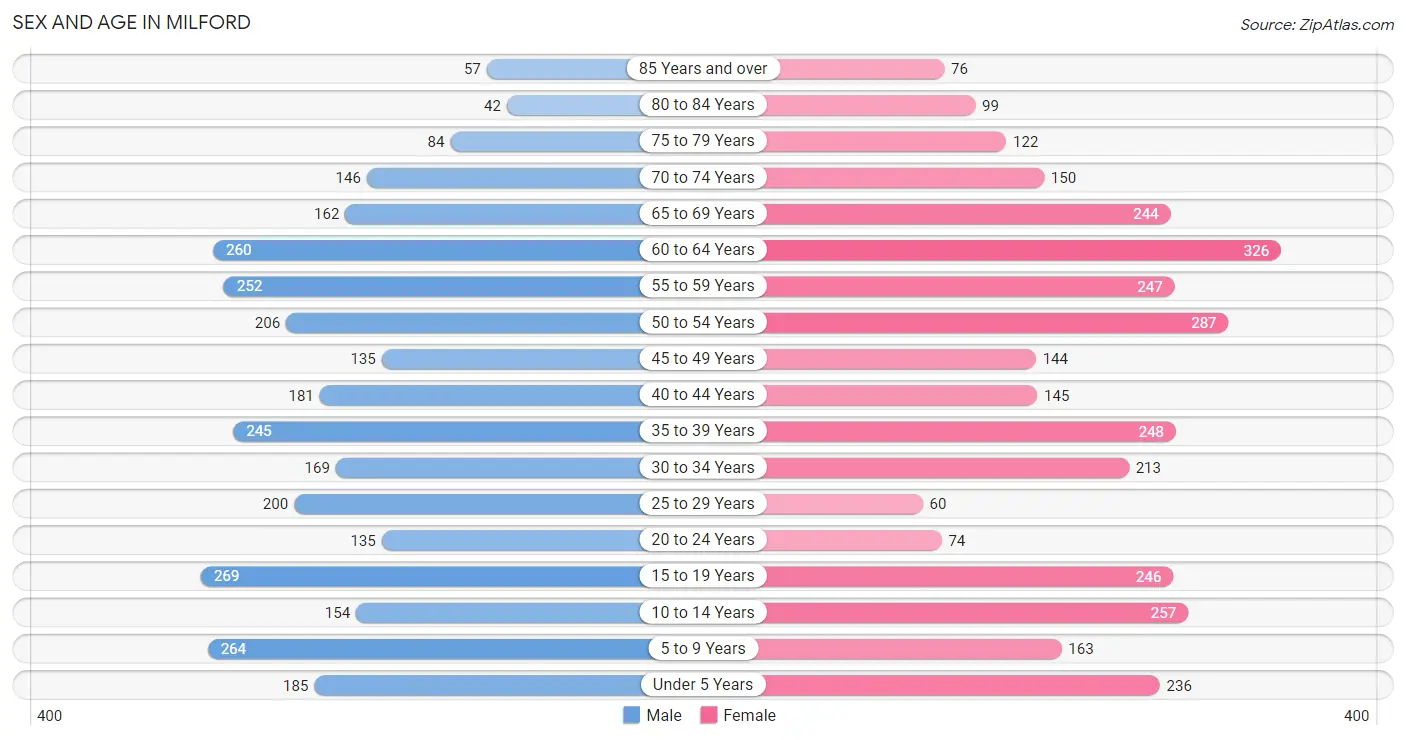
| Age Bracket | Male | Female |
| Under 5 Years | 185 (5.9%) | 236 (7.1%) |
| 5 to 9 Years | 264 (8.4%) | 163 (4.9%) |
| 10 to 14 Years | 154 (4.9%) | 257 (7.7%) |
| 15 to 19 Years | 269 (8.6%) | 246 (7.4%) |
| 20 to 24 Years | 135 (4.3%) | 74 (2.2%) |
| 25 to 29 Years | 200 (6.4%) | 60 (1.8%) |
| 30 to 34 Years | 169 (5.4%) | 213 (6.4%) |
| 35 to 39 Years | 245 (7.8%) | 248 (7.4%) |
| 40 to 44 Years | 181 (5.8%) | 145 (4.3%) |
| 45 to 49 Years | 135 (4.3%) | 144 (4.3%) |
| 50 to 54 Years | 206 (6.6%) | 287 (8.6%) |
| 55 to 59 Years | 252 (8.0%) | 247 (7.4%) |
| 60 to 64 Years | 260 (8.3%) | 326 (9.8%) |
| 65 to 69 Years | 162 (5.1%) | 244 (7.3%) |
| 70 to 74 Years | 146 (4.6%) | 150 (4.5%) |
| 75 to 79 Years | 84 (2.7%) | 122 (3.7%) |
| 80 to 84 Years | 42 (1.3%) | 99 (3.0%) |
| 85 Years and over | 57 (1.8%) | 76 (2.3%) |
| Total | 3,146 (100.0%) | 3,337 (100.0%) |
Families and Households in Milford
Median Family Size in Milford
The median family size in Milford is 3.13 persons per family, with married-couple families (1,314 | 80.2%) accounting for the largest median family size of 3.27 persons per family. On the other hand, single male/father families (106 | 6.5%) represent the smallest median family size with 2.46 persons per family.
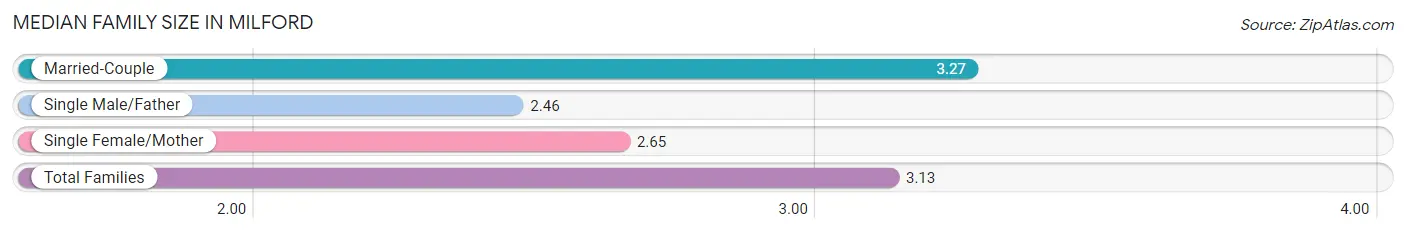
| Family Type | # Families | Family Size |
| Married-Couple | 1,314 (80.2%) | 3.27 |
| Single Male/Father | 106 (6.5%) | 2.46 |
| Single Female/Mother | 219 (13.4%) | 2.65 |
| Total Families | 1,639 (100.0%) | 3.13 |
Median Household Size in Milford
The median household size in Milford is 2.46 persons per household, with married-couple households (1,314 | 50.2%) accounting for the largest median household size of 3.27 persons per household. non-family households (977 | 37.3%) represent the smallest median household size with 1.21 persons per household.
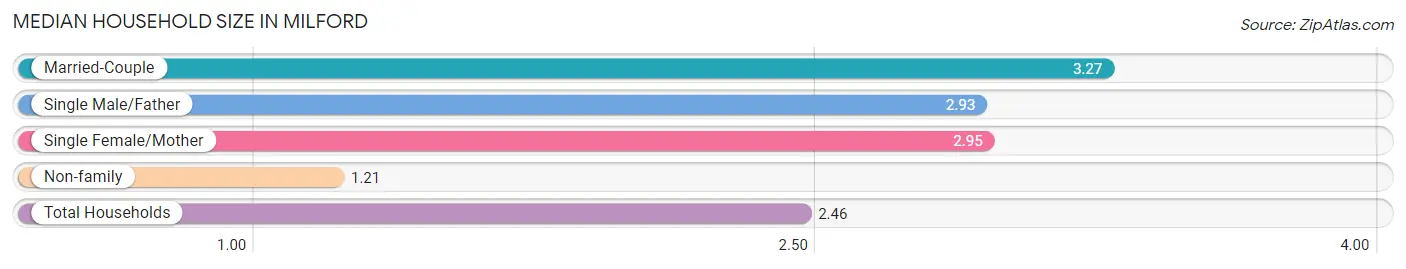
| Household Type | # Households | Household Size |
| Married-Couple | 1,314 (50.2%) | 3.27 |
| Single Male/Father | 106 (4.1%) | 2.93 |
| Single Female/Mother | 219 (8.4%) | 2.95 |
| Non-family | 977 (37.3%) | 1.21 |
| Total Households | 2,616 (100.0%) | 2.46 |
Household Size by Marriage Status in Milford
Out of a total of 2,616 households in Milford, 1,639 (62.6%) are family households, while 977 (37.3%) are nonfamily households. The most numerous type of family households are 2-person households, comprising 675, and the most common type of nonfamily households are 1-person households, comprising 859.
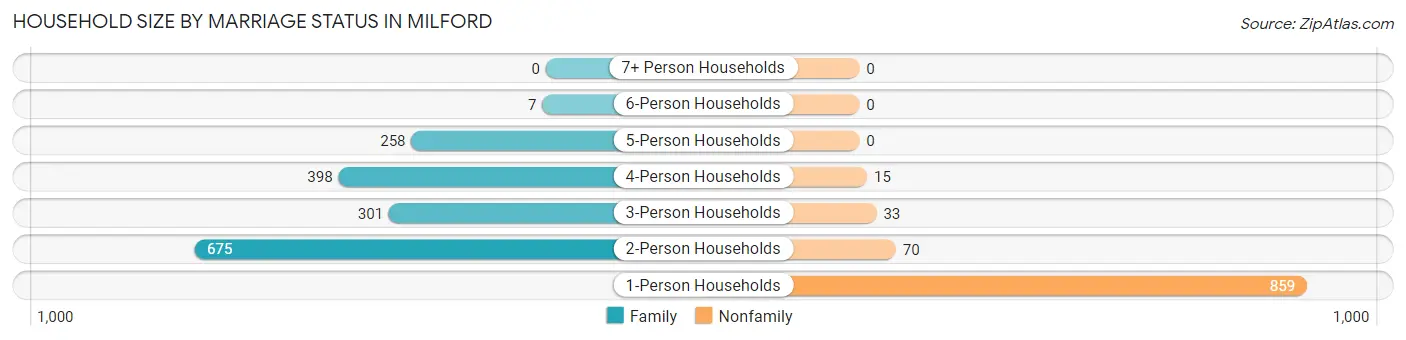
| Household Size | Family Households | Nonfamily Households |
| 1-Person Households | - | 859 (32.8%) |
| 2-Person Households | 675 (25.8%) | 70 (2.7%) |
| 3-Person Households | 301 (11.5%) | 33 (1.3%) |
| 4-Person Households | 398 (15.2%) | 15 (0.6%) |
| 5-Person Households | 258 (9.9%) | 0 (0.0%) |
| 6-Person Households | 7 (0.3%) | 0 (0.0%) |
| 7+ Person Households | 0 (0.0%) | 0 (0.0%) |
| Total | 1,639 (62.6%) | 977 (37.3%) |
Female Fertility in Milford
Fertility by Age in Milford
Average fertility rate in Milford is 69.0 births per 1,000 women. Women in the age bracket of 20 to 34 years have the highest fertility rate with 89.0 births per 1,000 women. Women in the age bracket of 35 to 50 years acount for 62.2% of all women with births.
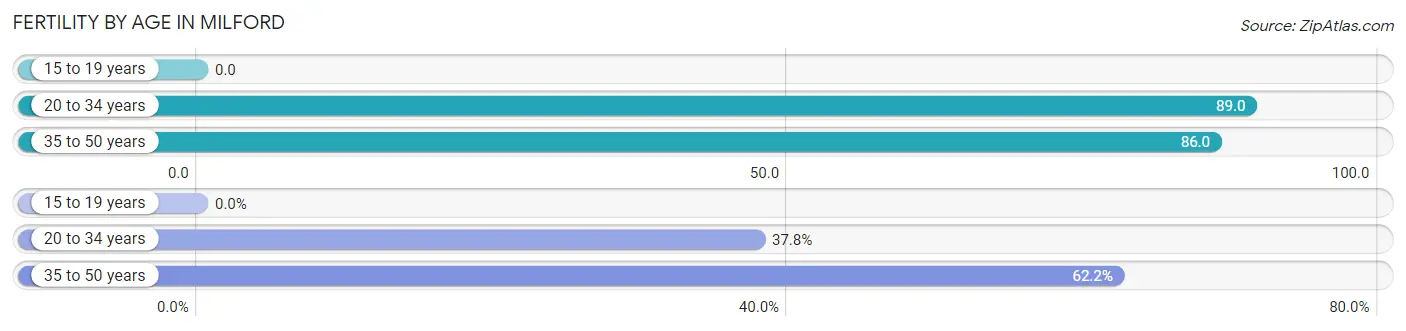
| Age Bracket | Women with Births | Births / 1,000 Women |
| 15 to 19 years | 0 (0.0%) | 0.0 |
| 20 to 34 years | 31 (37.8%) | 89.0 |
| 35 to 50 years | 51 (62.2%) | 86.0 |
| Total | 82 (100.0%) | 69.0 |
Fertility by Age by Marriage Status in Milford
67.1% of women with births (82) in Milford are married. The highest percentage of unmarried women with births falls into 35 to 50 years age bracket with 52.9% of them unmarried at the time of birth, while the lowest percentage of unmarried women with births belong to 20 to 34 years age bracket with 0.0% of them unmarried.
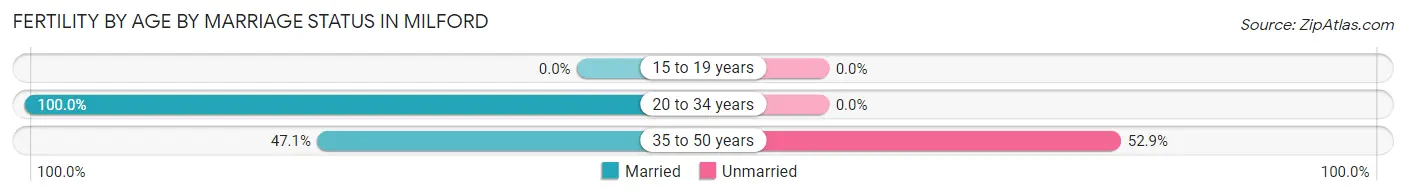
| Age Bracket | Married | Unmarried |
| 15 to 19 years | 0 (0.0%) | 0 (0.0%) |
| 20 to 34 years | 31 (100.0%) | 0 (0.0%) |
| 35 to 50 years | 24 (47.1%) | 27 (52.9%) |
| Total | 55 (67.1%) | 27 (32.9%) |
Fertility by Education in Milford
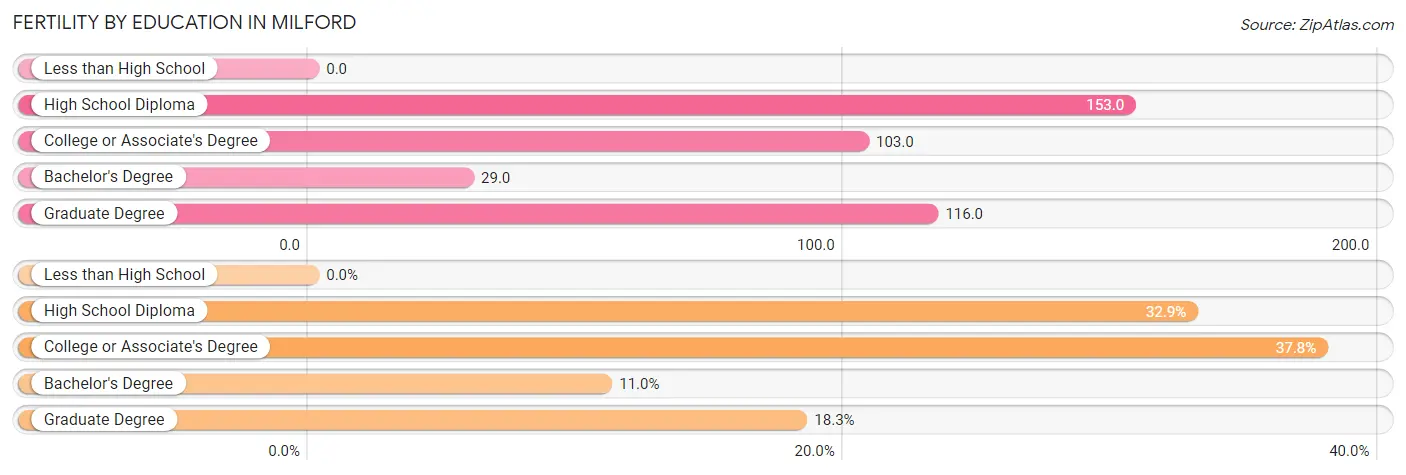
| Educational Attainment | Women with Births | Births / 1,000 Women |
| Less than High School | 0 (0.0%) | 0.0 |
| High School Diploma | 27 (32.9%) | 153.0 |
| College or Associate's Degree | 31 (37.8%) | 103.0 |
| Bachelor's Degree | 9 (11.0%) | 29.0 |
| Graduate Degree | 15 (18.3%) | 116.0 |
| Total | 82 (100.0%) | 69.0 |
Fertility by Education by Marriage Status in Milford
32.9% of women with births in Milford are unmarried. Women with the educational attainment of college or associate's degree are most likely to be married with 100.0% of them married at childbirth, while women with the educational attainment of high school diploma are least likely to be married with 100.0% of them unmarried at childbirth.
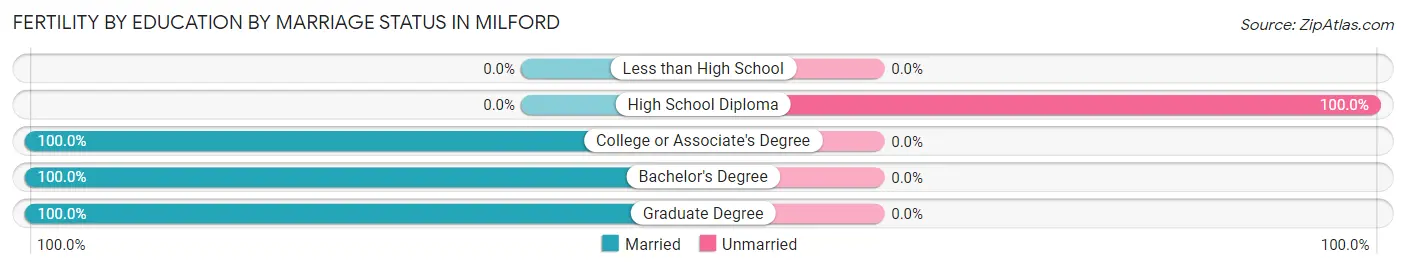
| Educational Attainment | Married | Unmarried |
| Less than High School | 0 (0.0%) | 0 (0.0%) |
| High School Diploma | 0 (0.0%) | 27 (100.0%) |
| College or Associate's Degree | 31 (100.0%) | 0 (0.0%) |
| Bachelor's Degree | 9 (100.0%) | 0 (0.0%) |
| Graduate Degree | 15 (100.0%) | 0 (0.0%) |
| Total | 55 (67.1%) | 27 (32.9%) |
Employment Characteristics in Milford
Employment by Class of Employer in Milford
Among the 3,053 employed individuals in Milford, private company employees (2,087 | 68.4%), not-for-profit organizations (265 | 8.7%), and local government employees (258 | 8.5%) make up the most common classes of employment.
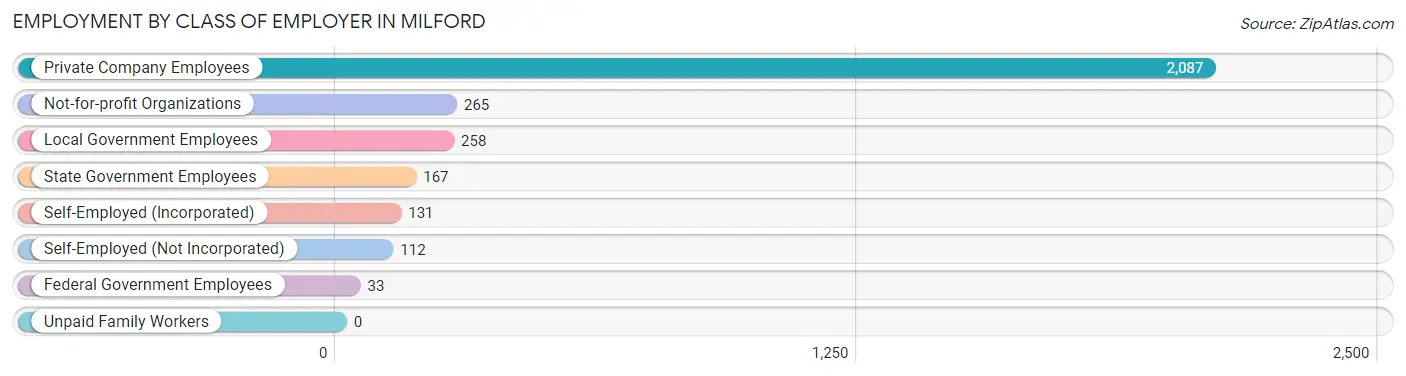
| Employer Class | # Employees | % Employees |
| Private Company Employees | 2,087 | 68.4% |
| Self-Employed (Incorporated) | 131 | 4.3% |
| Self-Employed (Not Incorporated) | 112 | 3.7% |
| Not-for-profit Organizations | 265 | 8.7% |
| Local Government Employees | 258 | 8.5% |
| State Government Employees | 167 | 5.5% |
| Federal Government Employees | 33 | 1.1% |
| Unpaid Family Workers | 0 | 0.0% |
| Total | 3,053 | 100.0% |
Employment Status by Age in Milford
According to the labor force statistics for Milford, out of the total population over 16 years of age (5,070), 63.6% or 3,225 individuals are in the labor force, with 3.0% or 97 of them unemployed. The age group with the highest labor force participation rate is 30 to 34 years, with 90.6% or 346 individuals in the labor force. Within the labor force, the 35 to 44 years age range has the highest percentage of unemployed individuals, with 6.2% or 37 of them being unemployed.
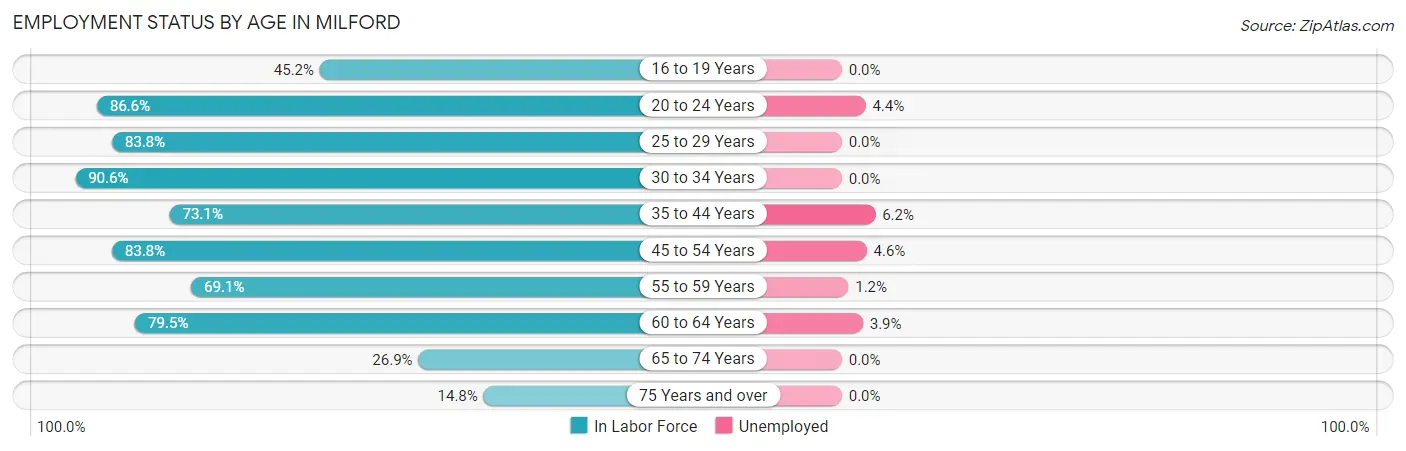
| Age Bracket | In Labor Force | Unemployed |
| 16 to 19 Years | 163 (45.2%) | 0 (0.0%) |
| 20 to 24 Years | 181 (86.6%) | 8 (4.4%) |
| 25 to 29 Years | 218 (83.8%) | 0 (0.0%) |
| 30 to 34 Years | 346 (90.6%) | 0 (0.0%) |
| 35 to 44 Years | 599 (73.1%) | 37 (6.2%) |
| 45 to 54 Years | 647 (83.8%) | 30 (4.6%) |
| 55 to 59 Years | 345 (69.1%) | 4 (1.2%) |
| 60 to 64 Years | 466 (79.5%) | 18 (3.9%) |
| 65 to 74 Years | 189 (26.9%) | 0 (0.0%) |
| 75 Years and over | 71 (14.8%) | 0 (0.0%) |
| Total | 3,225 (63.6%) | 97 (3.0%) |
Employment Status by Educational Attainment in Milford
According to labor force statistics for Milford, 79.0% of individuals (2,621) out of the total population between 25 and 64 years of age (3,318) are in the labor force, with 3.4% or 89 of them being unemployed. The group with the highest labor force participation rate are those with the educational attainment of bachelor's degree or higher, with 86.2% or 1,448 individuals in the labor force. Within the labor force, individuals with high school diploma education have the highest percentage of unemployment, with 14.9% or 59 of them being unemployed.
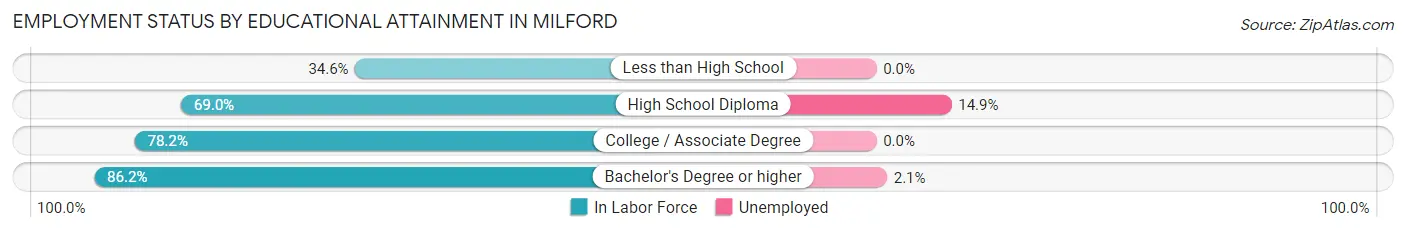
| Educational Attainment | In Labor Force | Unemployed |
| Less than High School | 44 (34.6%) | 0 (0.0%) |
| High School Diploma | 397 (69.0%) | 86 (14.9%) |
| College / Associate Degree | 732 (78.2%) | 0 (0.0%) |
| Bachelor's Degree or higher | 1,448 (86.2%) | 35 (2.1%) |
| Total | 2,621 (79.0%) | 113 (3.4%) |
Employment Occupations by Sex in Milford
Management, Business, Science and Arts Occupations
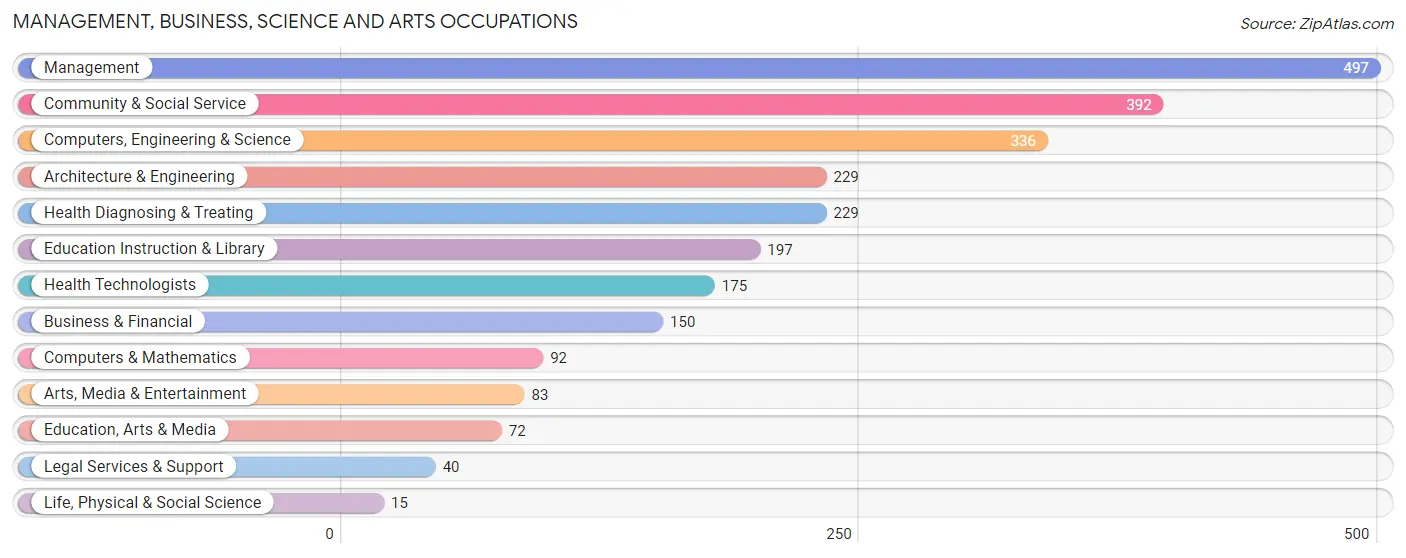
The most common Management, Business, Science and Arts occupations in Milford are Management (497 | 15.9%), Community & Social Service (392 | 12.5%), Computers, Engineering & Science (336 | 10.7%), Architecture & Engineering (229 | 7.3%), and Health Diagnosing & Treating (229 | 7.3%).
Management, Business, Science and Arts Occupations by Sex
Within the Management, Business, Science and Arts occupations in Milford, the most male-oriented occupations are Architecture & Engineering (96.5%), Life, Physical & Social Science (93.3%), and Computers, Engineering & Science (91.4%), while the most female-oriented occupations are Education, Arts & Media (100.0%), Health Diagnosing & Treating (96.9%), and Health Technologists (96.0%).
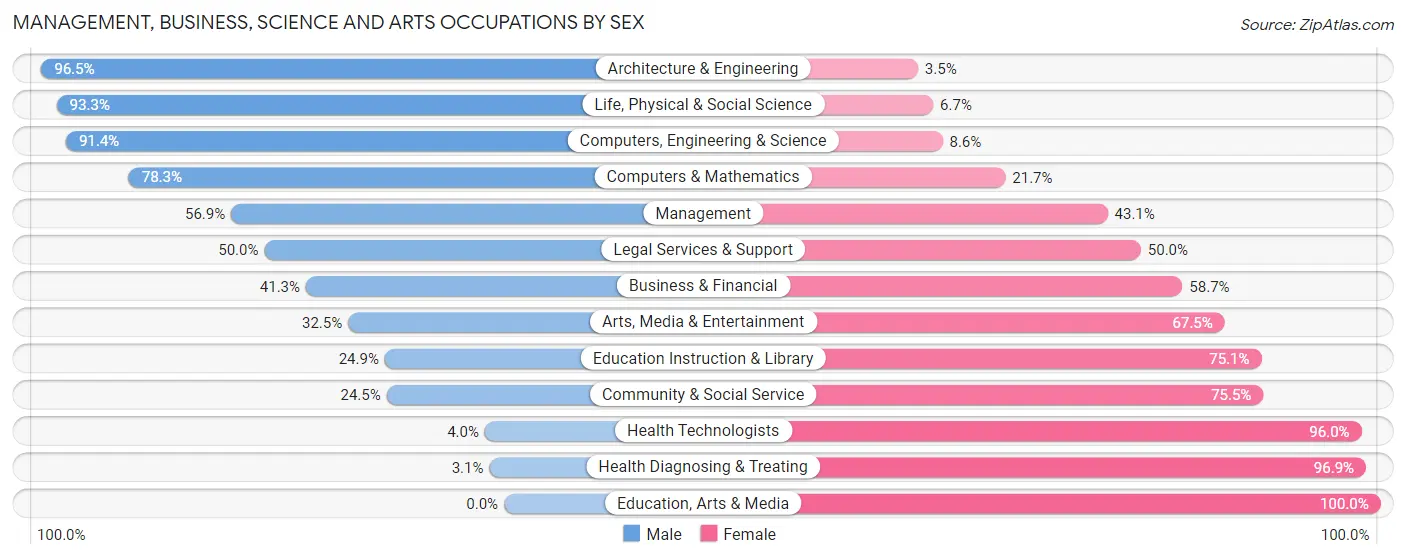
| Occupation | Male | Female |
| Management | 283 (56.9%) | 214 (43.1%) |
| Business & Financial | 62 (41.3%) | 88 (58.7%) |
| Computers, Engineering & Science | 307 (91.4%) | 29 (8.6%) |
| Computers & Mathematics | 72 (78.3%) | 20 (21.7%) |
| Architecture & Engineering | 221 (96.5%) | 8 (3.5%) |
| Life, Physical & Social Science | 14 (93.3%) | 1 (6.7%) |
| Community & Social Service | 96 (24.5%) | 296 (75.5%) |
| Education, Arts & Media | 0 (0.0%) | 72 (100.0%) |
| Legal Services & Support | 20 (50.0%) | 20 (50.0%) |
| Education Instruction & Library | 49 (24.9%) | 148 (75.1%) |
| Arts, Media & Entertainment | 27 (32.5%) | 56 (67.5%) |
| Health Diagnosing & Treating | 7 (3.1%) | 222 (96.9%) |
| Health Technologists | 7 (4.0%) | 168 (96.0%) |
| Total (Category) | 755 (47.1%) | 849 (52.9%) |
| Total (Overall) | 1,645 (52.6%) | 1,483 (47.4%) |
Services Occupations
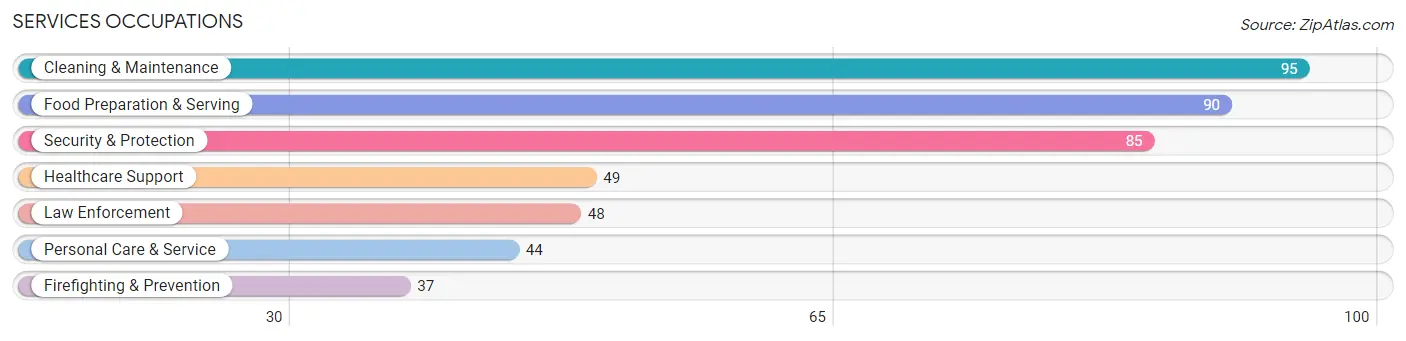
The most common Services occupations in Milford are Cleaning & Maintenance (95 | 3.0%), Food Preparation & Serving (90 | 2.9%), Security & Protection (85 | 2.7%), Healthcare Support (49 | 1.6%), and Law Enforcement (48 | 1.5%).
Services Occupations by Sex
Within the Services occupations in Milford, the most male-oriented occupations are Law Enforcement (100.0%), Security & Protection (82.4%), and Cleaning & Maintenance (74.7%), while the most female-oriented occupations are Healthcare Support (100.0%), Personal Care & Service (75.0%), and Food Preparation & Serving (66.7%).
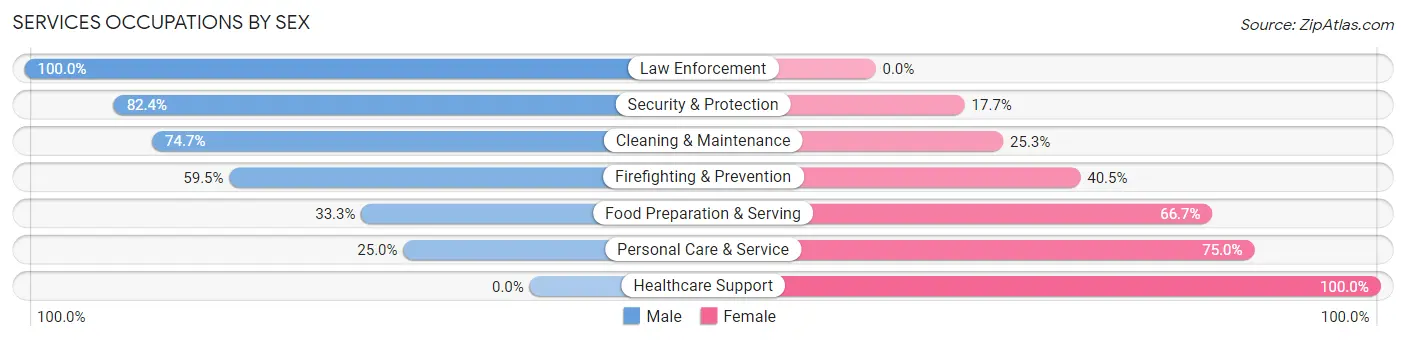
| Occupation | Male | Female |
| Healthcare Support | 0 (0.0%) | 49 (100.0%) |
| Security & Protection | 70 (82.4%) | 15 (17.6%) |
| Firefighting & Prevention | 22 (59.5%) | 15 (40.5%) |
| Law Enforcement | 48 (100.0%) | 0 (0.0%) |
| Food Preparation & Serving | 30 (33.3%) | 60 (66.7%) |
| Cleaning & Maintenance | 71 (74.7%) | 24 (25.3%) |
| Personal Care & Service | 11 (25.0%) | 33 (75.0%) |
| Total (Category) | 182 (50.1%) | 181 (49.9%) |
| Total (Overall) | 1,645 (52.6%) | 1,483 (47.4%) |
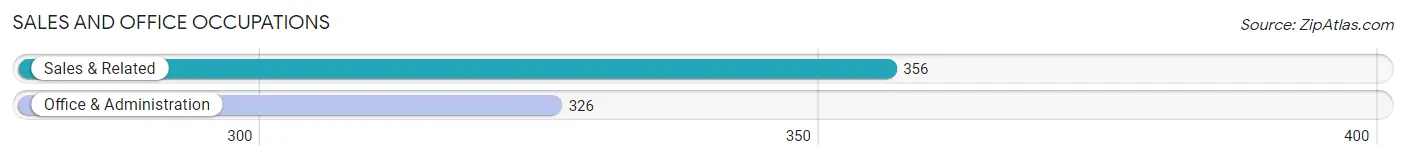
Sales and Office Occupations
The most common Sales and Office occupations in Milford are Sales & Related (356 | 11.4%), and Office & Administration (326 | 10.4%).
Sales and Office Occupations by Sex
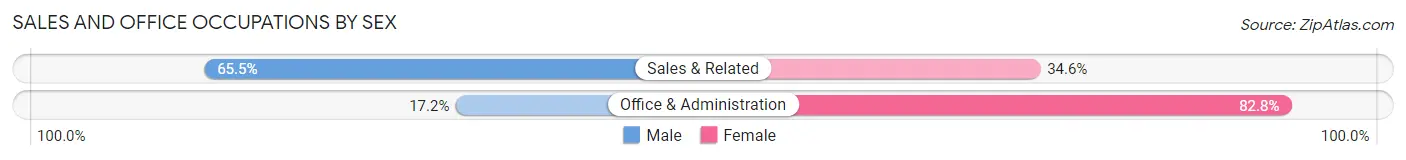
| Occupation | Male | Female |
| Sales & Related | 233 (65.4%) | 123 (34.5%) |
| Office & Administration | 56 (17.2%) | 270 (82.8%) |
| Total (Category) | 289 (42.4%) | 393 (57.6%) |
| Total (Overall) | 1,645 (52.6%) | 1,483 (47.4%) |
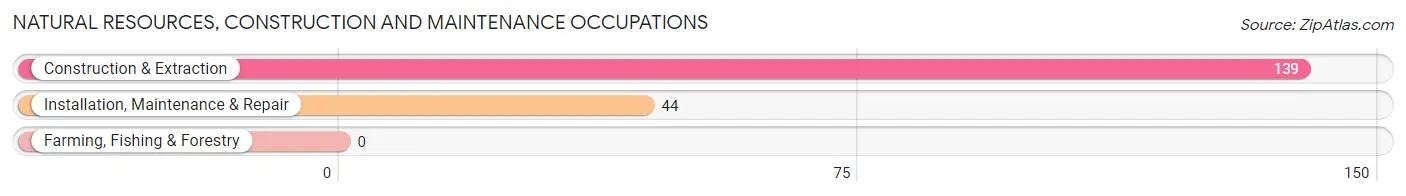
Natural Resources, Construction and Maintenance Occupations
The most common Natural Resources, Construction and Maintenance occupations in Milford are Construction & Extraction (139 | 4.4%), and Installation, Maintenance & Repair (44 | 1.4%).
Natural Resources, Construction and Maintenance Occupations by Sex
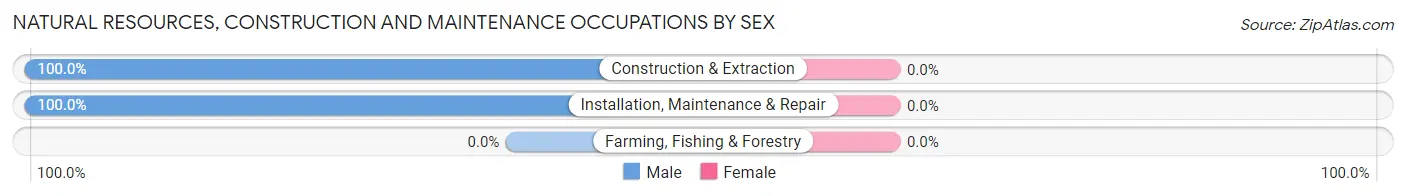
| Occupation | Male | Female |
| Farming, Fishing & Forestry | 0 (0.0%) | 0 (0.0%) |
| Construction & Extraction | 139 (100.0%) | 0 (0.0%) |
| Installation, Maintenance & Repair | 44 (100.0%) | 0 (0.0%) |
| Total (Category) | 183 (100.0%) | 0 (0.0%) |
| Total (Overall) | 1,645 (52.6%) | 1,483 (47.4%) |
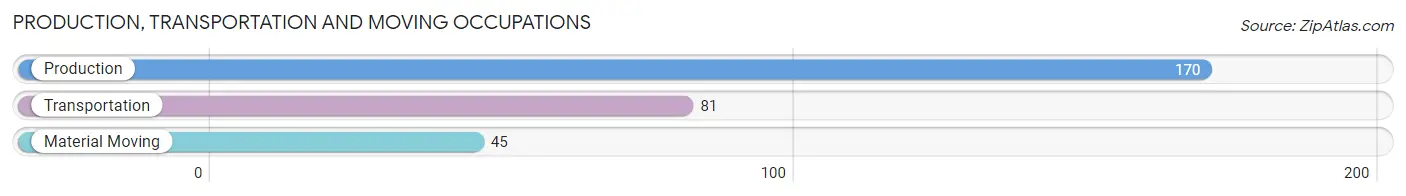
Production, Transportation and Moving Occupations
The most common Production, Transportation and Moving occupations in Milford are Production (170 | 5.4%), Transportation (81 | 2.6%), and Material Moving (45 | 1.4%).
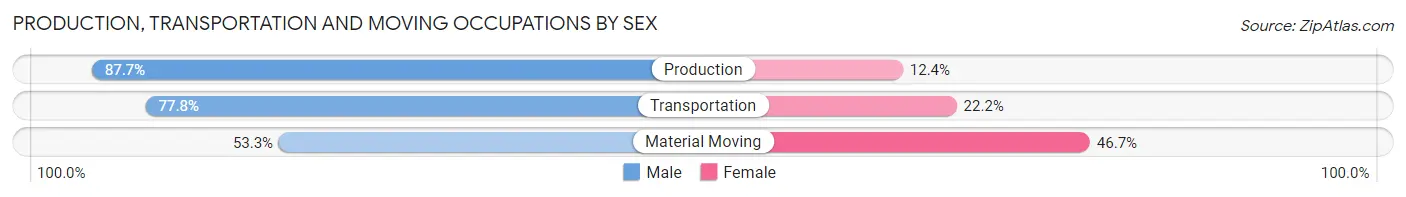
Production, Transportation and Moving Occupations by Sex
| Occupation | Male | Female |
| Production | 149 (87.6%) | 21 (12.3%) |
| Transportation | 63 (77.8%) | 18 (22.2%) |
| Material Moving | 24 (53.3%) | 21 (46.7%) |
| Total (Category) | 236 (79.7%) | 60 (20.3%) |
| Total (Overall) | 1,645 (52.6%) | 1,483 (47.4%) |
Employment Industries by Sex in Milford
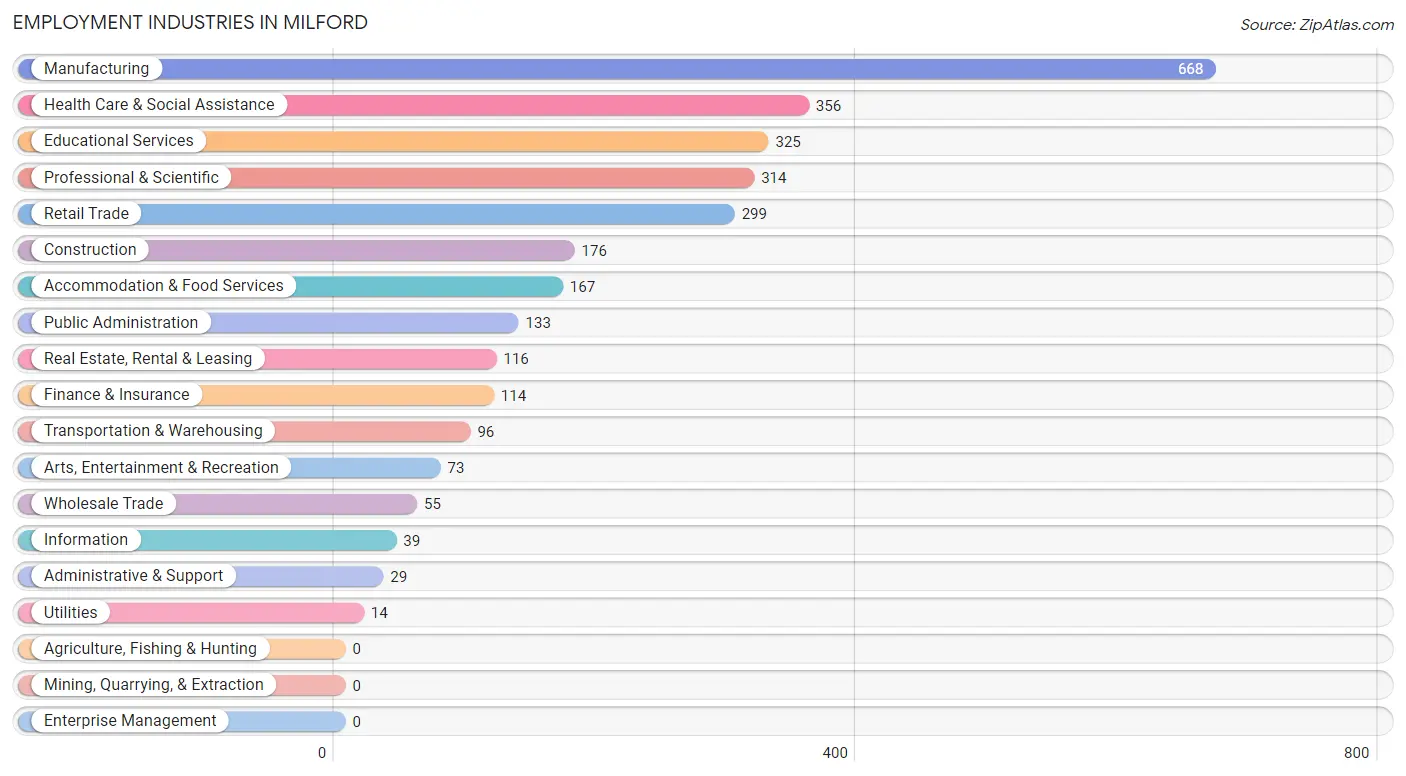
Employment Industries in Milford
The major employment industries in Milford include Manufacturing (668 | 21.4%), Health Care & Social Assistance (356 | 11.4%), Educational Services (325 | 10.4%), Professional & Scientific (314 | 10.0%), and Retail Trade (299 | 9.6%).
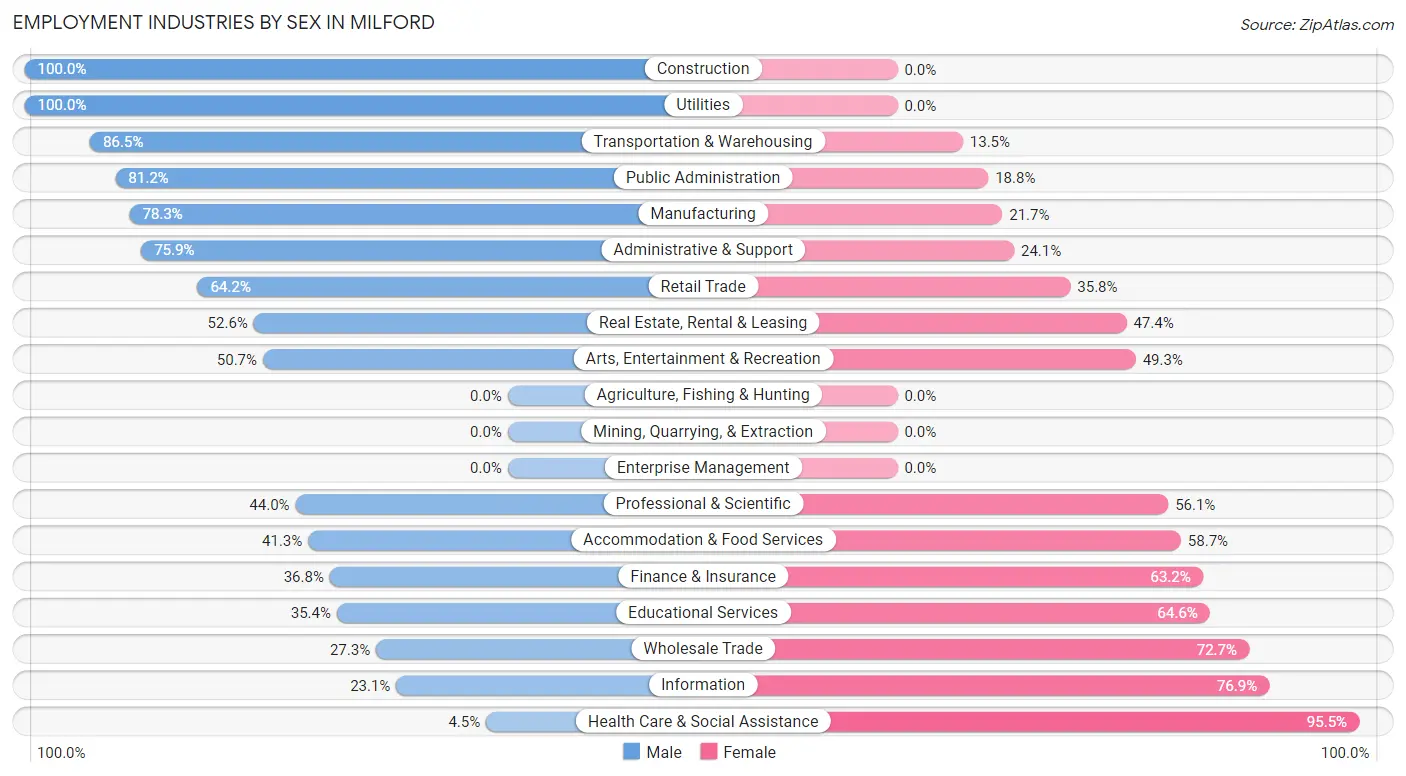
Employment Industries by Sex in Milford
The Milford industries that see more men than women are Construction (100.0%), Utilities (100.0%), and Transportation & Warehousing (86.5%), whereas the industries that tend to have a higher number of women are Health Care & Social Assistance (95.5%), Information (76.9%), and Wholesale Trade (72.7%).
| Industry | Male | Female |
| Agriculture, Fishing & Hunting | 0 (0.0%) | 0 (0.0%) |
| Mining, Quarrying, & Extraction | 0 (0.0%) | 0 (0.0%) |
| Construction | 176 (100.0%) | 0 (0.0%) |
| Manufacturing | 523 (78.3%) | 145 (21.7%) |
| Wholesale Trade | 15 (27.3%) | 40 (72.7%) |
| Retail Trade | 192 (64.2%) | 107 (35.8%) |
| Transportation & Warehousing | 83 (86.5%) | 13 (13.5%) |
| Utilities | 14 (100.0%) | 0 (0.0%) |
| Information | 9 (23.1%) | 30 (76.9%) |
| Finance & Insurance | 42 (36.8%) | 72 (63.2%) |
| Real Estate, Rental & Leasing | 61 (52.6%) | 55 (47.4%) |
| Professional & Scientific | 138 (44.0%) | 176 (56.0%) |
| Enterprise Management | 0 (0.0%) | 0 (0.0%) |
| Administrative & Support | 22 (75.9%) | 7 (24.1%) |
| Educational Services | 115 (35.4%) | 210 (64.6%) |
| Health Care & Social Assistance | 16 (4.5%) | 340 (95.5%) |
| Arts, Entertainment & Recreation | 37 (50.7%) | 36 (49.3%) |
| Accommodation & Food Services | 69 (41.3%) | 98 (58.7%) |
| Public Administration | 108 (81.2%) | 25 (18.8%) |
| Total | 1,645 (52.6%) | 1,483 (47.4%) |
Education in Milford
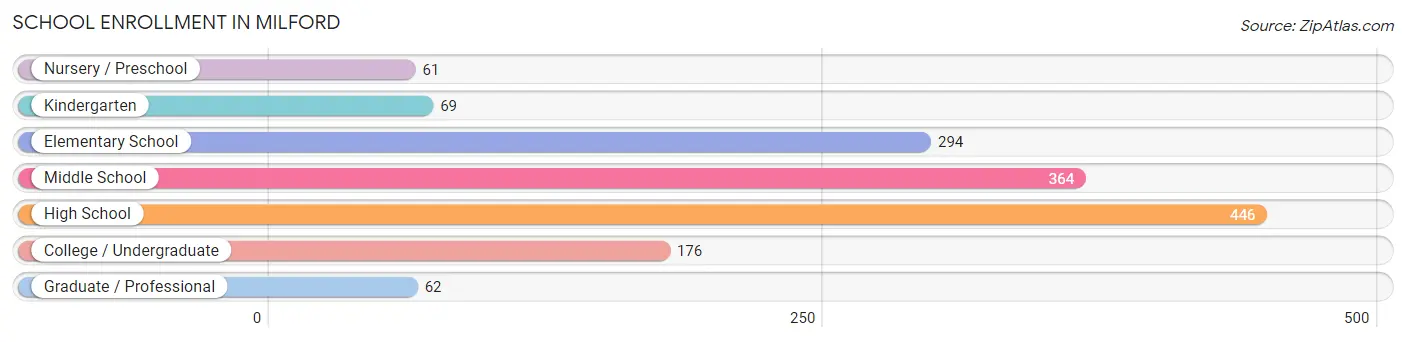
School Enrollment in Milford
The most common levels of schooling among the 1,472 students in Milford are high school (446 | 30.3%), middle school (364 | 24.7%), and elementary school (294 | 20.0%).
| School Level | # Students | % Students |
| Nursery / Preschool | 61 | 4.1% |
| Kindergarten | 69 | 4.7% |
| Elementary School | 294 | 20.0% |
| Middle School | 364 | 24.7% |
| High School | 446 | 30.3% |
| College / Undergraduate | 176 | 12.0% |
| Graduate / Professional | 62 | 4.2% |
| Total | 1,472 | 100.0% |
School Enrollment by Age by Funding Source in Milford
Out of a total of 1,472 students who are enrolled in schools in Milford, 222 (15.1%) attend a private institution, while the remaining 1,250 (84.9%) are enrolled in public schools. The age group of 25 to 34 year olds has the highest likelihood of being enrolled in private schools, with 10 (100.0% in the age bracket) enrolled. Conversely, the age group of 15 to 17 year olds has the lowest likelihood of being enrolled in a private school, with 388 (97.5% in the age bracket) attending a public institution.
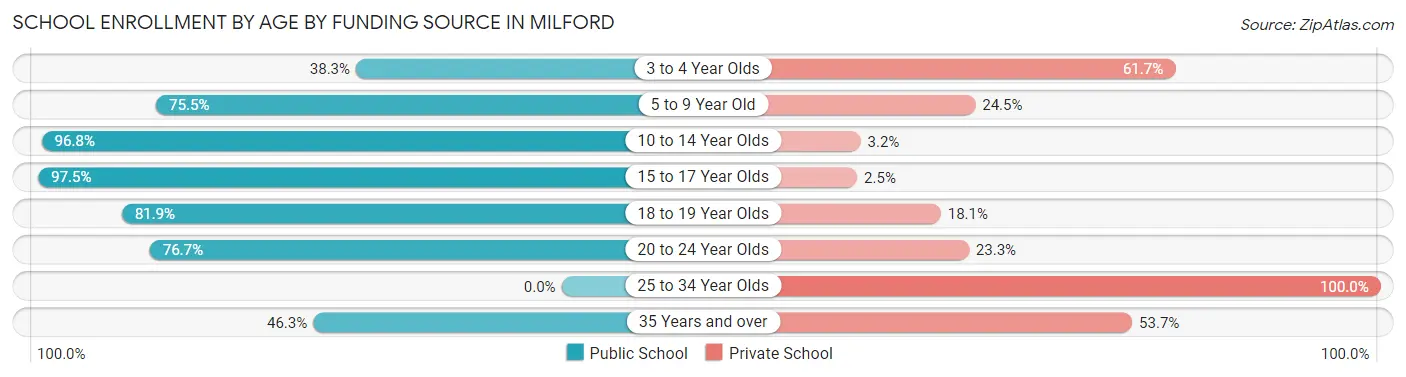
| Age Bracket | Public School | Private School |
| 3 to 4 Year Olds | 18 (38.3%) | 29 (61.7%) |
| 5 to 9 Year Old | 268 (75.5%) | 87 (24.5%) |
| 10 to 14 Year Olds | 398 (96.8%) | 13 (3.2%) |
| 15 to 17 Year Olds | 388 (97.5%) | 10 (2.5%) |
| 18 to 19 Year Olds | 77 (81.9%) | 17 (18.1%) |
| 20 to 24 Year Olds | 69 (76.7%) | 21 (23.3%) |
| 25 to 34 Year Olds | 0 (0.0%) | 10 (100.0%) |
| 35 Years and over | 31 (46.3%) | 36 (53.7%) |
| Total | 1,250 (84.9%) | 222 (15.1%) |
Educational Attainment by Field of Study in Milford
Business (467 | 20.9%), engineering (411 | 18.4%), education (326 | 14.6%), science & technology (164 | 7.3%), and bio, nature & agricultural (121 | 5.4%) are the most common fields of study among 2,230 individuals in Milford who have obtained a bachelor's degree or higher.
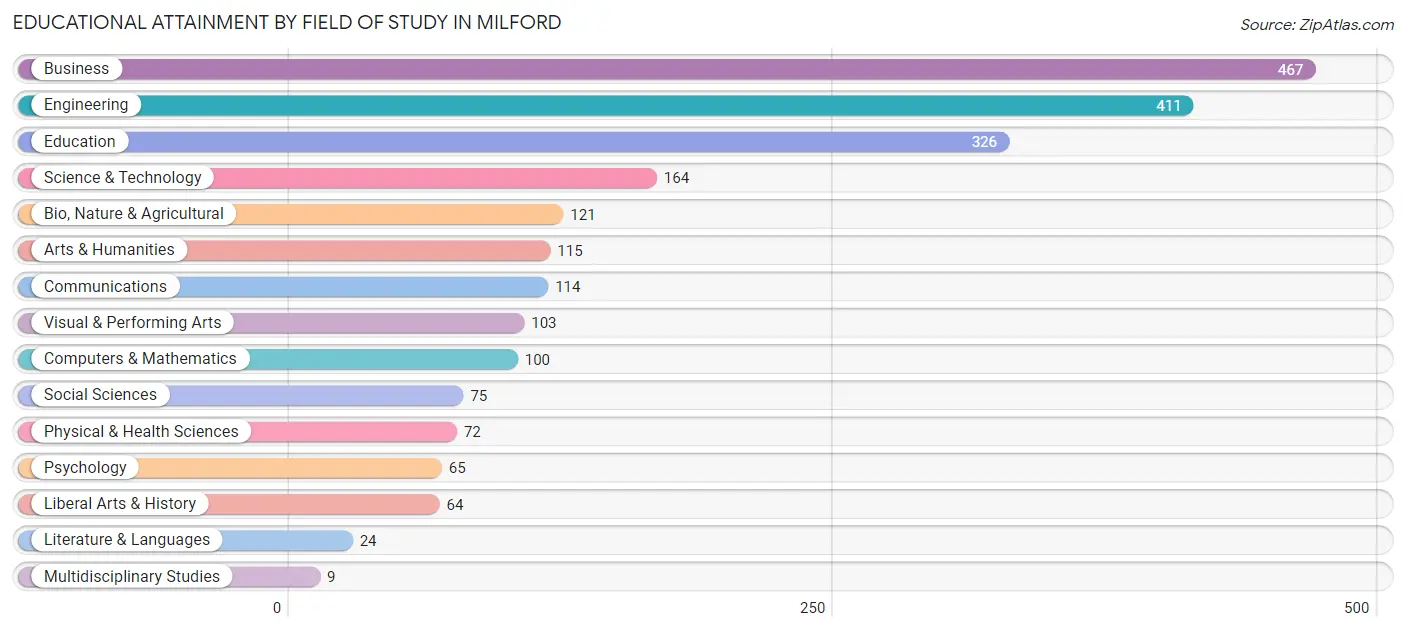
| Field of Study | # Graduates | % Graduates |
| Computers & Mathematics | 100 | 4.5% |
| Bio, Nature & Agricultural | 121 | 5.4% |
| Physical & Health Sciences | 72 | 3.2% |
| Psychology | 65 | 2.9% |
| Social Sciences | 75 | 3.4% |
| Engineering | 411 | 18.4% |
| Multidisciplinary Studies | 9 | 0.4% |
| Science & Technology | 164 | 7.3% |
| Business | 467 | 20.9% |
| Education | 326 | 14.6% |
| Literature & Languages | 24 | 1.1% |
| Liberal Arts & History | 64 | 2.9% |
| Visual & Performing Arts | 103 | 4.6% |
| Communications | 114 | 5.1% |
| Arts & Humanities | 115 | 5.2% |
| Total | 2,230 | 100.0% |
Transportation & Commute in Milford
Vehicle Availability by Sex in Milford
The most prevalent vehicle ownership categories in Milford are males with 2 vehicles (612, accounting for 37.4%) and females with 2 vehicles (495, making up 43.3%).
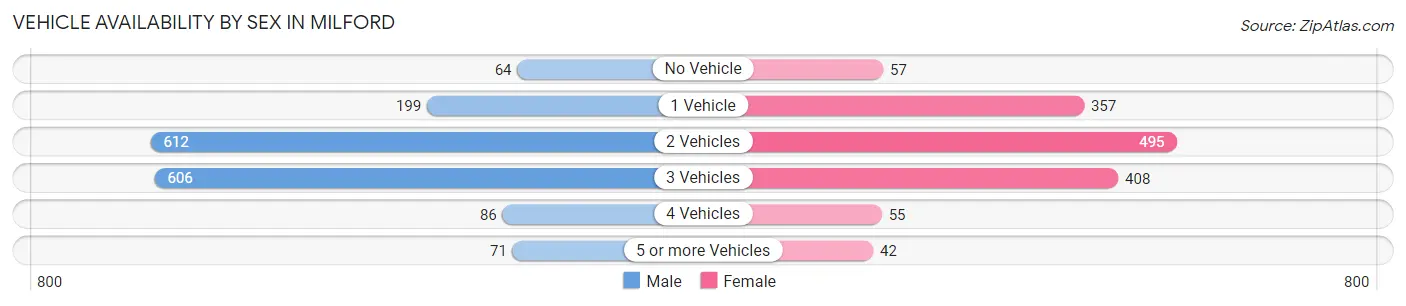
| Vehicles Available | Male | Female |
| No Vehicle | 64 (3.9%) | 57 (4.0%) |
| 1 Vehicle | 199 (12.1%) | 357 (25.3%) |
| 2 Vehicles | 612 (37.4%) | 495 (35.0%) |
| 3 Vehicles | 606 (37.0%) | 408 (28.8%) |
| 4 Vehicles | 86 (5.2%) | 55 (3.9%) |
| 5 or more Vehicles | 71 (4.3%) | 42 (3.0%) |
| Total | 1,638 (100.0%) | 1,414 (100.0%) |
Commute Time in Milford
The most frequently occuring commute durations in Milford are 5 to 9 minutes (398 commuters, 15.6%), 30 to 34 minutes (395 commuters, 15.5%), and 45 to 59 minutes (334 commuters, 13.1%).
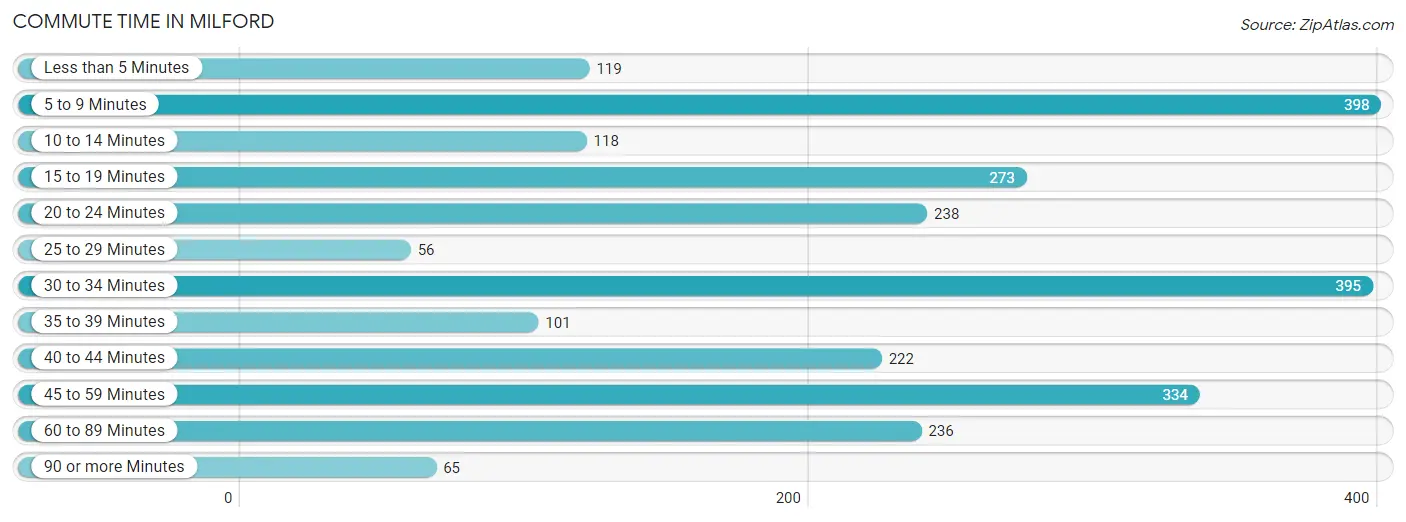
| Commute Time | # Commuters | % Commuters |
| Less than 5 Minutes | 119 | 4.7% |
| 5 to 9 Minutes | 398 | 15.6% |
| 10 to 14 Minutes | 118 | 4.6% |
| 15 to 19 Minutes | 273 | 10.7% |
| 20 to 24 Minutes | 238 | 9.3% |
| 25 to 29 Minutes | 56 | 2.2% |
| 30 to 34 Minutes | 395 | 15.5% |
| 35 to 39 Minutes | 101 | 4.0% |
| 40 to 44 Minutes | 222 | 8.7% |
| 45 to 59 Minutes | 334 | 13.1% |
| 60 to 89 Minutes | 236 | 9.2% |
| 90 or more Minutes | 65 | 2.5% |
Commute Time by Sex in Milford
The most common commute times in Milford are 45 to 59 minutes (270 commuters, 18.9%) for males and 5 to 9 minutes (259 commuters, 23.0%) for females.
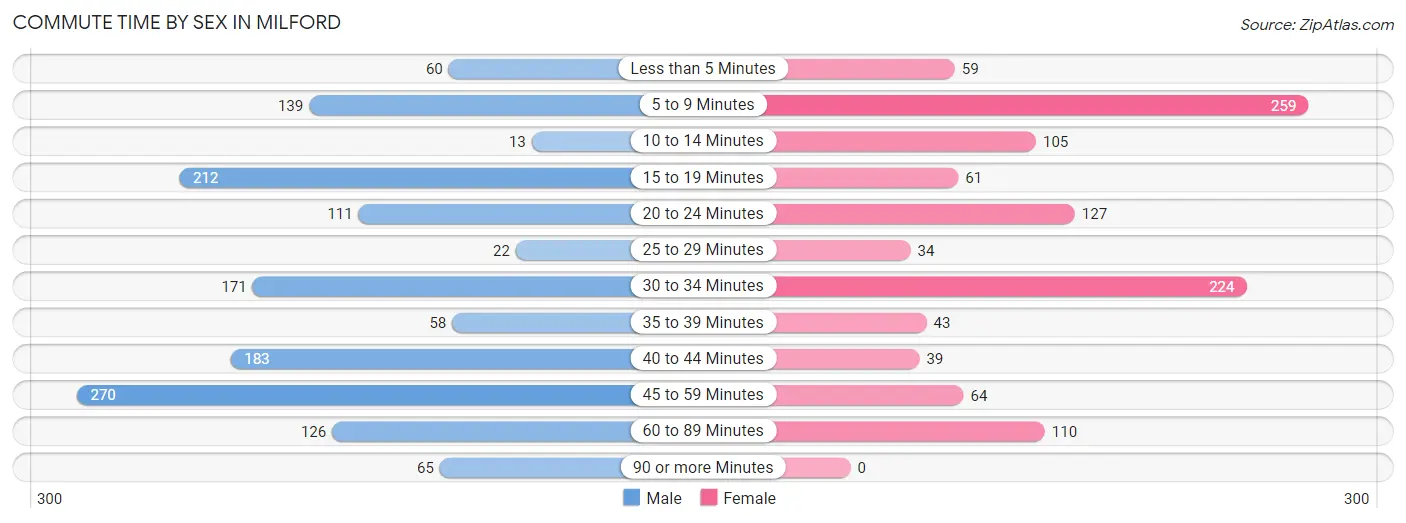
| Commute Time | Male | Female |
| Less than 5 Minutes | 60 (4.2%) | 59 (5.2%) |
| 5 to 9 Minutes | 139 (9.7%) | 259 (23.0%) |
| 10 to 14 Minutes | 13 (0.9%) | 105 (9.3%) |
| 15 to 19 Minutes | 212 (14.8%) | 61 (5.4%) |
| 20 to 24 Minutes | 111 (7.8%) | 127 (11.3%) |
| 25 to 29 Minutes | 22 (1.5%) | 34 (3.0%) |
| 30 to 34 Minutes | 171 (12.0%) | 224 (19.9%) |
| 35 to 39 Minutes | 58 (4.1%) | 43 (3.8%) |
| 40 to 44 Minutes | 183 (12.8%) | 39 (3.5%) |
| 45 to 59 Minutes | 270 (18.9%) | 64 (5.7%) |
| 60 to 89 Minutes | 126 (8.8%) | 110 (9.8%) |
| 90 or more Minutes | 65 (4.5%) | 0 (0.0%) |
Time of Departure to Work by Sex in Milford
The most frequent times of departure to work in Milford are 7:00 AM to 7:29 AM (265, 18.5%) for males and 7:30 AM to 7:59 AM (178, 15.8%) for females.
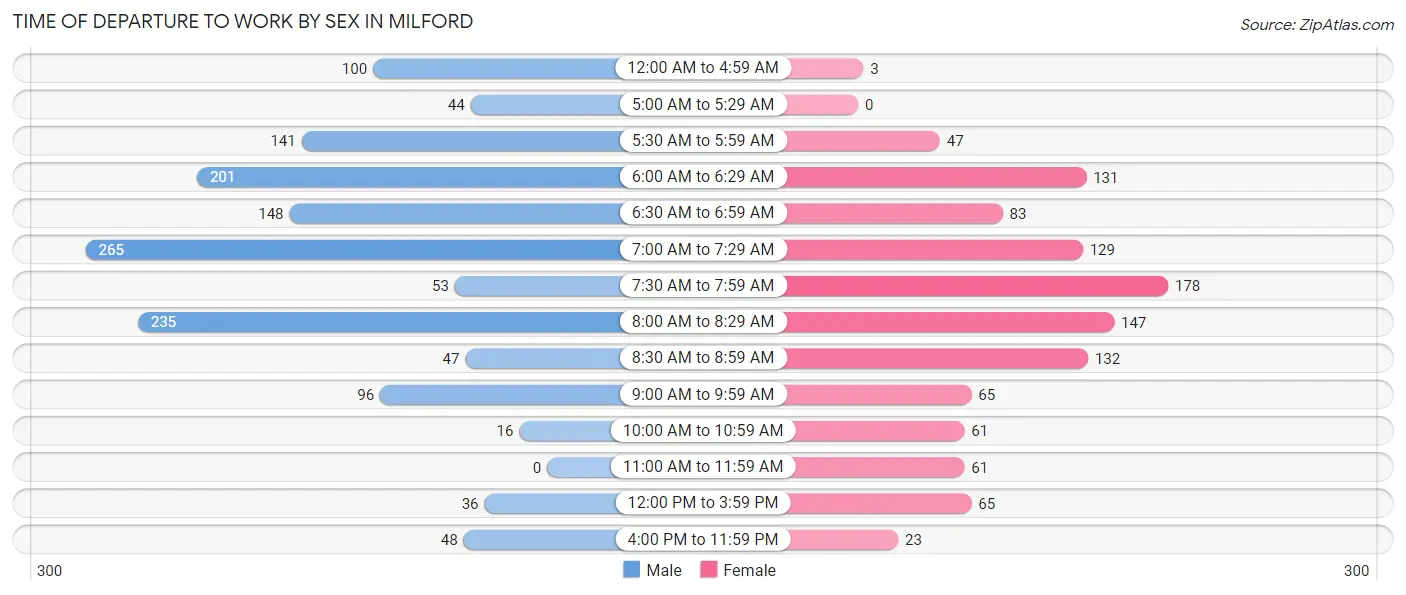
| Time of Departure | Male | Female |
| 12:00 AM to 4:59 AM | 100 (7.0%) | 3 (0.3%) |
| 5:00 AM to 5:29 AM | 44 (3.1%) | 0 (0.0%) |
| 5:30 AM to 5:59 AM | 141 (9.9%) | 47 (4.2%) |
| 6:00 AM to 6:29 AM | 201 (14.1%) | 131 (11.6%) |
| 6:30 AM to 6:59 AM | 148 (10.3%) | 83 (7.4%) |
| 7:00 AM to 7:29 AM | 265 (18.5%) | 129 (11.5%) |
| 7:30 AM to 7:59 AM | 53 (3.7%) | 178 (15.8%) |
| 8:00 AM to 8:29 AM | 235 (16.4%) | 147 (13.1%) |
| 8:30 AM to 8:59 AM | 47 (3.3%) | 132 (11.7%) |
| 9:00 AM to 9:59 AM | 96 (6.7%) | 65 (5.8%) |
| 10:00 AM to 10:59 AM | 16 (1.1%) | 61 (5.4%) |
| 11:00 AM to 11:59 AM | 0 (0.0%) | 61 (5.4%) |
| 12:00 PM to 3:59 PM | 36 (2.5%) | 65 (5.8%) |
| 4:00 PM to 11:59 PM | 48 (3.4%) | 23 (2.0%) |
| Total | 1,430 (100.0%) | 1,125 (100.0%) |
Housing Occupancy in Milford
Occupancy by Ownership in Milford
Of the total 2,616 dwellings in Milford, owner-occupied units account for 1,991 (76.1%), while renter-occupied units make up 625 (23.9%).
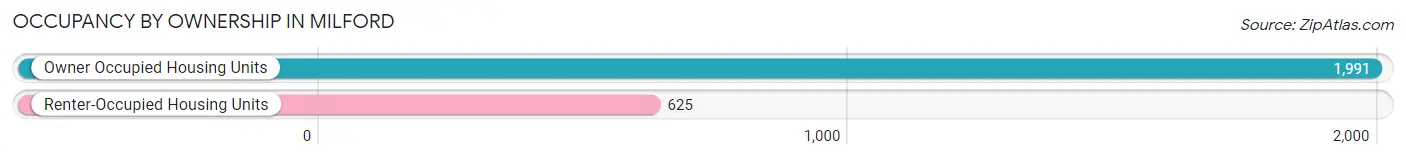
| Occupancy | # Housing Units | % Housing Units |
| Owner Occupied Housing Units | 1,991 | 76.1% |
| Renter-Occupied Housing Units | 625 | 23.9% |
| Total Occupied Housing Units | 2,616 | 100.0% |
Occupancy by Household Size in Milford
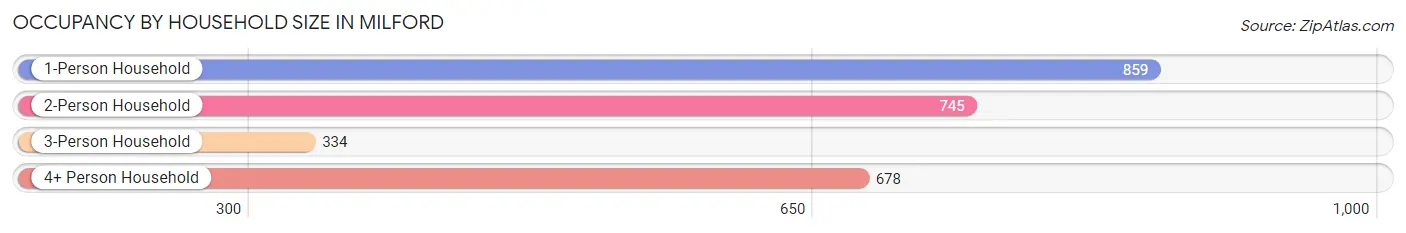
| Household Size | # Housing Units | % Housing Units |
| 1-Person Household | 859 | 32.8% |
| 2-Person Household | 745 | 28.5% |
| 3-Person Household | 334 | 12.8% |
| 4+ Person Household | 678 | 25.9% |
| Total Housing Units | 2,616 | 100.0% |
Occupancy by Ownership by Household Size in Milford
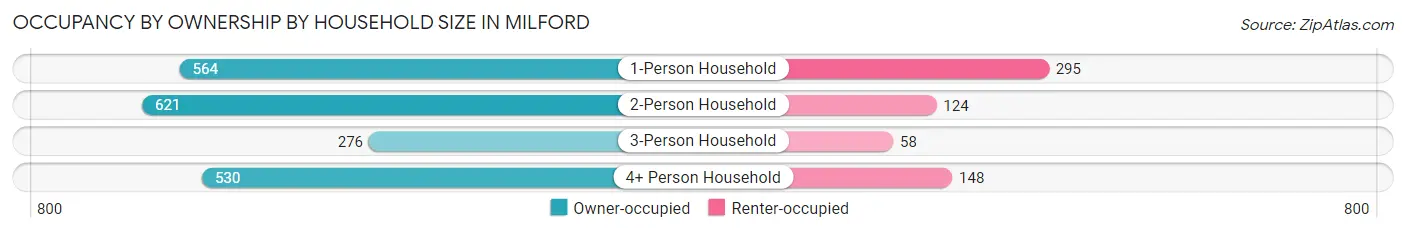
| Household Size | Owner-occupied | Renter-occupied |
| 1-Person Household | 564 (65.7%) | 295 (34.3%) |
| 2-Person Household | 621 (83.4%) | 124 (16.6%) |
| 3-Person Household | 276 (82.6%) | 58 (17.4%) |
| 4+ Person Household | 530 (78.2%) | 148 (21.8%) |
| Total Housing Units | 1,991 (76.1%) | 625 (23.9%) |
Occupancy by Educational Attainment in Milford
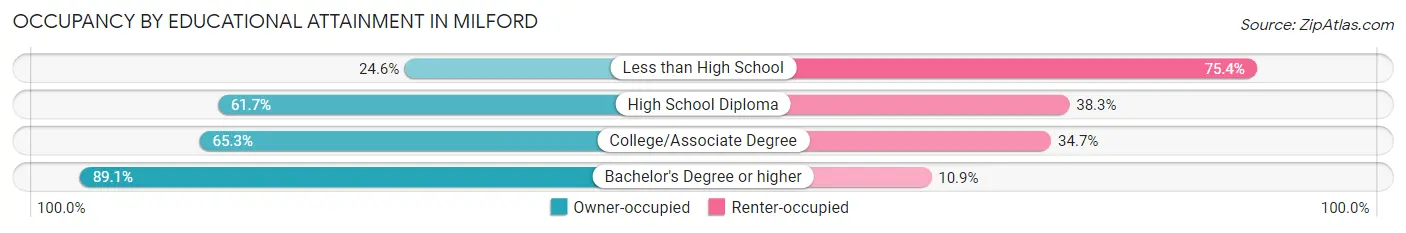
| Household Size | Owner-occupied | Renter-occupied |
| Less than High School | 14 (24.6%) | 43 (75.4%) |
| High School Diploma | 274 (61.7%) | 170 (38.3%) |
| College/Associate Degree | 497 (65.3%) | 264 (34.7%) |
| Bachelor's Degree or higher | 1,206 (89.1%) | 148 (10.9%) |
Occupancy by Age of Householder in Milford
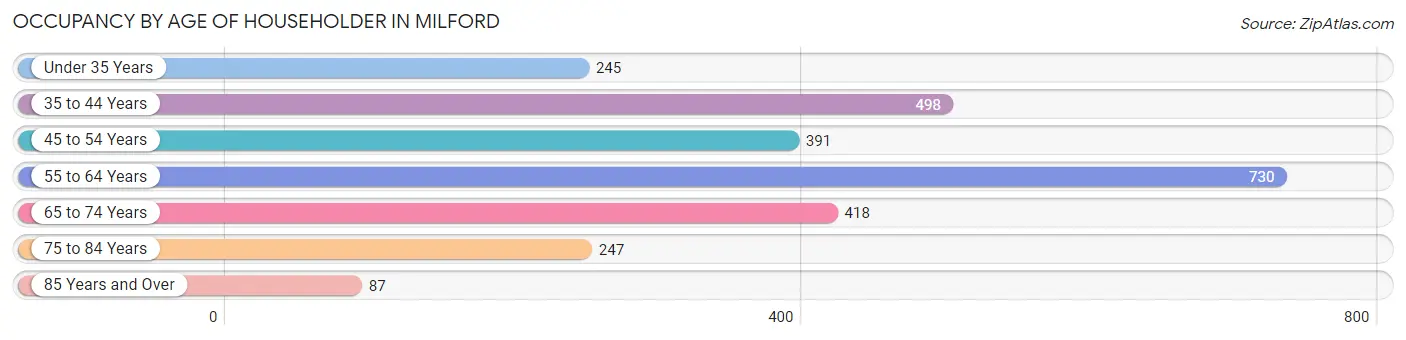
| Age Bracket | # Households | % Households |
| Under 35 Years | 245 | 9.4% |
| 35 to 44 Years | 498 | 19.0% |
| 45 to 54 Years | 391 | 14.9% |
| 55 to 64 Years | 730 | 27.9% |
| 65 to 74 Years | 418 | 16.0% |
| 75 to 84 Years | 247 | 9.4% |
| 85 Years and Over | 87 | 3.3% |
| Total | 2,616 | 100.0% |
Housing Finances in Milford
Median Income by Occupancy in Milford
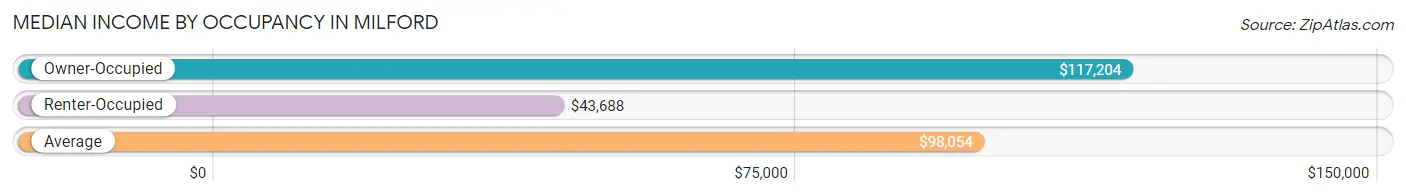
| Occupancy Type | # Households | Median Income |
| Owner-Occupied | 1,991 (76.1%) | $117,204 |
| Renter-Occupied | 625 (23.9%) | $43,688 |
| Average | 2,616 (100.0%) | $98,054 |
Occupancy by Householder Income Bracket in Milford
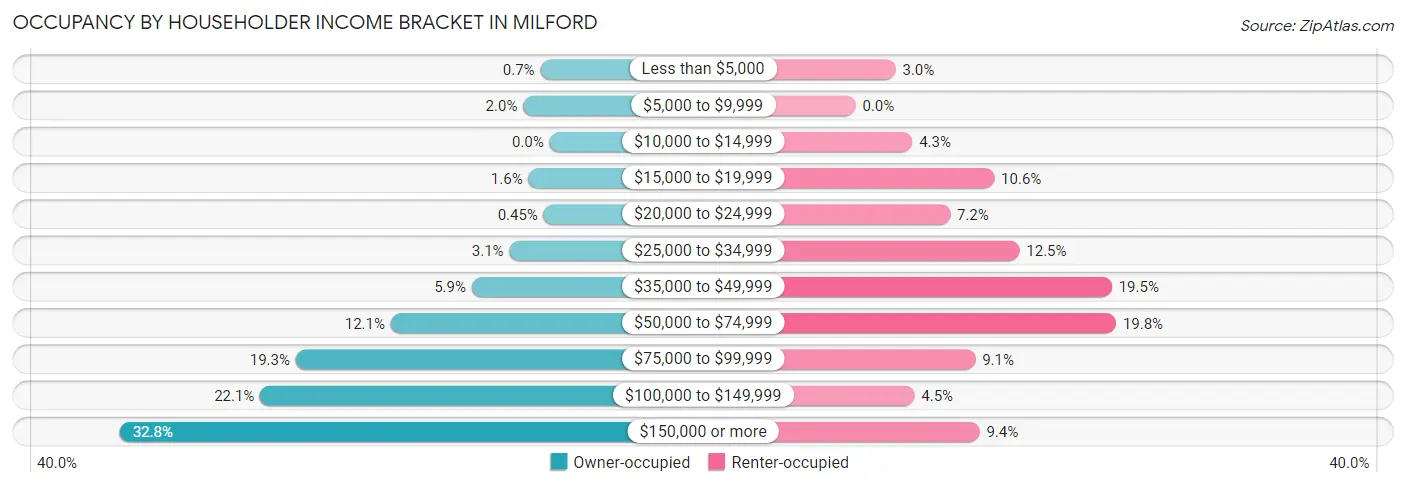
| Income Bracket | Owner-occupied | Renter-occupied |
| Less than $5,000 | 14 (0.7%) | 19 (3.0%) |
| $5,000 to $9,999 | 40 (2.0%) | 0 (0.0%) |
| $10,000 to $14,999 | 0 (0.0%) | 27 (4.3%) |
| $15,000 to $19,999 | 32 (1.6%) | 66 (10.6%) |
| $20,000 to $24,999 | 9 (0.4%) | 45 (7.2%) |
| $25,000 to $34,999 | 61 (3.1%) | 78 (12.5%) |
| $35,000 to $49,999 | 118 (5.9%) | 122 (19.5%) |
| $50,000 to $74,999 | 241 (12.1%) | 124 (19.8%) |
| $75,000 to $99,999 | 385 (19.3%) | 57 (9.1%) |
| $100,000 to $149,999 | 439 (22.1%) | 28 (4.5%) |
| $150,000 or more | 652 (32.8%) | 59 (9.4%) |
| Total | 1,991 (100.0%) | 625 (100.0%) |
Monthly Housing Cost Tiers in Milford
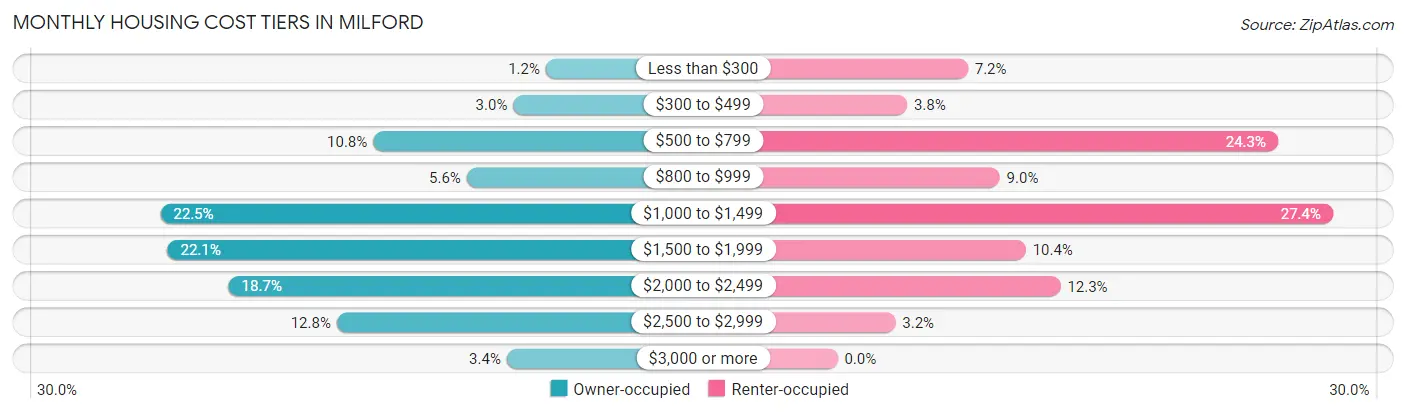
| Monthly Cost | Owner-occupied | Renter-occupied |
| Less than $300 | 24 (1.2%) | 45 (7.2%) |
| $300 to $499 | 60 (3.0%) | 24 (3.8%) |
| $500 to $799 | 214 (10.7%) | 152 (24.3%) |
| $800 to $999 | 111 (5.6%) | 56 (9.0%) |
| $1,000 to $1,499 | 448 (22.5%) | 171 (27.4%) |
| $1,500 to $1,999 | 440 (22.1%) | 65 (10.4%) |
| $2,000 to $2,499 | 373 (18.7%) | 77 (12.3%) |
| $2,500 to $2,999 | 254 (12.8%) | 20 (3.2%) |
| $3,000 or more | 67 (3.4%) | 0 (0.0%) |
| Total | 1,991 (100.0%) | 625 (100.0%) |
Physical Housing Characteristics in Milford
Housing Structures in Milford
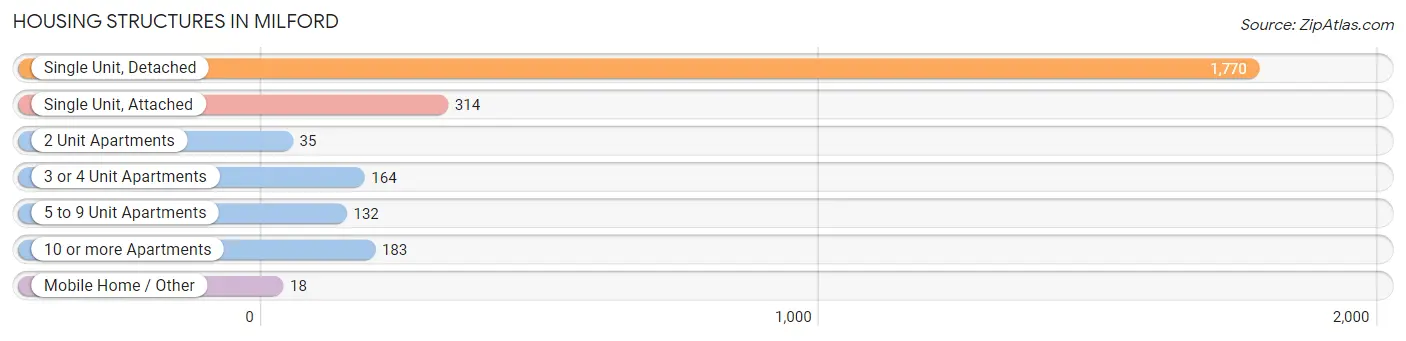
| Structure Type | # Housing Units | % Housing Units |
| Single Unit, Detached | 1,770 | 67.7% |
| Single Unit, Attached | 314 | 12.0% |
| 2 Unit Apartments | 35 | 1.3% |
| 3 or 4 Unit Apartments | 164 | 6.3% |
| 5 to 9 Unit Apartments | 132 | 5.1% |
| 10 or more Apartments | 183 | 7.0% |
| Mobile Home / Other | 18 | 0.7% |
| Total | 2,616 | 100.0% |
Housing Structures by Occupancy in Milford
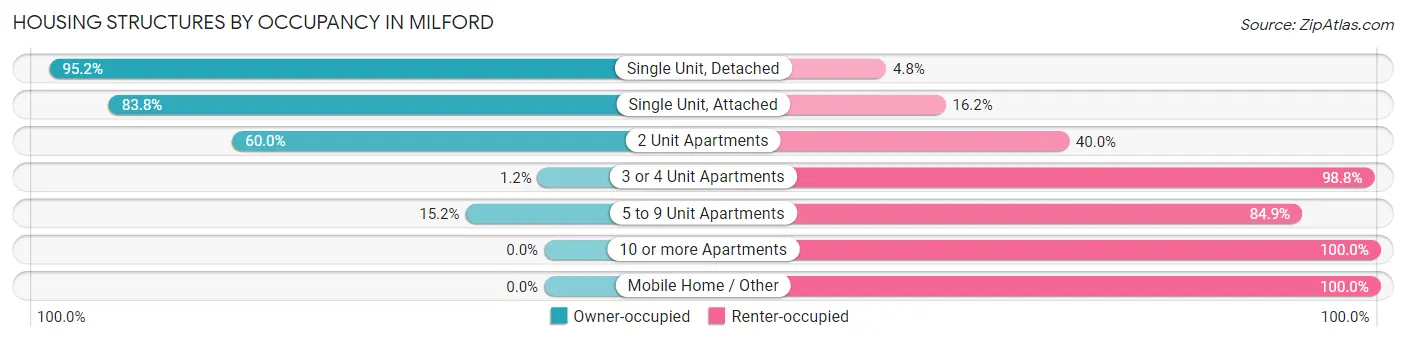
| Structure Type | Owner-occupied | Renter-occupied |
| Single Unit, Detached | 1,685 (95.2%) | 85 (4.8%) |
| Single Unit, Attached | 263 (83.8%) | 51 (16.2%) |
| 2 Unit Apartments | 21 (60.0%) | 14 (40.0%) |
| 3 or 4 Unit Apartments | 2 (1.2%) | 162 (98.8%) |
| 5 to 9 Unit Apartments | 20 (15.1%) | 112 (84.9%) |
| 10 or more Apartments | 0 (0.0%) | 183 (100.0%) |
| Mobile Home / Other | 0 (0.0%) | 18 (100.0%) |
| Total | 1,991 (76.1%) | 625 (23.9%) |
Housing Structures by Number of Rooms in Milford
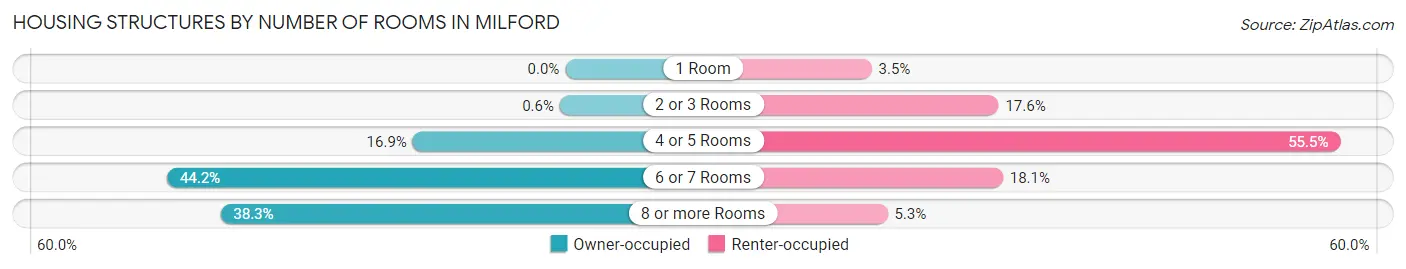
| Number of Rooms | Owner-occupied | Renter-occupied |
| 1 Room | 0 (0.0%) | 22 (3.5%) |
| 2 or 3 Rooms | 12 (0.6%) | 110 (17.6%) |
| 4 or 5 Rooms | 337 (16.9%) | 347 (55.5%) |
| 6 or 7 Rooms | 880 (44.2%) | 113 (18.1%) |
| 8 or more Rooms | 762 (38.3%) | 33 (5.3%) |
| Total | 1,991 (100.0%) | 625 (100.0%) |
Housing Structure by Heating Type in Milford
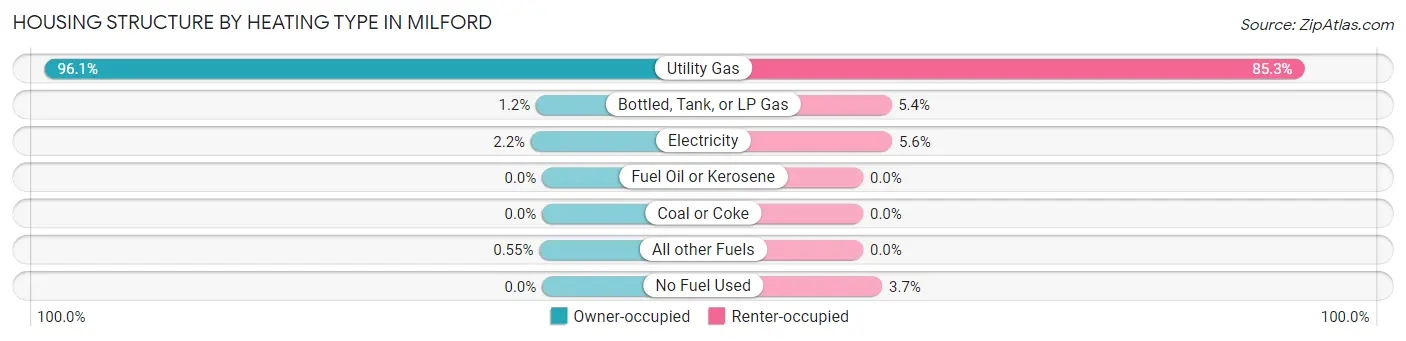
| Heating Type | Owner-occupied | Renter-occupied |
| Utility Gas | 1,914 (96.1%) | 533 (85.3%) |
| Bottled, Tank, or LP Gas | 23 (1.2%) | 34 (5.4%) |
| Electricity | 43 (2.2%) | 35 (5.6%) |
| Fuel Oil or Kerosene | 0 (0.0%) | 0 (0.0%) |
| Coal or Coke | 0 (0.0%) | 0 (0.0%) |
| All other Fuels | 11 (0.5%) | 0 (0.0%) |
| No Fuel Used | 0 (0.0%) | 23 (3.7%) |
| Total | 1,991 (100.0%) | 625 (100.0%) |
Household Vehicle Usage in Milford
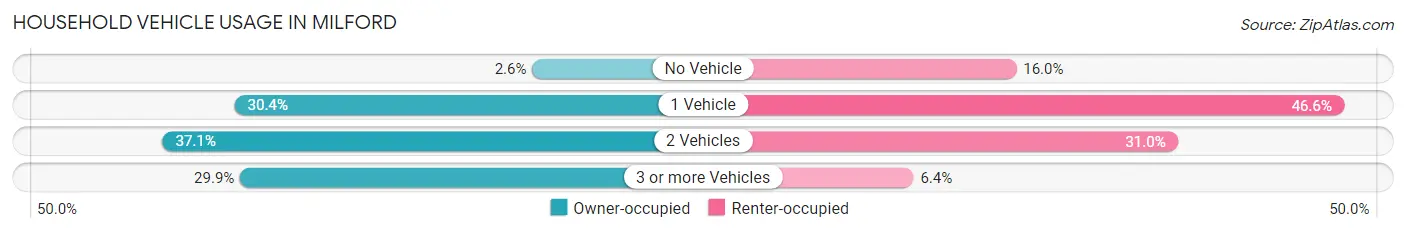
| Vehicles per Household | Owner-occupied | Renter-occupied |
| No Vehicle | 52 (2.6%) | 100 (16.0%) |
| 1 Vehicle | 605 (30.4%) | 291 (46.6%) |
| 2 Vehicles | 739 (37.1%) | 194 (31.0%) |
| 3 or more Vehicles | 595 (29.9%) | 40 (6.4%) |
| Total | 1,991 (100.0%) | 625 (100.0%) |
Real Estate & Mortgages in Milford
Real Estate and Mortgage Overview in Milford
| Characteristic | Without Mortgage | With Mortgage |
| Housing Units | 524 | 1,467 |
| Median Property Value | $289,700 | $327,200 |
| Median Household Income | $79,167 | $552 |
| Monthly Housing Costs | $759 | $67 |
| Real Estate Taxes | $3,953 | $10 |
Property Value by Mortgage Status in Milford
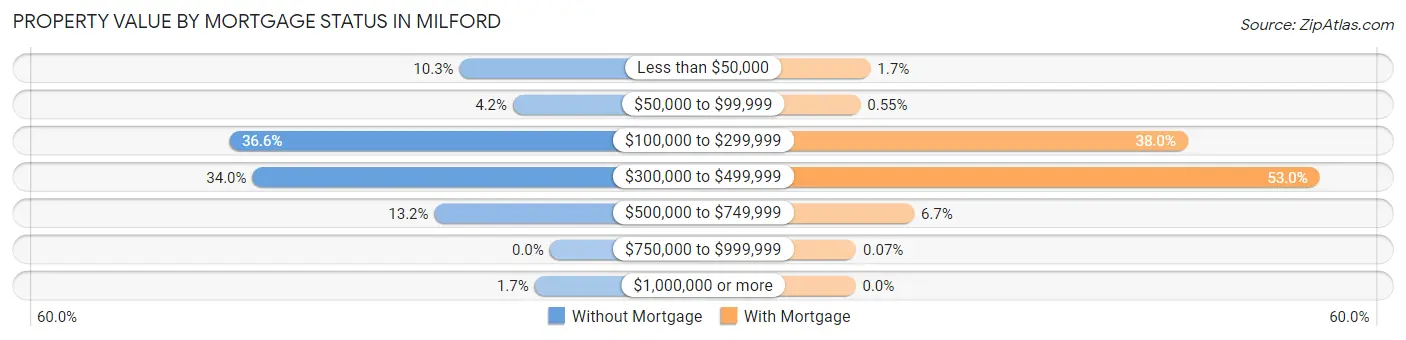
| Property Value | Without Mortgage | With Mortgage |
| Less than $50,000 | 54 (10.3%) | 25 (1.7%) |
| $50,000 to $99,999 | 22 (4.2%) | 8 (0.5%) |
| $100,000 to $299,999 | 192 (36.6%) | 557 (38.0%) |
| $300,000 to $499,999 | 178 (34.0%) | 778 (53.0%) |
| $500,000 to $749,999 | 69 (13.2%) | 98 (6.7%) |
| $750,000 to $999,999 | 0 (0.0%) | 1 (0.1%) |
| $1,000,000 or more | 9 (1.7%) | 0 (0.0%) |
| Total | 524 (100.0%) | 1,467 (100.0%) |
Household Income by Mortgage Status in Milford
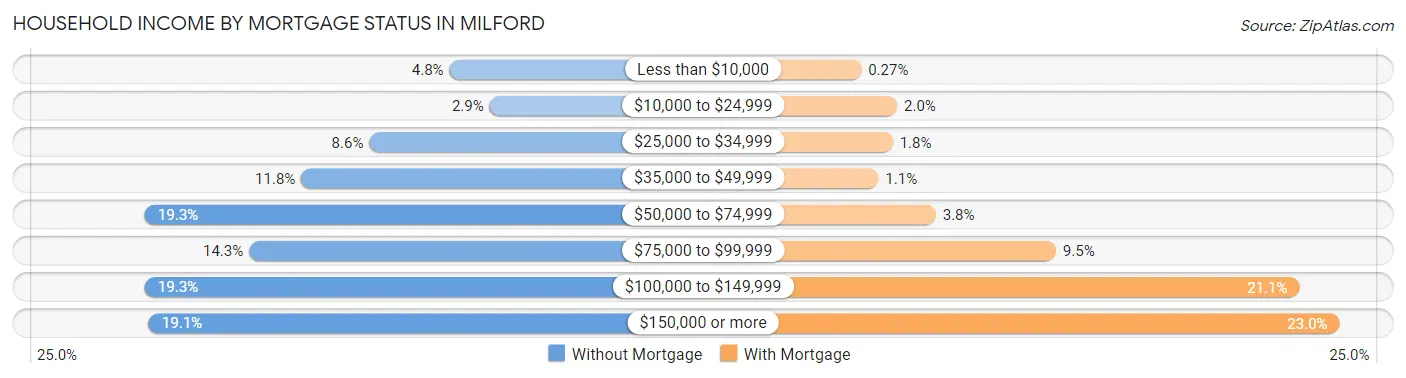
| Household Income | Without Mortgage | With Mortgage |
| Less than $10,000 | 25 (4.8%) | 4 (0.3%) |
| $10,000 to $24,999 | 15 (2.9%) | 29 (2.0%) |
| $25,000 to $34,999 | 45 (8.6%) | 26 (1.8%) |
| $35,000 to $49,999 | 62 (11.8%) | 16 (1.1%) |
| $50,000 to $74,999 | 101 (19.3%) | 56 (3.8%) |
| $75,000 to $99,999 | 75 (14.3%) | 140 (9.5%) |
| $100,000 to $149,999 | 101 (19.3%) | 310 (21.1%) |
| $150,000 or more | 100 (19.1%) | 338 (23.0%) |
| Total | 524 (100.0%) | 1,467 (100.0%) |
Property Value to Household Income Ratio in Milford
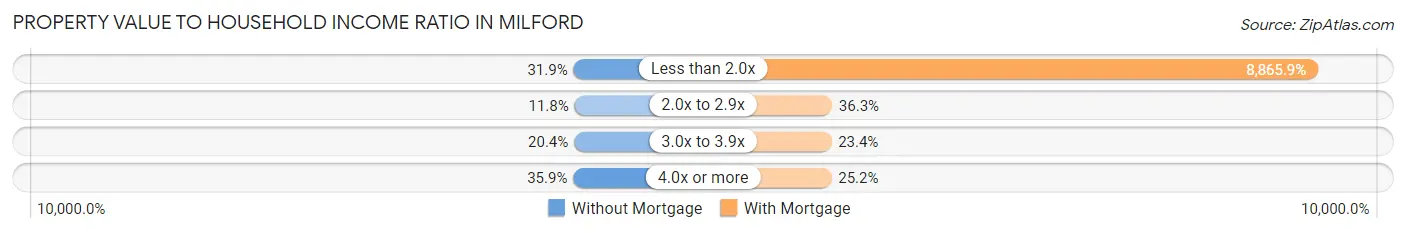
| Value-to-Income Ratio | Without Mortgage | With Mortgage |
| Less than 2.0x | 167 (31.9%) | 130,063 (8,865.9%) |
| 2.0x to 2.9x | 62 (11.8%) | 533 (36.3%) |
| 3.0x to 3.9x | 107 (20.4%) | 343 (23.4%) |
| 4.0x or more | 188 (35.9%) | 370 (25.2%) |
| Total | 524 (100.0%) | 1,467 (100.0%) |
Real Estate Taxes by Mortgage Status in Milford
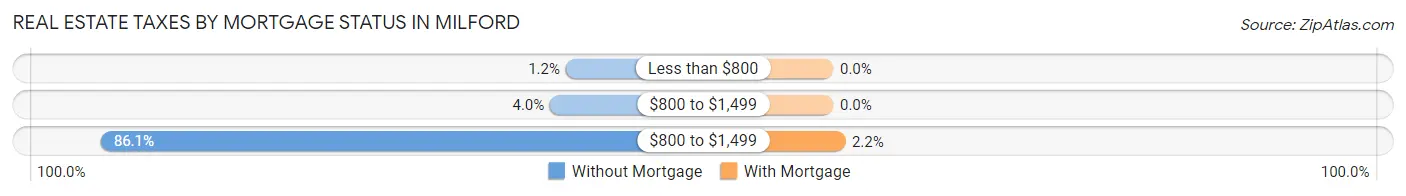
| Property Taxes | Without Mortgage | With Mortgage |
| Less than $800 | 6 (1.1%) | 0 (0.0%) |
| $800 to $1,499 | 21 (4.0%) | 0 (0.0%) |
| $800 to $1,499 | 451 (86.1%) | 32 (2.2%) |
| Total | 524 (100.0%) | 1,467 (100.0%) |
Health & Disability in Milford
Health Insurance Coverage by Age in Milford
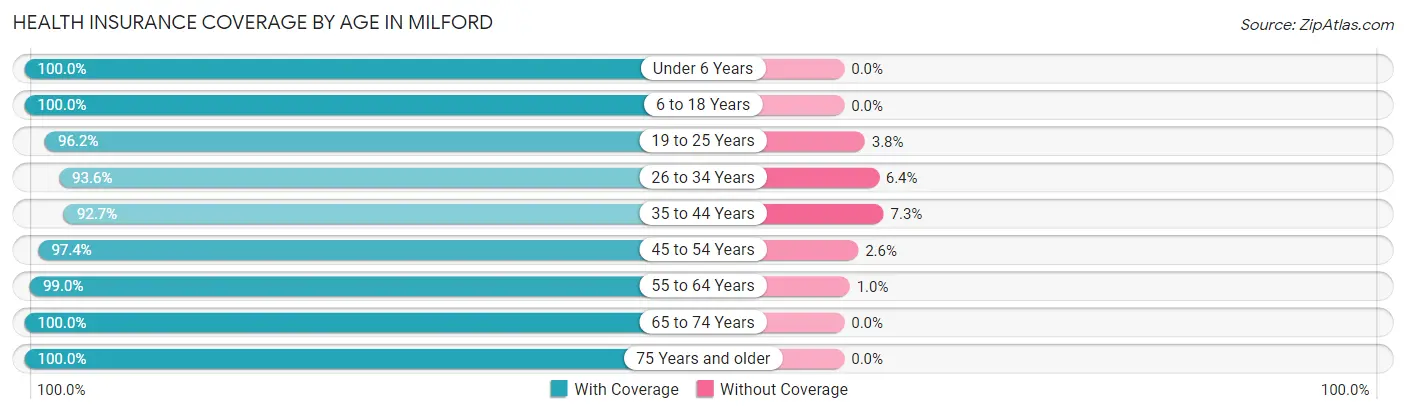
| Age Bracket | With Coverage | Without Coverage |
| Under 6 Years | 513 (100.0%) | 0 (0.0%) |
| 6 to 18 Years | 1,197 (100.0%) | 0 (0.0%) |
| 19 to 25 Years | 327 (96.2%) | 13 (3.8%) |
| 26 to 34 Years | 538 (93.6%) | 37 (6.4%) |
| 35 to 44 Years | 759 (92.7%) | 60 (7.3%) |
| 45 to 54 Years | 752 (97.4%) | 20 (2.6%) |
| 55 to 64 Years | 1,074 (99.0%) | 11 (1.0%) |
| 65 to 74 Years | 692 (100.0%) | 0 (0.0%) |
| 75 Years and older | 448 (100.0%) | 0 (0.0%) |
| Total | 6,300 (97.8%) | 141 (2.2%) |
Health Insurance Coverage by Citizenship Status in Milford
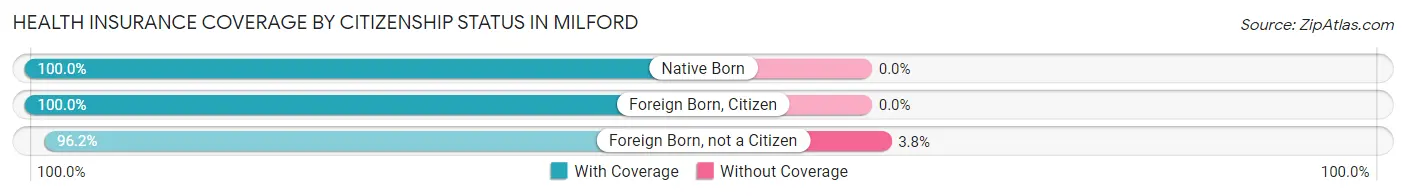
| Citizenship Status | With Coverage | Without Coverage |
| Native Born | 513 (100.0%) | 0 (0.0%) |
| Foreign Born, Citizen | 1,197 (100.0%) | 0 (0.0%) |
| Foreign Born, not a Citizen | 327 (96.2%) | 13 (3.8%) |
Health Insurance Coverage by Household Income in Milford
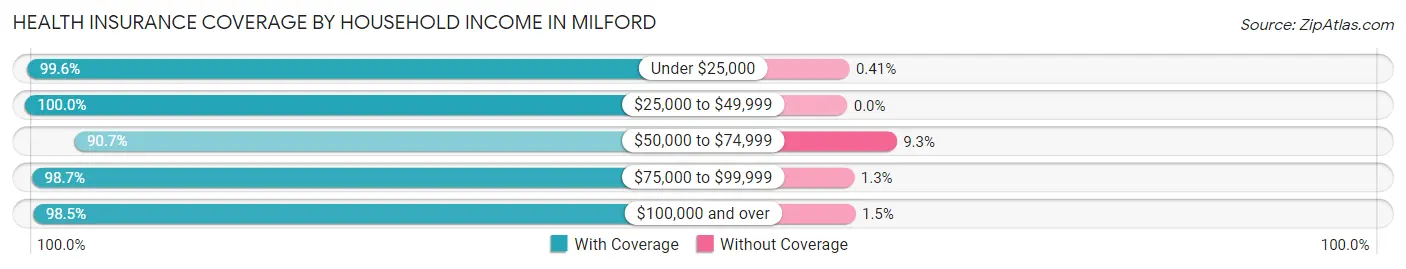
| Household Income | With Coverage | Without Coverage |
| Under $25,000 | 486 (99.6%) | 2 (0.4%) |
| $25,000 to $49,999 | 613 (100.0%) | 0 (0.0%) |
| $50,000 to $74,999 | 696 (90.7%) | 71 (9.3%) |
| $75,000 to $99,999 | 972 (98.7%) | 13 (1.3%) |
| $100,000 and over | 3,524 (98.5%) | 55 (1.5%) |
Public vs Private Health Insurance Coverage by Age in Milford
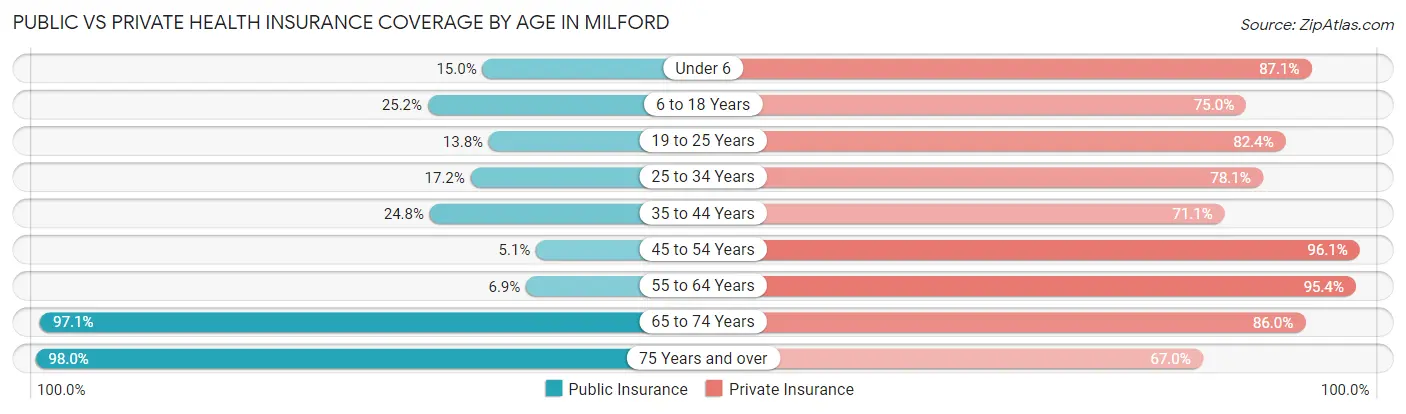
| Age Bracket | Public Insurance | Private Insurance |
| Under 6 | 77 (15.0%) | 447 (87.1%) |
| 6 to 18 Years | 301 (25.2%) | 898 (75.0%) |
| 19 to 25 Years | 47 (13.8%) | 280 (82.4%) |
| 25 to 34 Years | 99 (17.2%) | 449 (78.1%) |
| 35 to 44 Years | 203 (24.8%) | 582 (71.1%) |
| 45 to 54 Years | 39 (5.1%) | 742 (96.1%) |
| 55 to 64 Years | 75 (6.9%) | 1,035 (95.4%) |
| 65 to 74 Years | 672 (97.1%) | 595 (86.0%) |
| 75 Years and over | 439 (98.0%) | 300 (67.0%) |
| Total | 1,952 (30.3%) | 5,328 (82.7%) |
Disability Status by Sex by Age in Milford
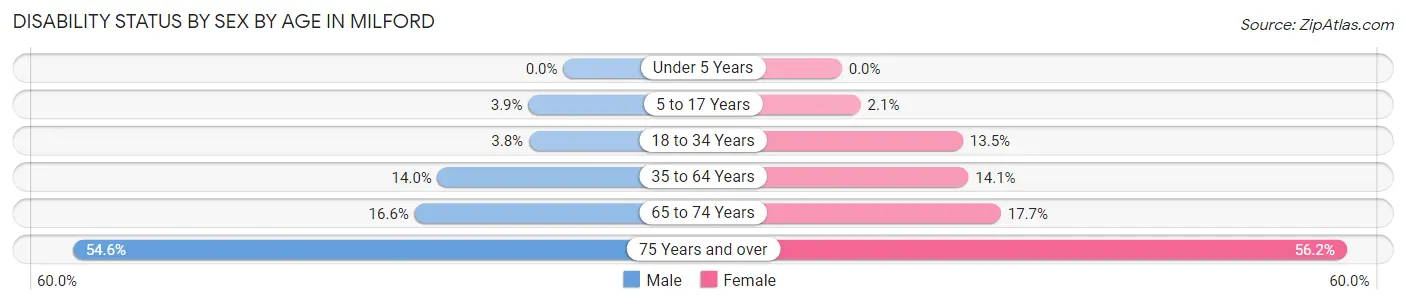
| Age Bracket | Male | Female |
| Under 5 Years | 0 (0.0%) | 0 (0.0%) |
| 5 to 17 Years | 24 (3.9%) | 13 (2.1%) |
| 18 to 34 Years | 22 (3.8%) | 53 (13.5%) |
| 35 to 64 Years | 179 (14.0%) | 197 (14.1%) |
| 65 to 74 Years | 51 (16.6%) | 68 (17.7%) |
| 75 Years and over | 100 (54.6%) | 149 (56.2%) |
Disability Class by Sex by Age in Milford
Disability Class: Hearing Difficulty
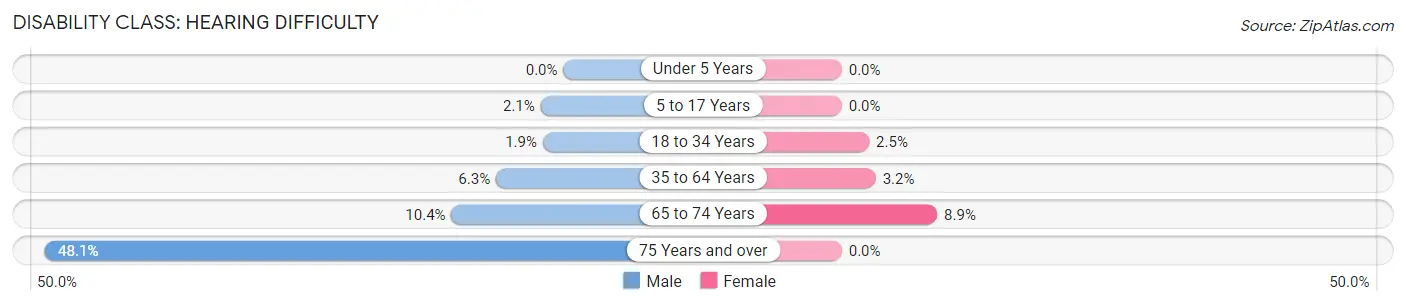
| Age Bracket | Male | Female |
| Under 5 Years | 0 (0.0%) | 0 (0.0%) |
| 5 to 17 Years | 13 (2.1%) | 0 (0.0%) |
| 18 to 34 Years | 11 (1.9%) | 10 (2.5%) |
| 35 to 64 Years | 80 (6.2%) | 44 (3.2%) |
| 65 to 74 Years | 32 (10.4%) | 34 (8.8%) |
| 75 Years and over | 88 (48.1%) | 0 (0.0%) |
Disability Class: Vision Difficulty
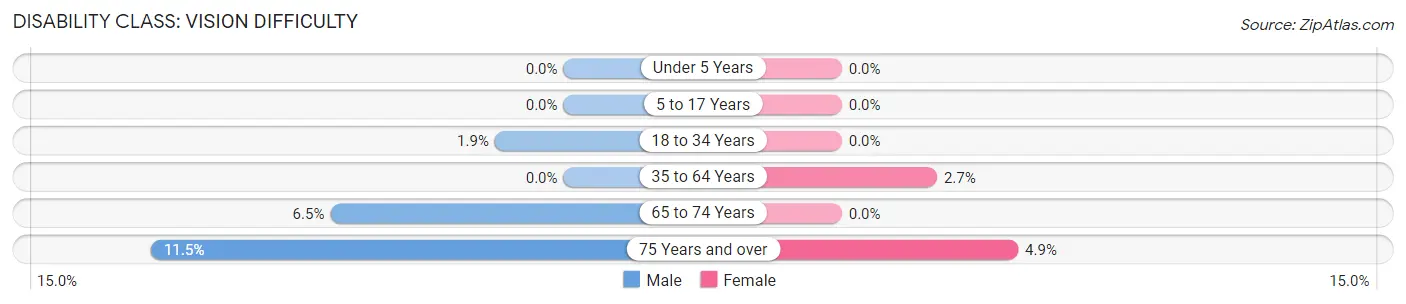
| Age Bracket | Male | Female |
| Under 5 Years | 0 (0.0%) | 0 (0.0%) |
| 5 to 17 Years | 0 (0.0%) | 0 (0.0%) |
| 18 to 34 Years | 11 (1.9%) | 0 (0.0%) |
| 35 to 64 Years | 0 (0.0%) | 37 (2.6%) |
| 65 to 74 Years | 20 (6.5%) | 0 (0.0%) |
| 75 Years and over | 21 (11.5%) | 13 (4.9%) |
Disability Class: Cognitive Difficulty
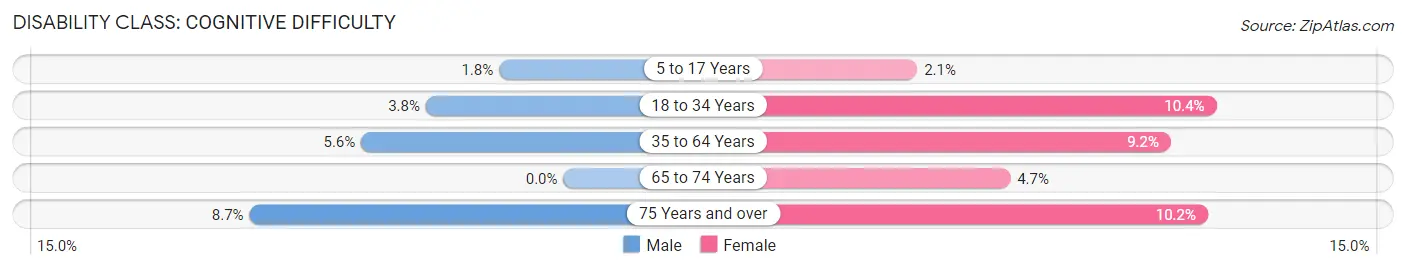
| Age Bracket | Male | Female |
| 5 to 17 Years | 11 (1.8%) | 13 (2.1%) |
| 18 to 34 Years | 22 (3.8%) | 41 (10.4%) |
| 35 to 64 Years | 72 (5.6%) | 128 (9.2%) |
| 65 to 74 Years | 0 (0.0%) | 18 (4.7%) |
| 75 Years and over | 16 (8.7%) | 27 (10.2%) |
Disability Class: Ambulatory Difficulty
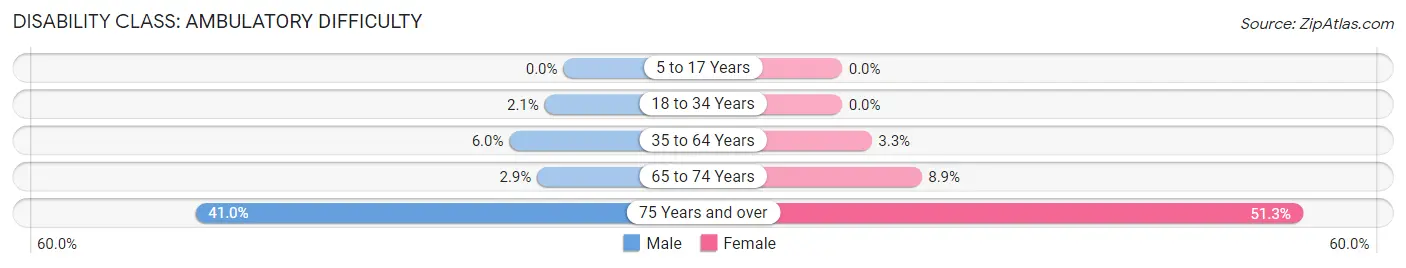
| Age Bracket | Male | Female |
| 5 to 17 Years | 0 (0.0%) | 0 (0.0%) |
| 18 to 34 Years | 12 (2.1%) | 0 (0.0%) |
| 35 to 64 Years | 77 (6.0%) | 46 (3.3%) |
| 65 to 74 Years | 9 (2.9%) | 34 (8.8%) |
| 75 Years and over | 75 (41.0%) | 136 (51.3%) |
Disability Class: Self-Care Difficulty
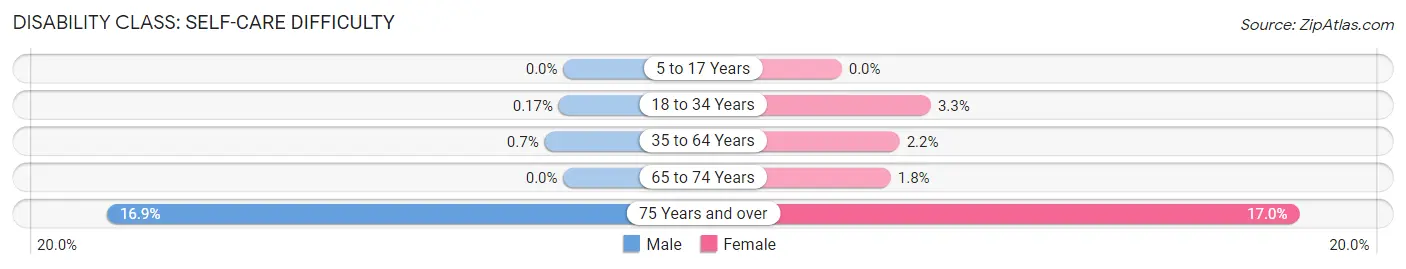
| Age Bracket | Male | Female |
| 5 to 17 Years | 0 (0.0%) | 0 (0.0%) |
| 18 to 34 Years | 1 (0.2%) | 13 (3.3%) |
| 35 to 64 Years | 9 (0.7%) | 30 (2.1%) |
| 65 to 74 Years | 0 (0.0%) | 7 (1.8%) |
| 75 Years and over | 31 (16.9%) | 45 (17.0%) |
Technology Access in Milford
Computing Device Access in Milford
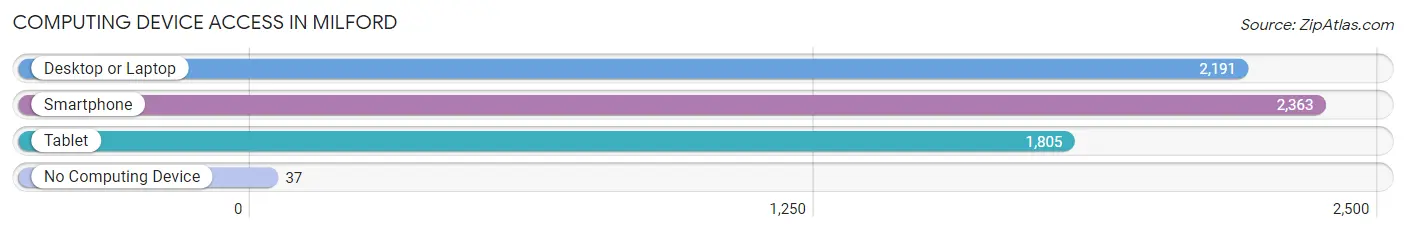
| Device Type | # Households | % Households |
| Desktop or Laptop | 2,191 | 83.8% |
| Smartphone | 2,363 | 90.3% |
| Tablet | 1,805 | 69.0% |
| No Computing Device | 37 | 1.4% |
| Total | 2,616 | 100.0% |
Internet Access in Milford
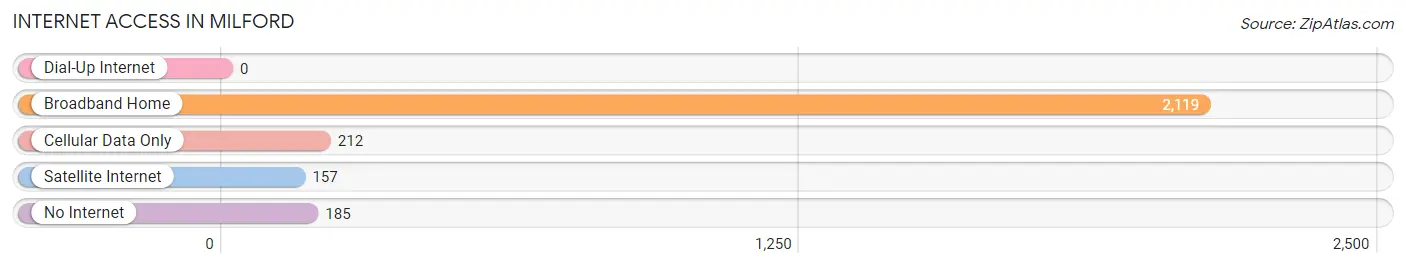
| Internet Type | # Households | % Households |
| Dial-Up Internet | 0 | 0.0% |
| Broadband Home | 2,119 | 81.0% |
| Cellular Data Only | 212 | 8.1% |
| Satellite Internet | 157 | 6.0% |
| No Internet | 185 | 7.1% |
| Total | 2,616 | 100.0% |
Milford Summary
Milford, Michigan is a small village located in Oakland County, Michigan. It is situated on the Huron River, approximately 25 miles northwest of Detroit. The village has a population of 6,175 as of the 2010 census.
History
The area that is now Milford was first settled in 1832 by a group of settlers from New York. The village was originally known as "Millford" due to the numerous mills that were built along the Huron River. The name was later changed to "Milford" in 1837.
The village was incorporated in 1869 and was officially recognized as a village in 1871. The village was named after Milford, Connecticut, the hometown of one of the original settlers.
Geography
Milford is located at 42°31'N, 83°37'W (42.5167, -83.6167). The village is situated on the Huron River, approximately 25 miles northwest of Detroit. The village has a total area of 2.2 square miles, all of which is land.
The village is located in the Huron River watershed and is surrounded by several lakes, including Kent Lake, Lake Fenton, and Lake Shannon. The village is also home to several parks, including Central Park, Milford Park, and Riverside Park.
Economy
The economy of Milford is largely based on tourism and retail. The village is home to several small businesses, including restaurants, shops, and galleries. The village also has a vibrant arts and culture scene, with several art galleries, music venues, and theaters.
The village is also home to several large employers, including the Milford Regional Medical Center, the Huron Valley Ambulance Service, and the Milford Public Schools.
Demographics
As of the 2010 census, the village had a population of 6,175. The racial makeup of the village was 94.2% White, 1.7% African American, 0.3% Native American, 1.2% Asian, 0.1% Pacific Islander, 0.9% from other races, and 1.6% from two or more races. Hispanic or Latino of any race were 3.2% of the population.
The median income for a household in the village was $60,938, and the median income for a family was $71,944. The per capita income for the village was $30,945. About 4.2% of families and 5.7% of the population were below the poverty line, including 6.3% of those under age 18 and 4.2% of those age 65 or over.
Conclusion
Milford, Michigan is a small village located in Oakland County, Michigan. It is situated on the Huron River, approximately 25 miles northwest of Detroit. The village has a population of 6,175 as of the 2010 census. The economy of Milford is largely based on tourism and retail, and the village is home to several small businesses, large employers, and a vibrant arts and culture scene. The racial makeup of the village is 94.2% White, 1.7% African American, 0.3% Native American, 1.2% Asian, 0.1% Pacific Islander, 0.9% from other races, and 1.6% from two or more races. The median income for a household in the village was $60,938, and the median income for a family was $71,944.
Common Questions
What is Per Capita Income in Milford?
Per Capita income in Milford is $51,555.
What is the Median Family Income in Milford?
Median Family Income in Milford is $124,132.
What is the Median Household income in Milford?
Median Household Income in Milford is $98,054.
What is Income or Wage Gap in Milford?
Income or Wage Gap in Milford is 48.4%.
Women in Milford earn 51.6 cents for every dollar earned by a man.
What is Inequality or Gini Index in Milford?
Inequality or Gini Index in Milford is 0.44.
What is the Total Population of Milford?
Total Population of Milford is 6,483.
What is the Total Male Population of Milford?
Total Male Population of Milford is 3,146.
What is the Total Female Population of Milford?
Total Female Population of Milford is 3,337.
What is the Ratio of Males per 100 Females in Milford?
There are 94.28 Males per 100 Females in Milford.
What is the Ratio of Females per 100 Males in Milford?
There are 106.07 Females per 100 Males in Milford.
What is the Median Population Age in Milford?
Median Population Age in Milford is 41.5 Years.
What is the Average Family Size in Milford
Average Family Size in Milford is 3.1 People.
What is the Average Household Size in Milford
Average Household Size in Milford is 2.5 People.
How Large is the Labor Force in Milford?
There are 3,225 People in the Labor Forcein in Milford.
What is the Percentage of People in the Labor Force in Milford?
63.6% of People are in the Labor Force in Milford.
What is the Unemployment Rate in Milford?
Unemployment Rate in Milford is 3.0%.