Zip Codes with the Highest Percentage of Population Employed in Architecture & Engineering in Traverse City, MI
RELATED REPORTS & OPTIONS
Architecture & Engineering
Traverse City
Compare Zip Codes
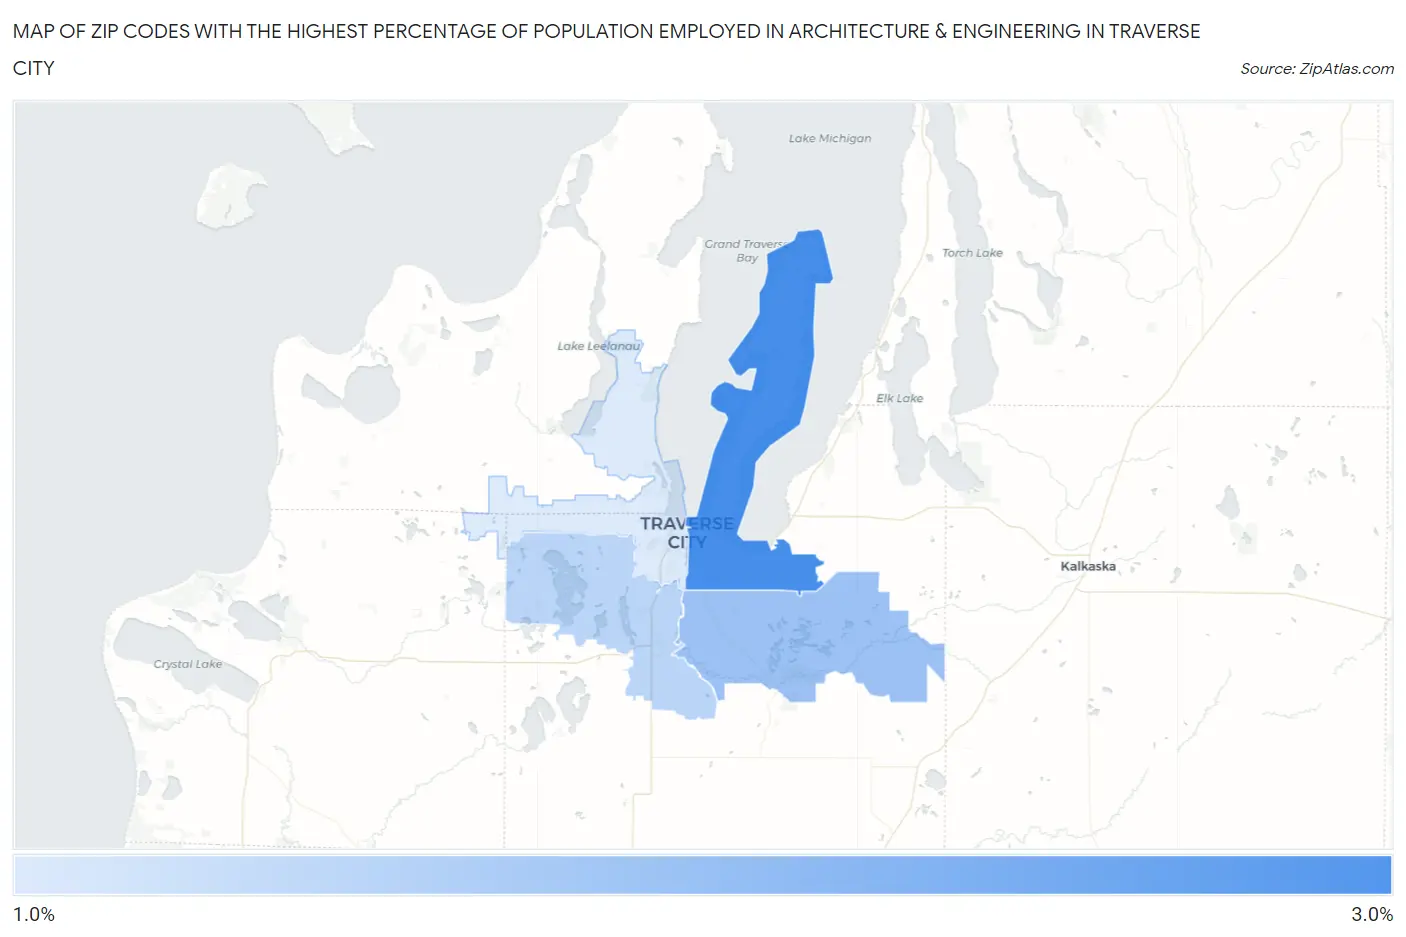
Map of Zip Codes with the Highest Percentage of Population Employed in Architecture & Engineering in Traverse City
1.9%
2.6%
Zip Codes with the Highest Percentage of Population Employed in Architecture & Engineering in Traverse City, MI
| Zip Code | % Employed | vs State | vs National | |
| 1. | 49686 | 2.6% | 3.4%(-0.772)#340 | 2.1%(+0.446)#6,592 |
| 2. | 49696 | 2.2% | 3.4%(-1.18)#414 | 2.1%(+0.035)#8,574 |
| 3. | 49685 | 2.0% | 3.4%(-1.32)#439 | 2.1%(-0.107)#9,354 |
| 4. | 49684 | 1.9% | 3.4%(-1.49)#484 | 2.1%(-0.277)#10,418 |
1
Common Questions
What are the Top 3 Zip Codes with the Highest Percentage of Population Employed in Architecture & Engineering in Traverse City, MI?
Top 3 Zip Codes with the Highest Percentage of Population Employed in Architecture & Engineering in Traverse City, MI are:
What zip code has the Highest Percentage of Population Employed in Architecture & Engineering in Traverse City, MI?
49686 has the Highest Percentage of Population Employed in Architecture & Engineering in Traverse City, MI with 2.6%.
What is the Percentage of Population Employed in Architecture & Engineering in Traverse City, MI?
Percentage of Population Employed in Architecture & Engineering in Traverse City is 2.5%.
What is the Percentage of Population Employed in Architecture & Engineering in Michigan?
Percentage of Population Employed in Architecture & Engineering in Michigan is 3.4%.
What is the Percentage of Population Employed in Architecture & Engineering in the United States?
Percentage of Population Employed in Architecture & Engineering in the United States is 2.1%.