Cities with the Highest Female Poverty Level in Michigan
RELATED REPORTS & OPTIONS
Highest Poverty | Female
Michigan
Compare Cities
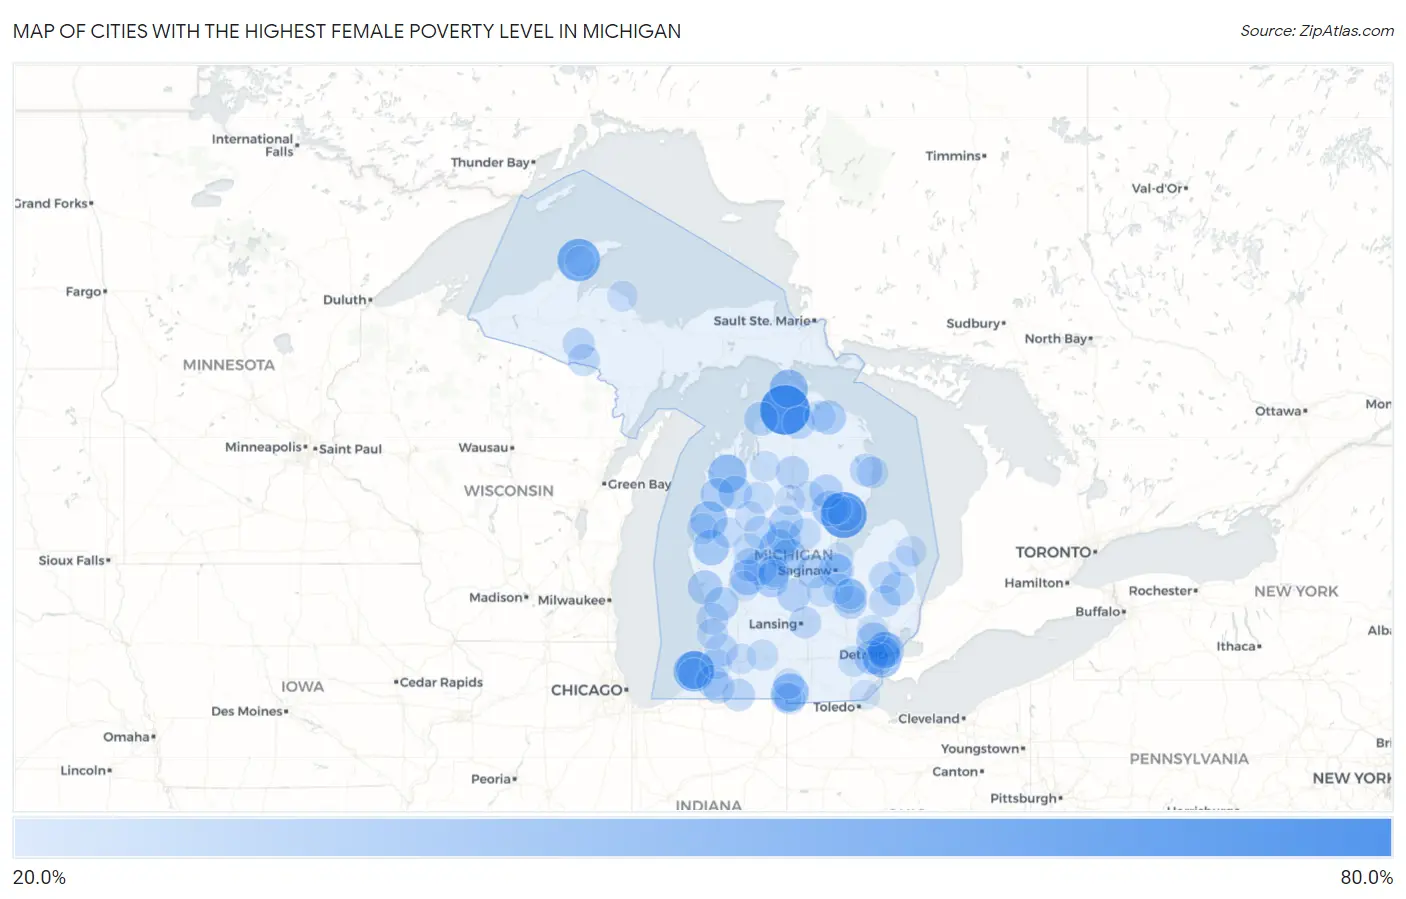
Map of Cities with the Highest Female Poverty Level in Michigan
0.0%
80.0%
Cities with the Highest Female Poverty Level in Michigan
| City | Female Poverty | vs State | vs National | |
| 1. | Oden | 73.9% | 14.3%(+59.6)#1 | 13.7%(+60.2)#347 |
| 2. | Twining | 64.8% | 14.3%(+50.5)#2 | 13.7%(+51.1)#520 |
| 3. | Rockland | 60.4% | 14.3%(+46.1)#3 | 13.7%(+46.7)#651 |
| 4. | Elm Hall | 58.2% | 14.3%(+43.9)#4 | 13.7%(+44.5)#735 |
| 5. | Calumet | 56.7% | 14.3%(+42.4)#5 | 13.7%(+43.0)#790 |
| 6. | Benton Harbor | 51.3% | 14.3%(+37.0)#6 | 13.7%(+37.6)#1,083 |
| 7. | Winn | 51.1% | 14.3%(+36.8)#7 | 13.7%(+37.4)#1,096 |
| 8. | Carp Lake | 46.6% | 14.3%(+32.3)#8 | 13.7%(+32.9)#1,405 |
| 9. | Bendon | 46.4% | 14.3%(+32.1)#9 | 13.7%(+32.7)#1,421 |
| 10. | Benton Heights | 46.0% | 14.3%(+31.7)#10 | 13.7%(+32.3)#1,450 |
| 11. | River Rouge | 45.1% | 14.3%(+30.8)#11 | 13.7%(+31.4)#1,529 |
| 12. | Reading | 45.0% | 14.3%(+30.7)#12 | 13.7%(+31.3)#1,542 |
| 13. | Fountain | 43.8% | 14.3%(+29.5)#13 | 13.7%(+30.1)#1,653 |
| 14. | Paris | 43.4% | 14.3%(+29.1)#14 | 13.7%(+29.7)#1,696 |
| 15. | Weidman | 41.8% | 14.3%(+27.5)#15 | 13.7%(+28.1)#1,882 |
| 16. | Walkerville | 40.2% | 14.3%(+25.9)#16 | 13.7%(+26.5)#2,076 |
| 17. | Pierson | 40.0% | 14.3%(+25.7)#17 | 13.7%(+26.3)#2,105 |
| 18. | Hamtramck | 39.9% | 14.3%(+25.6)#18 | 13.7%(+26.2)#2,127 |
| 19. | Skidway Lake | 39.9% | 14.3%(+25.6)#19 | 13.7%(+26.2)#2,132 |
| 20. | Mount Pleasant | 38.7% | 14.3%(+24.4)#20 | 13.7%(+25.0)#2,270 |
| 21. | Bingham Farms | 38.1% | 14.3%(+23.8)#21 | 13.7%(+24.4)#2,364 |
| 22. | Highland Park | 37.6% | 14.3%(+23.3)#22 | 13.7%(+23.9)#2,419 |
| 23. | Turner | 37.2% | 14.3%(+22.9)#23 | 13.7%(+23.5)#2,495 |
| 24. | Muskegon Heights | 37.1% | 14.3%(+22.8)#24 | 13.7%(+23.4)#2,507 |
| 25. | Stanton | 37.0% | 14.3%(+22.7)#25 | 13.7%(+23.3)#2,522 |
| 26. | Millersburg | 36.8% | 14.3%(+22.6)#26 | 13.7%(+23.1)#2,552 |
| 27. | Merrill | 36.8% | 14.3%(+22.5)#27 | 13.7%(+23.1)#2,560 |
| 28. | Beecher | 36.7% | 14.3%(+22.5)#28 | 13.7%(+23.0)#2,578 |
| 29. | Inkster | 36.3% | 14.3%(+22.0)#29 | 13.7%(+22.6)#2,654 |
| 30. | Kaleva | 36.2% | 14.3%(+22.0)#30 | 13.7%(+22.5)#2,670 |
| 31. | Saginaw | 36.2% | 14.3%(+22.0)#31 | 13.7%(+22.5)#2,673 |
| 32. | Pittsford | 36.2% | 14.3%(+22.0)#32 | 13.7%(+22.5)#2,674 |
| 33. | Allendale | 36.1% | 14.3%(+21.8)#33 | 13.7%(+22.4)#2,708 |
| 34. | Charlevoix | 36.1% | 14.3%(+21.8)#34 | 13.7%(+22.4)#2,710 |
| 35. | Farwell | 35.9% | 14.3%(+21.7)#35 | 13.7%(+22.2)#2,740 |
| 36. | Mesick | 35.5% | 14.3%(+21.2)#36 | 13.7%(+21.8)#2,848 |
| 37. | Melvin | 35.5% | 14.3%(+21.2)#37 | 13.7%(+21.8)#2,852 |
| 38. | Lakeview | 35.2% | 14.3%(+20.9)#38 | 13.7%(+21.5)#2,895 |
| 39. | Rose City | 35.1% | 14.3%(+20.8)#39 | 13.7%(+21.4)#2,910 |
| 40. | Harrison | 35.0% | 14.3%(+20.7)#40 | 13.7%(+21.3)#2,937 |
| 41. | Kincheloe | 34.9% | 14.3%(+20.6)#41 | 13.7%(+21.2)#2,959 |
| 42. | Maple Rapids | 34.7% | 14.3%(+20.4)#42 | 13.7%(+21.0)#3,009 |
| 43. | Morley | 34.4% | 14.3%(+20.1)#43 | 13.7%(+20.7)#3,078 |
| 44. | Grayling | 34.1% | 14.3%(+19.8)#44 | 13.7%(+20.4)#3,130 |
| 45. | Bloomingdale | 33.8% | 14.3%(+19.5)#45 | 13.7%(+20.1)#3,193 |
| 46. | Wolverine | 33.7% | 14.3%(+19.4)#46 | 13.7%(+20.0)#3,214 |
| 47. | Flint | 33.5% | 14.3%(+19.2)#47 | 13.7%(+19.8)#3,248 |
| 48. | Dowagiac | 33.3% | 14.3%(+19.1)#48 | 13.7%(+19.6)#3,282 |
| 49. | Lincoln | 33.1% | 14.3%(+18.8)#49 | 13.7%(+19.4)#3,359 |
| 50. | Melvindale | 33.0% | 14.3%(+18.7)#50 | 13.7%(+19.3)#3,372 |
| 51. | Evart | 32.9% | 14.3%(+18.6)#51 | 13.7%(+19.2)#3,400 |
| 52. | White Pigeon | 32.7% | 14.3%(+18.4)#52 | 13.7%(+19.0)#3,442 |
| 53. | Detroit | 32.5% | 14.3%(+18.2)#53 | 13.7%(+18.8)#3,478 |
| 54. | Palo | 32.4% | 14.3%(+18.1)#54 | 13.7%(+18.7)#3,505 |
| 55. | Cassopolis | 32.0% | 14.3%(+17.7)#55 | 13.7%(+18.3)#3,613 |
| 56. | East Lansing | 31.8% | 14.3%(+17.5)#56 | 13.7%(+18.1)#3,653 |
| 57. | Amasa | 31.7% | 14.3%(+17.5)#57 | 13.7%(+18.0)#3,661 |
| 58. | Naubinway | 31.7% | 14.3%(+17.4)#58 | 13.7%(+18.0)#3,669 |
| 59. | Beechwood | 31.7% | 14.3%(+17.4)#59 | 13.7%(+18.0)#3,678 |
| 60. | Edmore | 31.6% | 14.3%(+17.4)#60 | 13.7%(+17.9)#3,681 |
| 61. | Alpha | 31.6% | 14.3%(+17.3)#61 | 13.7%(+17.9)#3,685 |
| 62. | Marlette | 31.2% | 14.3%(+16.9)#62 | 13.7%(+17.5)#3,804 |
| 63. | Imlay City | 30.9% | 14.3%(+16.7)#63 | 13.7%(+17.2)#3,868 |
| 64. | Harrisville | 30.9% | 14.3%(+16.6)#64 | 13.7%(+17.2)#3,874 |
| 65. | Beaverton | 30.6% | 14.3%(+16.3)#65 | 13.7%(+16.9)#3,967 |
| 66. | Camden | 30.2% | 14.3%(+15.9)#66 | 13.7%(+16.5)#4,101 |
| 67. | Jennings | 30.2% | 14.3%(+15.9)#67 | 13.7%(+16.5)#4,103 |
| 68. | Oakley | 30.1% | 14.3%(+15.9)#68 | 13.7%(+16.4)#4,107 |
| 69. | Buena Vista | 30.0% | 14.3%(+15.7)#69 | 13.7%(+16.3)#4,165 |
| 70. | Onaway | 29.9% | 14.3%(+15.6)#70 | 13.7%(+16.2)#4,180 |
| 71. | Scottville | 29.8% | 14.3%(+15.6)#71 | 13.7%(+16.1)#4,199 |
| 72. | Big Rapids | 29.7% | 14.3%(+15.4)#72 | 13.7%(+16.0)#4,231 |
| 73. | Lawrence | 29.5% | 14.3%(+15.2)#73 | 13.7%(+15.8)#4,276 |
| 74. | Fair Plain | 29.3% | 14.3%(+15.0)#74 | 13.7%(+15.6)#4,333 |
| 75. | Springfield | 29.3% | 14.3%(+15.0)#75 | 13.7%(+15.6)#4,334 |
| 76. | Montrose | 29.3% | 14.3%(+15.0)#76 | 13.7%(+15.6)#4,339 |
| 77. | Mount Morris | 29.3% | 14.3%(+15.0)#77 | 13.7%(+15.6)#4,348 |
| 78. | Tower | 29.3% | 14.3%(+15.0)#78 | 13.7%(+15.6)#4,349 |
| 79. | Ypsilanti | 29.3% | 14.3%(+15.0)#79 | 13.7%(+15.6)#4,351 |
| 80. | Fennville | 29.2% | 14.3%(+14.9)#80 | 13.7%(+15.5)#4,361 |
| 81. | Prescott | 29.2% | 14.3%(+14.9)#81 | 13.7%(+15.5)#4,377 |
| 82. | St Helen | 29.1% | 14.3%(+14.8)#82 | 13.7%(+15.4)#4,415 |
| 83. | Big Bay | 28.7% | 14.3%(+14.4)#83 | 13.7%(+15.0)#4,516 |
| 84. | Kalkaska | 28.5% | 14.3%(+14.2)#84 | 13.7%(+14.8)#4,611 |
| 85. | Baldwin | 28.4% | 14.3%(+14.1)#85 | 13.7%(+14.7)#4,625 |
| 86. | Montgomery | 28.4% | 14.3%(+14.1)#86 | 13.7%(+14.7)#4,630 |
| 87. | Kalamazoo | 28.4% | 14.3%(+14.1)#87 | 13.7%(+14.7)#4,639 |
| 88. | Deckerville | 28.4% | 14.3%(+14.1)#88 | 13.7%(+14.7)#4,648 |
| 89. | Forestville | 28.4% | 14.3%(+14.1)#89 | 13.7%(+14.7)#4,654 |
| 90. | Allen | 28.3% | 14.3%(+14.0)#90 | 13.7%(+14.6)#4,670 |
| 91. | Tustin | 28.3% | 14.3%(+14.0)#91 | 13.7%(+14.6)#4,671 |
| 92. | Cedar Springs | 28.3% | 14.3%(+14.0)#92 | 13.7%(+14.6)#4,677 |
| 93. | Mcbride | 28.3% | 14.3%(+14.0)#93 | 13.7%(+14.6)#4,686 |
| 94. | Houghton Lake | 28.0% | 14.3%(+13.7)#94 | 13.7%(+14.3)#4,778 |
| 95. | Pontiac | 27.9% | 14.3%(+13.6)#95 | 13.7%(+14.2)#4,810 |
| 96. | Brimley | 27.8% | 14.3%(+13.5)#96 | 13.7%(+14.1)#4,842 |
| 97. | Mohawk | 27.7% | 14.3%(+13.4)#97 | 13.7%(+14.0)#4,871 |
| 98. | Laurium | 27.5% | 14.3%(+13.2)#98 | 13.7%(+13.8)#4,967 |
| 99. | Bay City | 27.4% | 14.3%(+13.1)#99 | 13.7%(+13.7)#4,996 |
| 100. | Luna Pier | 27.3% | 14.3%(+13.0)#100 | 13.7%(+13.6)#5,036 |
Common Questions
What are the Top 10 Cities with the Highest Female Poverty Level in Michigan?
Top 10 Cities with the Highest Female Poverty Level in Michigan are:
#1
73.9%
#2
64.8%
#3
56.7%
#4
51.3%
#5
46.6%
#6
46.4%
#7
46.0%
#8
45.1%
#9
45.0%
#10
43.8%
What city has the Highest Female Poverty Level in Michigan?
Oden has the Highest Female Poverty Level in Michigan with 73.9%.
What is the Poverty Level Among Females in the State of Michigan?
Poverty Level Among Females in Michigan is 14.3%.
What is the Poverty Level Among Females in the United States?
Poverty Level Among Females in the United States is 13.7%.