Cities with the Largest Lebanese Community in Michigan
RELATED REPORTS & OPTIONS
Lebanese
Michigan
Compare Cities
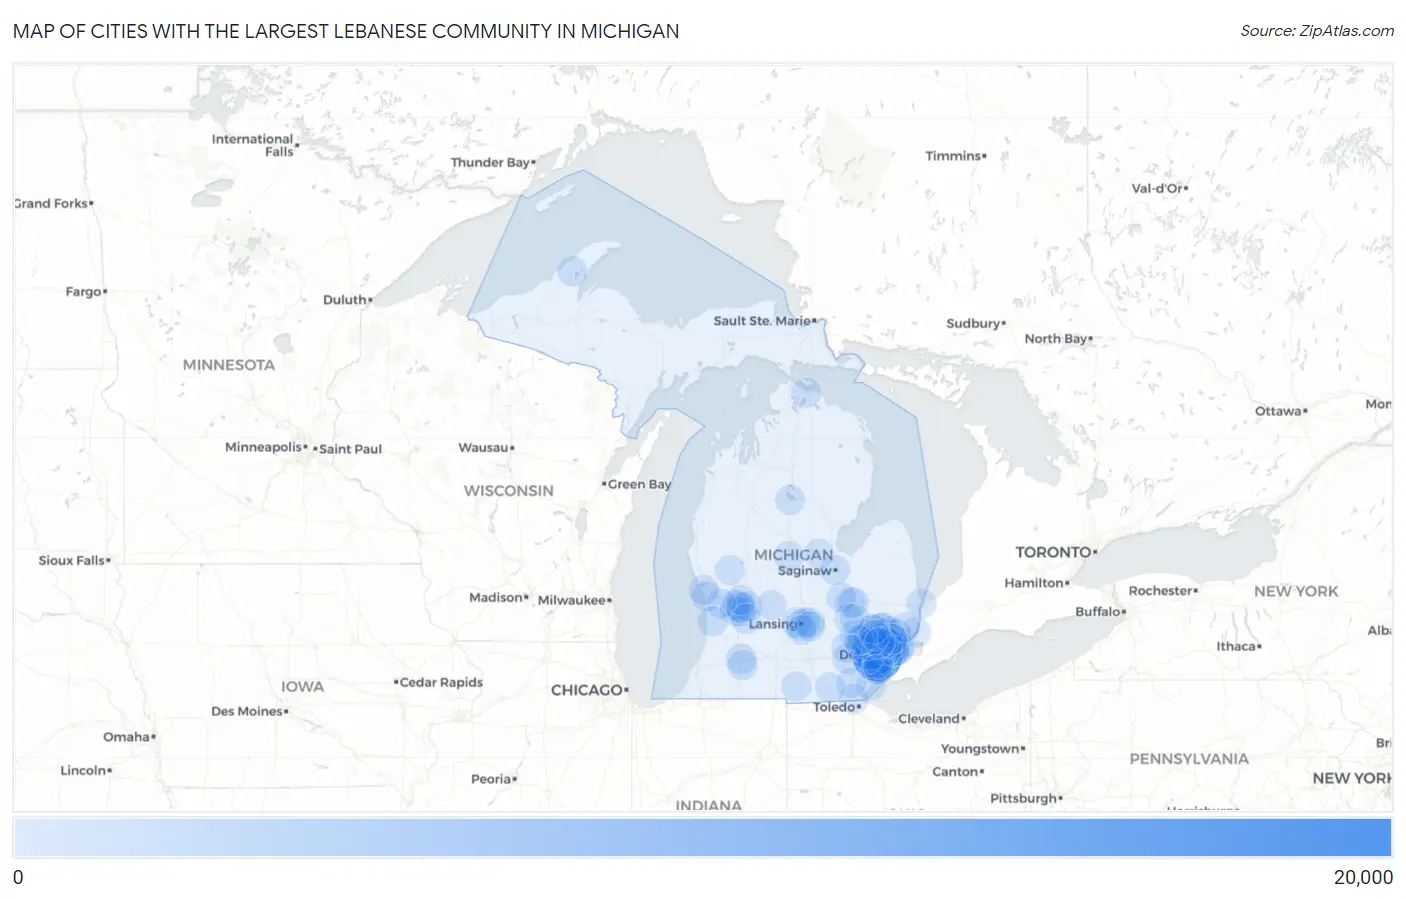
Map of Cities with the Largest Lebanese Community in Michigan
0
20,000
Cities with the Largest Lebanese Community in Michigan
| City | Lebanese | vs State | vs National | |
| 1. | Dearborn | 18,656 | 69,798(26.73%)#1 | 546,795(3.41%)#1 |
| 2. | Dearborn Heights | 13,155 | 69,798(18.85%)#2 | 546,795(2.41%)#3 |
| 3. | Livonia | 1,697 | 69,798(2.43%)#3 | 546,795(0.31%)#18 |
| 4. | Sterling Heights | 1,588 | 69,798(2.28%)#4 | 546,795(0.29%)#20 |
| 5. | Farmington Hills | 1,161 | 69,798(1.66%)#5 | 546,795(0.21%)#35 |
| 6. | Detroit | 1,075 | 69,798(1.54%)#6 | 546,795(0.20%)#39 |
| 7. | Troy | 957 | 69,798(1.37%)#7 | 546,795(0.18%)#45 |
| 8. | St Clair Shores | 807 | 69,798(1.16%)#8 | 546,795(0.15%)#63 |
| 9. | Warren | 803 | 69,798(1.15%)#9 | 546,795(0.15%)#64 |
| 10. | Taylor | 779 | 69,798(1.12%)#10 | 546,795(0.14%)#65 |
| 11. | Lansing | 642 | 69,798(0.92%)#11 | 546,795(0.12%)#81 |
| 12. | Rochester Hills | 632 | 69,798(0.91%)#12 | 546,795(0.12%)#86 |
| 13. | Royal Oak | 507 | 69,798(0.73%)#13 | 546,795(0.09%)#113 |
| 14. | Lincoln Park | 507 | 69,798(0.73%)#14 | 546,795(0.09%)#114 |
| 15. | Grosse Pointe Woods | 505 | 69,798(0.72%)#15 | 546,795(0.09%)#115 |
| 16. | Novi | 498 | 69,798(0.71%)#16 | 546,795(0.09%)#117 |
| 17. | Ann Arbor | 419 | 69,798(0.60%)#17 | 546,795(0.08%)#148 |
| 18. | Westland | 373 | 69,798(0.53%)#18 | 546,795(0.07%)#173 |
| 19. | Grand Rapids | 359 | 69,798(0.51%)#19 | 546,795(0.07%)#186 |
| 20. | Walker | 349 | 69,798(0.50%)#20 | 546,795(0.06%)#193 |
| 21. | Rochester | 347 | 69,798(0.50%)#21 | 546,795(0.06%)#197 |
| 22. | Inkster | 315 | 69,798(0.45%)#22 | 546,795(0.06%)#227 |
| 23. | Kalamazoo | 310 | 69,798(0.44%)#23 | 546,795(0.06%)#232 |
| 24. | Birmingham | 278 | 69,798(0.40%)#24 | 546,795(0.05%)#268 |
| 25. | Roseville | 249 | 69,798(0.36%)#25 | 546,795(0.05%)#309 |
| 26. | Harper Woods | 240 | 69,798(0.34%)#26 | 546,795(0.04%)#325 |
| 27. | Portage | 190 | 69,798(0.27%)#27 | 546,795(0.03%)#424 |
| 28. | Berkley | 189 | 69,798(0.27%)#28 | 546,795(0.03%)#427 |
| 29. | Grosse Pointe Farms | 186 | 69,798(0.27%)#29 | 546,795(0.03%)#435 |
| 30. | Allen Park | 178 | 69,798(0.26%)#30 | 546,795(0.03%)#458 |
| 31. | Waverly | 178 | 69,798(0.26%)#31 | 546,795(0.03%)#459 |
| 32. | Mount Clemens | 178 | 69,798(0.26%)#32 | 546,795(0.03%)#461 |
| 33. | Village Of Grosse Pointe Shores | 174 | 69,798(0.25%)#33 | 546,795(0.03%)#475 |
| 34. | Kentwood | 170 | 69,798(0.24%)#34 | 546,795(0.03%)#487 |
| 35. | Garden City | 150 | 69,798(0.21%)#35 | 546,795(0.03%)#559 |
| 36. | Riverview | 148 | 69,798(0.21%)#36 | 546,795(0.03%)#568 |
| 37. | Melvindale | 146 | 69,798(0.21%)#37 | 546,795(0.03%)#584 |
| 38. | Grosse Pointe Park | 138 | 69,798(0.20%)#38 | 546,795(0.03%)#629 |
| 39. | Madison Heights | 135 | 69,798(0.19%)#39 | 546,795(0.02%)#638 |
| 40. | Southfield | 133 | 69,798(0.19%)#40 | 546,795(0.02%)#645 |
| 41. | East Lansing | 133 | 69,798(0.19%)#41 | 546,795(0.02%)#647 |
| 42. | Flint | 127 | 69,798(0.18%)#42 | 546,795(0.02%)#673 |
| 43. | Wyoming | 125 | 69,798(0.18%)#43 | 546,795(0.02%)#685 |
| 44. | East Grand Rapids | 123 | 69,798(0.18%)#44 | 546,795(0.02%)#700 |
| 45. | Haslett | 112 | 69,798(0.16%)#45 | 546,795(0.02%)#768 |
| 46. | Algonac | 112 | 69,798(0.16%)#46 | 546,795(0.02%)#772 |
| 47. | Holt | 110 | 69,798(0.16%)#47 | 546,795(0.02%)#784 |
| 48. | Orchard Lake Village | 110 | 69,798(0.16%)#48 | 546,795(0.02%)#785 |
| 49. | Okemos | 105 | 69,798(0.15%)#49 | 546,795(0.02%)#815 |
| 50. | Clawson | 105 | 69,798(0.15%)#50 | 546,795(0.02%)#819 |
| 51. | Pontiac | 100 | 69,798(0.14%)#51 | 546,795(0.02%)#855 |
| 52. | Forest Hills | 93 | 69,798(0.13%)#52 | 546,795(0.02%)#928 |
| 53. | Wyandotte | 93 | 69,798(0.13%)#53 | 546,795(0.02%)#931 |
| 54. | Eastpointe | 92 | 69,798(0.13%)#54 | 546,795(0.02%)#936 |
| 55. | Mount Pleasant | 86 | 69,798(0.12%)#55 | 546,795(0.02%)#1,007 |
| 56. | Grosse Pointe | 85 | 69,798(0.12%)#56 | 546,795(0.02%)#1,018 |
| 57. | Northville | 83 | 69,798(0.12%)#57 | 546,795(0.02%)#1,041 |
| 58. | Ferndale | 76 | 69,798(0.11%)#58 | 546,795(0.01%)#1,117 |
| 59. | Milford | 76 | 69,798(0.11%)#59 | 546,795(0.01%)#1,121 |
| 60. | Trenton | 75 | 69,798(0.11%)#60 | 546,795(0.01%)#1,129 |
| 61. | Woodland Beach | 73 | 69,798(0.10%)#61 | 546,795(0.01%)#1,155 |
| 62. | Hamtramck | 72 | 69,798(0.10%)#62 | 546,795(0.01%)#1,164 |
| 63. | Houghton Lake | 69 | 69,798(0.10%)#63 | 546,795(0.01%)#1,211 |
| 64. | Utica | 67 | 69,798(0.10%)#64 | 546,795(0.01%)#1,240 |
| 65. | Cheboygan | 65 | 69,798(0.09%)#65 | 546,795(0.01%)#1,278 |
| 66. | Midland | 58 | 69,798(0.08%)#66 | 546,795(0.01%)#1,382 |
| 67. | Burton | 58 | 69,798(0.08%)#67 | 546,795(0.01%)#1,384 |
| 68. | Center Line | 58 | 69,798(0.08%)#68 | 546,795(0.01%)#1,388 |
| 69. | Southgate | 56 | 69,798(0.08%)#69 | 546,795(0.01%)#1,425 |
| 70. | Houghton | 55 | 69,798(0.08%)#70 | 546,795(0.01%)#1,451 |
| 71. | Dundee | 55 | 69,798(0.08%)#71 | 546,795(0.01%)#1,453 |
| 72. | Ferrysburg | 54 | 69,798(0.08%)#72 | 546,795(0.01%)#1,471 |
| 73. | Farmington | 53 | 69,798(0.08%)#73 | 546,795(0.01%)#1,492 |
| 74. | Northview | 52 | 69,798(0.07%)#74 | 546,795(0.01%)#1,508 |
| 75. | Oak Park | 51 | 69,798(0.07%)#75 | 546,795(0.01%)#1,518 |
| 76. | Port Huron | 51 | 69,798(0.07%)#76 | 546,795(0.01%)#1,519 |
| 77. | Franklin | 51 | 69,798(0.07%)#77 | 546,795(0.01%)#1,541 |
| 78. | Auburn Hills | 48 | 69,798(0.07%)#78 | 546,795(0.01%)#1,590 |
| 79. | Wayne | 47 | 69,798(0.07%)#79 | 546,795(0.01%)#1,628 |
| 80. | Walled Lake | 47 | 69,798(0.07%)#80 | 546,795(0.01%)#1,639 |
| 81. | New Baltimore | 46 | 69,798(0.07%)#81 | 546,795(0.01%)#1,665 |
| 82. | Whitmore Lake | 46 | 69,798(0.07%)#82 | 546,795(0.01%)#1,668 |
| 83. | Wixom | 44 | 69,798(0.06%)#83 | 546,795(0.01%)#1,724 |
| 84. | Fenton | 44 | 69,798(0.06%)#84 | 546,795(0.01%)#1,736 |
| 85. | Lambertville | 44 | 69,798(0.06%)#85 | 546,795(0.01%)#1,738 |
| 86. | Allendale | 43 | 69,798(0.06%)#86 | 546,795(0.01%)#1,763 |
| 87. | Norton Shores | 43 | 69,798(0.06%)#87 | 546,795(0.01%)#1,764 |
| 88. | Fraser | 41 | 69,798(0.06%)#88 | 546,795(0.01%)#1,816 |
| 89. | Ionia | 41 | 69,798(0.06%)#89 | 546,795(0.01%)#1,818 |
| 90. | Flushing | 41 | 69,798(0.06%)#90 | 546,795(0.01%)#1,821 |
| 91. | Newaygo | 41 | 69,798(0.06%)#91 | 546,795(0.01%)#1,827 |
| 92. | Hillsdale | 38 | 69,798(0.05%)#92 | 546,795(0.01%)#1,909 |
| 93. | Bloomfield Hills | 38 | 69,798(0.05%)#93 | 546,795(0.01%)#1,913 |
| 94. | Huntington Woods | 37 | 69,798(0.05%)#94 | 546,795(0.01%)#1,943 |
| 95. | Saginaw | 36 | 69,798(0.05%)#95 | 546,795(0.01%)#1,962 |
| 96. | Holland | 35 | 69,798(0.05%)#96 | 546,795(0.01%)#2,000 |
| 97. | Holly | 35 | 69,798(0.05%)#97 | 546,795(0.01%)#2,020 |
| 98. | Caledonia | 35 | 69,798(0.05%)#98 | 546,795(0.01%)#2,024 |
| 99. | Adrian | 34 | 69,798(0.05%)#99 | 546,795(0.01%)#2,037 |
| 100. | Woodhaven | 34 | 69,798(0.05%)#100 | 546,795(0.01%)#2,043 |
Common Questions
What are the Top 10 Cities with the Largest Lebanese Community in Michigan?
Top 10 Cities with the Largest Lebanese Community in Michigan are:
#1
18,656
#2
13,155
#3
1,697
#4
1,588
#5
1,161
#6
1,075
#7
957
#8
807
#9
803
#10
779
What city has the Largest Lebanese Community in Michigan?
Dearborn has the Largest Lebanese Community in Michigan with 18,656.
What is the Total Lebanese Population in the State of Michigan?
Total Lebanese Population in Michigan is 69,798.
What is the Total Lebanese Population in the United States?
Total Lebanese Population in the United States is 546,795.