Cities with the Most Births per 1,000 Women Over the Age of 35 in Michigan
RELATED REPORTS & OPTIONS
Highest Birth Rate | Women 35+
Michigan
Compare Cities
Map of Cities with the Most Births per 1,000 Women Over the Age of 35 in Michigan
0.0
1,000.0
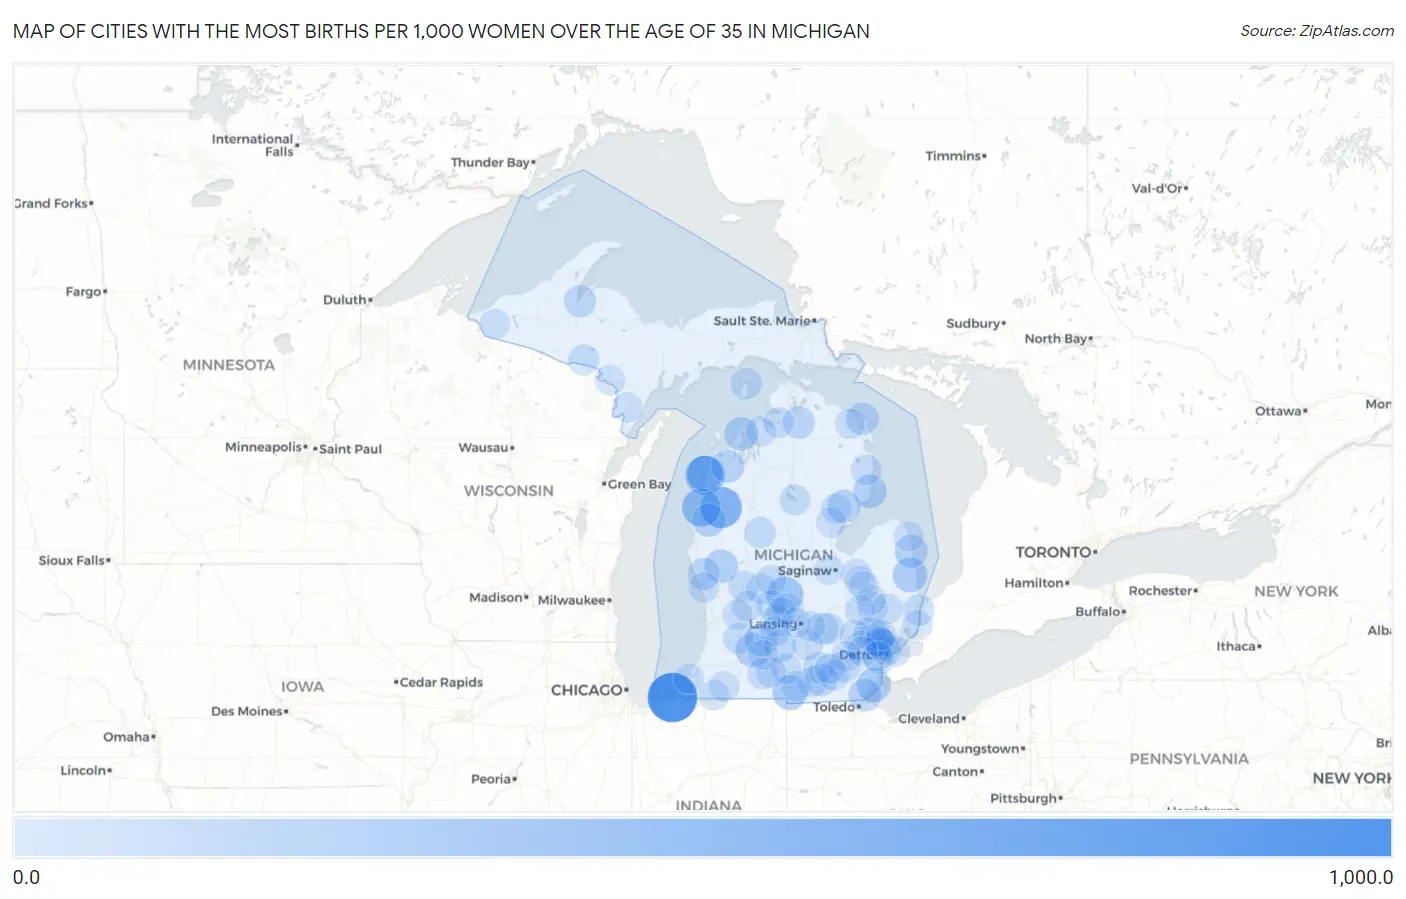
Cities with the Most Births per 1,000 Women Over the Age of 35 in Michigan
| City | Births / 1,000 Women | vs State | vs National | |
| 1. | Michiana | 1,000.0 | 28.0(+972)#1 | 32.0(+968)#10 |
| 2. | Wellston | 583.0 | 28.0(+555)#2 | 32.0(+551)#105 |
| 3. | Elberta | 500.0 | 28.0(+472)#3 | 32.0(+468)#132 |
| 4. | Oak Hill | 440.0 | 28.0(+412)#4 | 32.0(+408)#184 |
| 5. | Ramsay | 364.0 | 28.0(+336)#5 | 32.0(+332)#245 |
| 6. | Hubbardston | 360.0 | 28.0(+332)#6 | 32.0(+328)#251 |
| 7. | Frankfort | 327.0 | 28.0(+299)#7 | 32.0(+295)#312 |
| 8. | Atlantic Mine | 313.0 | 28.0(+285)#8 | 32.0(+281)#329 |
| 9. | Trimountain | 273.0 | 28.0(+245)#9 | 32.0(+241)#403 |
| 10. | Reading | 271.0 | 28.0(+243)#10 | 32.0(+239)#410 |
| 11. | Applegate | 267.0 | 28.0(+239)#11 | 32.0(+235)#417 |
| 12. | Stony Point | 250.0 | 28.0(+222)#12 | 32.0(+218)#461 |
| 13. | South Gull Lake | 239.0 | 28.0(+211)#13 | 32.0(+207)#516 |
| 14. | Oscoda | 225.0 | 28.0(+197)#14 | 32.0(+193)#565 |
| 15. | Fremont | 222.0 | 28.0(+194)#15 | 32.0(+190)#573 |
| 16. | Northport | 222.0 | 28.0(+194)#16 | 32.0(+190)#577 |
| 17. | Fountain | 211.0 | 28.0(+183)#17 | 32.0(+179)#642 |
| 18. | Whittemore | 200.0 | 28.0(+172)#18 | 32.0(+168)#698 |
| 19. | Lake Ann | 200.0 | 28.0(+172)#19 | 32.0(+168)#699 |
| 20. | Dowling | 200.0 | 28.0(+172)#20 | 32.0(+168)#702 |
| 21. | Forestville | 200.0 | 28.0(+172)#21 | 32.0(+168)#720 |
| 22. | Luna Pier | 182.0 | 28.0(+154)#22 | 32.0(+150)#807 |
| 23. | Presque Isle Harbor | 175.0 | 28.0(+147)#23 | 32.0(+143)#860 |
| 24. | Keego Harbor | 161.0 | 28.0(+133)#24 | 32.0(+129)#959 |
| 25. | Olivet | 159.0 | 28.0(+131)#25 | 32.0(+127)#984 |
| 26. | Wolverine | 154.0 | 28.0(+126)#26 | 32.0(+122)#1,030 |
| 27. | Onsted | 152.0 | 28.0(+124)#27 | 32.0(+120)#1,042 |
| 28. | Lakewood Club | 151.0 | 28.0(+123)#28 | 32.0(+119)#1,054 |
| 29. | L Anse | 149.0 | 28.0(+121)#29 | 32.0(+117)#1,081 |
| 30. | Lakeport | 144.0 | 28.0(+116)#30 | 32.0(+112)#1,132 |
| 31. | Webberville | 129.0 | 28.0(+101)#31 | 32.0(+97.0)#1,354 |
| 32. | Saline | 126.0 | 28.0(+98.0)#32 | 32.0(+94.0)#1,385 |
| 33. | Sunfield | 123.0 | 28.0(+95.0)#33 | 32.0(+91.0)#1,459 |
| 34. | Hartland | 120.0 | 28.0(+92.0)#34 | 32.0(+88.0)#1,502 |
| 35. | St James | 118.0 | 28.0(+90.0)#35 | 32.0(+86.0)#1,539 |
| 36. | Bloomfield Hills | 116.0 | 28.0(+88.0)#36 | 32.0(+84.0)#1,568 |
| 37. | Evart | 115.0 | 28.0(+87.0)#37 | 32.0(+83.0)#1,589 |
| 38. | Marysville | 112.0 | 28.0(+84.0)#38 | 32.0(+80.0)#1,647 |
| 39. | Napoleon | 112.0 | 28.0(+84.0)#39 | 32.0(+80.0)#1,658 |
| 40. | Melvindale | 107.0 | 28.0(+79.0)#40 | 32.0(+75.0)#1,776 |
| 41. | Pleasant Ridge | 99.0 | 28.0(+71.0)#41 | 32.0(+67.0)#1,984 |
| 42. | Cedar Springs | 98.0 | 28.0(+70.0)#42 | 32.0(+66.0)#2,006 |
| 43. | Fowlerville | 98.0 | 28.0(+70.0)#43 | 32.0(+66.0)#2,008 |
| 44. | Martin | 96.0 | 28.0(+68.0)#44 | 32.0(+64.0)#2,069 |
| 45. | Alpha | 95.0 | 28.0(+67.0)#45 | 32.0(+63.0)#2,095 |
| 46. | Prudenville | 91.0 | 28.0(+63.0)#46 | 32.0(+59.0)#2,206 |
| 47. | Westphalia | 90.0 | 28.0(+62.0)#47 | 32.0(+58.0)#2,242 |
| 48. | Ferndale | 88.0 | 28.0(+60.0)#48 | 32.0(+56.0)#2,272 |
| 49. | Addison | 88.0 | 28.0(+60.0)#49 | 32.0(+56.0)#2,303 |
| 50. | Greenville | 87.0 | 28.0(+59.0)#50 | 32.0(+55.0)#2,317 |
| 51. | Northville | 87.0 | 28.0(+59.0)#51 | 32.0(+55.0)#2,319 |
| 52. | Milford | 86.0 | 28.0(+58.0)#52 | 32.0(+54.0)#2,353 |
| 53. | Hamtramck | 85.0 | 28.0(+57.0)#53 | 32.0(+53.0)#2,377 |
| 54. | Almont | 85.0 | 28.0(+57.0)#54 | 32.0(+53.0)#2,390 |
| 55. | Hillsdale | 84.0 | 28.0(+56.0)#55 | 32.0(+52.0)#2,408 |
| 56. | Grosse Pointe | 84.0 | 28.0(+56.0)#56 | 32.0(+52.0)#2,410 |
| 57. | Forest Hills | 83.0 | 28.0(+55.0)#57 | 32.0(+51.0)#2,429 |
| 58. | Athens | 83.0 | 28.0(+55.0)#58 | 32.0(+51.0)#2,447 |
| 59. | Walloon Lake | 83.0 | 28.0(+55.0)#59 | 32.0(+51.0)#2,469 |
| 60. | Lincoln | 83.0 | 28.0(+55.0)#60 | 32.0(+51.0)#2,476 |
| 61. | Roosevelt Park | 78.0 | 28.0(+50.0)#61 | 32.0(+46.0)#2,631 |
| 62. | Leslie | 78.0 | 28.0(+50.0)#62 | 32.0(+46.0)#2,636 |
| 63. | Homer | 78.0 | 28.0(+50.0)#63 | 32.0(+46.0)#2,637 |
| 64. | Clinton | 77.0 | 28.0(+49.0)#64 | 32.0(+45.0)#2,671 |
| 65. | Stanton | 76.0 | 28.0(+48.0)#65 | 32.0(+44.0)#2,737 |
| 66. | Chassell | 76.0 | 28.0(+48.0)#66 | 32.0(+44.0)#2,744 |
| 67. | Stevensville | 74.0 | 28.0(+46.0)#67 | 32.0(+42.0)#2,823 |
| 68. | Okemos | 73.0 | 28.0(+45.0)#68 | 32.0(+41.0)#2,847 |
| 69. | Cutlerville | 73.0 | 28.0(+45.0)#69 | 32.0(+41.0)#2,849 |
| 70. | Millington | 71.0 | 28.0(+43.0)#70 | 32.0(+39.0)#2,983 |
| 71. | Metamora | 71.0 | 28.0(+43.0)#71 | 32.0(+39.0)#2,992 |
| 72. | Sterling | 71.0 | 28.0(+43.0)#72 | 32.0(+39.0)#2,995 |
| 73. | Barton Hills | 71.0 | 28.0(+43.0)#73 | 32.0(+39.0)#2,997 |
| 74. | Vandalia | 71.0 | 28.0(+43.0)#74 | 32.0(+39.0)#2,998 |
| 75. | Ellsworth | 71.0 | 28.0(+43.0)#75 | 32.0(+39.0)#3,001 |
| 76. | Prescott | 70.0 | 28.0(+42.0)#76 | 32.0(+38.0)#3,046 |
| 77. | Burlington | 69.0 | 28.0(+41.0)#77 | 32.0(+37.0)#3,095 |
| 78. | Edwardsburg | 67.0 | 28.0(+39.0)#78 | 32.0(+35.0)#3,177 |
| 79. | Norway | 66.0 | 28.0(+38.0)#79 | 32.0(+34.0)#3,232 |
| 80. | Huntington Woods | 62.0 | 28.0(+34.0)#80 | 32.0(+30.0)#3,473 |
| 81. | Marine City | 62.0 | 28.0(+34.0)#81 | 32.0(+30.0)#3,482 |
| 82. | Lapeer | 60.0 | 28.0(+32.0)#82 | 32.0(+28.0)#3,599 |
| 83. | Vassar | 60.0 | 28.0(+32.0)#83 | 32.0(+28.0)#3,625 |
| 84. | Manchester | 59.0 | 28.0(+31.0)#84 | 32.0(+27.0)#3,698 |
| 85. | Otter Lake | 59.0 | 28.0(+31.0)#85 | 32.0(+27.0)#3,714 |
| 86. | Posen | 59.0 | 28.0(+31.0)#86 | 32.0(+27.0)#3,718 |
| 87. | Berkley | 58.0 | 28.0(+30.0)#87 | 32.0(+26.0)#3,737 |
| 88. | Ionia | 58.0 | 28.0(+30.0)#88 | 32.0(+26.0)#3,739 |
| 89. | Harbor Beach | 58.0 | 28.0(+30.0)#89 | 32.0(+26.0)#3,769 |
| 90. | Vermontville | 58.0 | 28.0(+30.0)#90 | 32.0(+26.0)#3,777 |
| 91. | Portland | 57.0 | 28.0(+29.0)#91 | 32.0(+25.0)#3,820 |
| 92. | Troy | 56.0 | 28.0(+28.0)#92 | 32.0(+24.0)#3,851 |
| 93. | Plymouth | 54.0 | 28.0(+26.0)#93 | 32.0(+22.0)#4,054 |
| 94. | Shields | 54.0 | 28.0(+26.0)#94 | 32.0(+22.0)#4,057 |
| 95. | Goodrich | 54.0 | 28.0(+26.0)#95 | 32.0(+22.0)#4,082 |
| 96. | Springfield | 53.0 | 28.0(+25.0)#96 | 32.0(+21.0)#4,172 |
| 97. | Daggett | 53.0 | 28.0(+25.0)#97 | 32.0(+21.0)#4,221 |
| 98. | Wakefield | 52.0 | 28.0(+24.0)#98 | 32.0(+20.0)#4,299 |
| 99. | Dearborn | 51.0 | 28.0(+23.0)#99 | 32.0(+19.0)#4,310 |
| 100. | Waverly | 51.0 | 28.0(+23.0)#100 | 32.0(+19.0)#4,330 |
Common Questions
What are the Top 10 Cities with the Most Births per 1,000 Women Over the Age of 35 in Michigan?
Top 10 Cities with the Most Births per 1,000 Women Over the Age of 35 in Michigan are:
#1
1,000.0
#2
583.0
#3
500.0
#4
440.0
#5
360.0
#6
327.0
#7
271.0
#8
267.0
#9
250.0
#10
239.0
What city has the Most Births per 1,000 Women Over the Age of 35 in Michigan?
Michiana has the Most Births per 1,000 Women Over the Age of 35 in Michigan with 1,000.0.
What is the Number of Births per 1,000 Women Over the Age of 35 in the State of Michigan?
Number of Births per 1,000 Women Over the Age of 35 in Michigan is 28.0.
What is the Number of Births per 1,000 Women Over the Age of 35 in the United States?
Number of Births per 1,000 Women Over the Age of 35 in the United States is 32.0.