Zeeland, MI Map & Demographics
Zeeland Map
Zeeland Overview
$40,841
PER CAPITA INCOME
$83,161
AVG FAMILY INCOME
$60,505
AVG HOUSEHOLD INCOME
37.3%
WAGE / INCOME GAP [ % ]
62.7¢/ $1
WAGE / INCOME GAP [ $ ]
0.50
INEQUALITY / GINI INDEX
5,701
TOTAL POPULATION
2,672
MALE POPULATION
3,029
FEMALE POPULATION
88.21
MALES / 100 FEMALES
113.36
FEMALES / 100 MALES
42.6
MEDIAN AGE
2.8
AVG FAMILY SIZE
2.2
AVG HOUSEHOLD SIZE
3,007
LABOR FORCE [ PEOPLE ]
64.7%
PERCENT IN LABOR FORCE
2.8%
UNEMPLOYMENT RATE
Zeeland Zip Codes
Zeeland Area Codes
Income in Zeeland
Income Overview in Zeeland
Per Capita Income in Zeeland is $40,841, while median incomes of families and households are $83,161 and $60,505 respectively.
| Characteristic | Number | Measure |
| Per Capita Income | 5,701 | $40,841 |
| Median Family Income | 1,551 | $83,161 |
| Mean Family Income | 1,551 | $117,760 |
| Median Household Income | 2,543 | $60,505 |
| Mean Household Income | 2,543 | $89,023 |
| Income Deficit | 1,551 | $0 |
| Wage / Income Gap (%) | 5,701 | 37.30% |
| Wage / Income Gap ($) | 5,701 | 62.70¢ per $1 |
| Gini / Inequality Index | 5,701 | 0.50 |
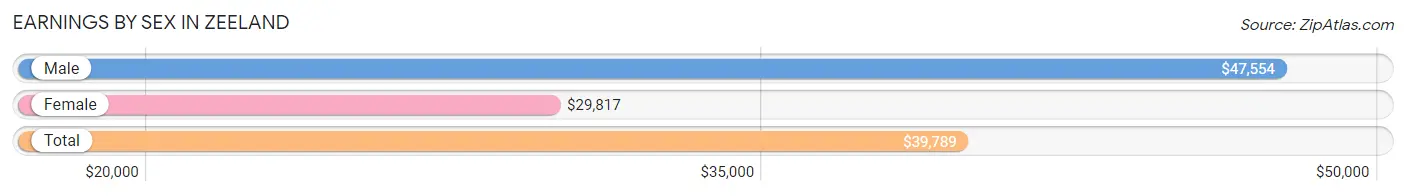
Earnings by Sex in Zeeland
Average Earnings in Zeeland are $39,789, $47,554 for men and $29,817 for women, a difference of 37.3%.
| Sex | Number | Average Earnings |
| Male | 1,593 (50.7%) | $47,554 |
| Female | 1,549 (49.3%) | $29,817 |
| Total | 3,142 (100.0%) | $39,789 |
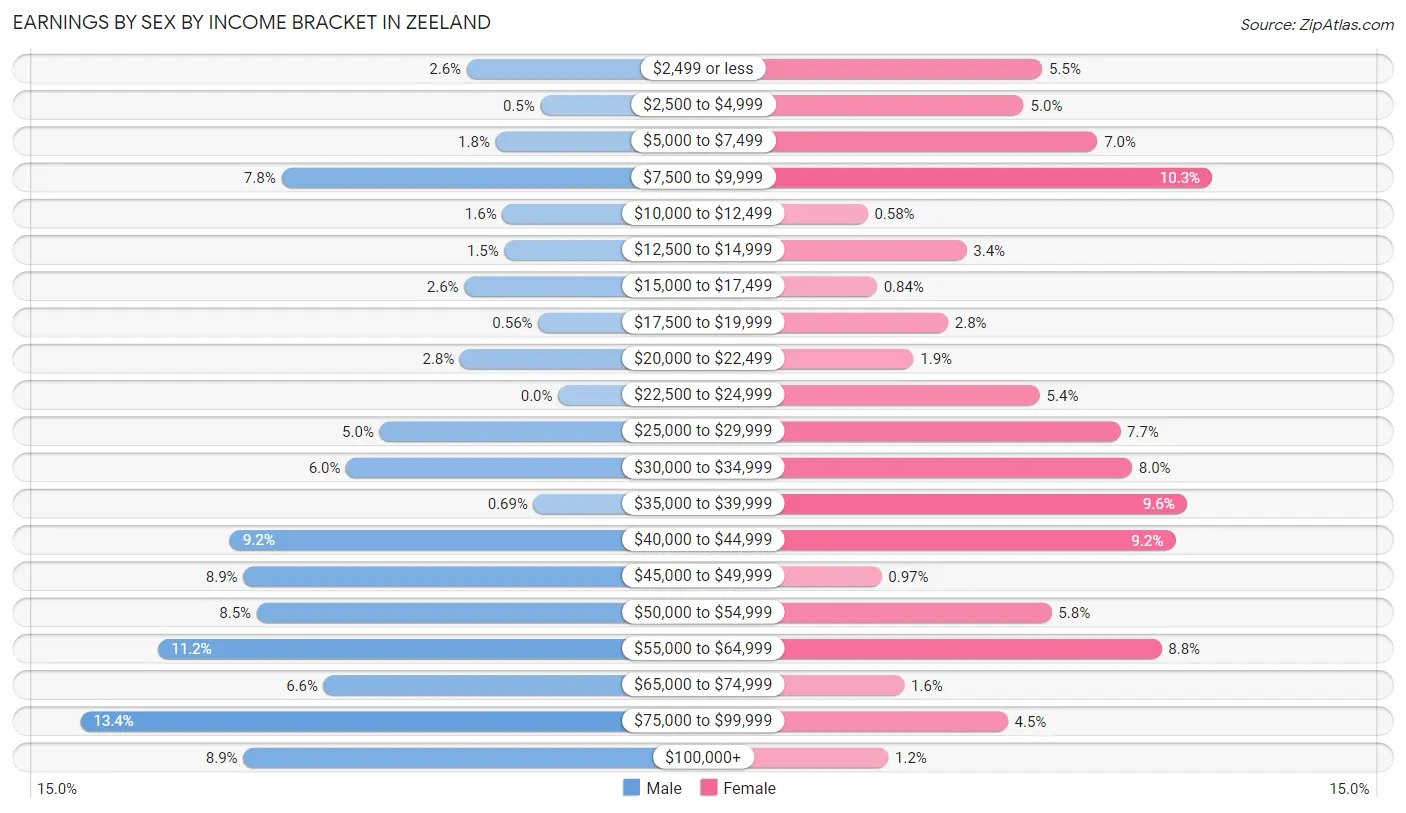
Earnings by Sex by Income Bracket in Zeeland
The most common earnings brackets in Zeeland are $75,000 to $99,999 for men (214 | 13.4%) and $7,500 to $9,999 for women (159 | 10.3%).
| Income | Male | Female |
| $2,499 or less | 41 (2.6%) | 85 (5.5%) |
| $2,500 to $4,999 | 8 (0.5%) | 77 (5.0%) |
| $5,000 to $7,499 | 28 (1.8%) | 109 (7.0%) |
| $7,500 to $9,999 | 124 (7.8%) | 159 (10.3%) |
| $10,000 to $12,499 | 25 (1.6%) | 9 (0.6%) |
| $12,500 to $14,999 | 24 (1.5%) | 52 (3.4%) |
| $15,000 to $17,499 | 42 (2.6%) | 13 (0.8%) |
| $17,500 to $19,999 | 9 (0.6%) | 44 (2.8%) |
| $20,000 to $22,499 | 44 (2.8%) | 29 (1.9%) |
| $22,500 to $24,999 | 0 (0.0%) | 84 (5.4%) |
| $25,000 to $29,999 | 80 (5.0%) | 119 (7.7%) |
| $30,000 to $34,999 | 95 (6.0%) | 124 (8.0%) |
| $35,000 to $39,999 | 11 (0.7%) | 148 (9.6%) |
| $40,000 to $44,999 | 147 (9.2%) | 143 (9.2%) |
| $45,000 to $49,999 | 141 (8.8%) | 15 (1.0%) |
| $50,000 to $54,999 | 135 (8.5%) | 89 (5.8%) |
| $55,000 to $64,999 | 179 (11.2%) | 137 (8.8%) |
| $65,000 to $74,999 | 105 (6.6%) | 25 (1.6%) |
| $75,000 to $99,999 | 214 (13.4%) | 70 (4.5%) |
| $100,000+ | 141 (8.8%) | 18 (1.2%) |
| Total | 1,593 (100.0%) | 1,549 (100.0%) |
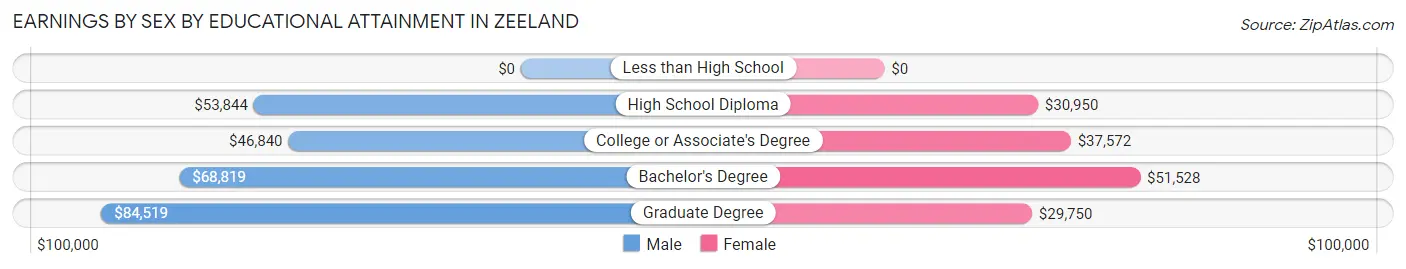
Earnings by Sex by Educational Attainment in Zeeland
Average earnings in Zeeland are $54,718 for men and $34,637 for women, a difference of 36.7%. Men with an educational attainment of graduate degree enjoy the highest average annual earnings of $84,519, while those with college or associate's degree education earn the least with $46,840. Women with an educational attainment of bachelor's degree earn the most with the average annual earnings of $51,528, while those with graduate degree education have the smallest earnings of $29,750.
| Educational Attainment | Male Income | Female Income |
| Less than High School | - | - |
| High School Diploma | $53,844 | $30,950 |
| College or Associate's Degree | $46,840 | $37,572 |
| Bachelor's Degree | $68,819 | $51,528 |
| Graduate Degree | $84,519 | $29,750 |
| Total | $54,718 | $34,637 |
Family Income in Zeeland
Family Income Brackets in Zeeland
According to the Zeeland family income data, there are 397 families falling into the $100,000 to $149,999 income range, which is the most common income bracket and makes up 25.6% of all families.
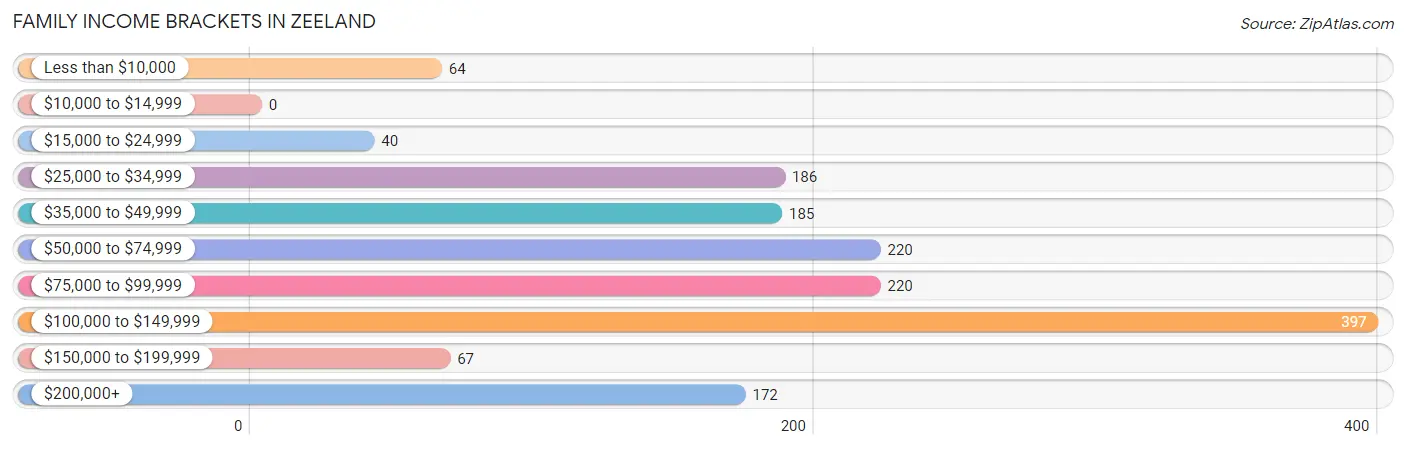
| Income Bracket | # Families | % Families |
| Less than $10,000 | 64 | 4.1% |
| $10,000 to $14,999 | 0 | 0.0% |
| $15,000 to $24,999 | 40 | 2.6% |
| $25,000 to $34,999 | 186 | 12.0% |
| $35,000 to $49,999 | 185 | 11.9% |
| $50,000 to $74,999 | 220 | 14.2% |
| $75,000 to $99,999 | 220 | 14.2% |
| $100,000 to $149,999 | 397 | 25.6% |
| $150,000 to $199,999 | 67 | 4.3% |
| $200,000+ | 172 | 11.1% |
Family Income by Famaliy Size in Zeeland
5-person families (72 | 4.6%) account for the highest median family income in Zeeland with $108,621 per family, while 2-person families (760 | 49.0%) have the highest median income of $39,375 per family member.
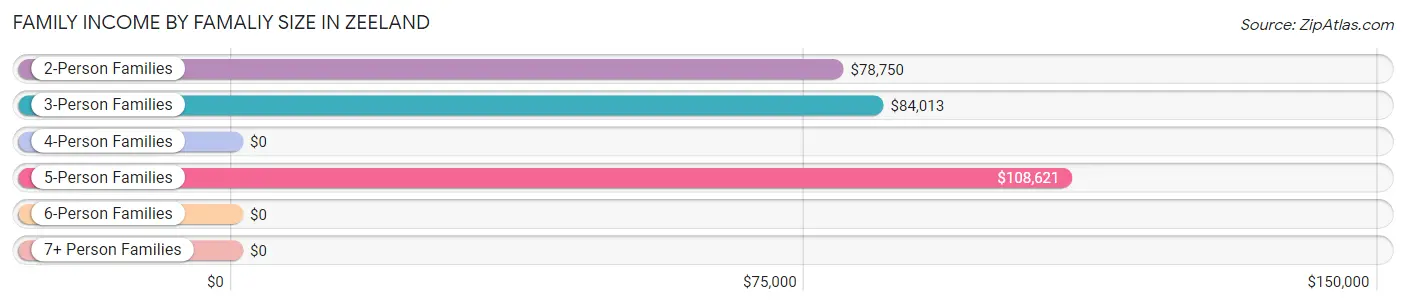
| Income Bracket | # Families | Median Income |
| 2-Person Families | 760 (49.0%) | $78,750 |
| 3-Person Families | 419 (27.0%) | $84,013 |
| 4-Person Families | 251 (16.2%) | $0 |
| 5-Person Families | 72 (4.6%) | $108,621 |
| 6-Person Families | 49 (3.2%) | $0 |
| 7+ Person Families | 0 (0.0%) | $0 |
| Total | 1,551 (100.0%) | $83,161 |
Family Income by Number of Earners in Zeeland
The median family income in Zeeland is $83,161, with families comprising 3+ earners (179) having the highest median family income of $122,256, while families with 1 earner (504) have the lowest median family income of $38,878, accounting for 11.5% and 32.5% of families, respectively.
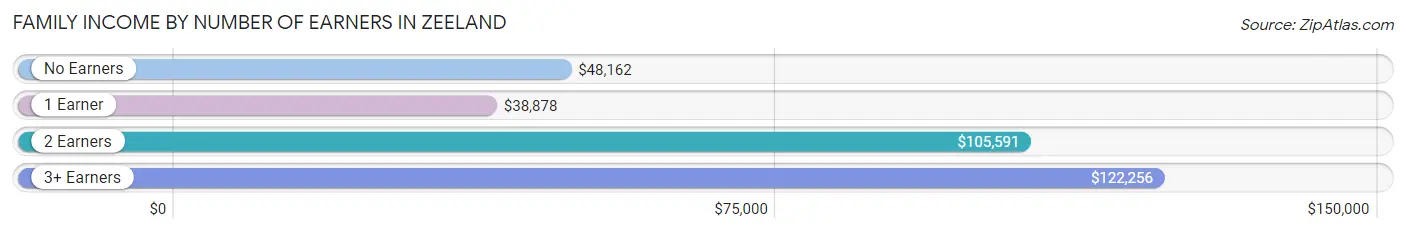
| Number of Earners | # Families | Median Income |
| No Earners | 181 (11.7%) | $48,162 |
| 1 Earner | 504 (32.5%) | $38,878 |
| 2 Earners | 687 (44.3%) | $105,591 |
| 3+ Earners | 179 (11.5%) | $122,256 |
| Total | 1,551 (100.0%) | $83,161 |
Household Income in Zeeland
Household Income Brackets in Zeeland
With 473 households falling in the category, the $35,000 to $49,999 income range is the most frequent in Zeeland, accounting for 18.6% of all households. In contrast, only 76 households (3.0%) fall into the $10,000 to $14,999 income bracket, making it the least populous group.
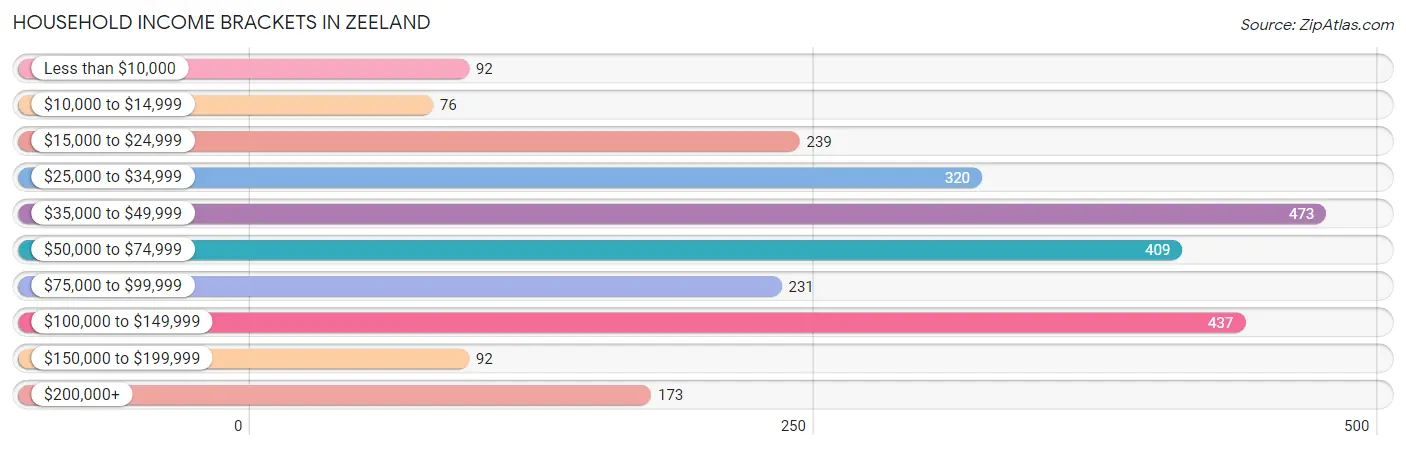
| Income Bracket | # Households | % Households |
| Less than $10,000 | 92 | 3.6% |
| $10,000 to $14,999 | 76 | 3.0% |
| $15,000 to $24,999 | 239 | 9.4% |
| $25,000 to $34,999 | 320 | 12.6% |
| $35,000 to $49,999 | 473 | 18.6% |
| $50,000 to $74,999 | 409 | 16.1% |
| $75,000 to $99,999 | 231 | 9.1% |
| $100,000 to $149,999 | 437 | 17.2% |
| $150,000 to $199,999 | 92 | 3.6% |
| $200,000+ | 173 | 6.8% |
Household Income by Householder Age in Zeeland
The median household income in Zeeland is $60,505, with the highest median household income of $94,891 found in the 25 to 44 years age bracket for the primary householder. A total of 638 households (25.1%) fall into this category. Meanwhile, the 15 to 24 years age bracket for the primary householder has the lowest median household income of $0, with 136 households (5.3%) in this group.
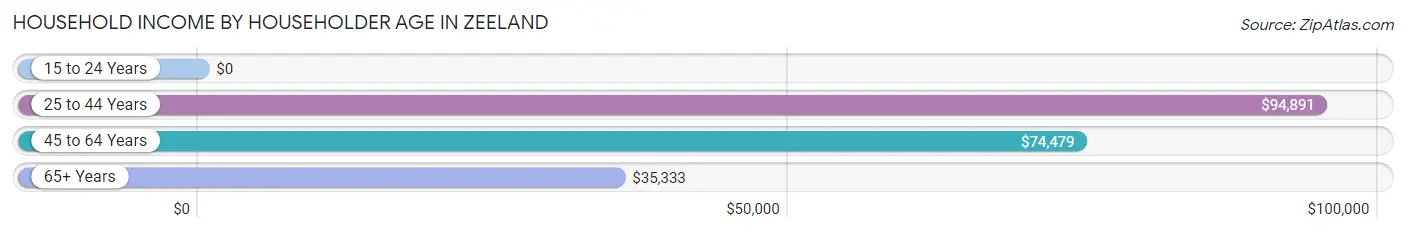
| Income Bracket | # Households | Median Income |
| 15 to 24 Years | 136 (5.3%) | $0 |
| 25 to 44 Years | 638 (25.1%) | $94,891 |
| 45 to 64 Years | 805 (31.7%) | $74,479 |
| 65+ Years | 964 (37.9%) | $35,333 |
| Total | 2,543 (100.0%) | $60,505 |
Poverty in Zeeland
Income Below Poverty by Sex and Age in Zeeland
With 1.5% poverty level for males and 14.2% for females among the residents of Zeeland, 75 year old and over males and 18 to 24 year old females are the most vulnerable to poverty, with 18 males (6.8%) and 202 females (55.8%) in their respective age groups living below the poverty level.
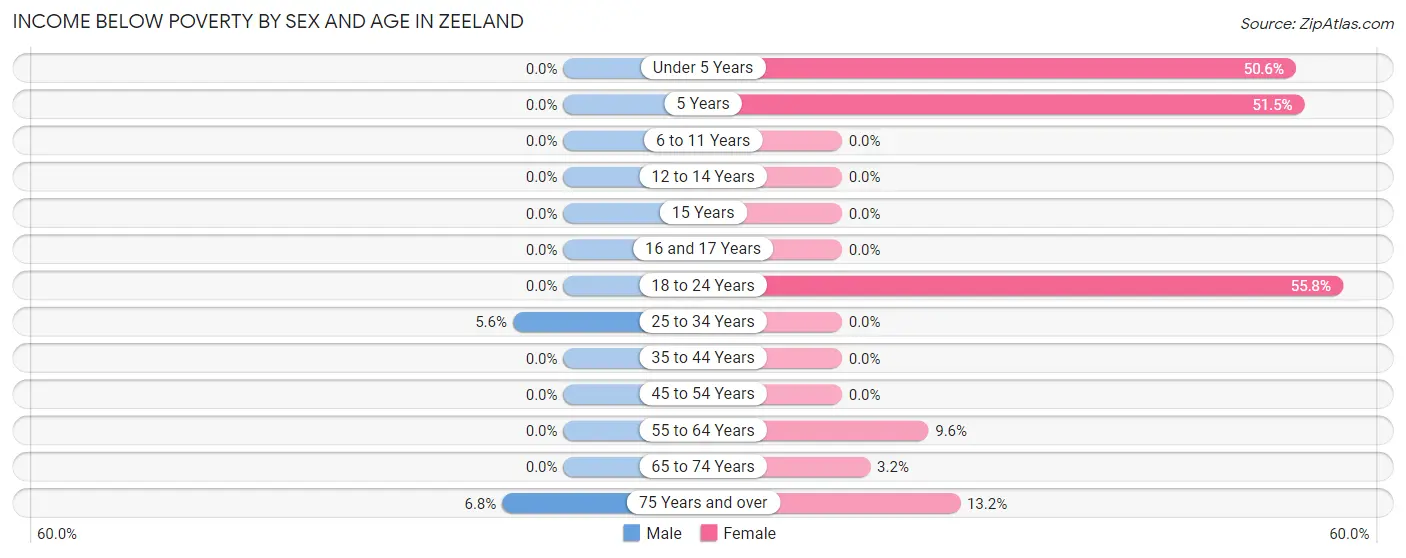
| Age Bracket | Male | Female |
| Under 5 Years | 0 (0.0%) | 91 (50.6%) |
| 5 Years | 0 (0.0%) | 17 (51.5%) |
| 6 to 11 Years | 0 (0.0%) | 0 (0.0%) |
| 12 to 14 Years | 0 (0.0%) | 0 (0.0%) |
| 15 Years | 0 (0.0%) | 0 (0.0%) |
| 16 and 17 Years | 0 (0.0%) | 0 (0.0%) |
| 18 to 24 Years | 0 (0.0%) | 202 (55.8%) |
| 25 to 34 Years | 21 (5.6%) | 0 (0.0%) |
| 35 to 44 Years | 0 (0.0%) | 0 (0.0%) |
| 45 to 54 Years | 0 (0.0%) | 0 (0.0%) |
| 55 to 64 Years | 0 (0.0%) | 36 (9.6%) |
| 65 to 74 Years | 0 (0.0%) | 10 (3.2%) |
| 75 Years and over | 18 (6.8%) | 60 (13.2%) |
| Total | 39 (1.5%) | 416 (14.2%) |
Income Above Poverty by Sex and Age in Zeeland
According to the poverty statistics in Zeeland, males aged under 5 years and females aged 6 to 11 years are the age groups that are most secure financially, with 100.0% of males and 100.0% of females in these age groups living above the poverty line.
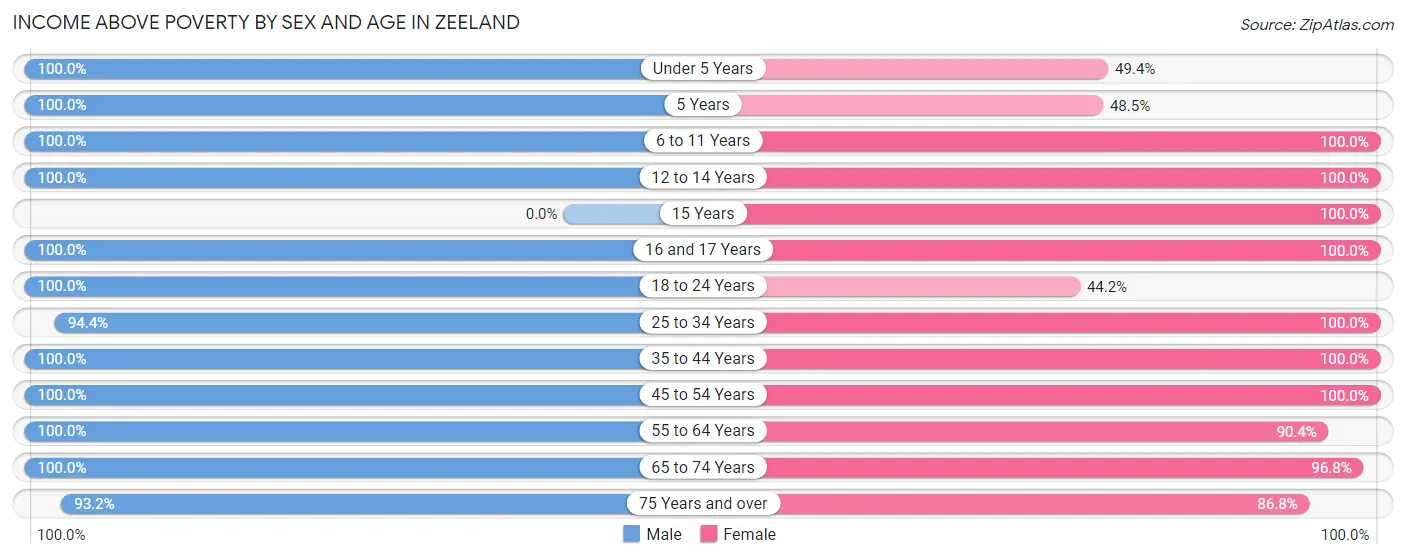
| Age Bracket | Male | Female |
| Under 5 Years | 192 (100.0%) | 89 (49.4%) |
| 5 Years | 68 (100.0%) | 16 (48.5%) |
| 6 to 11 Years | 273 (100.0%) | 170 (100.0%) |
| 12 to 14 Years | 59 (100.0%) | 71 (100.0%) |
| 15 Years | 0 (0.0%) | 7 (100.0%) |
| 16 and 17 Years | 174 (100.0%) | 39 (100.0%) |
| 18 to 24 Years | 164 (100.0%) | 160 (44.2%) |
| 25 to 34 Years | 352 (94.4%) | 324 (100.0%) |
| 35 to 44 Years | 164 (100.0%) | 306 (100.0%) |
| 45 to 54 Years | 360 (100.0%) | 293 (100.0%) |
| 55 to 64 Years | 282 (100.0%) | 338 (90.4%) |
| 65 to 74 Years | 230 (100.0%) | 306 (96.8%) |
| 75 Years and over | 246 (93.2%) | 396 (86.8%) |
| Total | 2,564 (98.5%) | 2,515 (85.8%) |
Income Below Poverty Among Married-Couple Families in Zeeland
The poverty statistics for married-couple families in Zeeland show that 0.9% or 10 of the total 1,060 families live below the poverty line. Families with no children have the highest poverty rate of 1.4%, comprising of 10 families. On the other hand, families with 1 or 2 children have the lowest poverty rate of 0.0%, which includes 0 families.
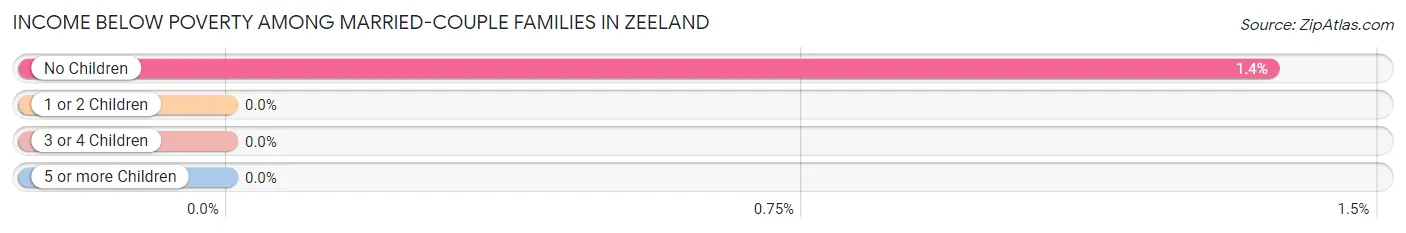
| Children | Above Poverty | Below Poverty |
| No Children | 723 (98.6%) | 10 (1.4%) |
| 1 or 2 Children | 217 (100.0%) | 0 (0.0%) |
| 3 or 4 Children | 110 (100.0%) | 0 (0.0%) |
| 5 or more Children | 0 (0.0%) | 0 (0.0%) |
| Total | 1,050 (99.1%) | 10 (0.9%) |
Income Below Poverty Among Single-Parent Households in Zeeland
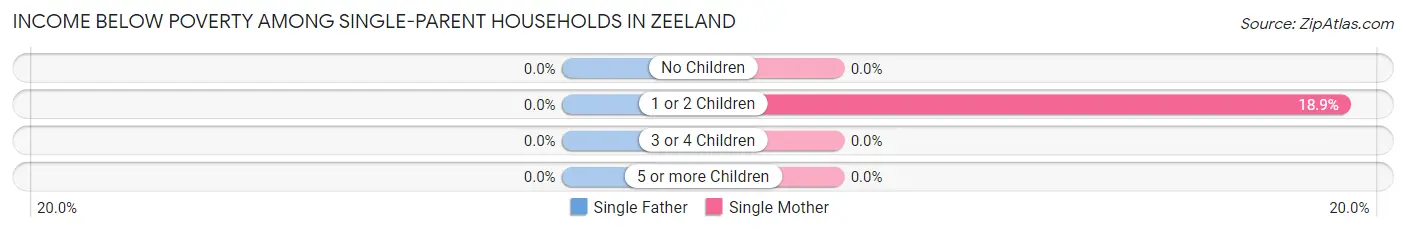
| Children | Single Father | Single Mother |
| No Children | 0 (0.0%) | 0 (0.0%) |
| 1 or 2 Children | 0 (0.0%) | 54 (18.9%) |
| 3 or 4 Children | 0 (0.0%) | 0 (0.0%) |
| 5 or more Children | 0 (0.0%) | 0 (0.0%) |
| Total | 0 (0.0%) | 54 (11.4%) |
Income Below Poverty Among Married-Couple vs Single-Parent Households in Zeeland
The poverty data for Zeeland shows that 10 of the married-couple family households (0.9%) and 54 of the single-parent households (11.0%) are living below the poverty level. Within the married-couple family households, those with no children have the highest poverty rate, with 10 households (1.4%) falling below the poverty line. Among the single-parent households, those with 1 or 2 children have the highest poverty rate, with 54 household (18.9%) living below poverty.
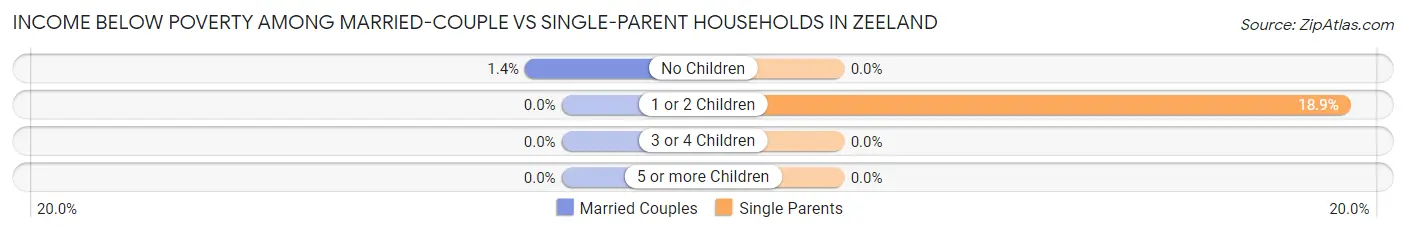
| Children | Married-Couple Families | Single-Parent Households |
| No Children | 10 (1.4%) | 0 (0.0%) |
| 1 or 2 Children | 0 (0.0%) | 54 (18.9%) |
| 3 or 4 Children | 0 (0.0%) | 0 (0.0%) |
| 5 or more Children | 0 (0.0%) | 0 (0.0%) |
| Total | 10 (0.9%) | 54 (11.0%) |
Race in Zeeland
The most populous races in Zeeland are White / Caucasian (5,437 | 95.4%), Hispanic or Latino (536 | 9.4%), and Two or more Races (126 | 2.2%).
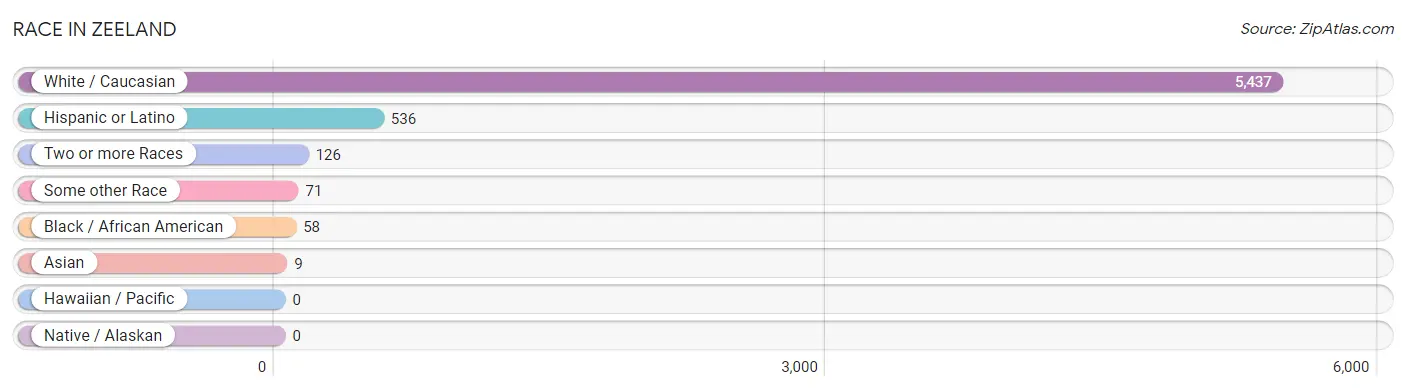
| Race | # Population | % Population |
| Asian | 9 | 0.2% |
| Black / African American | 58 | 1.0% |
| Hawaiian / Pacific | 0 | 0.0% |
| Hispanic or Latino | 536 | 9.4% |
| Native / Alaskan | 0 | 0.0% |
| White / Caucasian | 5,437 | 95.4% |
| Two or more Races | 126 | 2.2% |
| Some other Race | 71 | 1.3% |
| Total | 5,701 | 100.0% |
Ancestry in Zeeland
The most populous ancestries reported in Zeeland are Dutch (2,286 | 40.1%), German (752 | 13.2%), Mexican (487 | 8.5%), English (356 | 6.2%), and Irish (342 | 6.0%), together accounting for 74.1% of all Zeeland residents.
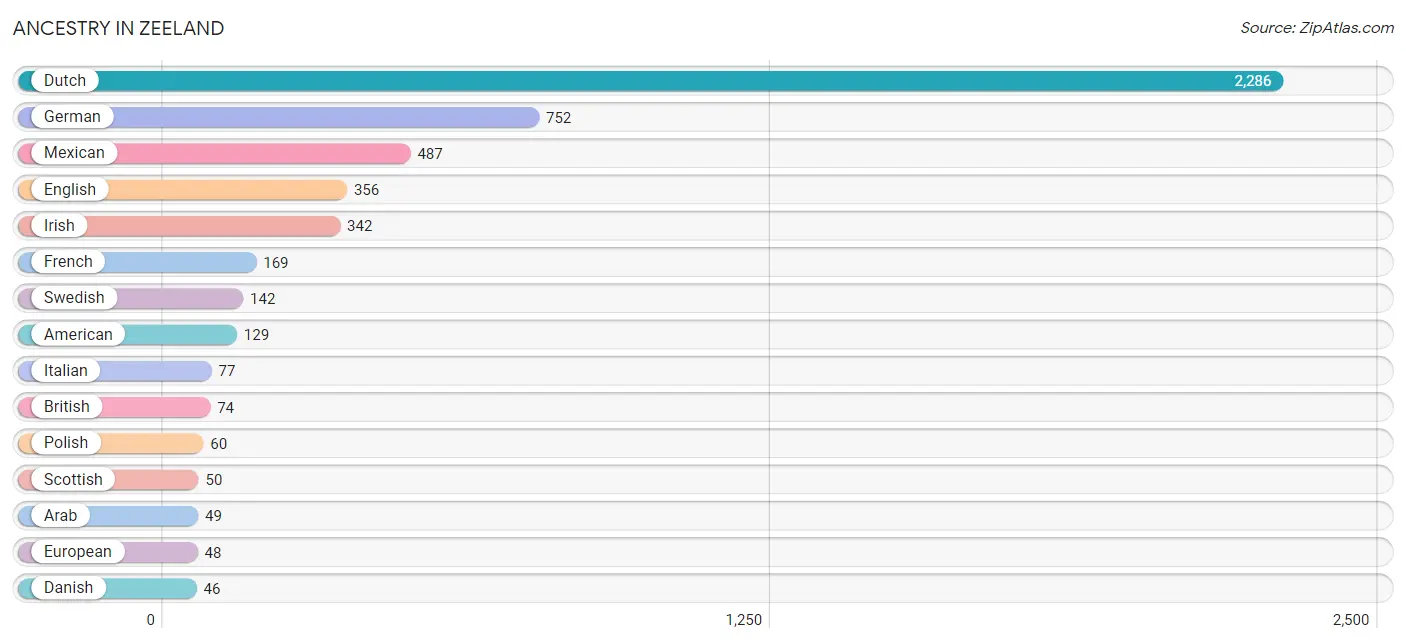
| Ancestry | # Population | % Population |
| American | 129 | 2.3% |
| Arab | 49 | 0.9% |
| British | 74 | 1.3% |
| Cajun | 7 | 0.1% |
| Central American | 21 | 0.4% |
| Czechoslovakian | 15 | 0.3% |
| Danish | 46 | 0.8% |
| Dutch | 2,286 | 40.1% |
| English | 356 | 6.2% |
| European | 48 | 0.8% |
| Finnish | 18 | 0.3% |
| French | 169 | 3.0% |
| French Canadian | 10 | 0.2% |
| German | 752 | 13.2% |
| Hungarian | 13 | 0.2% |
| Indian (Asian) | 8 | 0.1% |
| Iraqi | 18 | 0.3% |
| Irish | 342 | 6.0% |
| Italian | 77 | 1.3% |
| Lebanese | 15 | 0.3% |
| Mexican | 487 | 8.5% |
| Northern European | 7 | 0.1% |
| Panamanian | 21 | 0.4% |
| Polish | 60 | 1.1% |
| Puerto Rican | 23 | 0.4% |
| Scotch-Irish | 12 | 0.2% |
| Scottish | 50 | 0.9% |
| Slovak | 24 | 0.4% |
| Sri Lankan | 1 | 0.0% |
| Swedish | 142 | 2.5% |
| Swiss | 1 | 0.0% | View All 31 Rows |
Immigrants in Zeeland
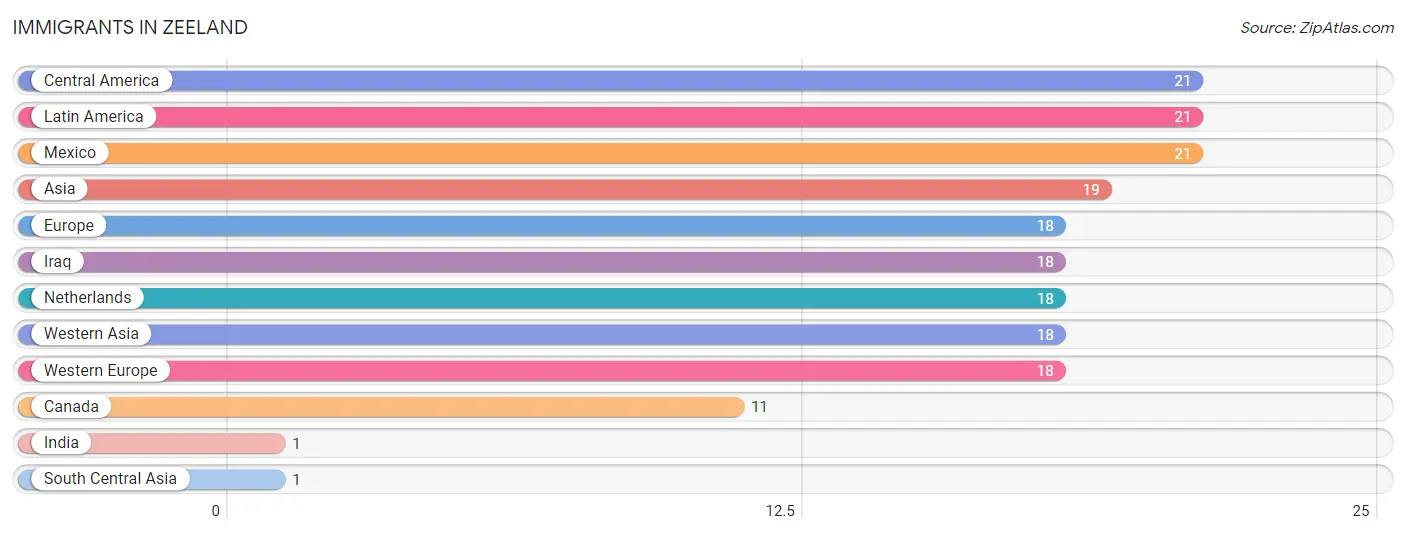
The most numerous immigrant groups reported in Zeeland came from Central America (21 | 0.4%), Latin America (21 | 0.4%), Mexico (21 | 0.4%), Asia (19 | 0.3%), and Europe (18 | 0.3%), together accounting for 1.8% of all Zeeland residents.
| Immigration Origin | # Population | % Population |
| Asia | 19 | 0.3% |
| Canada | 11 | 0.2% |
| Central America | 21 | 0.4% |
| Europe | 18 | 0.3% |
| India | 1 | 0.0% |
| Iraq | 18 | 0.3% |
| Latin America | 21 | 0.4% |
| Mexico | 21 | 0.4% |
| Netherlands | 18 | 0.3% |
| South Central Asia | 1 | 0.0% |
| Western Asia | 18 | 0.3% |
| Western Europe | 18 | 0.3% | View All 12 Rows |
Sex and Age in Zeeland
Sex and Age in Zeeland
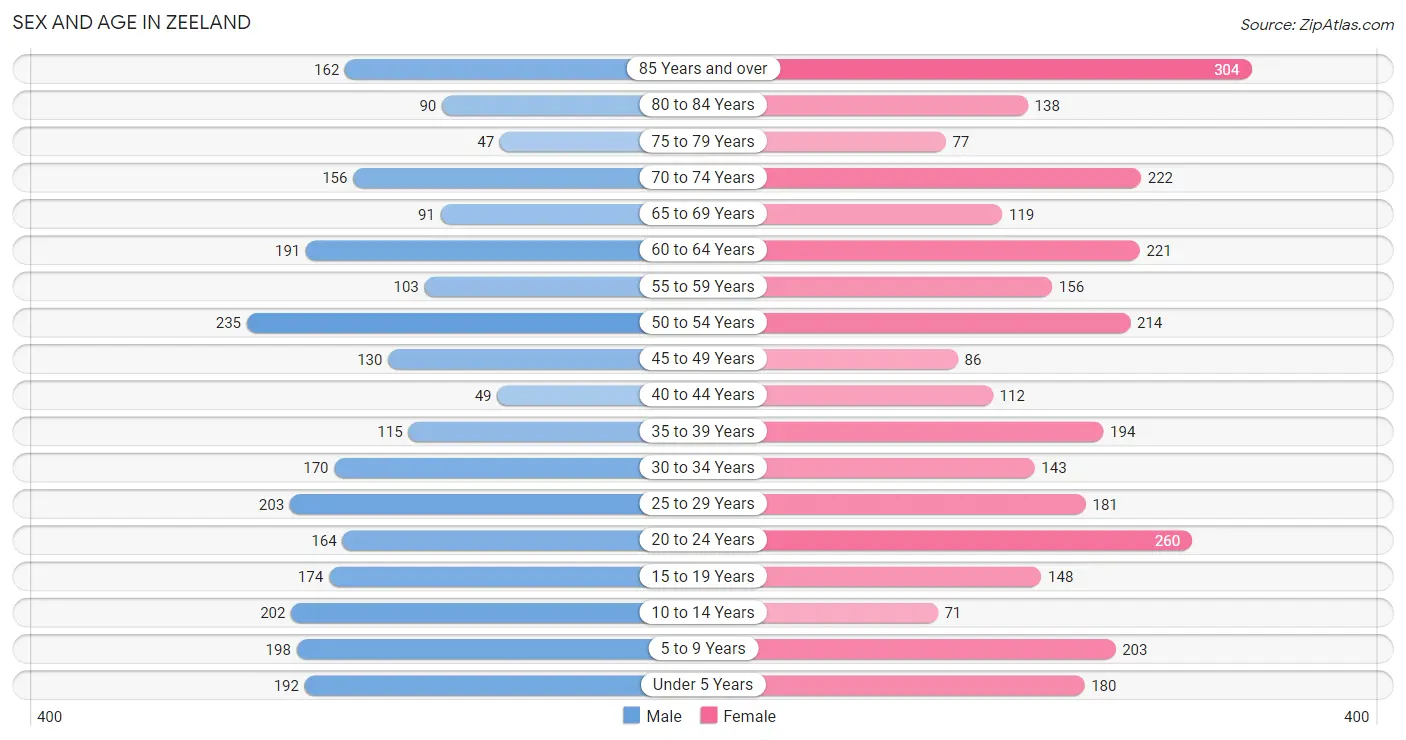
The most populous age groups in Zeeland are 50 to 54 Years (235 | 8.8%) for men and 85 Years and over (304 | 10.0%) for women.
| Age Bracket | Male | Female |
| Under 5 Years | 192 (7.2%) | 180 (5.9%) |
| 5 to 9 Years | 198 (7.4%) | 203 (6.7%) |
| 10 to 14 Years | 202 (7.6%) | 71 (2.3%) |
| 15 to 19 Years | 174 (6.5%) | 148 (4.9%) |
| 20 to 24 Years | 164 (6.1%) | 260 (8.6%) |
| 25 to 29 Years | 203 (7.6%) | 181 (6.0%) |
| 30 to 34 Years | 170 (6.4%) | 143 (4.7%) |
| 35 to 39 Years | 115 (4.3%) | 194 (6.4%) |
| 40 to 44 Years | 49 (1.8%) | 112 (3.7%) |
| 45 to 49 Years | 130 (4.9%) | 86 (2.8%) |
| 50 to 54 Years | 235 (8.8%) | 214 (7.1%) |
| 55 to 59 Years | 103 (3.8%) | 156 (5.1%) |
| 60 to 64 Years | 191 (7.1%) | 221 (7.3%) |
| 65 to 69 Years | 91 (3.4%) | 119 (3.9%) |
| 70 to 74 Years | 156 (5.8%) | 222 (7.3%) |
| 75 to 79 Years | 47 (1.8%) | 77 (2.5%) |
| 80 to 84 Years | 90 (3.4%) | 138 (4.6%) |
| 85 Years and over | 162 (6.1%) | 304 (10.0%) |
| Total | 2,672 (100.0%) | 3,029 (100.0%) |
Families and Households in Zeeland
Median Family Size in Zeeland
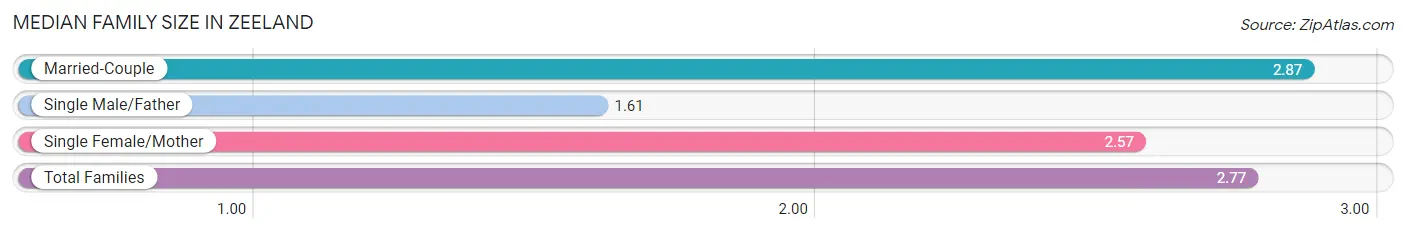
The median family size in Zeeland is 2.77 persons per family, with married-couple families (1,060 | 68.3%) accounting for the largest median family size of 2.87 persons per family. On the other hand, single male/father families (18 | 1.2%) represent the smallest median family size with 1.61 persons per family.
| Family Type | # Families | Family Size |
| Married-Couple | 1,060 (68.3%) | 2.87 |
| Single Male/Father | 18 (1.2%) | 1.61 |
| Single Female/Mother | 473 (30.5%) | 2.57 |
| Total Families | 1,551 (100.0%) | 2.77 |
Median Household Size in Zeeland
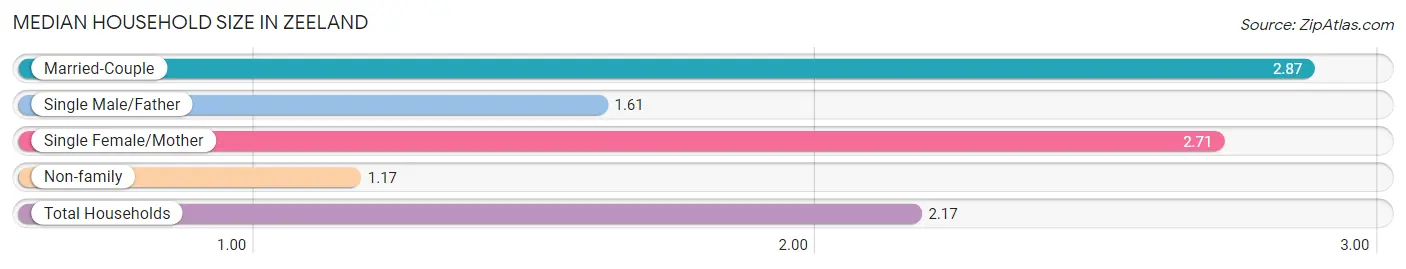
The median household size in Zeeland is 2.17 persons per household, with married-couple households (1,060 | 41.7%) accounting for the largest median household size of 2.87 persons per household. non-family households (992 | 39.0%) represent the smallest median household size with 1.17 persons per household.
| Household Type | # Households | Household Size |
| Married-Couple | 1,060 (41.7%) | 2.87 |
| Single Male/Father | 18 (0.7%) | 1.61 |
| Single Female/Mother | 473 (18.6%) | 2.71 |
| Non-family | 992 (39.0%) | 1.17 |
| Total Households | 2,543 (100.0%) | 2.17 |
Household Size by Marriage Status in Zeeland
Out of a total of 2,543 households in Zeeland, 1,551 (61.0%) are family households, while 992 (39.0%) are nonfamily households. The most numerous type of family households are 2-person households, comprising 722, and the most common type of nonfamily households are 1-person households, comprising 897.
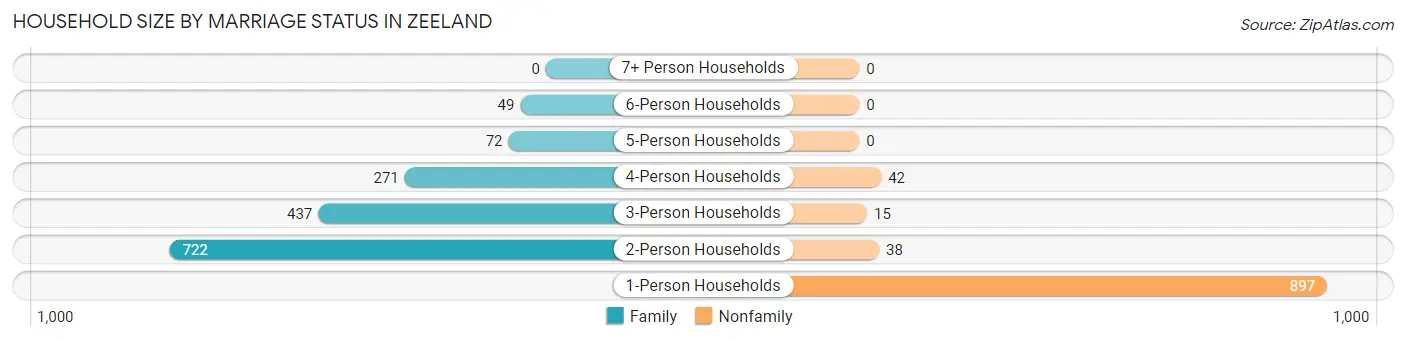
| Household Size | Family Households | Nonfamily Households |
| 1-Person Households | - | 897 (35.3%) |
| 2-Person Households | 722 (28.4%) | 38 (1.5%) |
| 3-Person Households | 437 (17.2%) | 15 (0.6%) |
| 4-Person Households | 271 (10.7%) | 42 (1.7%) |
| 5-Person Households | 72 (2.8%) | 0 (0.0%) |
| 6-Person Households | 49 (1.9%) | 0 (0.0%) |
| 7+ Person Households | 0 (0.0%) | 0 (0.0%) |
| Total | 1,551 (61.0%) | 992 (39.0%) |
Female Fertility in Zeeland
Fertility by Age in Zeeland
Average fertility rate in Zeeland is 70.0 births per 1,000 women. Women in the age bracket of 20 to 34 years have the highest fertility rate with 137.0 births per 1,000 women. Women in the age bracket of 20 to 34 years acount for 100.0% of all women with births.
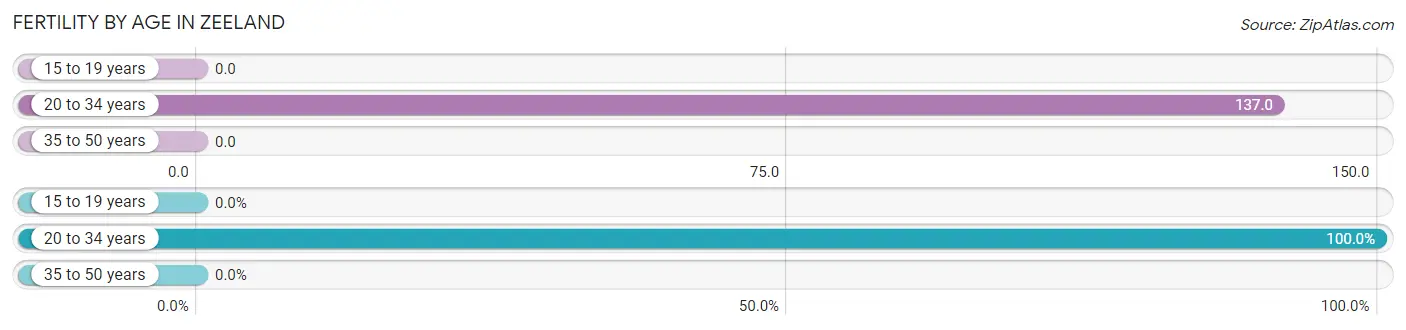
| Age Bracket | Women with Births | Births / 1,000 Women |
| 15 to 19 years | 0 (0.0%) | 0.0 |
| 20 to 34 years | 80 (100.0%) | 137.0 |
| 35 to 50 years | 0 (0.0%) | 0.0 |
| Total | 80 (100.0%) | 70.0 |
Fertility by Age by Marriage Status in Zeeland
78.7% of women with births (80) in Zeeland are married. The highest percentage of unmarried women with births falls into 20 to 34 years age bracket with 21.2% of them unmarried at the time of birth, while the lowest percentage of unmarried women with births belong to 20 to 34 years age bracket with 21.3% of them unmarried.
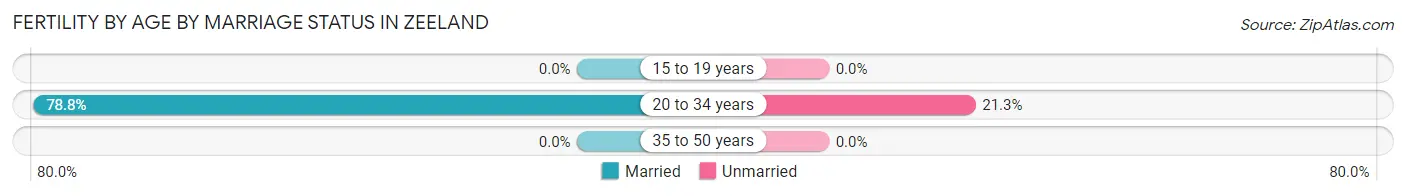
| Age Bracket | Married | Unmarried |
| 15 to 19 years | 0 (0.0%) | 0 (0.0%) |
| 20 to 34 years | 63 (78.7%) | 17 (21.2%) |
| 35 to 50 years | 0 (0.0%) | 0 (0.0%) |
| Total | 63 (78.7%) | 17 (21.2%) |
Fertility by Education in Zeeland
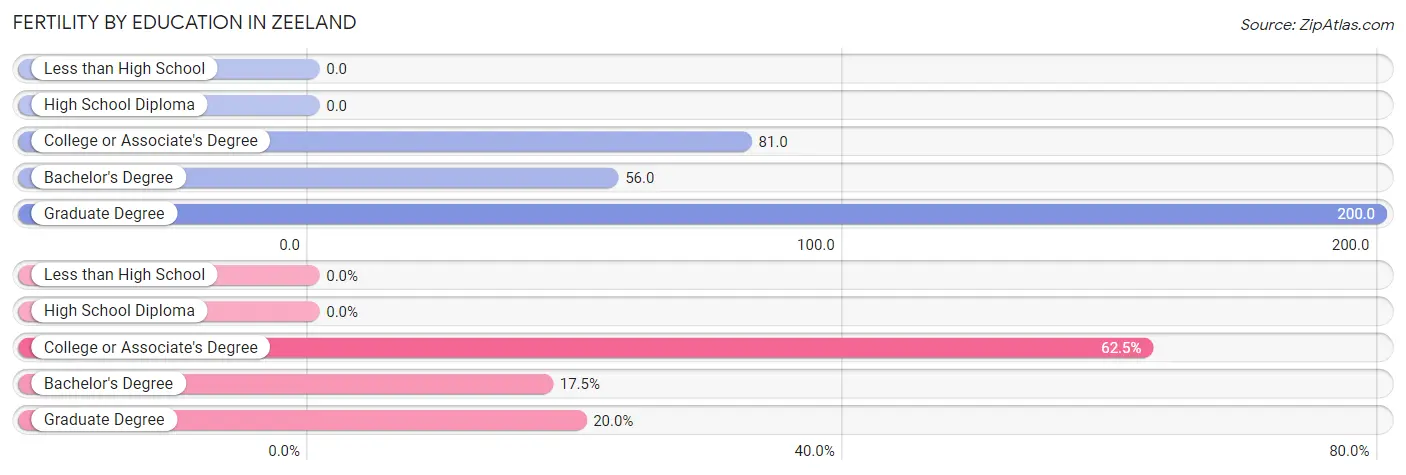
| Educational Attainment | Women with Births | Births / 1,000 Women |
| Less than High School | 0 (0.0%) | 0.0 |
| High School Diploma | 0 (0.0%) | 0.0 |
| College or Associate's Degree | 50 (62.5%) | 81.0 |
| Bachelor's Degree | 14 (17.5%) | 56.0 |
| Graduate Degree | 16 (20.0%) | 200.0 |
| Total | 80 (100.0%) | 70.0 |
Fertility by Education by Marriage Status in Zeeland
21.2% of women with births in Zeeland are unmarried. Women with the educational attainment of bachelor's degree are most likely to be married with 100.0% of them married at childbirth, while women with the educational attainment of college or associate's degree are least likely to be married with 34.0% of them unmarried at childbirth.
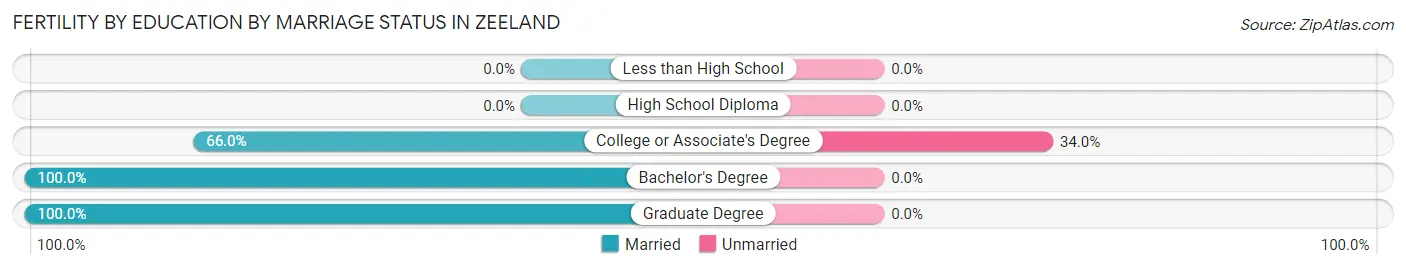
| Educational Attainment | Married | Unmarried |
| Less than High School | 0 (0.0%) | 0 (0.0%) |
| High School Diploma | 0 (0.0%) | 0 (0.0%) |
| College or Associate's Degree | 33 (66.0%) | 17 (34.0%) |
| Bachelor's Degree | 14 (100.0%) | 0 (0.0%) |
| Graduate Degree | 16 (100.0%) | 0 (0.0%) |
| Total | 63 (78.7%) | 17 (21.2%) |
Employment Characteristics in Zeeland
Employment by Class of Employer in Zeeland
Among the 2,915 employed individuals in Zeeland, private company employees (2,295 | 78.7%), not-for-profit organizations (276 | 9.5%), and local government employees (133 | 4.6%) make up the most common classes of employment.
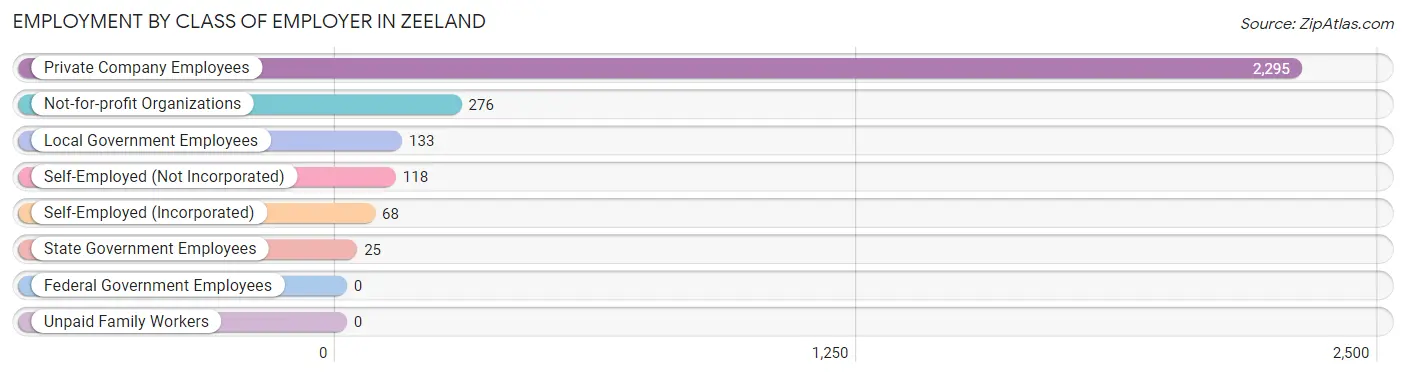
| Employer Class | # Employees | % Employees |
| Private Company Employees | 2,295 | 78.7% |
| Self-Employed (Incorporated) | 68 | 2.3% |
| Self-Employed (Not Incorporated) | 118 | 4.1% |
| Not-for-profit Organizations | 276 | 9.5% |
| Local Government Employees | 133 | 4.6% |
| State Government Employees | 25 | 0.9% |
| Federal Government Employees | 0 | 0.0% |
| Unpaid Family Workers | 0 | 0.0% |
| Total | 2,915 | 100.0% |
Employment Status by Age in Zeeland
According to the labor force statistics for Zeeland, out of the total population over 16 years of age (4,648), 64.7% or 3,007 individuals are in the labor force, with 2.8% or 84 of them unemployed. The age group with the highest labor force participation rate is 30 to 34 years, with 95.5% or 299 individuals in the labor force. Within the labor force, the 45 to 54 years age range has the highest percentage of unemployed individuals, with 14.0% or 84 of them being unemployed.
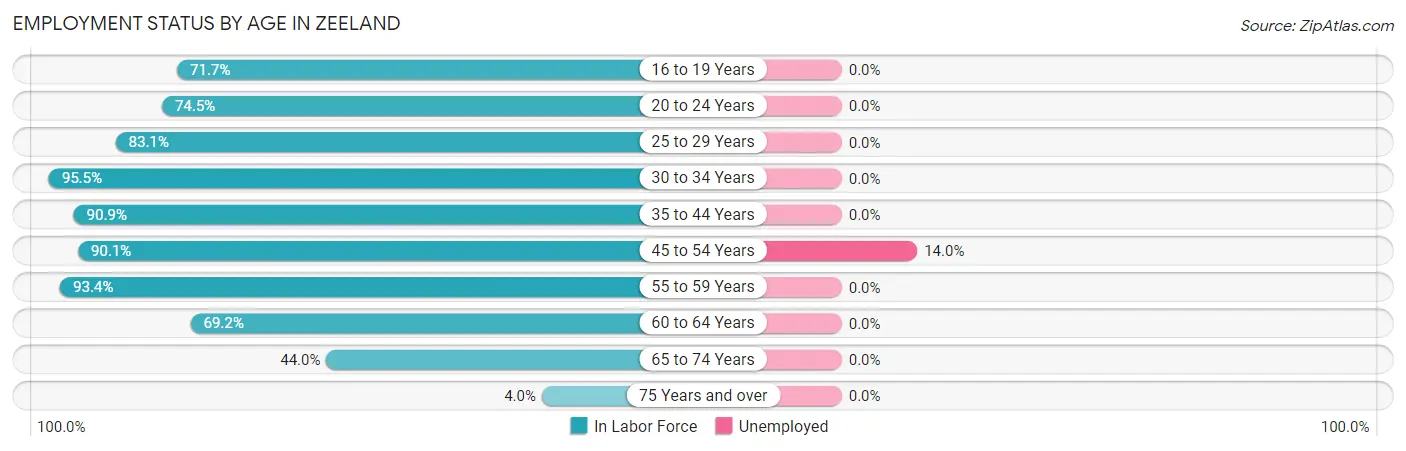
| Age Bracket | In Labor Force | Unemployed |
| 16 to 19 Years | 226 (71.7%) | 0 (0.0%) |
| 20 to 24 Years | 316 (74.5%) | 0 (0.0%) |
| 25 to 29 Years | 319 (83.1%) | 0 (0.0%) |
| 30 to 34 Years | 299 (95.5%) | 0 (0.0%) |
| 35 to 44 Years | 427 (90.9%) | 0 (0.0%) |
| 45 to 54 Years | 599 (90.1%) | 84 (14.0%) |
| 55 to 59 Years | 242 (93.4%) | 0 (0.0%) |
| 60 to 64 Years | 285 (69.2%) | 0 (0.0%) |
| 65 to 74 Years | 259 (44.0%) | 0 (0.0%) |
| 75 Years and over | 33 (4.0%) | 0 (0.0%) |
| Total | 3,007 (64.7%) | 84 (2.8%) |
Employment Status by Educational Attainment in Zeeland
According to labor force statistics for Zeeland, 86.7% of individuals (2,170) out of the total population between 25 and 64 years of age (2,503) are in the labor force, with 3.9% or 85 of them being unemployed. The group with the highest labor force participation rate are those with the educational attainment of college / associate degree, with 94.8% or 858 individuals in the labor force. Within the labor force, individuals with college / associate degree education have the highest percentage of unemployment, with 9.8% or 84 of them being unemployed.
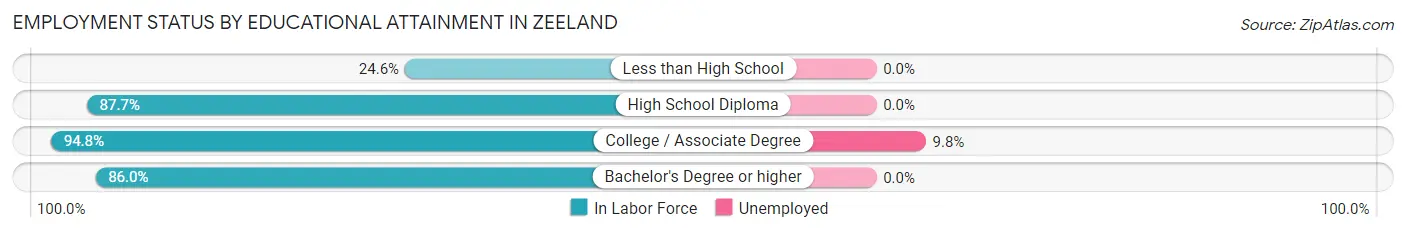
| Educational Attainment | In Labor Force | Unemployed |
| Less than High School | 29 (24.6%) | 0 (0.0%) |
| High School Diploma | 551 (87.7%) | 0 (0.0%) |
| College / Associate Degree | 858 (94.8%) | 89 (9.8%) |
| Bachelor's Degree or higher | 733 (86.0%) | 0 (0.0%) |
| Total | 2,170 (86.7%) | 98 (3.9%) |
Employment Occupations by Sex in Zeeland
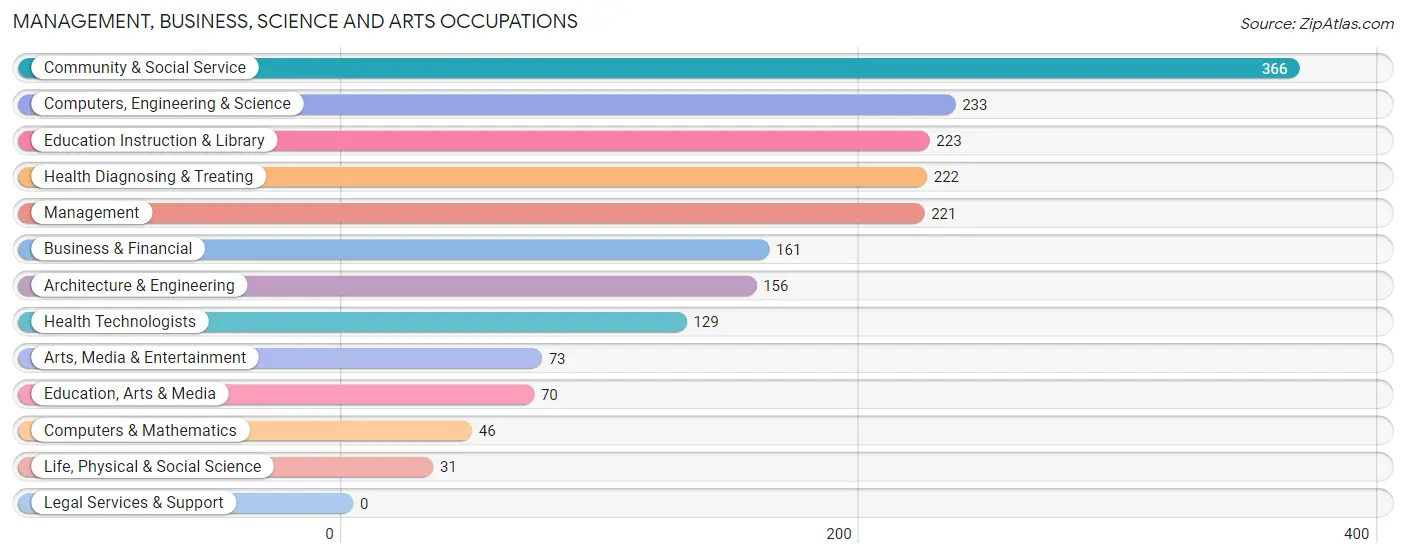
Management, Business, Science and Arts Occupations
The most common Management, Business, Science and Arts occupations in Zeeland are Community & Social Service (366 | 12.5%), Computers, Engineering & Science (233 | 8.0%), Education Instruction & Library (223 | 7.6%), Health Diagnosing & Treating (222 | 7.6%), and Management (221 | 7.6%).
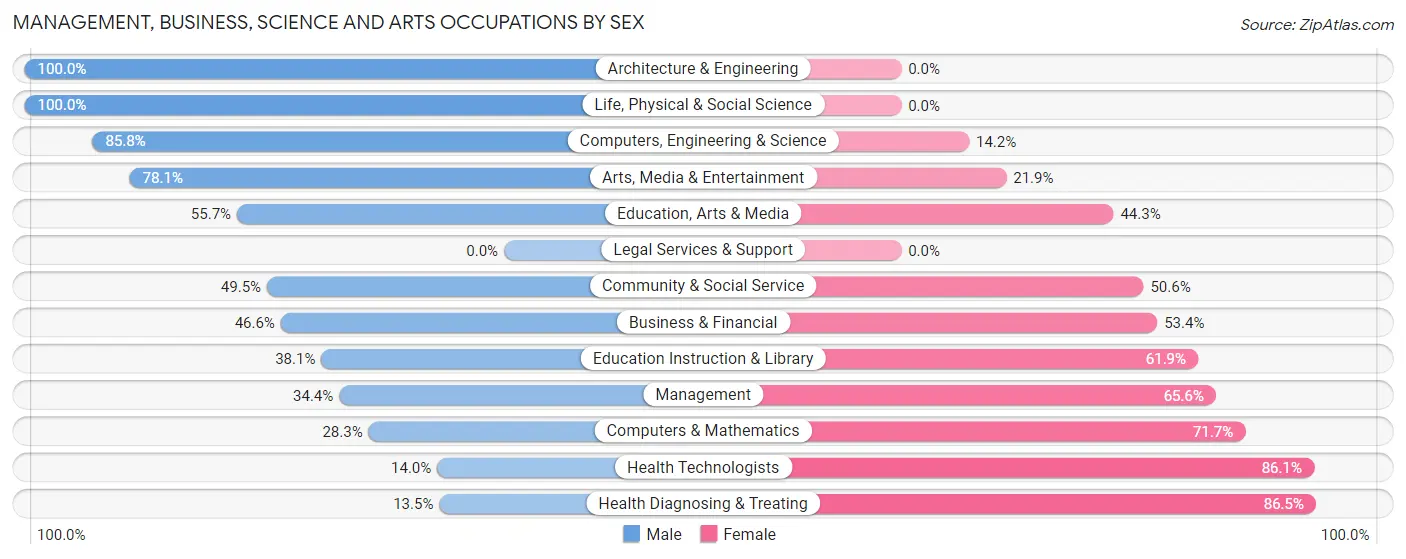
Management, Business, Science and Arts Occupations by Sex
Within the Management, Business, Science and Arts occupations in Zeeland, the most male-oriented occupations are Architecture & Engineering (100.0%), Life, Physical & Social Science (100.0%), and Computers, Engineering & Science (85.8%), while the most female-oriented occupations are Health Diagnosing & Treating (86.5%), Health Technologists (86.1%), and Computers & Mathematics (71.7%).
| Occupation | Male | Female |
| Management | 76 (34.4%) | 145 (65.6%) |
| Business & Financial | 75 (46.6%) | 86 (53.4%) |
| Computers, Engineering & Science | 200 (85.8%) | 33 (14.2%) |
| Computers & Mathematics | 13 (28.3%) | 33 (71.7%) |
| Architecture & Engineering | 156 (100.0%) | 0 (0.0%) |
| Life, Physical & Social Science | 31 (100.0%) | 0 (0.0%) |
| Community & Social Service | 181 (49.4%) | 185 (50.5%) |
| Education, Arts & Media | 39 (55.7%) | 31 (44.3%) |
| Legal Services & Support | 0 (0.0%) | 0 (0.0%) |
| Education Instruction & Library | 85 (38.1%) | 138 (61.9%) |
| Arts, Media & Entertainment | 57 (78.1%) | 16 (21.9%) |
| Health Diagnosing & Treating | 30 (13.5%) | 192 (86.5%) |
| Health Technologists | 18 (14.0%) | 111 (86.1%) |
| Total (Category) | 562 (46.7%) | 641 (53.3%) |
| Total (Overall) | 1,509 (51.7%) | 1,412 (48.3%) |
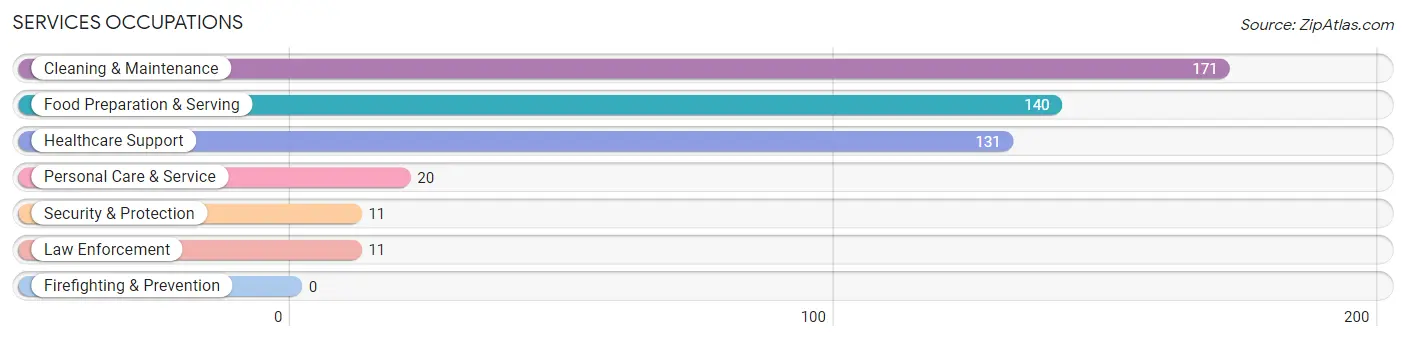
Services Occupations
The most common Services occupations in Zeeland are Cleaning & Maintenance (171 | 5.9%), Food Preparation & Serving (140 | 4.8%), Healthcare Support (131 | 4.5%), Personal Care & Service (20 | 0.7%), and Security & Protection (11 | 0.4%).
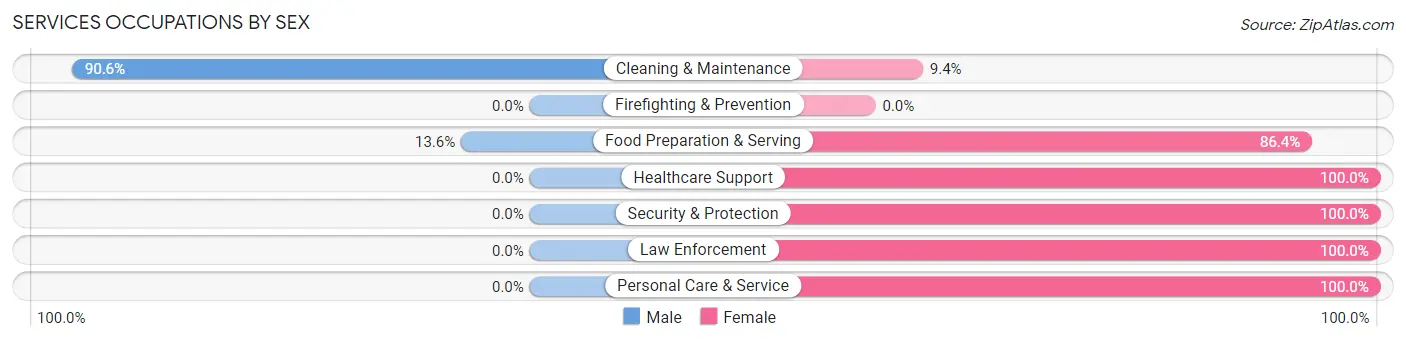
Services Occupations by Sex
Within the Services occupations in Zeeland, the most male-oriented occupations are Cleaning & Maintenance (90.6%), and Food Preparation & Serving (13.6%), while the most female-oriented occupations are Healthcare Support (100.0%), Security & Protection (100.0%), and Law Enforcement (100.0%).
| Occupation | Male | Female |
| Healthcare Support | 0 (0.0%) | 131 (100.0%) |
| Security & Protection | 0 (0.0%) | 11 (100.0%) |
| Firefighting & Prevention | 0 (0.0%) | 0 (0.0%) |
| Law Enforcement | 0 (0.0%) | 11 (100.0%) |
| Food Preparation & Serving | 19 (13.6%) | 121 (86.4%) |
| Cleaning & Maintenance | 155 (90.6%) | 16 (9.4%) |
| Personal Care & Service | 0 (0.0%) | 20 (100.0%) |
| Total (Category) | 174 (36.8%) | 299 (63.2%) |
| Total (Overall) | 1,509 (51.7%) | 1,412 (48.3%) |
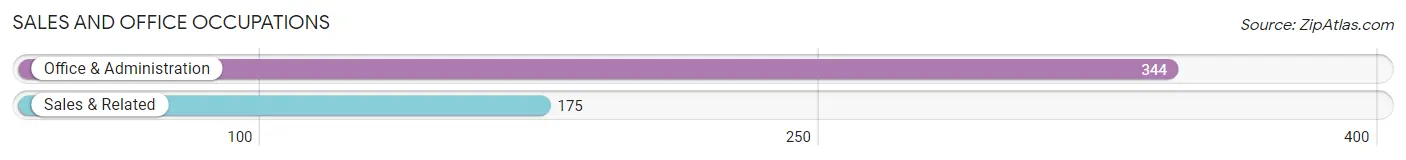
Sales and Office Occupations
The most common Sales and Office occupations in Zeeland are Office & Administration (344 | 11.8%), and Sales & Related (175 | 6.0%).
Sales and Office Occupations by Sex
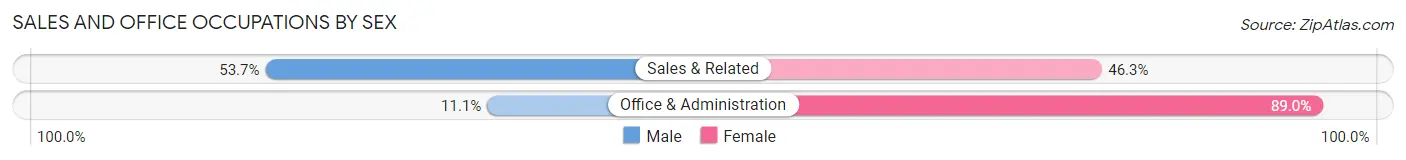
| Occupation | Male | Female |
| Sales & Related | 94 (53.7%) | 81 (46.3%) |
| Office & Administration | 38 (11.1%) | 306 (88.9%) |
| Total (Category) | 132 (25.4%) | 387 (74.6%) |
| Total (Overall) | 1,509 (51.7%) | 1,412 (48.3%) |
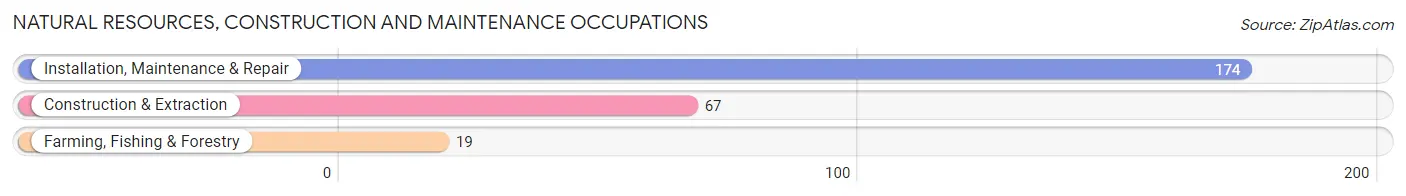
Natural Resources, Construction and Maintenance Occupations
The most common Natural Resources, Construction and Maintenance occupations in Zeeland are Installation, Maintenance & Repair (174 | 6.0%), Construction & Extraction (67 | 2.3%), and Farming, Fishing & Forestry (19 | 0.6%).
Natural Resources, Construction and Maintenance Occupations by Sex
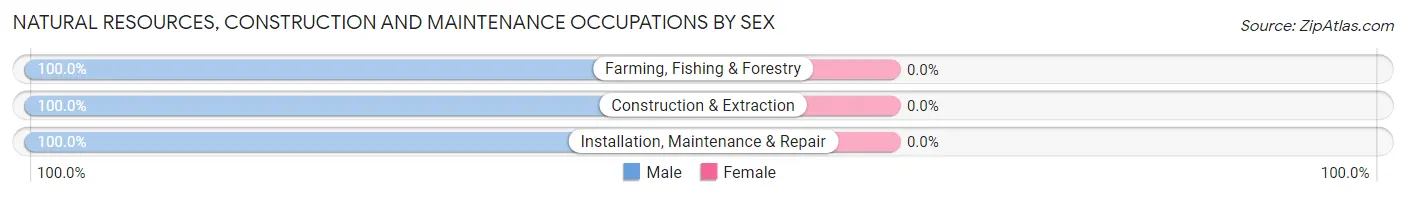
| Occupation | Male | Female |
| Farming, Fishing & Forestry | 19 (100.0%) | 0 (0.0%) |
| Construction & Extraction | 67 (100.0%) | 0 (0.0%) |
| Installation, Maintenance & Repair | 174 (100.0%) | 0 (0.0%) |
| Total (Category) | 260 (100.0%) | 0 (0.0%) |
| Total (Overall) | 1,509 (51.7%) | 1,412 (48.3%) |
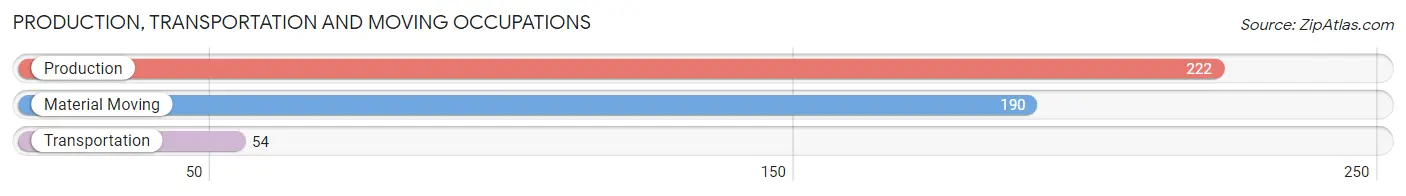
Production, Transportation and Moving Occupations
The most common Production, Transportation and Moving occupations in Zeeland are Production (222 | 7.6%), Material Moving (190 | 6.5%), and Transportation (54 | 1.8%).
Production, Transportation and Moving Occupations by Sex
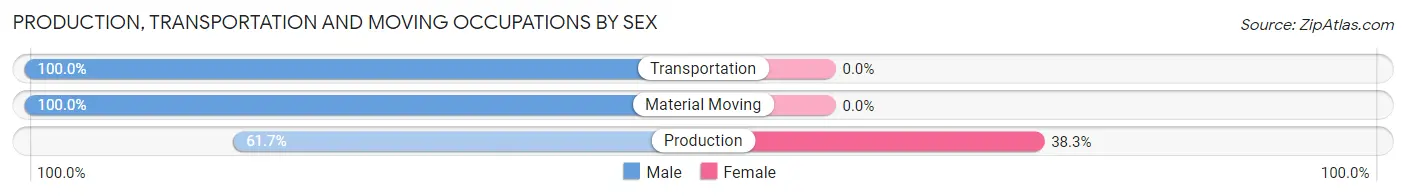
| Occupation | Male | Female |
| Production | 137 (61.7%) | 85 (38.3%) |
| Transportation | 54 (100.0%) | 0 (0.0%) |
| Material Moving | 190 (100.0%) | 0 (0.0%) |
| Total (Category) | 381 (81.8%) | 85 (18.2%) |
| Total (Overall) | 1,509 (51.7%) | 1,412 (48.3%) |
Employment Industries by Sex in Zeeland
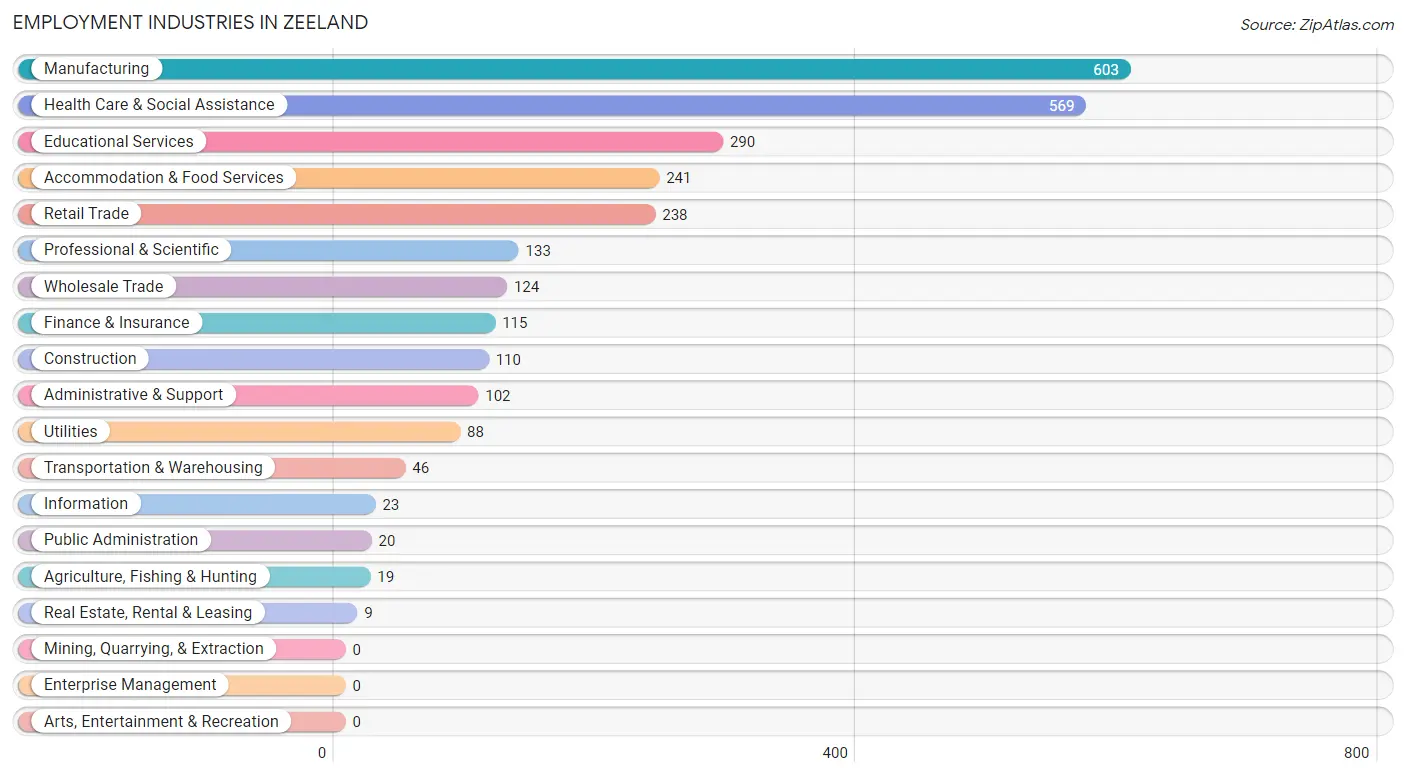
Employment Industries in Zeeland
The major employment industries in Zeeland include Manufacturing (603 | 20.6%), Health Care & Social Assistance (569 | 19.5%), Educational Services (290 | 9.9%), Accommodation & Food Services (241 | 8.3%), and Retail Trade (238 | 8.2%).
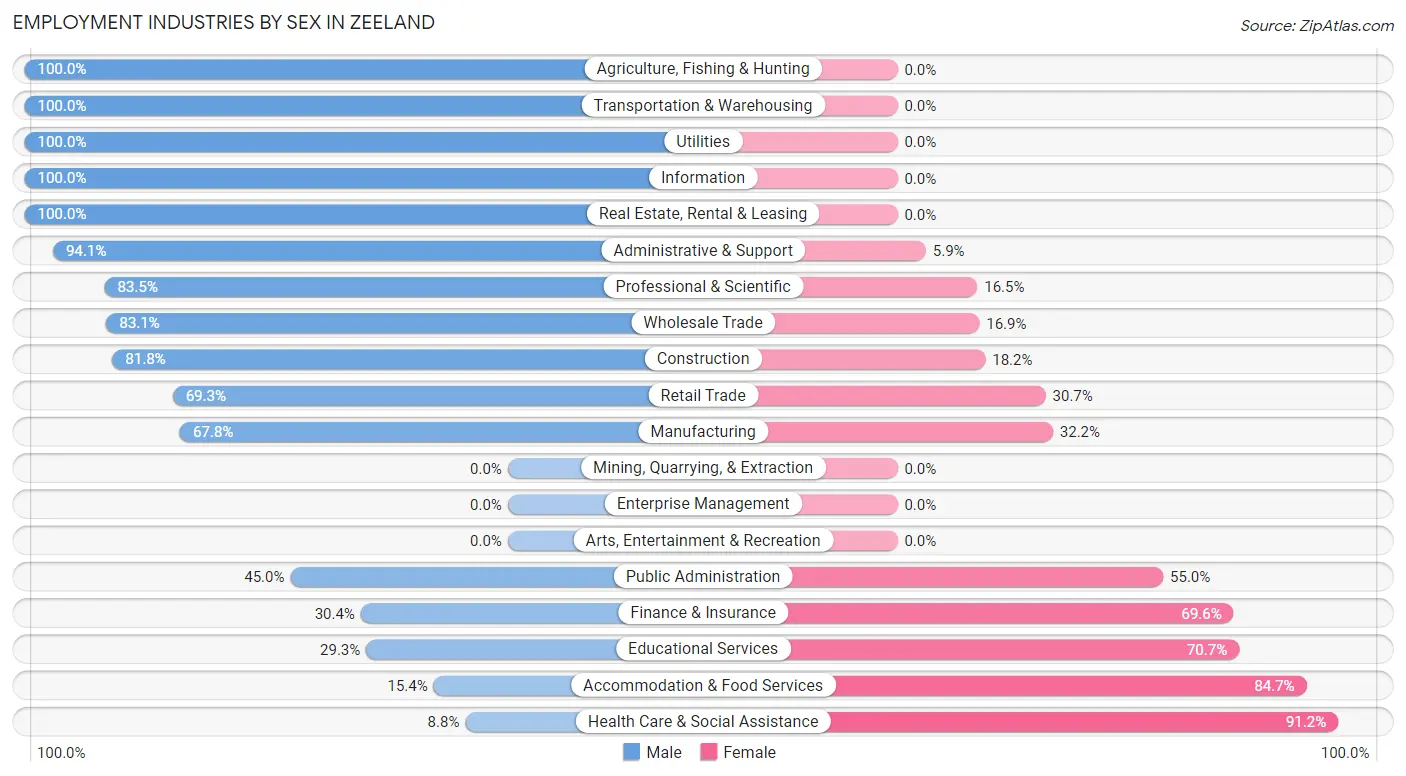
Employment Industries by Sex in Zeeland
The Zeeland industries that see more men than women are Agriculture, Fishing & Hunting (100.0%), Transportation & Warehousing (100.0%), and Utilities (100.0%), whereas the industries that tend to have a higher number of women are Health Care & Social Assistance (91.2%), Accommodation & Food Services (84.7%), and Educational Services (70.7%).
| Industry | Male | Female |
| Agriculture, Fishing & Hunting | 19 (100.0%) | 0 (0.0%) |
| Mining, Quarrying, & Extraction | 0 (0.0%) | 0 (0.0%) |
| Construction | 90 (81.8%) | 20 (18.2%) |
| Manufacturing | 409 (67.8%) | 194 (32.2%) |
| Wholesale Trade | 103 (83.1%) | 21 (16.9%) |
| Retail Trade | 165 (69.3%) | 73 (30.7%) |
| Transportation & Warehousing | 46 (100.0%) | 0 (0.0%) |
| Utilities | 88 (100.0%) | 0 (0.0%) |
| Information | 23 (100.0%) | 0 (0.0%) |
| Finance & Insurance | 35 (30.4%) | 80 (69.6%) |
| Real Estate, Rental & Leasing | 9 (100.0%) | 0 (0.0%) |
| Professional & Scientific | 111 (83.5%) | 22 (16.5%) |
| Enterprise Management | 0 (0.0%) | 0 (0.0%) |
| Administrative & Support | 96 (94.1%) | 6 (5.9%) |
| Educational Services | 85 (29.3%) | 205 (70.7%) |
| Health Care & Social Assistance | 50 (8.8%) | 519 (91.2%) |
| Arts, Entertainment & Recreation | 0 (0.0%) | 0 (0.0%) |
| Accommodation & Food Services | 37 (15.3%) | 204 (84.7%) |
| Public Administration | 9 (45.0%) | 11 (55.0%) |
| Total | 1,509 (51.7%) | 1,412 (48.3%) |
Education in Zeeland
School Enrollment in Zeeland
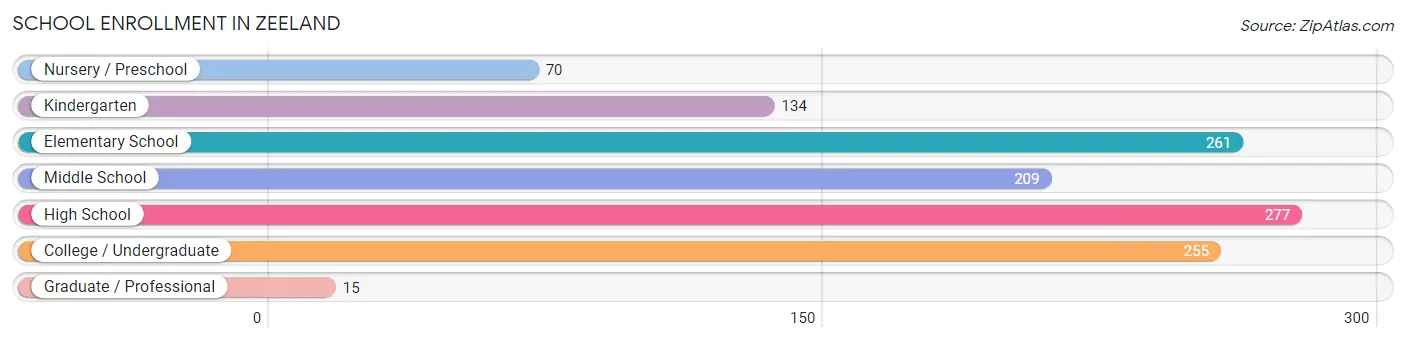
The most common levels of schooling among the 1,221 students in Zeeland are high school (277 | 22.7%), elementary school (261 | 21.4%), and college / undergraduate (255 | 20.9%).
| School Level | # Students | % Students |
| Nursery / Preschool | 70 | 5.7% |
| Kindergarten | 134 | 11.0% |
| Elementary School | 261 | 21.4% |
| Middle School | 209 | 17.1% |
| High School | 277 | 22.7% |
| College / Undergraduate | 255 | 20.9% |
| Graduate / Professional | 15 | 1.2% |
| Total | 1,221 | 100.0% |
School Enrollment by Age by Funding Source in Zeeland
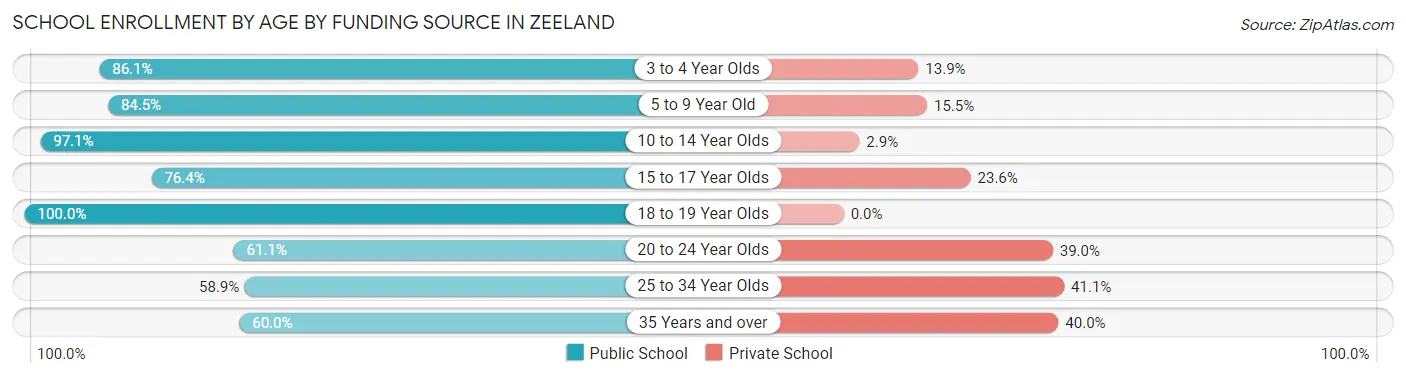
Out of a total of 1,221 students who are enrolled in schools in Zeeland, 223 (18.3%) attend a private institution, while the remaining 998 (81.7%) are enrolled in public schools. The age group of 25 to 34 year olds has the highest likelihood of being enrolled in private schools, with 23 (41.1% in the age bracket) enrolled. Conversely, the age group of 18 to 19 year olds has the lowest likelihood of being enrolled in a private school, with 66 (100.0% in the age bracket) attending a public institution.
| Age Bracket | Public School | Private School |
| 3 to 4 Year Olds | 68 (86.1%) | 11 (13.9%) |
| 5 to 9 Year Old | 272 (84.5%) | 50 (15.5%) |
| 10 to 14 Year Olds | 265 (97.1%) | 8 (2.9%) |
| 15 to 17 Year Olds | 168 (76.4%) | 52 (23.6%) |
| 18 to 19 Year Olds | 66 (100.0%) | 0 (0.0%) |
| 20 to 24 Year Olds | 116 (61.1%) | 74 (39.0%) |
| 25 to 34 Year Olds | 33 (58.9%) | 23 (41.1%) |
| 35 Years and over | 9 (60.0%) | 6 (40.0%) |
| Total | 998 (81.7%) | 223 (18.3%) |
Educational Attainment by Field of Study in Zeeland
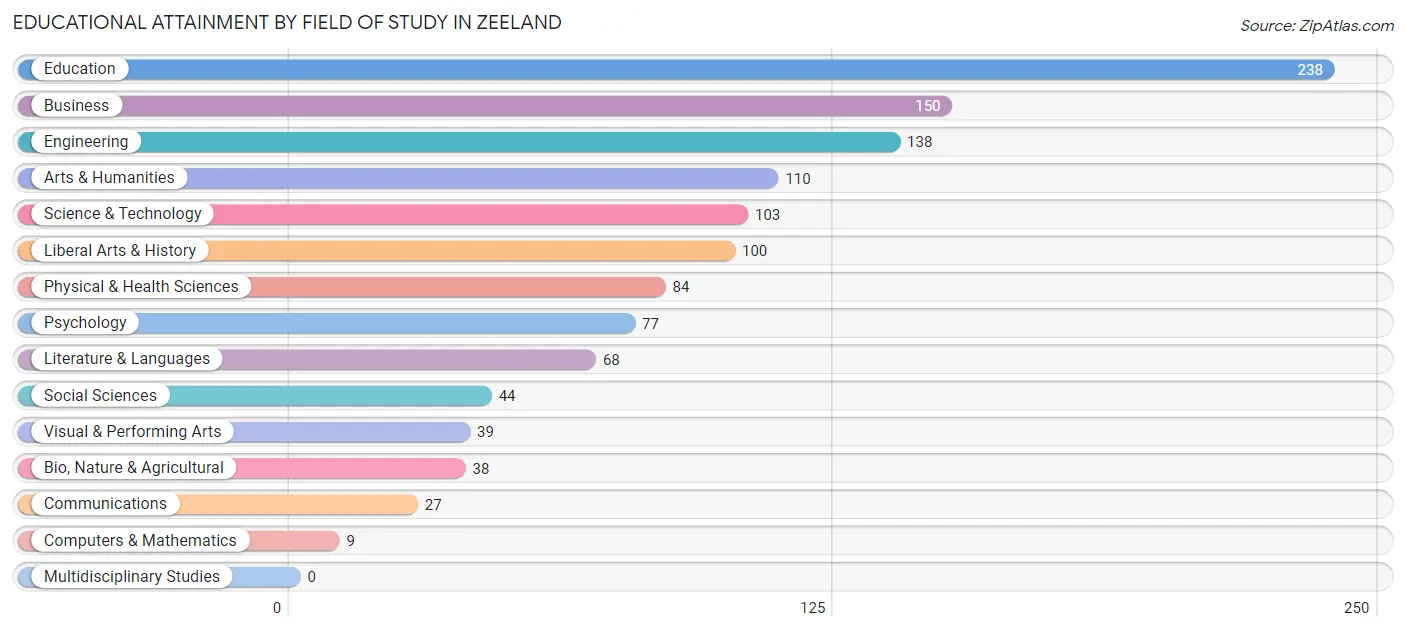
Education (238 | 19.4%), business (150 | 12.2%), engineering (138 | 11.3%), arts & humanities (110 | 9.0%), and science & technology (103 | 8.4%) are the most common fields of study among 1,225 individuals in Zeeland who have obtained a bachelor's degree or higher.
| Field of Study | # Graduates | % Graduates |
| Computers & Mathematics | 9 | 0.7% |
| Bio, Nature & Agricultural | 38 | 3.1% |
| Physical & Health Sciences | 84 | 6.9% |
| Psychology | 77 | 6.3% |
| Social Sciences | 44 | 3.6% |
| Engineering | 138 | 11.3% |
| Multidisciplinary Studies | 0 | 0.0% |
| Science & Technology | 103 | 8.4% |
| Business | 150 | 12.2% |
| Education | 238 | 19.4% |
| Literature & Languages | 68 | 5.6% |
| Liberal Arts & History | 100 | 8.2% |
| Visual & Performing Arts | 39 | 3.2% |
| Communications | 27 | 2.2% |
| Arts & Humanities | 110 | 9.0% |
| Total | 1,225 | 100.0% |
Transportation & Commute in Zeeland
Vehicle Availability by Sex in Zeeland
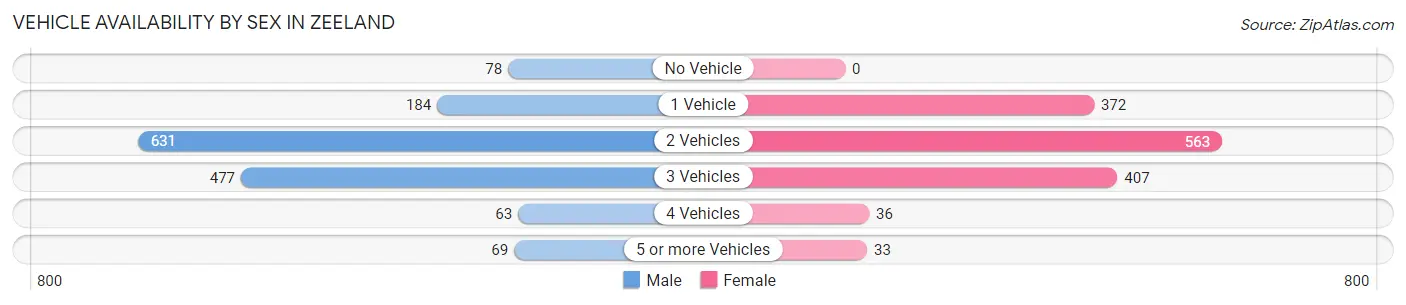
The most prevalent vehicle ownership categories in Zeeland are males with 2 vehicles (631, accounting for 42.0%) and females with 2 vehicles (563, making up 44.7%).
| Vehicles Available | Male | Female |
| No Vehicle | 78 (5.2%) | 0 (0.0%) |
| 1 Vehicle | 184 (12.2%) | 372 (26.4%) |
| 2 Vehicles | 631 (42.0%) | 563 (39.9%) |
| 3 Vehicles | 477 (31.8%) | 407 (28.8%) |
| 4 Vehicles | 63 (4.2%) | 36 (2.5%) |
| 5 or more Vehicles | 69 (4.6%) | 33 (2.3%) |
| Total | 1,502 (100.0%) | 1,411 (100.0%) |
Commute Time in Zeeland
The most frequently occuring commute durations in Zeeland are 5 to 9 minutes (617 commuters, 22.4%), 15 to 19 minutes (607 commuters, 22.1%), and 10 to 14 minutes (541 commuters, 19.7%).
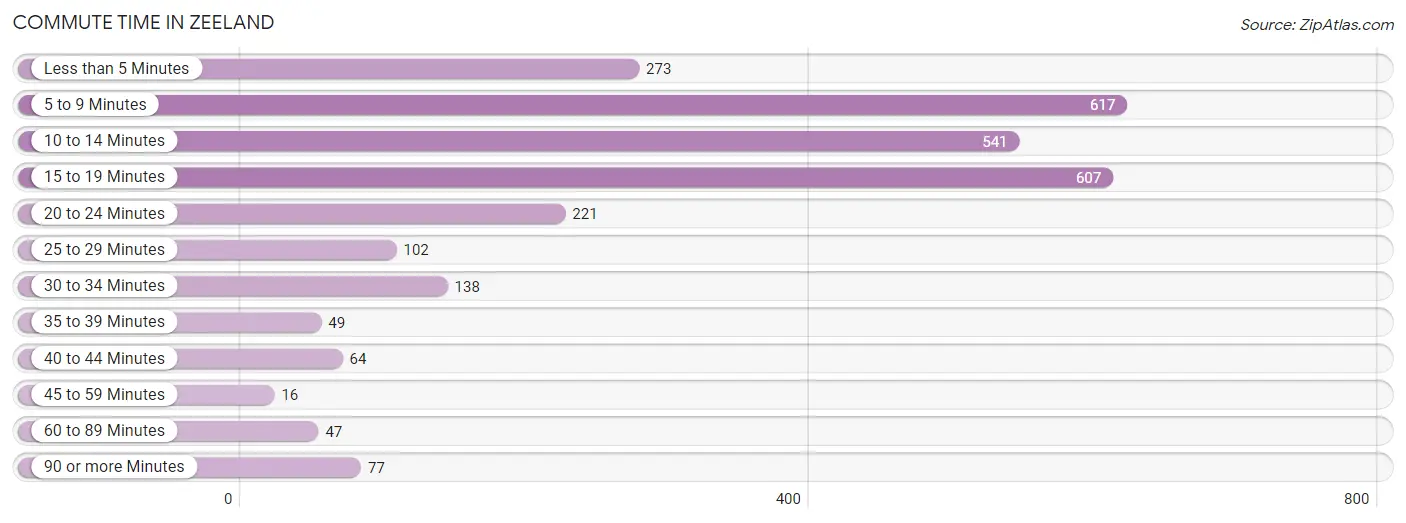
| Commute Time | # Commuters | % Commuters |
| Less than 5 Minutes | 273 | 9.9% |
| 5 to 9 Minutes | 617 | 22.4% |
| 10 to 14 Minutes | 541 | 19.7% |
| 15 to 19 Minutes | 607 | 22.1% |
| 20 to 24 Minutes | 221 | 8.0% |
| 25 to 29 Minutes | 102 | 3.7% |
| 30 to 34 Minutes | 138 | 5.0% |
| 35 to 39 Minutes | 49 | 1.8% |
| 40 to 44 Minutes | 64 | 2.3% |
| 45 to 59 Minutes | 16 | 0.6% |
| 60 to 89 Minutes | 47 | 1.7% |
| 90 or more Minutes | 77 | 2.8% |
Commute Time by Sex in Zeeland
The most common commute times in Zeeland are 10 to 14 minutes (377 commuters, 25.8%) for males and 15 to 19 minutes (363 commuters, 28.1%) for females.
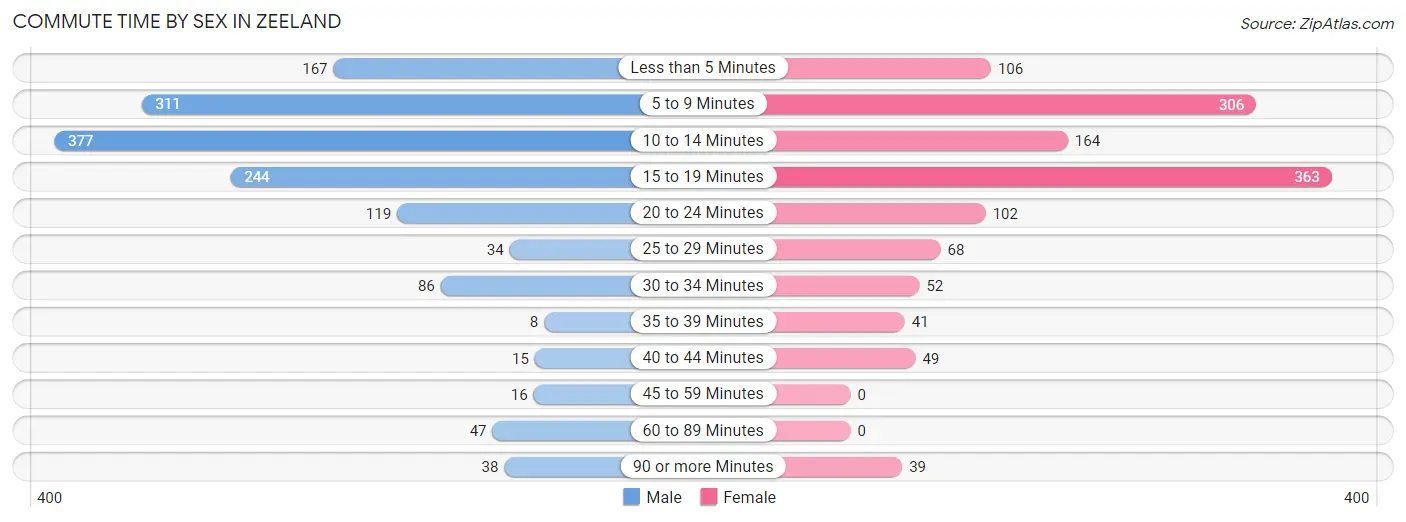
| Commute Time | Male | Female |
| Less than 5 Minutes | 167 (11.4%) | 106 (8.2%) |
| 5 to 9 Minutes | 311 (21.3%) | 306 (23.7%) |
| 10 to 14 Minutes | 377 (25.8%) | 164 (12.7%) |
| 15 to 19 Minutes | 244 (16.7%) | 363 (28.1%) |
| 20 to 24 Minutes | 119 (8.1%) | 102 (7.9%) |
| 25 to 29 Minutes | 34 (2.3%) | 68 (5.3%) |
| 30 to 34 Minutes | 86 (5.9%) | 52 (4.0%) |
| 35 to 39 Minutes | 8 (0.5%) | 41 (3.2%) |
| 40 to 44 Minutes | 15 (1.0%) | 49 (3.8%) |
| 45 to 59 Minutes | 16 (1.1%) | 0 (0.0%) |
| 60 to 89 Minutes | 47 (3.2%) | 0 (0.0%) |
| 90 or more Minutes | 38 (2.6%) | 39 (3.0%) |
Time of Departure to Work by Sex in Zeeland
The most frequent times of departure to work in Zeeland are 6:30 AM to 6:59 AM (333, 22.8%) for males and 7:30 AM to 7:59 AM (166, 12.9%) for females.
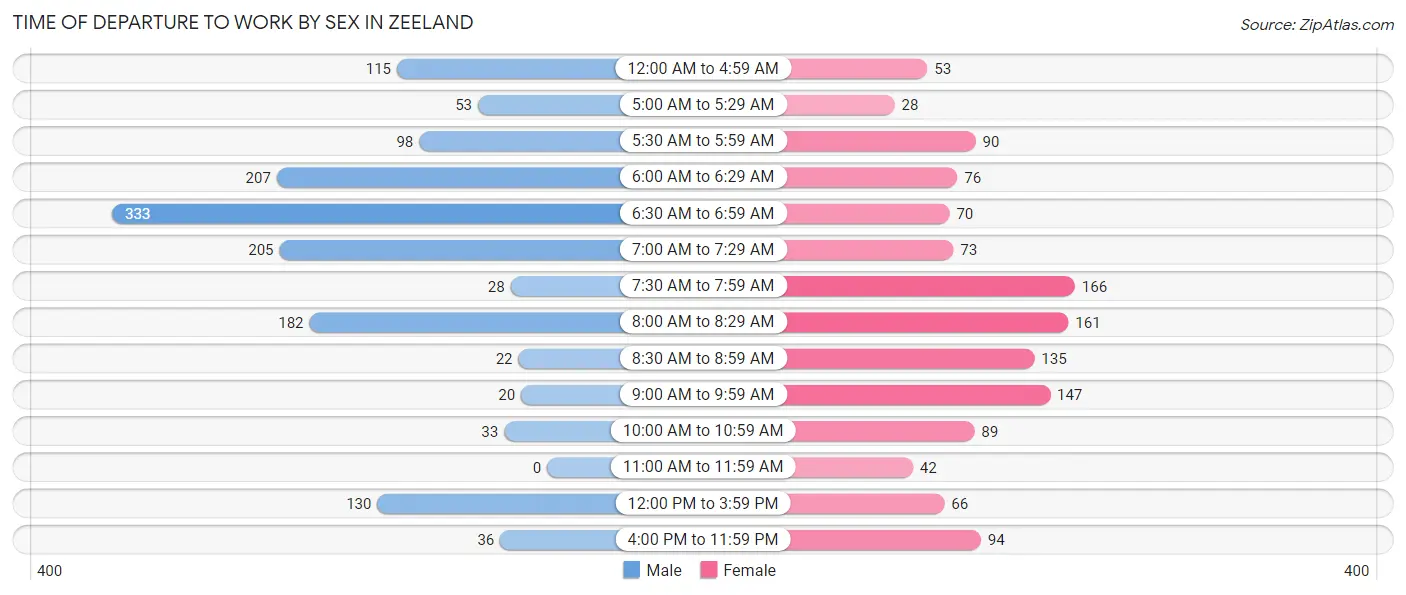
| Time of Departure | Male | Female |
| 12:00 AM to 4:59 AM | 115 (7.9%) | 53 (4.1%) |
| 5:00 AM to 5:29 AM | 53 (3.6%) | 28 (2.2%) |
| 5:30 AM to 5:59 AM | 98 (6.7%) | 90 (7.0%) |
| 6:00 AM to 6:29 AM | 207 (14.2%) | 76 (5.9%) |
| 6:30 AM to 6:59 AM | 333 (22.8%) | 70 (5.4%) |
| 7:00 AM to 7:29 AM | 205 (14.0%) | 73 (5.7%) |
| 7:30 AM to 7:59 AM | 28 (1.9%) | 166 (12.9%) |
| 8:00 AM to 8:29 AM | 182 (12.4%) | 161 (12.5%) |
| 8:30 AM to 8:59 AM | 22 (1.5%) | 135 (10.5%) |
| 9:00 AM to 9:59 AM | 20 (1.4%) | 147 (11.4%) |
| 10:00 AM to 10:59 AM | 33 (2.3%) | 89 (6.9%) |
| 11:00 AM to 11:59 AM | 0 (0.0%) | 42 (3.3%) |
| 12:00 PM to 3:59 PM | 130 (8.9%) | 66 (5.1%) |
| 4:00 PM to 11:59 PM | 36 (2.5%) | 94 (7.3%) |
| Total | 1,462 (100.0%) | 1,290 (100.0%) |
Housing Occupancy in Zeeland
Occupancy by Ownership in Zeeland
Of the total 2,543 dwellings in Zeeland, owner-occupied units account for 1,640 (64.5%), while renter-occupied units make up 903 (35.5%).
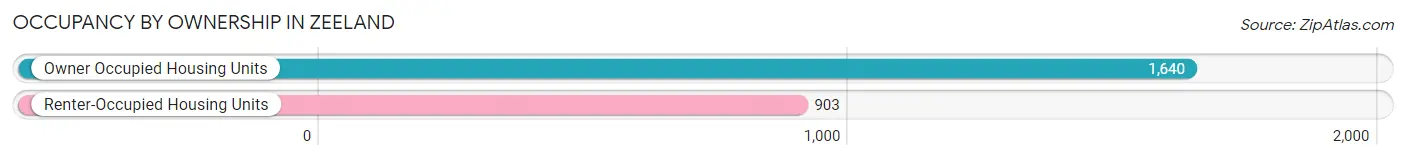
| Occupancy | # Housing Units | % Housing Units |
| Owner Occupied Housing Units | 1,640 | 64.5% |
| Renter-Occupied Housing Units | 903 | 35.5% |
| Total Occupied Housing Units | 2,543 | 100.0% |
Occupancy by Household Size in Zeeland
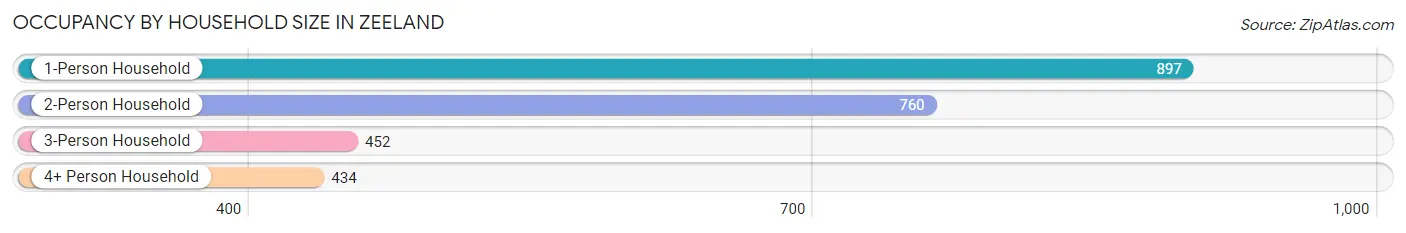
| Household Size | # Housing Units | % Housing Units |
| 1-Person Household | 897 | 35.3% |
| 2-Person Household | 760 | 29.9% |
| 3-Person Household | 452 | 17.8% |
| 4+ Person Household | 434 | 17.1% |
| Total Housing Units | 2,543 | 100.0% |
Occupancy by Ownership by Household Size in Zeeland
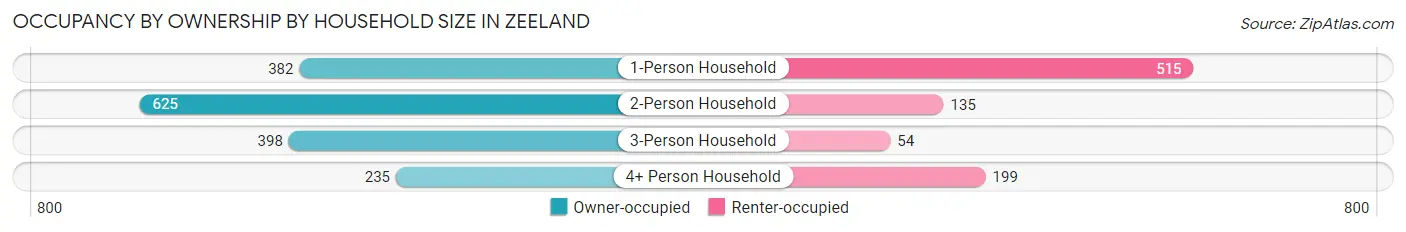
| Household Size | Owner-occupied | Renter-occupied |
| 1-Person Household | 382 (42.6%) | 515 (57.4%) |
| 2-Person Household | 625 (82.2%) | 135 (17.8%) |
| 3-Person Household | 398 (88.0%) | 54 (11.9%) |
| 4+ Person Household | 235 (54.1%) | 199 (45.9%) |
| Total Housing Units | 1,640 (64.5%) | 903 (35.5%) |
Occupancy by Educational Attainment in Zeeland
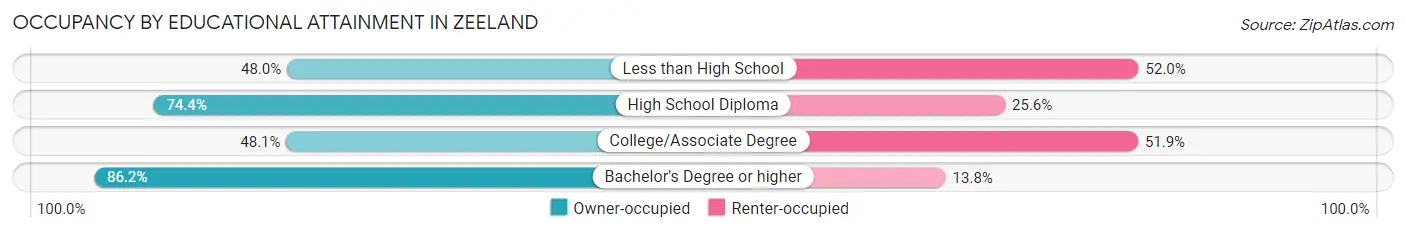
| Household Size | Owner-occupied | Renter-occupied |
| Less than High School | 59 (48.0%) | 64 (52.0%) |
| High School Diploma | 600 (74.4%) | 206 (25.6%) |
| College/Associate Degree | 518 (48.1%) | 559 (51.9%) |
| Bachelor's Degree or higher | 463 (86.2%) | 74 (13.8%) |
Occupancy by Age of Householder in Zeeland
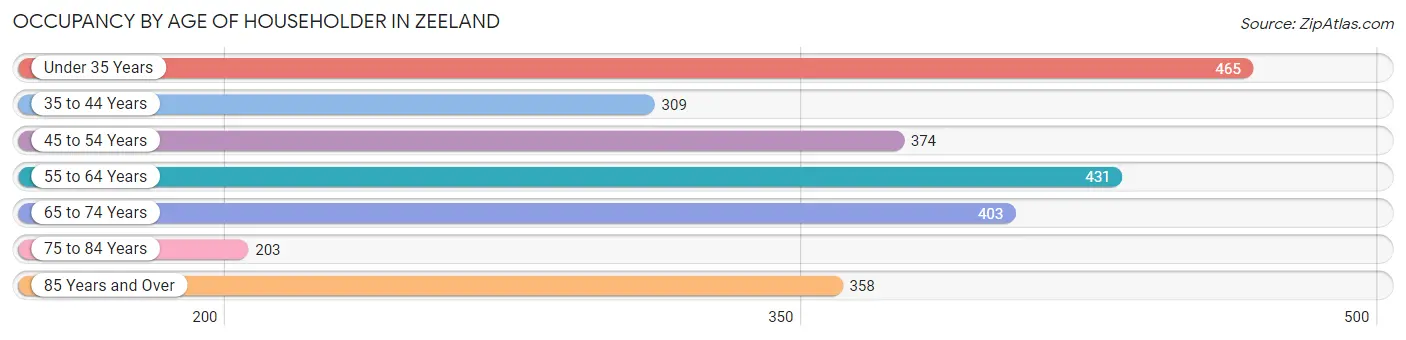
| Age Bracket | # Households | % Households |
| Under 35 Years | 465 | 18.3% |
| 35 to 44 Years | 309 | 12.1% |
| 45 to 54 Years | 374 | 14.7% |
| 55 to 64 Years | 431 | 17.0% |
| 65 to 74 Years | 403 | 15.9% |
| 75 to 84 Years | 203 | 8.0% |
| 85 Years and Over | 358 | 14.1% |
| Total | 2,543 | 100.0% |
Housing Finances in Zeeland
Median Income by Occupancy in Zeeland
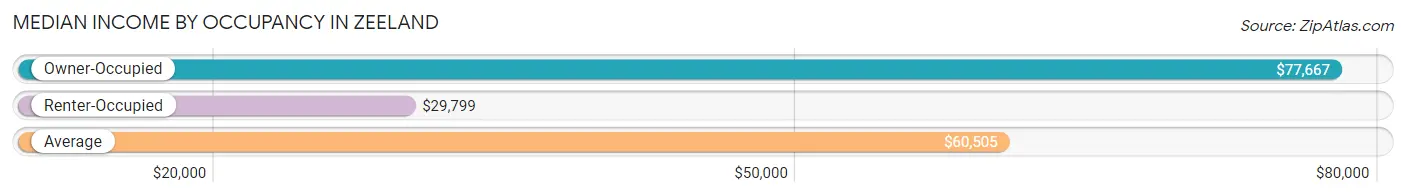
| Occupancy Type | # Households | Median Income |
| Owner-Occupied | 1,640 (64.5%) | $77,667 |
| Renter-Occupied | 903 (35.5%) | $29,799 |
| Average | 2,543 (100.0%) | $60,505 |
Occupancy by Householder Income Bracket in Zeeland
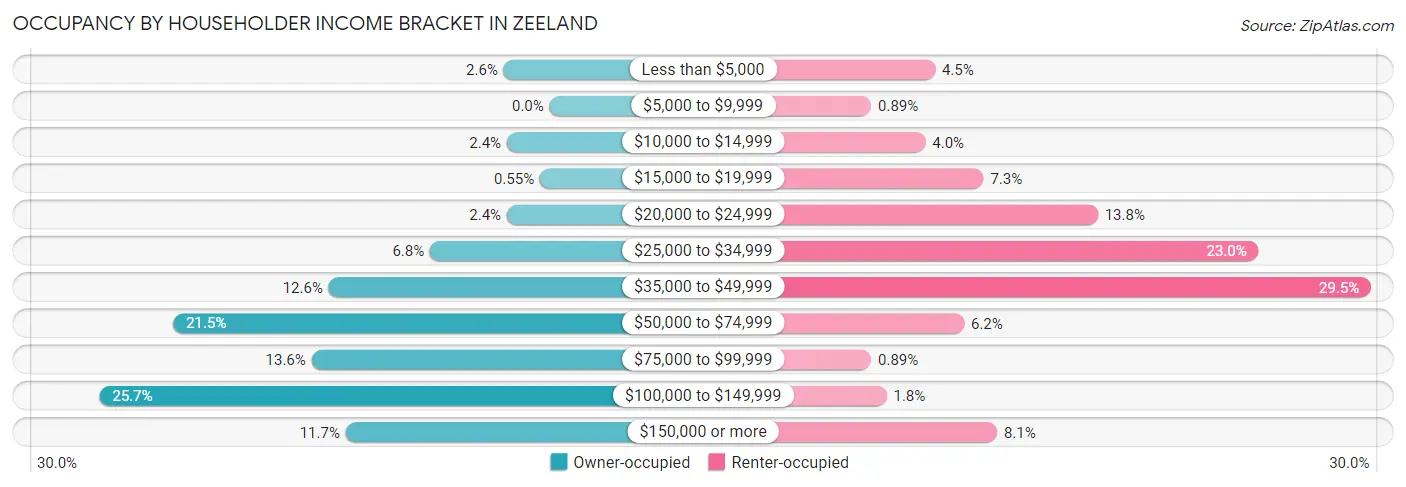
| Income Bracket | Owner-occupied | Renter-occupied |
| Less than $5,000 | 43 (2.6%) | 41 (4.5%) |
| $5,000 to $9,999 | 0 (0.0%) | 8 (0.9%) |
| $10,000 to $14,999 | 40 (2.4%) | 36 (4.0%) |
| $15,000 to $19,999 | 9 (0.5%) | 66 (7.3%) |
| $20,000 to $24,999 | 40 (2.4%) | 125 (13.8%) |
| $25,000 to $34,999 | 112 (6.8%) | 208 (23.0%) |
| $35,000 to $49,999 | 207 (12.6%) | 266 (29.5%) |
| $50,000 to $74,999 | 353 (21.5%) | 56 (6.2%) |
| $75,000 to $99,999 | 223 (13.6%) | 8 (0.9%) |
| $100,000 to $149,999 | 422 (25.7%) | 16 (1.8%) |
| $150,000 or more | 191 (11.7%) | 73 (8.1%) |
| Total | 1,640 (100.0%) | 903 (100.0%) |
Monthly Housing Cost Tiers in Zeeland
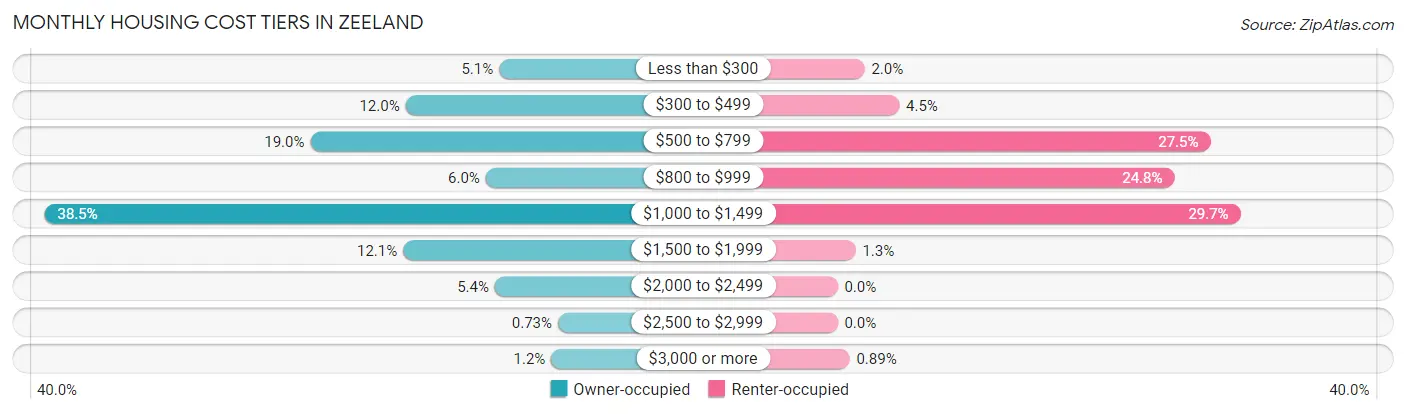
| Monthly Cost | Owner-occupied | Renter-occupied |
| Less than $300 | 83 (5.1%) | 18 (2.0%) |
| $300 to $499 | 196 (11.9%) | 41 (4.5%) |
| $500 to $799 | 311 (19.0%) | 248 (27.5%) |
| $800 to $999 | 99 (6.0%) | 224 (24.8%) |
| $1,000 to $1,499 | 632 (38.5%) | 268 (29.7%) |
| $1,500 to $1,999 | 199 (12.1%) | 12 (1.3%) |
| $2,000 to $2,499 | 88 (5.4%) | 0 (0.0%) |
| $2,500 to $2,999 | 12 (0.7%) | 0 (0.0%) |
| $3,000 or more | 20 (1.2%) | 8 (0.9%) |
| Total | 1,640 (100.0%) | 903 (100.0%) |
Physical Housing Characteristics in Zeeland
Housing Structures in Zeeland
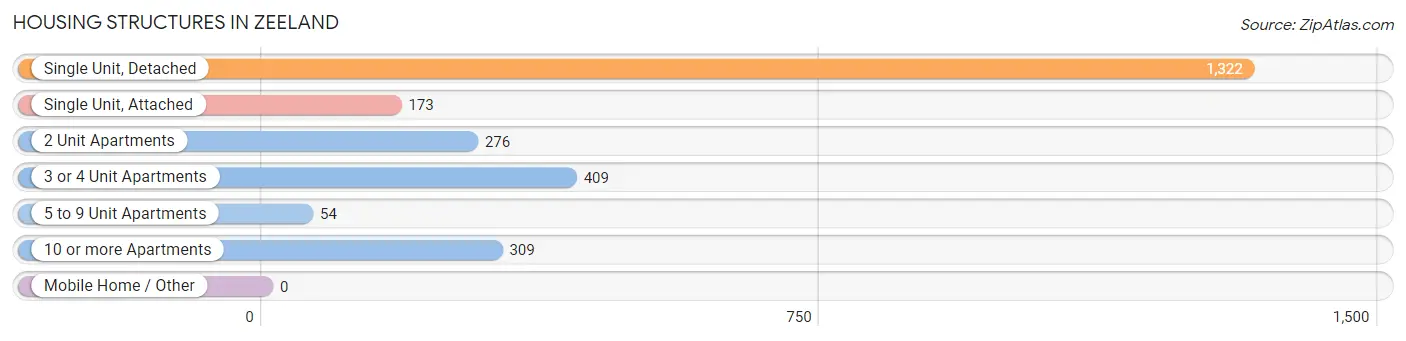
| Structure Type | # Housing Units | % Housing Units |
| Single Unit, Detached | 1,322 | 52.0% |
| Single Unit, Attached | 173 | 6.8% |
| 2 Unit Apartments | 276 | 10.8% |
| 3 or 4 Unit Apartments | 409 | 16.1% |
| 5 to 9 Unit Apartments | 54 | 2.1% |
| 10 or more Apartments | 309 | 12.1% |
| Mobile Home / Other | 0 | 0.0% |
| Total | 2,543 | 100.0% |
Housing Structures by Occupancy in Zeeland
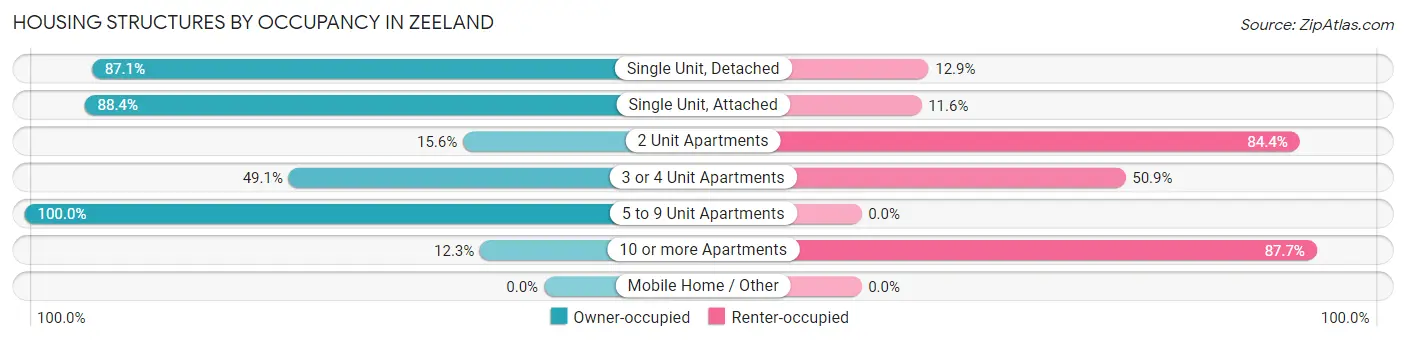
| Structure Type | Owner-occupied | Renter-occupied |
| Single Unit, Detached | 1,151 (87.1%) | 171 (12.9%) |
| Single Unit, Attached | 153 (88.4%) | 20 (11.6%) |
| 2 Unit Apartments | 43 (15.6%) | 233 (84.4%) |
| 3 or 4 Unit Apartments | 201 (49.1%) | 208 (50.9%) |
| 5 to 9 Unit Apartments | 54 (100.0%) | 0 (0.0%) |
| 10 or more Apartments | 38 (12.3%) | 271 (87.7%) |
| Mobile Home / Other | 0 (0.0%) | 0 (0.0%) |
| Total | 1,640 (64.5%) | 903 (35.5%) |
Housing Structures by Number of Rooms in Zeeland
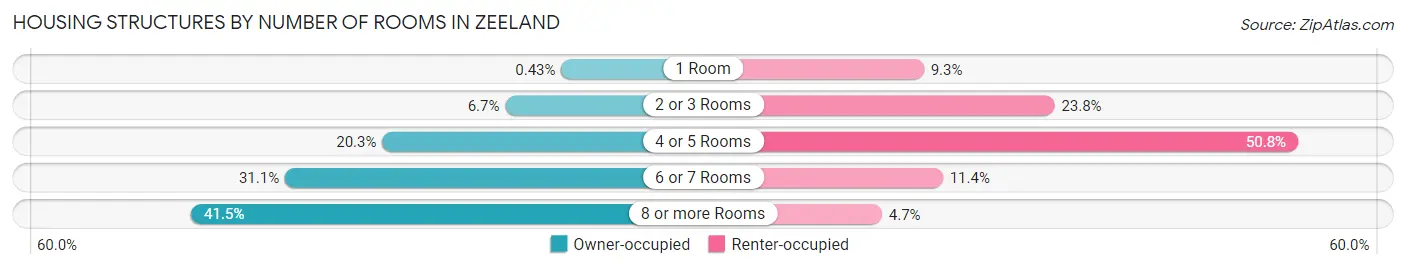
| Number of Rooms | Owner-occupied | Renter-occupied |
| 1 Room | 7 (0.4%) | 84 (9.3%) |
| 2 or 3 Rooms | 109 (6.7%) | 215 (23.8%) |
| 4 or 5 Rooms | 333 (20.3%) | 459 (50.8%) |
| 6 or 7 Rooms | 510 (31.1%) | 103 (11.4%) |
| 8 or more Rooms | 681 (41.5%) | 42 (4.6%) |
| Total | 1,640 (100.0%) | 903 (100.0%) |
Housing Structure by Heating Type in Zeeland
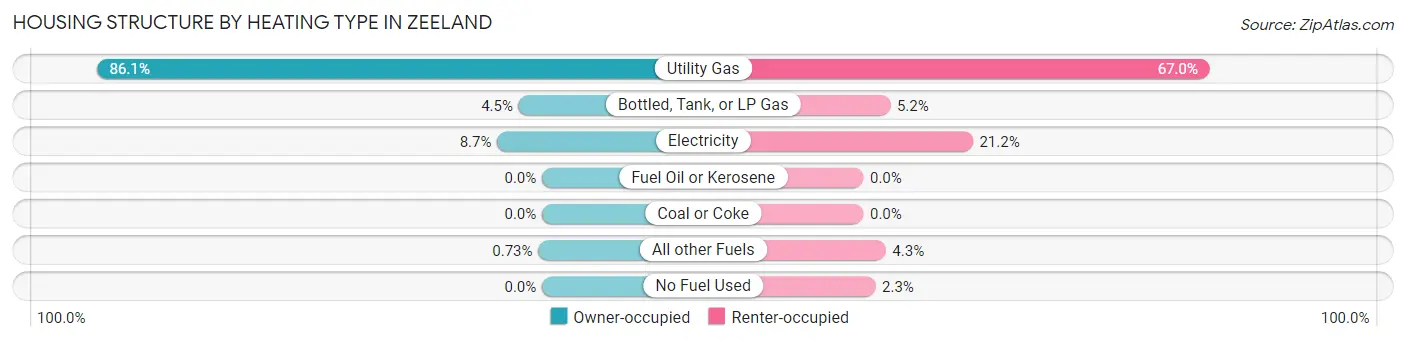
| Heating Type | Owner-occupied | Renter-occupied |
| Utility Gas | 1,412 (86.1%) | 605 (67.0%) |
| Bottled, Tank, or LP Gas | 74 (4.5%) | 47 (5.2%) |
| Electricity | 142 (8.7%) | 191 (21.1%) |
| Fuel Oil or Kerosene | 0 (0.0%) | 0 (0.0%) |
| Coal or Coke | 0 (0.0%) | 0 (0.0%) |
| All other Fuels | 12 (0.7%) | 39 (4.3%) |
| No Fuel Used | 0 (0.0%) | 21 (2.3%) |
| Total | 1,640 (100.0%) | 903 (100.0%) |
Household Vehicle Usage in Zeeland
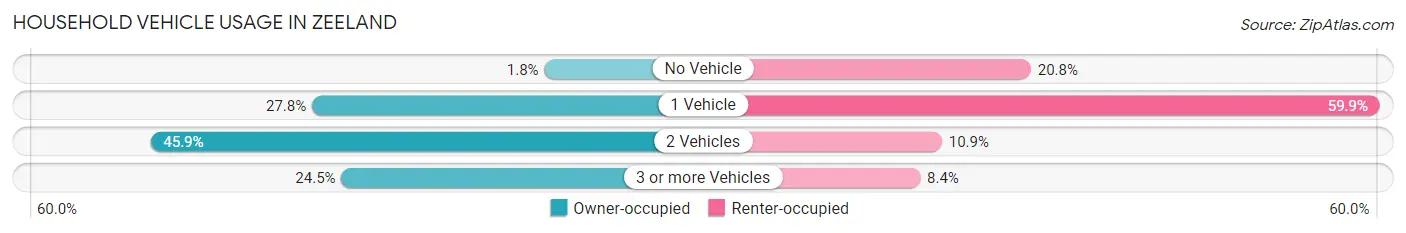
| Vehicles per Household | Owner-occupied | Renter-occupied |
| No Vehicle | 29 (1.8%) | 188 (20.8%) |
| 1 Vehicle | 456 (27.8%) | 541 (59.9%) |
| 2 Vehicles | 753 (45.9%) | 98 (10.8%) |
| 3 or more Vehicles | 402 (24.5%) | 76 (8.4%) |
| Total | 1,640 (100.0%) | 903 (100.0%) |
Real Estate & Mortgages in Zeeland
Real Estate and Mortgage Overview in Zeeland
| Characteristic | Without Mortgage | With Mortgage |
| Housing Units | 565 | 1,075 |
| Median Property Value | $225,200 | $230,500 |
| Median Household Income | $51,490 | $134 |
| Monthly Housing Costs | $503 | $20 |
| Real Estate Taxes | $2,521 | $74 |
Property Value by Mortgage Status in Zeeland
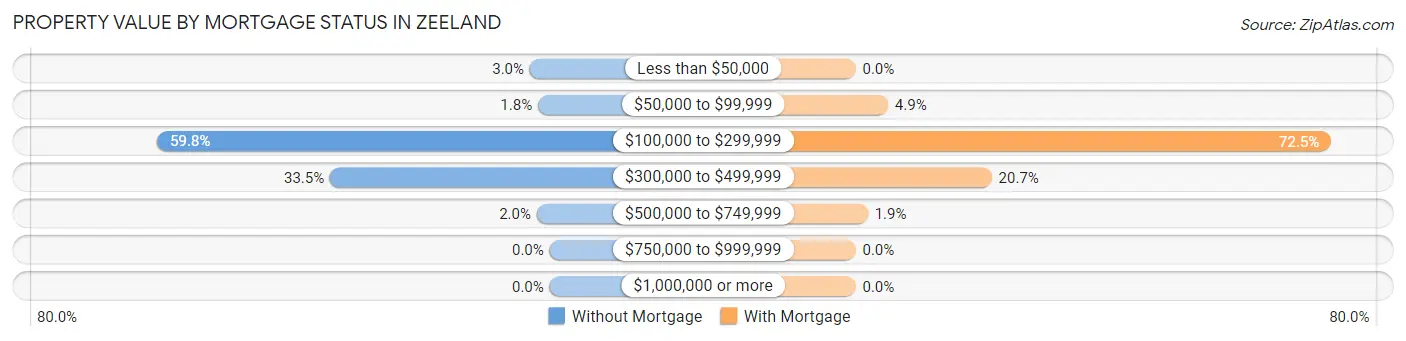
| Property Value | Without Mortgage | With Mortgage |
| Less than $50,000 | 17 (3.0%) | 0 (0.0%) |
| $50,000 to $99,999 | 10 (1.8%) | 53 (4.9%) |
| $100,000 to $299,999 | 338 (59.8%) | 779 (72.5%) |
| $300,000 to $499,999 | 189 (33.5%) | 223 (20.7%) |
| $500,000 to $749,999 | 11 (1.9%) | 20 (1.9%) |
| $750,000 to $999,999 | 0 (0.0%) | 0 (0.0%) |
| $1,000,000 or more | 0 (0.0%) | 0 (0.0%) |
| Total | 565 (100.0%) | 1,075 (100.0%) |
Household Income by Mortgage Status in Zeeland
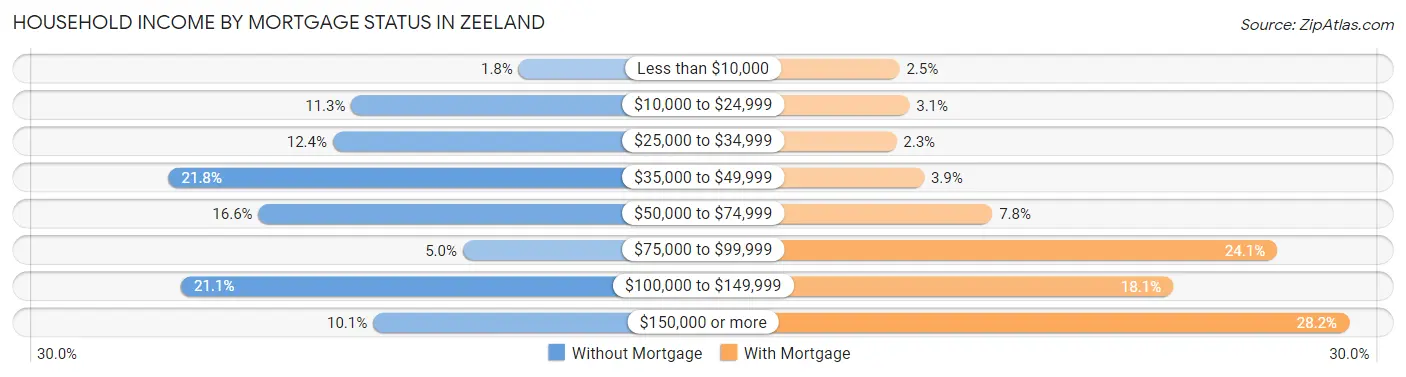
| Household Income | Without Mortgage | With Mortgage |
| Less than $10,000 | 10 (1.8%) | 27 (2.5%) |
| $10,000 to $24,999 | 64 (11.3%) | 33 (3.1%) |
| $25,000 to $34,999 | 70 (12.4%) | 25 (2.3%) |
| $35,000 to $49,999 | 123 (21.8%) | 42 (3.9%) |
| $50,000 to $74,999 | 94 (16.6%) | 84 (7.8%) |
| $75,000 to $99,999 | 28 (5.0%) | 259 (24.1%) |
| $100,000 to $149,999 | 119 (21.1%) | 195 (18.1%) |
| $150,000 or more | 57 (10.1%) | 303 (28.2%) |
| Total | 565 (100.0%) | 1,075 (100.0%) |
Property Value to Household Income Ratio in Zeeland
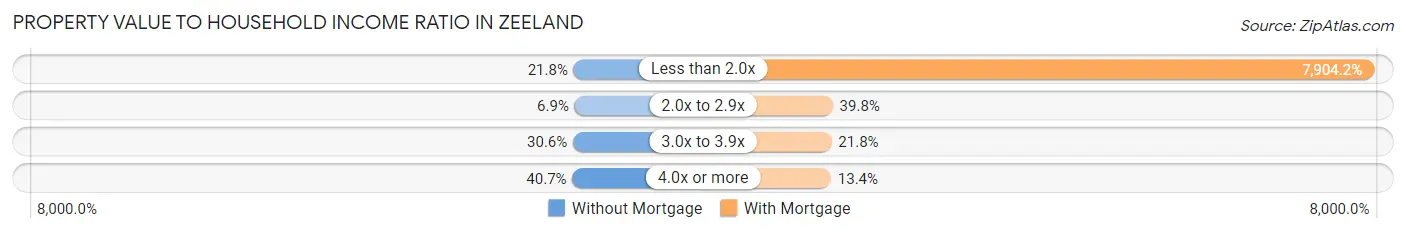
| Value-to-Income Ratio | Without Mortgage | With Mortgage |
| Less than 2.0x | 123 (21.8%) | 84,970 (7,904.2%) |
| 2.0x to 2.9x | 39 (6.9%) | 428 (39.8%) |
| 3.0x to 3.9x | 173 (30.6%) | 234 (21.8%) |
| 4.0x or more | 230 (40.7%) | 144 (13.4%) |
| Total | 565 (100.0%) | 1,075 (100.0%) |
Real Estate Taxes by Mortgage Status in Zeeland
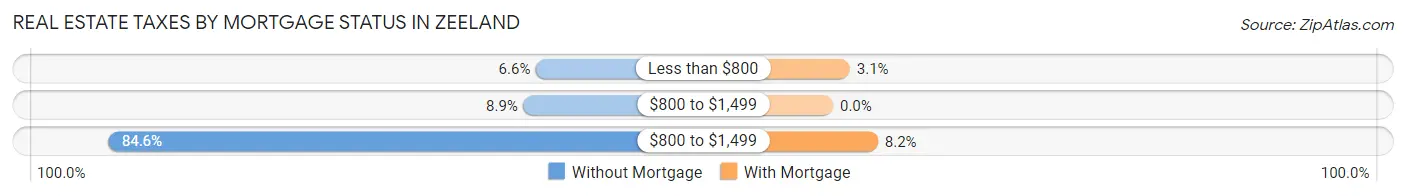
| Property Taxes | Without Mortgage | With Mortgage |
| Less than $800 | 37 (6.6%) | 33 (3.1%) |
| $800 to $1,499 | 50 (8.8%) | 0 (0.0%) |
| $800 to $1,499 | 478 (84.6%) | 88 (8.2%) |
| Total | 565 (100.0%) | 1,075 (100.0%) |
Health & Disability in Zeeland
Health Insurance Coverage by Age in Zeeland
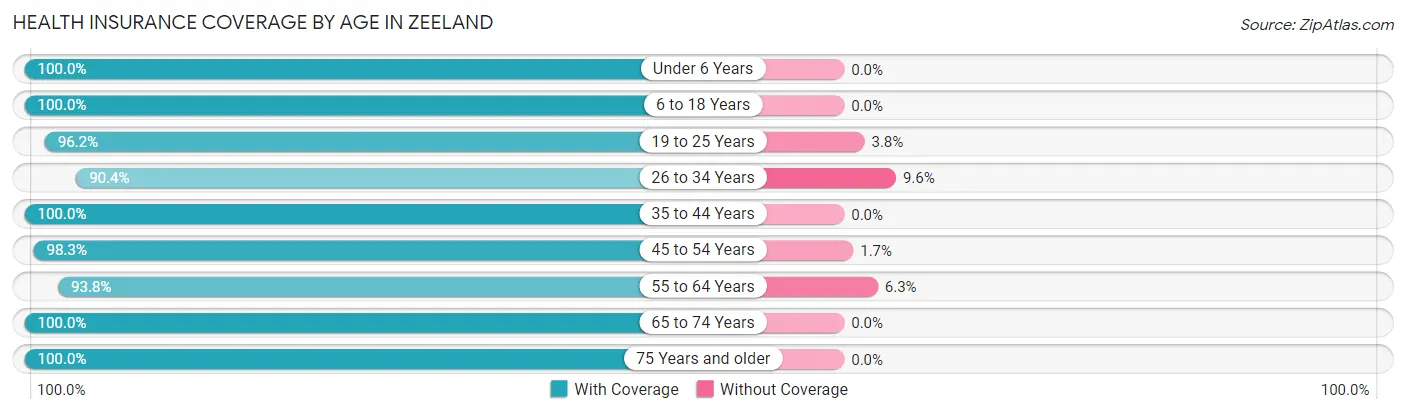
| Age Bracket | With Coverage | Without Coverage |
| Under 6 Years | 473 (100.0%) | 0 (0.0%) |
| 6 to 18 Years | 848 (100.0%) | 0 (0.0%) |
| 19 to 25 Years | 535 (96.2%) | 21 (3.8%) |
| 26 to 34 Years | 553 (90.4%) | 59 (9.6%) |
| 35 to 44 Years | 470 (100.0%) | 0 (0.0%) |
| 45 to 54 Years | 642 (98.3%) | 11 (1.7%) |
| 55 to 64 Years | 615 (93.8%) | 41 (6.2%) |
| 65 to 74 Years | 546 (100.0%) | 0 (0.0%) |
| 75 Years and older | 720 (100.0%) | 0 (0.0%) |
| Total | 5,402 (97.6%) | 132 (2.4%) |
Health Insurance Coverage by Citizenship Status in Zeeland
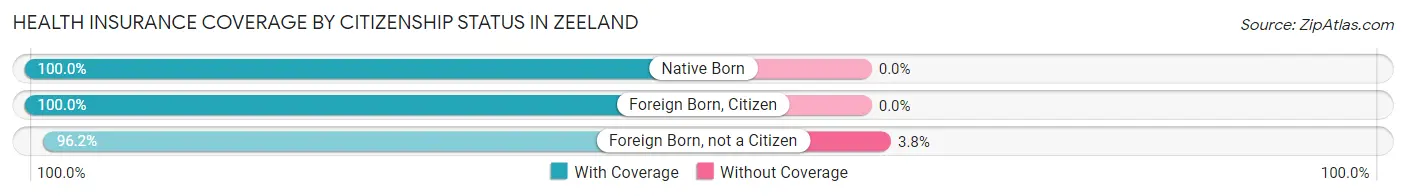
| Citizenship Status | With Coverage | Without Coverage |
| Native Born | 473 (100.0%) | 0 (0.0%) |
| Foreign Born, Citizen | 848 (100.0%) | 0 (0.0%) |
| Foreign Born, not a Citizen | 535 (96.2%) | 21 (3.8%) |
Health Insurance Coverage by Household Income in Zeeland
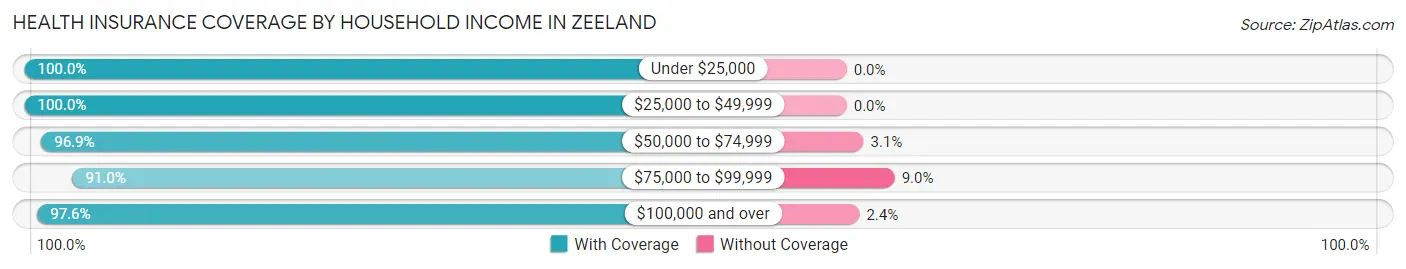
| Household Income | With Coverage | Without Coverage |
| Under $25,000 | 673 (100.0%) | 0 (0.0%) |
| $25,000 to $49,999 | 1,336 (100.0%) | 0 (0.0%) |
| $50,000 to $74,999 | 740 (96.9%) | 24 (3.1%) |
| $75,000 to $99,999 | 588 (91.0%) | 58 (9.0%) |
| $100,000 and over | 2,050 (97.6%) | 50 (2.4%) |
Public vs Private Health Insurance Coverage by Age in Zeeland
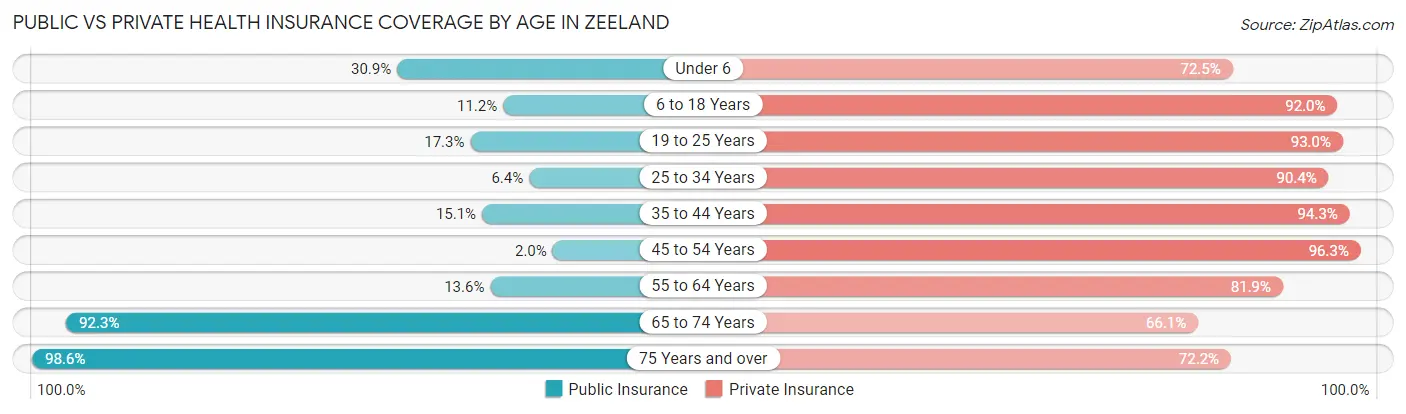
| Age Bracket | Public Insurance | Private Insurance |
| Under 6 | 146 (30.9%) | 343 (72.5%) |
| 6 to 18 Years | 95 (11.2%) | 780 (92.0%) |
| 19 to 25 Years | 96 (17.3%) | 517 (93.0%) |
| 25 to 34 Years | 39 (6.4%) | 553 (90.4%) |
| 35 to 44 Years | 71 (15.1%) | 443 (94.3%) |
| 45 to 54 Years | 13 (2.0%) | 629 (96.3%) |
| 55 to 64 Years | 89 (13.6%) | 537 (81.9%) |
| 65 to 74 Years | 504 (92.3%) | 361 (66.1%) |
| 75 Years and over | 710 (98.6%) | 520 (72.2%) |
| Total | 1,763 (31.9%) | 4,683 (84.6%) |
Disability Status by Sex by Age in Zeeland
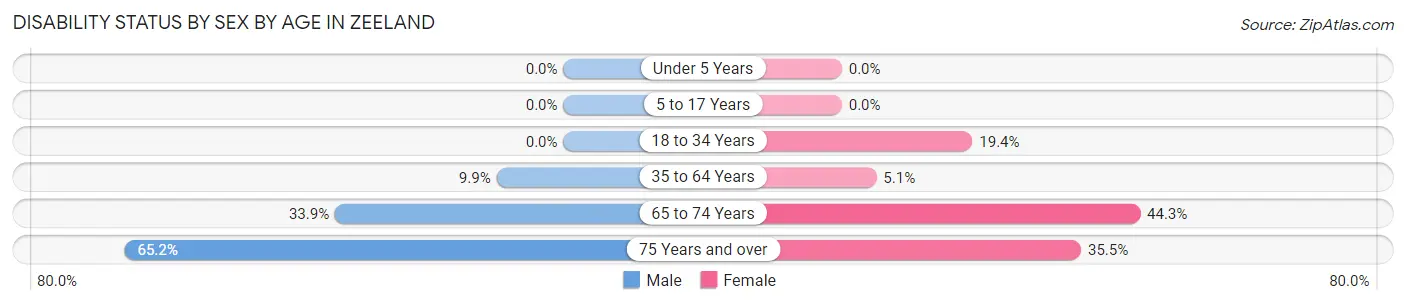
| Age Bracket | Male | Female |
| Under 5 Years | 0 (0.0%) | 0 (0.0%) |
| 5 to 17 Years | 0 (0.0%) | 0 (0.0%) |
| 18 to 34 Years | 0 (0.0%) | 133 (19.4%) |
| 35 to 64 Years | 80 (9.9%) | 50 (5.1%) |
| 65 to 74 Years | 78 (33.9%) | 140 (44.3%) |
| 75 Years and over | 172 (65.1%) | 162 (35.5%) |
Disability Class by Sex by Age in Zeeland
Disability Class: Hearing Difficulty
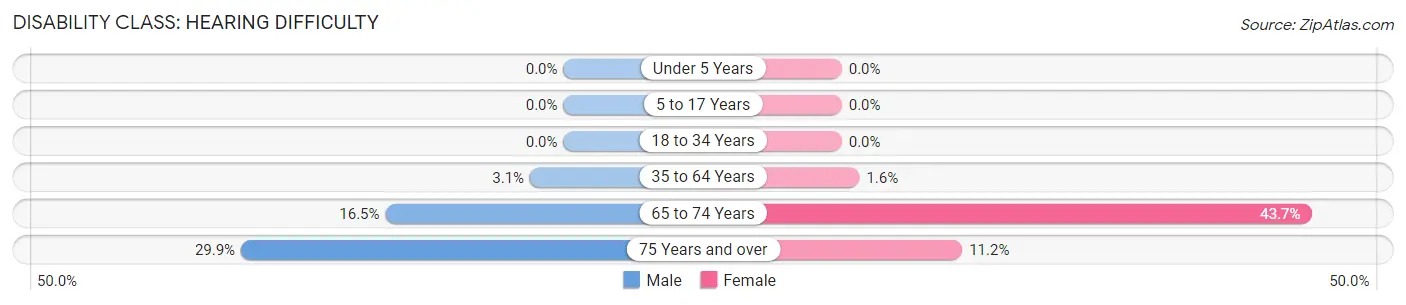
| Age Bracket | Male | Female |
| Under 5 Years | 0 (0.0%) | 0 (0.0%) |
| 5 to 17 Years | 0 (0.0%) | 0 (0.0%) |
| 18 to 34 Years | 0 (0.0%) | 0 (0.0%) |
| 35 to 64 Years | 25 (3.1%) | 16 (1.6%) |
| 65 to 74 Years | 38 (16.5%) | 138 (43.7%) |
| 75 Years and over | 79 (29.9%) | 51 (11.2%) |
Disability Class: Vision Difficulty
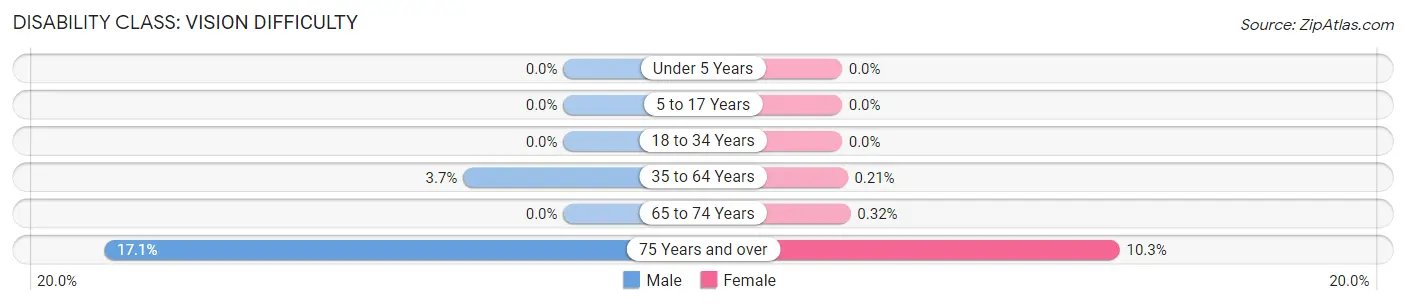
| Age Bracket | Male | Female |
| Under 5 Years | 0 (0.0%) | 0 (0.0%) |
| 5 to 17 Years | 0 (0.0%) | 0 (0.0%) |
| 18 to 34 Years | 0 (0.0%) | 0 (0.0%) |
| 35 to 64 Years | 30 (3.7%) | 2 (0.2%) |
| 65 to 74 Years | 0 (0.0%) | 1 (0.3%) |
| 75 Years and over | 45 (17.1%) | 47 (10.3%) |
Disability Class: Cognitive Difficulty
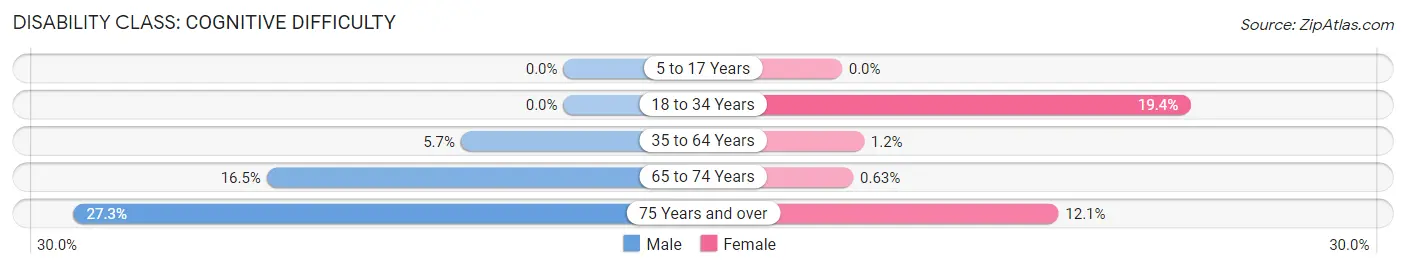
| Age Bracket | Male | Female |
| 5 to 17 Years | 0 (0.0%) | 0 (0.0%) |
| 18 to 34 Years | 0 (0.0%) | 133 (19.4%) |
| 35 to 64 Years | 46 (5.7%) | 12 (1.2%) |
| 65 to 74 Years | 38 (16.5%) | 2 (0.6%) |
| 75 Years and over | 72 (27.3%) | 55 (12.1%) |
Disability Class: Ambulatory Difficulty
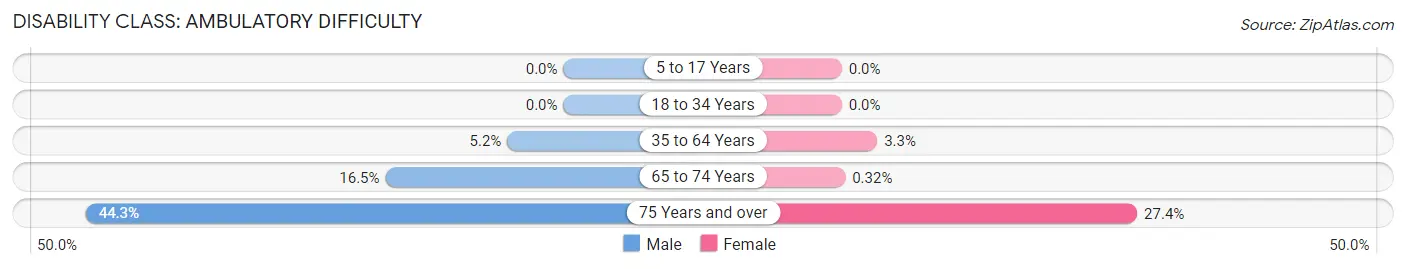
| Age Bracket | Male | Female |
| 5 to 17 Years | 0 (0.0%) | 0 (0.0%) |
| 18 to 34 Years | 0 (0.0%) | 0 (0.0%) |
| 35 to 64 Years | 42 (5.2%) | 32 (3.3%) |
| 65 to 74 Years | 38 (16.5%) | 1 (0.3%) |
| 75 Years and over | 117 (44.3%) | 125 (27.4%) |
Disability Class: Self-Care Difficulty
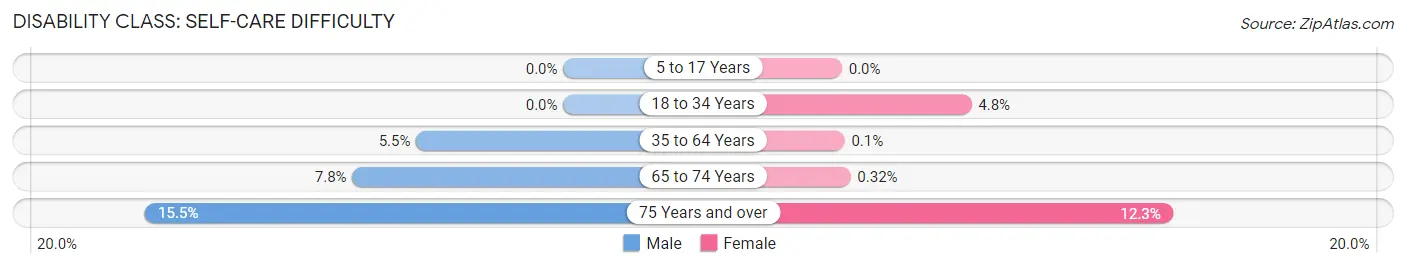
| Age Bracket | Male | Female |
| 5 to 17 Years | 0 (0.0%) | 0 (0.0%) |
| 18 to 34 Years | 0 (0.0%) | 33 (4.8%) |
| 35 to 64 Years | 44 (5.5%) | 1 (0.1%) |
| 65 to 74 Years | 18 (7.8%) | 1 (0.3%) |
| 75 Years and over | 41 (15.5%) | 56 (12.3%) |
Technology Access in Zeeland
Computing Device Access in Zeeland
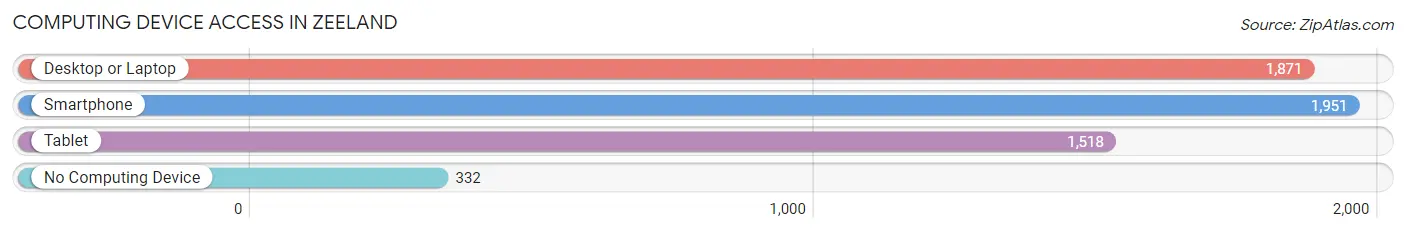
| Device Type | # Households | % Households |
| Desktop or Laptop | 1,871 | 73.6% |
| Smartphone | 1,951 | 76.7% |
| Tablet | 1,518 | 59.7% |
| No Computing Device | 332 | 13.1% |
| Total | 2,543 | 100.0% |
Internet Access in Zeeland
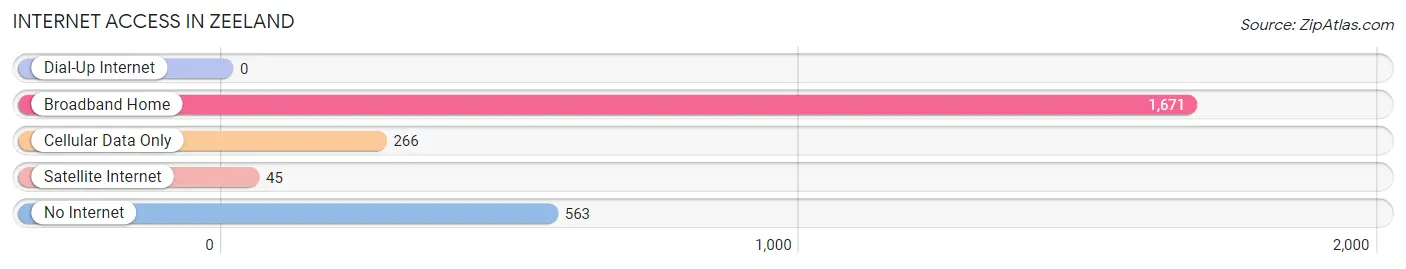
| Internet Type | # Households | % Households |
| Dial-Up Internet | 0 | 0.0% |
| Broadband Home | 1,671 | 65.7% |
| Cellular Data Only | 266 | 10.5% |
| Satellite Internet | 45 | 1.8% |
| No Internet | 563 | 22.1% |
| Total | 2,543 | 100.0% |
Zeeland Summary
Zeeland, Michigan is a small city located in Ottawa County, in the western part of the state. It is situated on the eastern shore of Lake Michigan, about 25 miles north of Grand Rapids. The city has a population of 5,500 people, and is part of the larger Grand Rapids metropolitan area.
History
The area that is now Zeeland was first settled in 1847 by Dutch immigrants, who named the area after their homeland of Zeeland in the Netherlands. The city was officially incorporated in 1867, and was initially a farming community. In the late 19th century, the city began to industrialize, and by the early 20th century, it had become a major center for the production of furniture and other wood products.
In the 1950s, the city began to diversify its economy, and today it is home to a variety of industries, including manufacturing, healthcare, and retail. The city is also home to a number of educational institutions, including Hope College, Davenport University, and Western Michigan University.
Geography
Zeeland is located in the western part of Michigan, on the eastern shore of Lake Michigan. The city is situated on the banks of the Macatawa River, and is surrounded by a number of small lakes and ponds. The city is located about 25 miles north of Grand Rapids, and is part of the larger Grand Rapids metropolitan area.
The city has a total area of 4.2 square miles, of which 4.1 square miles is land and 0.1 square miles is water. The city is located in a flat, low-lying area, and is surrounded by farmland and wooded areas.
Economy
Zeeland is home to a variety of industries, including manufacturing, healthcare, and retail. The city is home to a number of large employers, including Herman Miller, Gentex Corporation, and Haworth. The city is also home to a number of educational institutions, including Hope College, Davenport University, and Western Michigan University.
The city has a strong tourism industry, and is home to a number of attractions, including the Dutch Village theme park, the DeZwaan windmill, and the Zeeland Historical Museum. The city is also home to a number of annual festivals and events, including the Tulip Time Festival and the Zeeland Summerfest.
Demographics
As of the 2010 census, the population of Zeeland was 5,500 people. The racial makeup of the city was 94.3% White, 1.3% African American, 0.7% Native American, 1.2% Asian, 0.2% Pacific Islander, 0.9% from other races, and 1.6% from two or more races. Hispanic or Latino of any race were 3.2% of the population.
The median household income in Zeeland was $50,945, and the median family income was $62,917. The per capita income in the city was $25,945. About 8.2% of the population was below the poverty line.
Zeeland is a small city with a rich history and a diverse economy. The city is home to a number of large employers, educational institutions, and attractions, and is a popular destination for tourists. The city has a population of 5,500 people, and is part of the larger Grand Rapids metropolitan area.
Common Questions
What is Per Capita Income in Zeeland?
Per Capita income in Zeeland is $40,841.
What is the Median Family Income in Zeeland?
Median Family Income in Zeeland is $83,161.
What is the Median Household income in Zeeland?
Median Household Income in Zeeland is $60,505.
What is Income or Wage Gap in Zeeland?
Income or Wage Gap in Zeeland is 37.3%.
Women in Zeeland earn 62.7 cents for every dollar earned by a man.
What is Inequality or Gini Index in Zeeland?
Inequality or Gini Index in Zeeland is 0.50.
What is the Total Population of Zeeland?
Total Population of Zeeland is 5,701.
What is the Total Male Population of Zeeland?
Total Male Population of Zeeland is 2,672.
What is the Total Female Population of Zeeland?
Total Female Population of Zeeland is 3,029.
What is the Ratio of Males per 100 Females in Zeeland?
There are 88.21 Males per 100 Females in Zeeland.
What is the Ratio of Females per 100 Males in Zeeland?
There are 113.36 Females per 100 Males in Zeeland.
What is the Median Population Age in Zeeland?
Median Population Age in Zeeland is 42.6 Years.
What is the Average Family Size in Zeeland
Average Family Size in Zeeland is 2.8 People.
What is the Average Household Size in Zeeland
Average Household Size in Zeeland is 2.2 People.
How Large is the Labor Force in Zeeland?
There are 3,007 People in the Labor Forcein in Zeeland.
What is the Percentage of People in the Labor Force in Zeeland?
64.7% of People are in the Labor Force in Zeeland.
What is the Unemployment Rate in Zeeland?
Unemployment Rate in Zeeland is 2.8%.