Pearl Beach, MI Map & Demographics
Pearl Beach Map
Pearl Beach Overview
$40,294
PER CAPITA INCOME
$87,948
AVG FAMILY INCOME
$72,490
AVG HOUSEHOLD INCOME
69.2%
WAGE / INCOME GAP [ % ]
30.8¢/ $1
WAGE / INCOME GAP [ $ ]
$13,313
FAMILY INCOME DEFICIT
0.38
INEQUALITY / GINI INDEX
5,159
TOTAL POPULATION
2,662
MALE POPULATION
2,497
FEMALE POPULATION
106.61
MALES / 100 FEMALES
93.80
FEMALES / 100 MALES
51.2
MEDIAN AGE
2.8
AVG FAMILY SIZE
2.2
AVG HOUSEHOLD SIZE
2,288
LABOR FORCE [ PEOPLE ]
53.8%
PERCENT IN LABOR FORCE
4.3%
UNEMPLOYMENT RATE
Pearl Beach Area Codes
Income in Pearl Beach
Income Overview in Pearl Beach
Per Capita Income in Pearl Beach is $40,294, while median incomes of families and households are $87,948 and $72,490 respectively.
| Characteristic | Number | Measure |
| Per Capita Income | 5,159 | $40,294 |
| Median Family Income | 1,454 | $87,948 |
| Mean Family Income | 1,454 | $104,776 |
| Median Household Income | 2,337 | $72,490 |
| Mean Household Income | 2,337 | $89,900 |
| Income Deficit | 1,454 | $13,313 |
| Wage / Income Gap (%) | 5,159 | 69.21% |
| Wage / Income Gap ($) | 5,159 | 30.79¢ per $1 |
| Gini / Inequality Index | 5,159 | 0.38 |
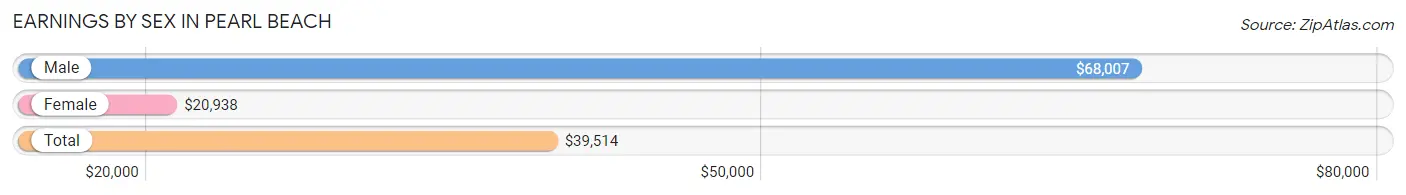
Earnings by Sex in Pearl Beach
Average Earnings in Pearl Beach are $39,514, $68,007 for men and $20,938 for women, a difference of 69.2%.
| Sex | Number | Average Earnings |
| Male | 1,401 (57.2%) | $68,007 |
| Female | 1,048 (42.8%) | $20,938 |
| Total | 2,449 (100.0%) | $39,514 |
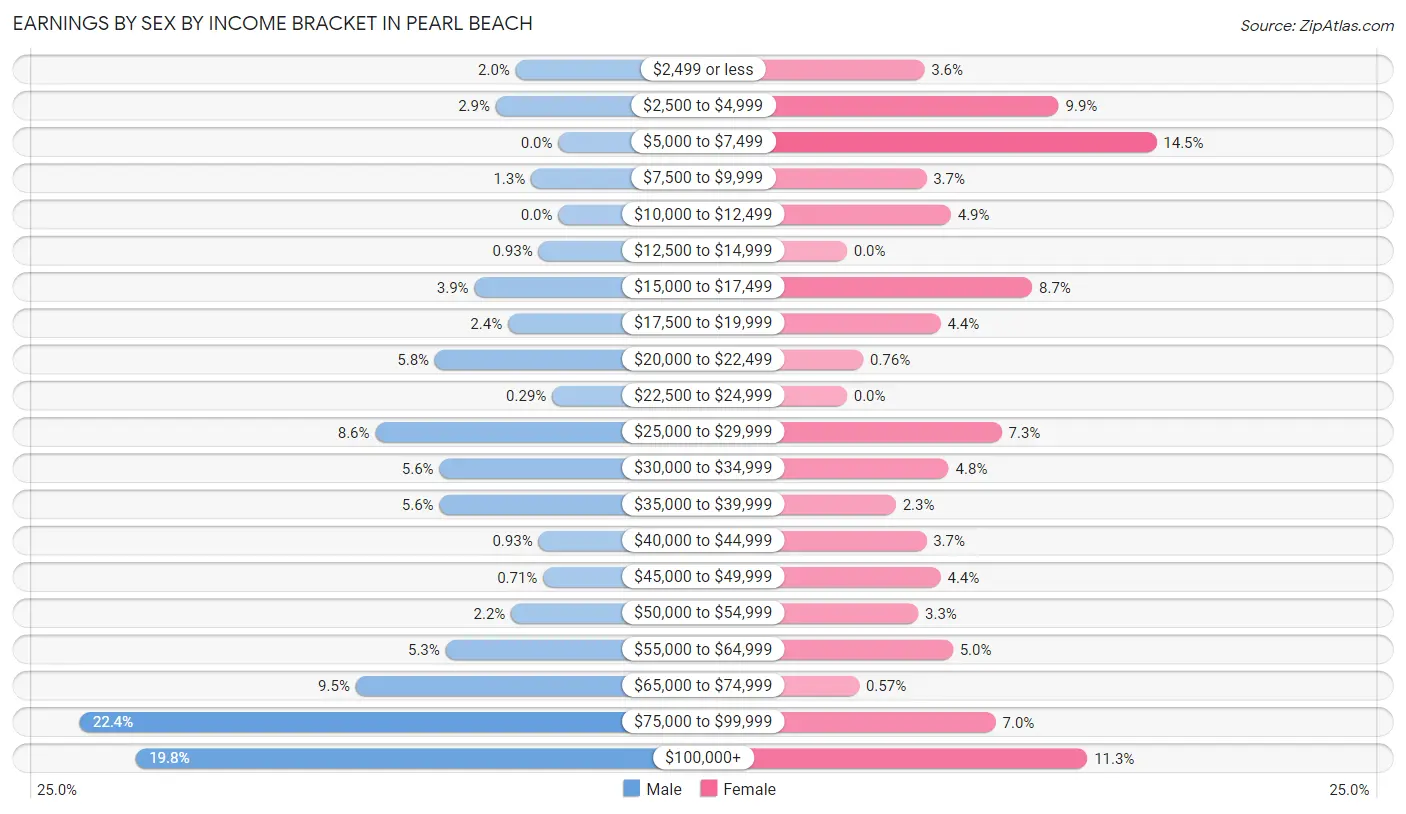
Earnings by Sex by Income Bracket in Pearl Beach
The most common earnings brackets in Pearl Beach are $75,000 to $99,999 for men (314 | 22.4%) and $5,000 to $7,499 for women (152 | 14.5%).
| Income | Male | Female |
| $2,499 or less | 28 (2.0%) | 38 (3.6%) |
| $2,500 to $4,999 | 41 (2.9%) | 104 (9.9%) |
| $5,000 to $7,499 | 0 (0.0%) | 152 (14.5%) |
| $7,500 to $9,999 | 18 (1.3%) | 39 (3.7%) |
| $10,000 to $12,499 | 0 (0.0%) | 51 (4.9%) |
| $12,500 to $14,999 | 13 (0.9%) | 0 (0.0%) |
| $15,000 to $17,499 | 55 (3.9%) | 91 (8.7%) |
| $17,500 to $19,999 | 33 (2.4%) | 46 (4.4%) |
| $20,000 to $22,499 | 81 (5.8%) | 8 (0.8%) |
| $22,500 to $24,999 | 4 (0.3%) | 0 (0.0%) |
| $25,000 to $29,999 | 120 (8.6%) | 76 (7.2%) |
| $30,000 to $34,999 | 78 (5.6%) | 50 (4.8%) |
| $35,000 to $39,999 | 78 (5.6%) | 24 (2.3%) |
| $40,000 to $44,999 | 13 (0.9%) | 39 (3.7%) |
| $45,000 to $49,999 | 10 (0.7%) | 46 (4.4%) |
| $50,000 to $54,999 | 31 (2.2%) | 35 (3.3%) |
| $55,000 to $64,999 | 74 (5.3%) | 52 (5.0%) |
| $65,000 to $74,999 | 133 (9.5%) | 6 (0.6%) |
| $75,000 to $99,999 | 314 (22.4%) | 73 (7.0%) |
| $100,000+ | 277 (19.8%) | 118 (11.3%) |
| Total | 1,401 (100.0%) | 1,048 (100.0%) |
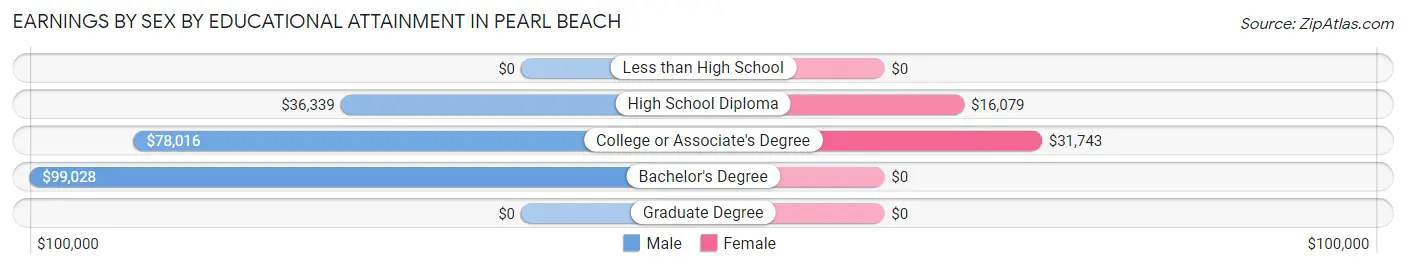
Earnings by Sex by Educational Attainment in Pearl Beach
Average earnings in Pearl Beach are $71,844 for men and $25,179 for women, a difference of 64.9%. Men with an educational attainment of bachelor's degree enjoy the highest average annual earnings of $99,028, while those with high school diploma education earn the least with $36,339. Women with an educational attainment of college or associate's degree earn the most with the average annual earnings of $31,743, while those with high school diploma education have the smallest earnings of $16,079.
| Educational Attainment | Male Income | Female Income |
| Less than High School | - | - |
| High School Diploma | $36,339 | $16,079 |
| College or Associate's Degree | $78,016 | $31,743 |
| Bachelor's Degree | $99,028 | $0 |
| Graduate Degree | - | - |
| Total | $71,844 | $25,179 |
Family Income in Pearl Beach
Family Income Brackets in Pearl Beach
According to the Pearl Beach family income data, there are 340 families falling into the $50,000 to $74,999 income range, which is the most common income bracket and makes up 23.4% of all families. Conversely, the $10,000 to $14,999 income bracket is the least frequent group with only 19 families (1.3%) belonging to this category.
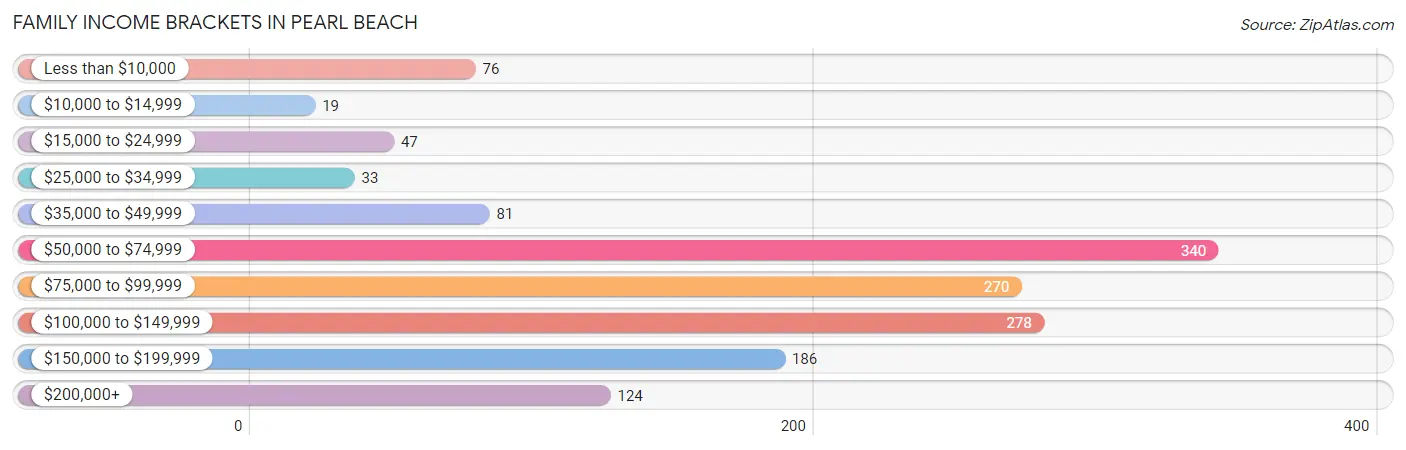
| Income Bracket | # Families | % Families |
| Less than $10,000 | 76 | 5.2% |
| $10,000 to $14,999 | 19 | 1.3% |
| $15,000 to $24,999 | 47 | 3.2% |
| $25,000 to $34,999 | 33 | 2.3% |
| $35,000 to $49,999 | 81 | 5.6% |
| $50,000 to $74,999 | 340 | 23.4% |
| $75,000 to $99,999 | 270 | 18.6% |
| $100,000 to $149,999 | 278 | 19.1% |
| $150,000 to $199,999 | 186 | 12.8% |
| $200,000+ | 124 | 8.5% |
Family Income by Famaliy Size in Pearl Beach
5-person families (67 | 4.6%) account for the highest median family income in Pearl Beach with $132,356 per family, while 2-person families (900 | 61.9%) have the highest median income of $36,016 per family member.
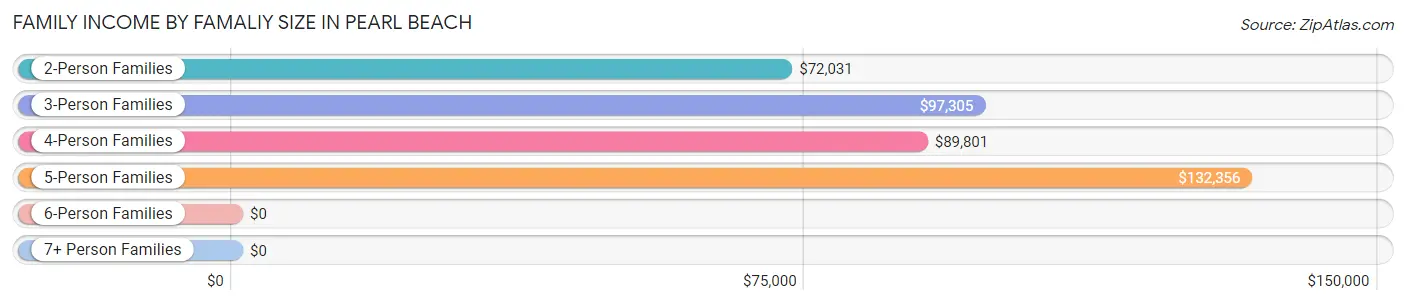
| Income Bracket | # Families | Median Income |
| 2-Person Families | 900 (61.9%) | $72,031 |
| 3-Person Families | 277 (19.1%) | $97,305 |
| 4-Person Families | 173 (11.9%) | $89,801 |
| 5-Person Families | 67 (4.6%) | $132,356 |
| 6-Person Families | 27 (1.9%) | $0 |
| 7+ Person Families | 10 (0.7%) | $0 |
| Total | 1,454 (100.0%) | $87,948 |
Family Income by Number of Earners in Pearl Beach
The median family income in Pearl Beach is $87,948, with families comprising 3+ earners (87) having the highest median family income of $160,679, while families with no earners (415) have the lowest median family income of $67,188, accounting for 6.0% and 28.5% of families, respectively.
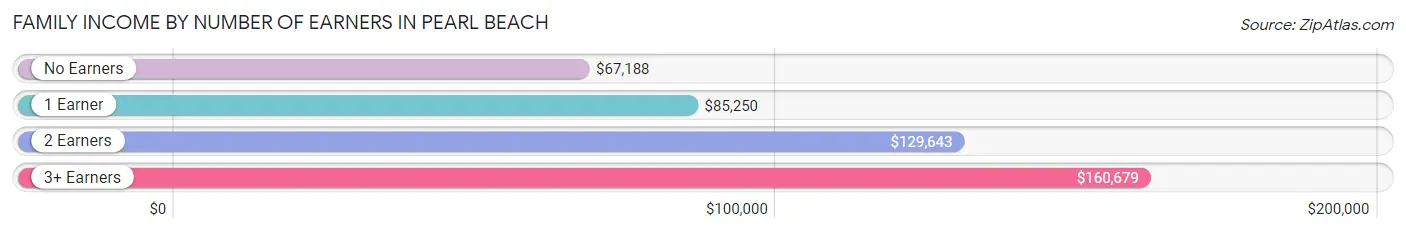
| Number of Earners | # Families | Median Income |
| No Earners | 415 (28.5%) | $67,188 |
| 1 Earner | 528 (36.3%) | $85,250 |
| 2 Earners | 424 (29.2%) | $129,643 |
| 3+ Earners | 87 (6.0%) | $160,679 |
| Total | 1,454 (100.0%) | $87,948 |
Household Income in Pearl Beach
Household Income Brackets in Pearl Beach
With 498 households falling in the category, the $50,000 to $74,999 income range is the most frequent in Pearl Beach, accounting for 21.3% of all households. In contrast, only 54 households (2.3%) fall into the $10,000 to $14,999 income bracket, making it the least populous group.
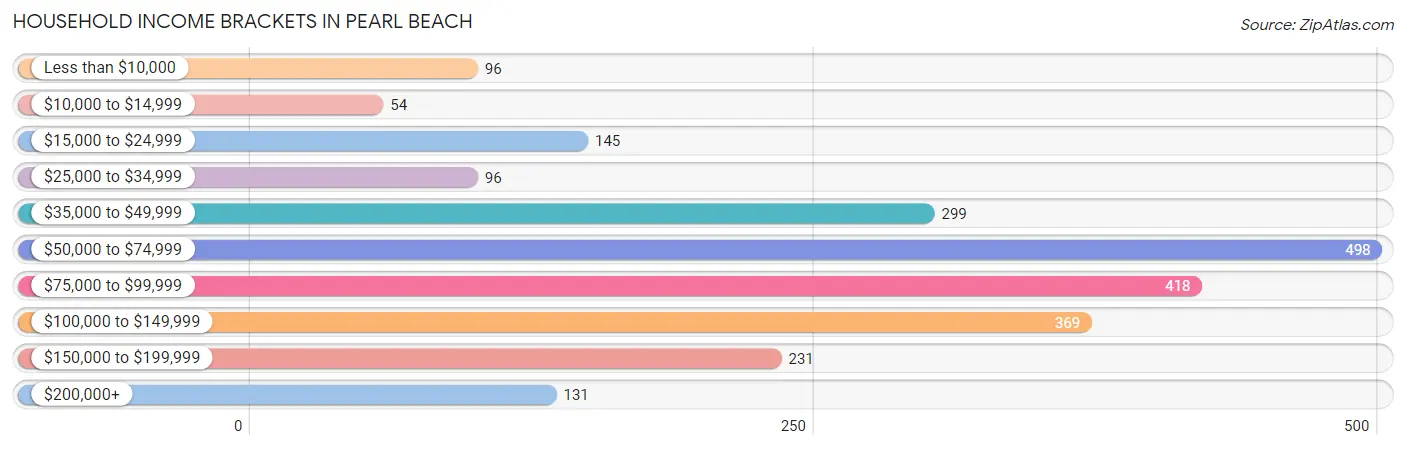
| Income Bracket | # Households | % Households |
| Less than $10,000 | 96 | 4.1% |
| $10,000 to $14,999 | 54 | 2.3% |
| $15,000 to $24,999 | 145 | 6.2% |
| $25,000 to $34,999 | 96 | 4.1% |
| $35,000 to $49,999 | 299 | 12.8% |
| $50,000 to $74,999 | 498 | 21.3% |
| $75,000 to $99,999 | 418 | 17.9% |
| $100,000 to $149,999 | 369 | 15.8% |
| $150,000 to $199,999 | 231 | 9.9% |
| $200,000+ | 131 | 5.6% |
Household Income by Householder Age in Pearl Beach
The median household income in Pearl Beach is $72,490, with the highest median household income of $89,091 found in the 25 to 44 years age bracket for the primary householder. A total of 502 households (21.5%) fall into this category. Meanwhile, the 15 to 24 years age bracket for the primary householder has the lowest median household income of $56,782, with 75 households (3.2%) in this group.
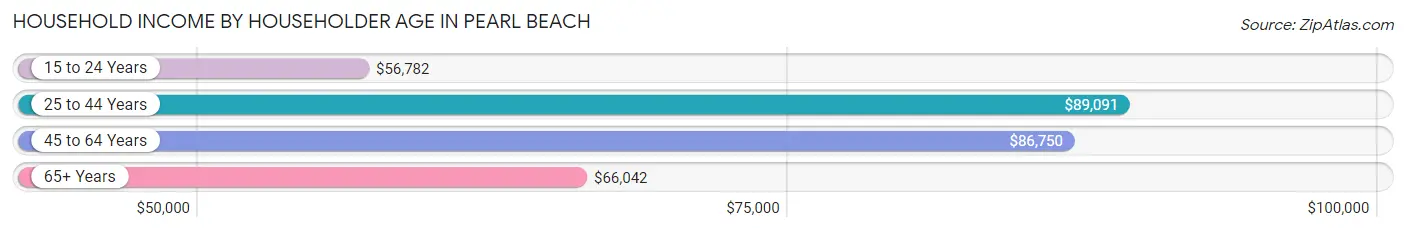
| Income Bracket | # Households | Median Income |
| 15 to 24 Years | 75 (3.2%) | $56,782 |
| 25 to 44 Years | 502 (21.5%) | $89,091 |
| 45 to 64 Years | 982 (42.0%) | $86,750 |
| 65+ Years | 778 (33.3%) | $66,042 |
| Total | 2,337 (100.0%) | $72,490 |
Poverty in Pearl Beach
Income Below Poverty by Sex and Age in Pearl Beach
With 10.2% poverty level for males and 16.5% for females among the residents of Pearl Beach, under 5 year old males and 5 year old females are the most vulnerable to poverty, with 47 males (41.2%) and 8 females (100.0%) in their respective age groups living below the poverty level.
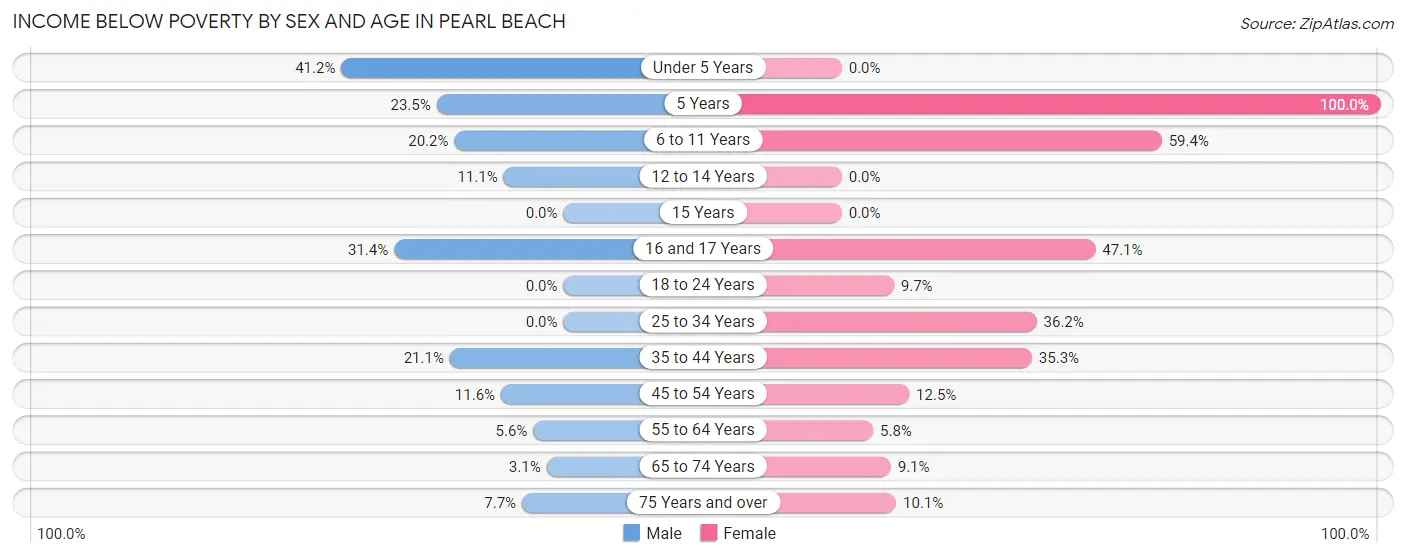
| Age Bracket | Male | Female |
| Under 5 Years | 47 (41.2%) | 0 (0.0%) |
| 5 Years | 8 (23.5%) | 8 (100.0%) |
| 6 to 11 Years | 50 (20.2%) | 76 (59.4%) |
| 12 to 14 Years | 10 (11.1%) | 0 (0.0%) |
| 15 Years | 0 (0.0%) | 0 (0.0%) |
| 16 and 17 Years | 11 (31.4%) | 8 (47.1%) |
| 18 to 24 Years | 0 (0.0%) | 14 (9.7%) |
| 25 to 34 Years | 0 (0.0%) | 132 (36.2%) |
| 35 to 44 Years | 54 (21.1%) | 48 (35.3%) |
| 45 to 54 Years | 32 (11.6%) | 37 (12.5%) |
| 55 to 64 Years | 31 (5.6%) | 29 (5.8%) |
| 65 to 74 Years | 12 (3.1%) | 36 (9.1%) |
| 75 Years and over | 16 (7.7%) | 25 (10.1%) |
| Total | 271 (10.2%) | 413 (16.5%) |
Income Above Poverty by Sex and Age in Pearl Beach
According to the poverty statistics in Pearl Beach, males aged 15 years and females aged under 5 years are the age groups that are most secure financially, with 100.0% of males and 100.0% of females in these age groups living above the poverty line.
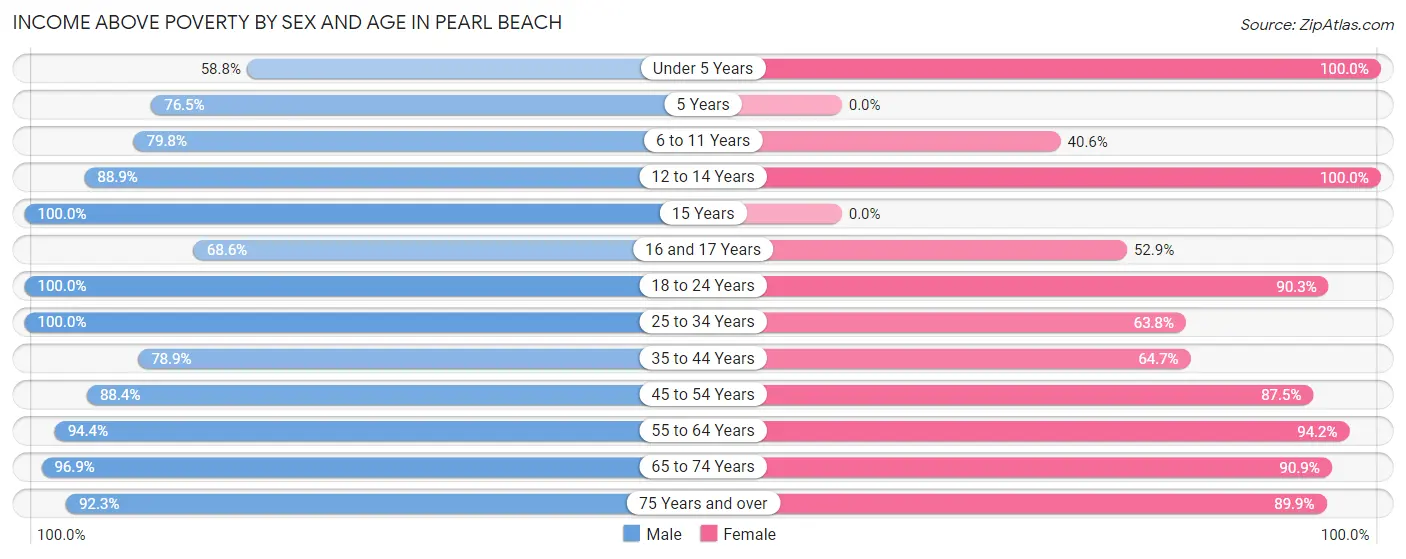
| Age Bracket | Male | Female |
| Under 5 Years | 67 (58.8%) | 187 (100.0%) |
| 5 Years | 26 (76.5%) | 0 (0.0%) |
| 6 to 11 Years | 197 (79.8%) | 52 (40.6%) |
| 12 to 14 Years | 80 (88.9%) | 72 (100.0%) |
| 15 Years | 26 (100.0%) | 0 (0.0%) |
| 16 and 17 Years | 24 (68.6%) | 9 (52.9%) |
| 18 to 24 Years | 175 (100.0%) | 131 (90.3%) |
| 25 to 34 Years | 264 (100.0%) | 233 (63.8%) |
| 35 to 44 Years | 202 (78.9%) | 88 (64.7%) |
| 45 to 54 Years | 244 (88.4%) | 259 (87.5%) |
| 55 to 64 Years | 523 (94.4%) | 470 (94.2%) |
| 65 to 74 Years | 371 (96.9%) | 360 (90.9%) |
| 75 Years and over | 192 (92.3%) | 223 (89.9%) |
| Total | 2,391 (89.8%) | 2,084 (83.5%) |
Income Below Poverty Among Married-Couple Families in Pearl Beach
The poverty statistics for married-couple families in Pearl Beach show that 5.3% or 62 of the total 1,165 families live below the poverty line. Families with 3 or 4 children have the highest poverty rate of 13.6%, comprising of 12 families. On the other hand, families with no children have the lowest poverty rate of 4.6%, which includes 41 families.
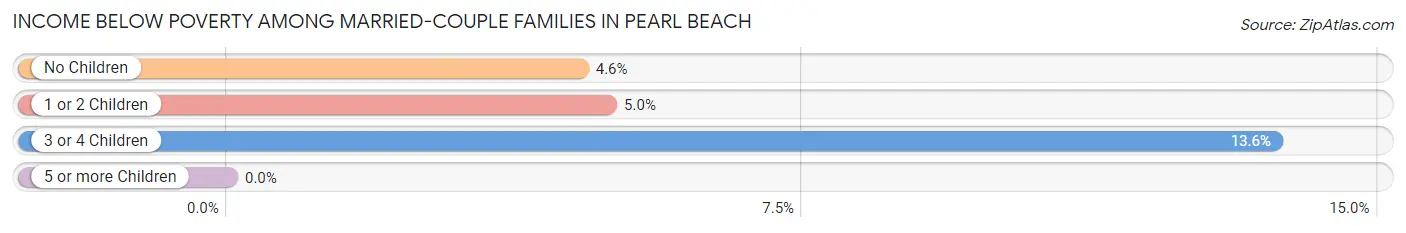
| Children | Above Poverty | Below Poverty |
| No Children | 854 (95.4%) | 41 (4.6%) |
| 1 or 2 Children | 173 (95.1%) | 9 (5.0%) |
| 3 or 4 Children | 76 (86.4%) | 12 (13.6%) |
| 5 or more Children | 0 (0.0%) | 0 (0.0%) |
| Total | 1,103 (94.7%) | 62 (5.3%) |
Income Below Poverty Among Single-Parent Households in Pearl Beach
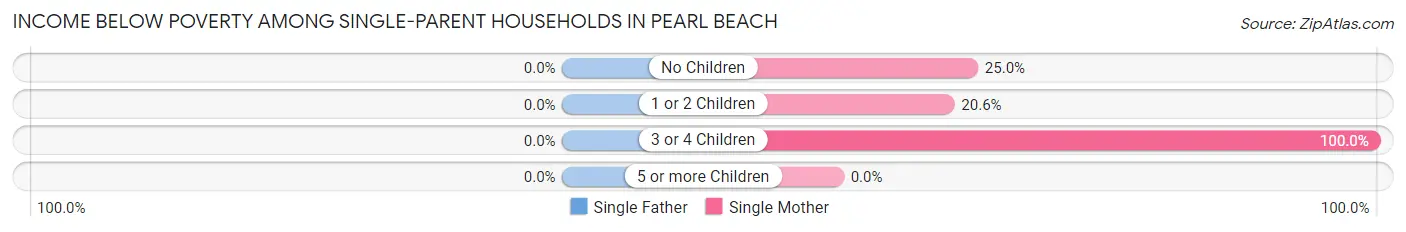
| Children | Single Father | Single Mother |
| No Children | 0 (0.0%) | 16 (25.0%) |
| 1 or 2 Children | 0 (0.0%) | 13 (20.6%) |
| 3 or 4 Children | 0 (0.0%) | 42 (100.0%) |
| 5 or more Children | 0 (0.0%) | 0 (0.0%) |
| Total | 0 (0.0%) | 71 (42.0%) |
Income Below Poverty Among Married-Couple vs Single-Parent Households in Pearl Beach
The poverty data for Pearl Beach shows that 62 of the married-couple family households (5.3%) and 71 of the single-parent households (24.6%) are living below the poverty level. Within the married-couple family households, those with 3 or 4 children have the highest poverty rate, with 12 households (13.6%) falling below the poverty line. Among the single-parent households, those with 3 or 4 children have the highest poverty rate, with 42 household (100.0%) living below poverty.
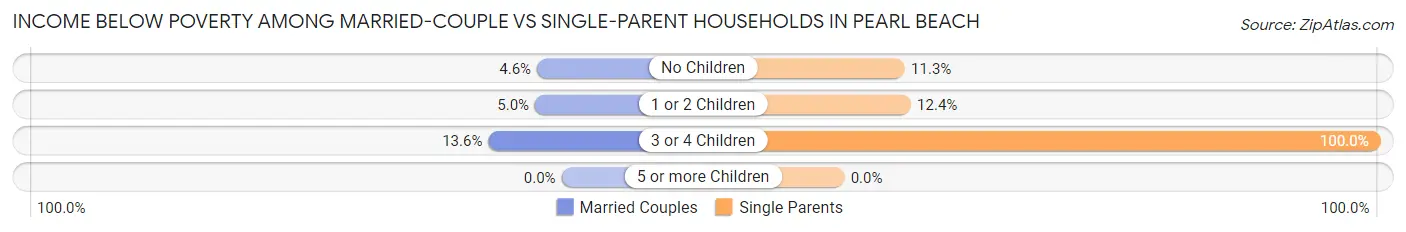
| Children | Married-Couple Families | Single-Parent Households |
| No Children | 41 (4.6%) | 16 (11.3%) |
| 1 or 2 Children | 9 (5.0%) | 13 (12.4%) |
| 3 or 4 Children | 12 (13.6%) | 42 (100.0%) |
| 5 or more Children | 0 (0.0%) | 0 (0.0%) |
| Total | 62 (5.3%) | 71 (24.6%) |
Race in Pearl Beach
The most populous races in Pearl Beach are White / Caucasian (4,924 | 95.4%), Asian (139 | 2.7%), and Two or more Races (96 | 1.9%).
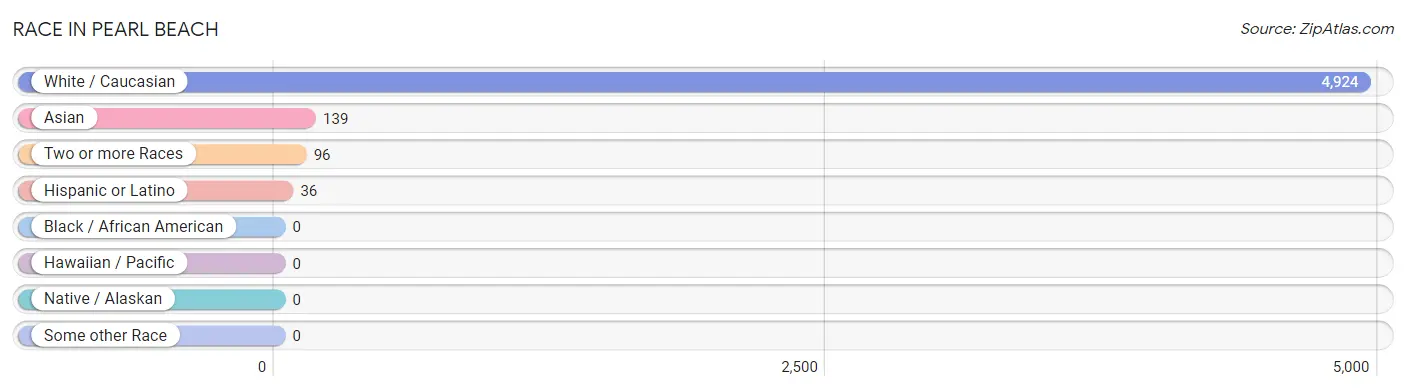
| Race | # Population | % Population |
| Asian | 139 | 2.7% |
| Black / African American | 0 | 0.0% |
| Hawaiian / Pacific | 0 | 0.0% |
| Hispanic or Latino | 36 | 0.7% |
| Native / Alaskan | 0 | 0.0% |
| White / Caucasian | 4,924 | 95.4% |
| Two or more Races | 96 | 1.9% |
| Some other Race | 0 | 0.0% |
| Total | 5,159 | 100.0% |
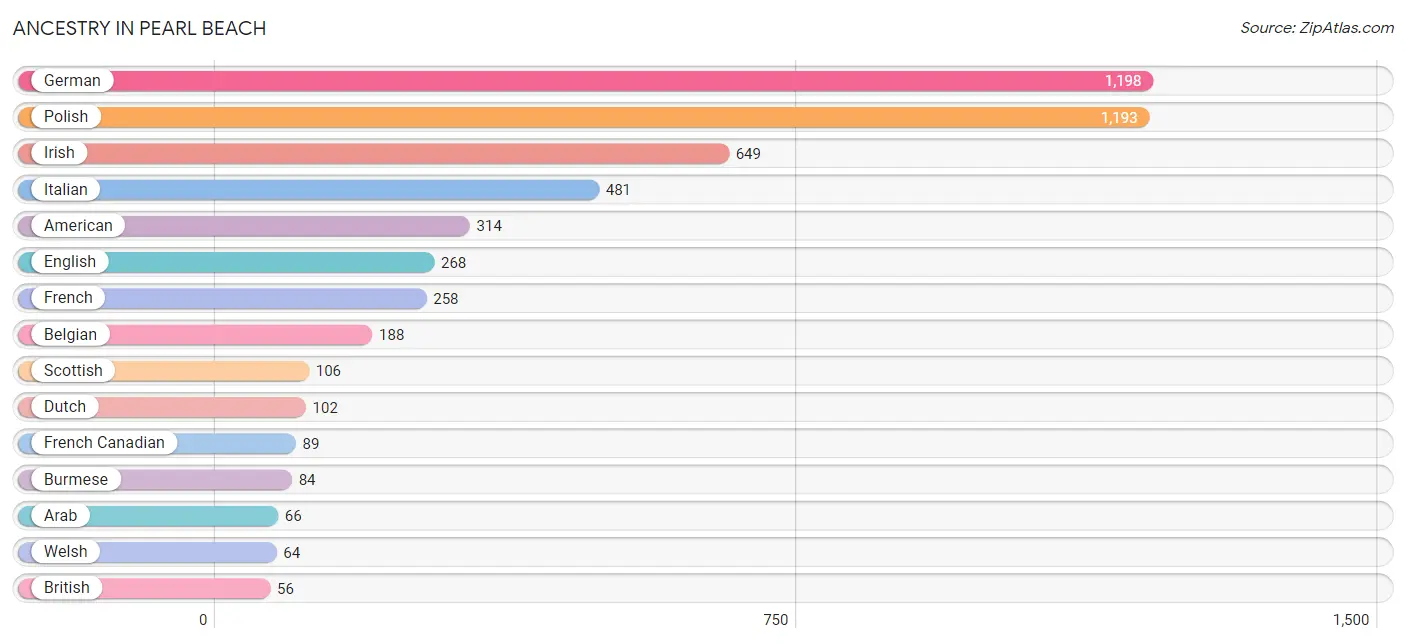
Ancestry in Pearl Beach
The most populous ancestries reported in Pearl Beach are German (1,198 | 23.2%), Polish (1,193 | 23.1%), Irish (649 | 12.6%), Italian (481 | 9.3%), and American (314 | 6.1%), together accounting for 74.3% of all Pearl Beach residents.
| Ancestry | # Population | % Population |
| American | 314 | 6.1% |
| Arab | 66 | 1.3% |
| Austrian | 8 | 0.2% |
| Belgian | 188 | 3.6% |
| Blackfeet | 6 | 0.1% |
| British | 56 | 1.1% |
| Burmese | 84 | 1.6% |
| Canadian | 46 | 0.9% |
| Cherokee | 9 | 0.2% |
| Chippewa | 4 | 0.1% |
| Croatian | 9 | 0.2% |
| Czechoslovakian | 17 | 0.3% |
| Dutch | 102 | 2.0% |
| Eastern European | 36 | 0.7% |
| Egyptian | 40 | 0.8% |
| English | 268 | 5.2% |
| European | 35 | 0.7% |
| Finnish | 21 | 0.4% |
| French | 258 | 5.0% |
| French Canadian | 89 | 1.7% |
| German | 1,198 | 23.2% |
| Hungarian | 18 | 0.4% |
| Irish | 649 | 12.6% |
| Italian | 481 | 9.3% |
| Korean | 55 | 1.1% |
| Lebanese | 26 | 0.5% |
| Mexican | 8 | 0.2% |
| Nigerian | 8 | 0.2% |
| Norwegian | 33 | 0.6% |
| Pennsylvania German | 10 | 0.2% |
| Polish | 1,193 | 23.1% |
| Romanian | 17 | 0.3% |
| Russian | 52 | 1.0% |
| Scotch-Irish | 38 | 0.7% |
| Scottish | 106 | 2.1% |
| Slavic | 7 | 0.1% |
| Subsaharan African | 8 | 0.2% |
| Swedish | 53 | 1.0% |
| Welsh | 64 | 1.2% |
| Yugoslavian | 2 | 0.0% | View All 40 Rows |
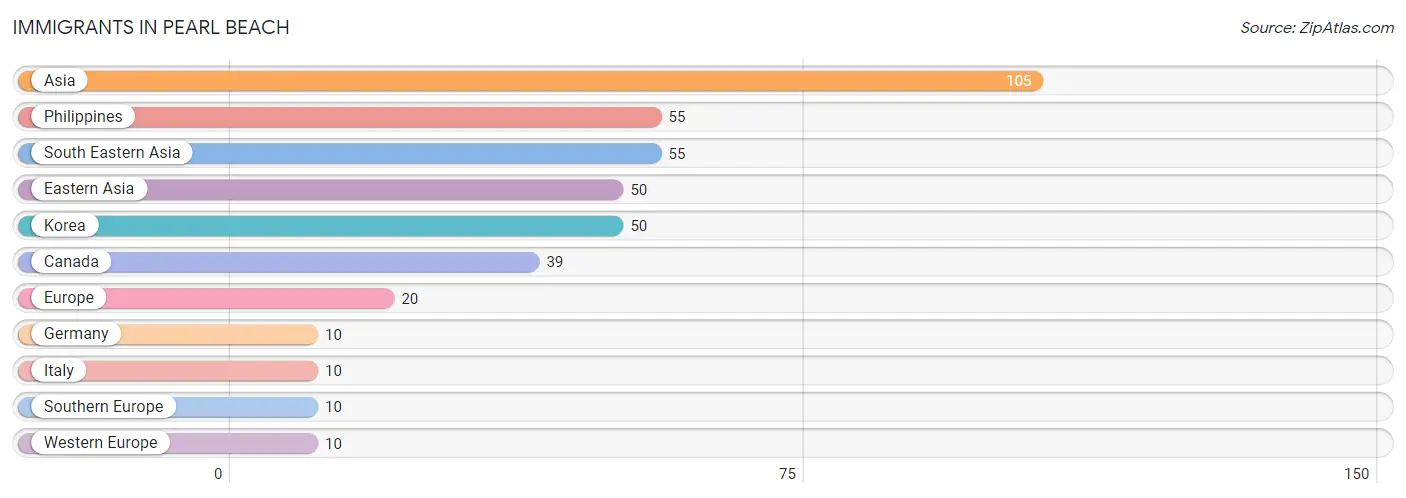
Immigrants in Pearl Beach
The most numerous immigrant groups reported in Pearl Beach came from Asia (105 | 2.0%), Philippines (55 | 1.1%), South Eastern Asia (55 | 1.1%), Eastern Asia (50 | 1.0%), and Korea (50 | 1.0%), together accounting for 6.1% of all Pearl Beach residents.
| Immigration Origin | # Population | % Population |
| Asia | 105 | 2.0% |
| Canada | 39 | 0.8% |
| Eastern Asia | 50 | 1.0% |
| Europe | 20 | 0.4% |
| Germany | 10 | 0.2% |
| Italy | 10 | 0.2% |
| Korea | 50 | 1.0% |
| Philippines | 55 | 1.1% |
| South Eastern Asia | 55 | 1.1% |
| Southern Europe | 10 | 0.2% |
| Western Europe | 10 | 0.2% | View All 11 Rows |
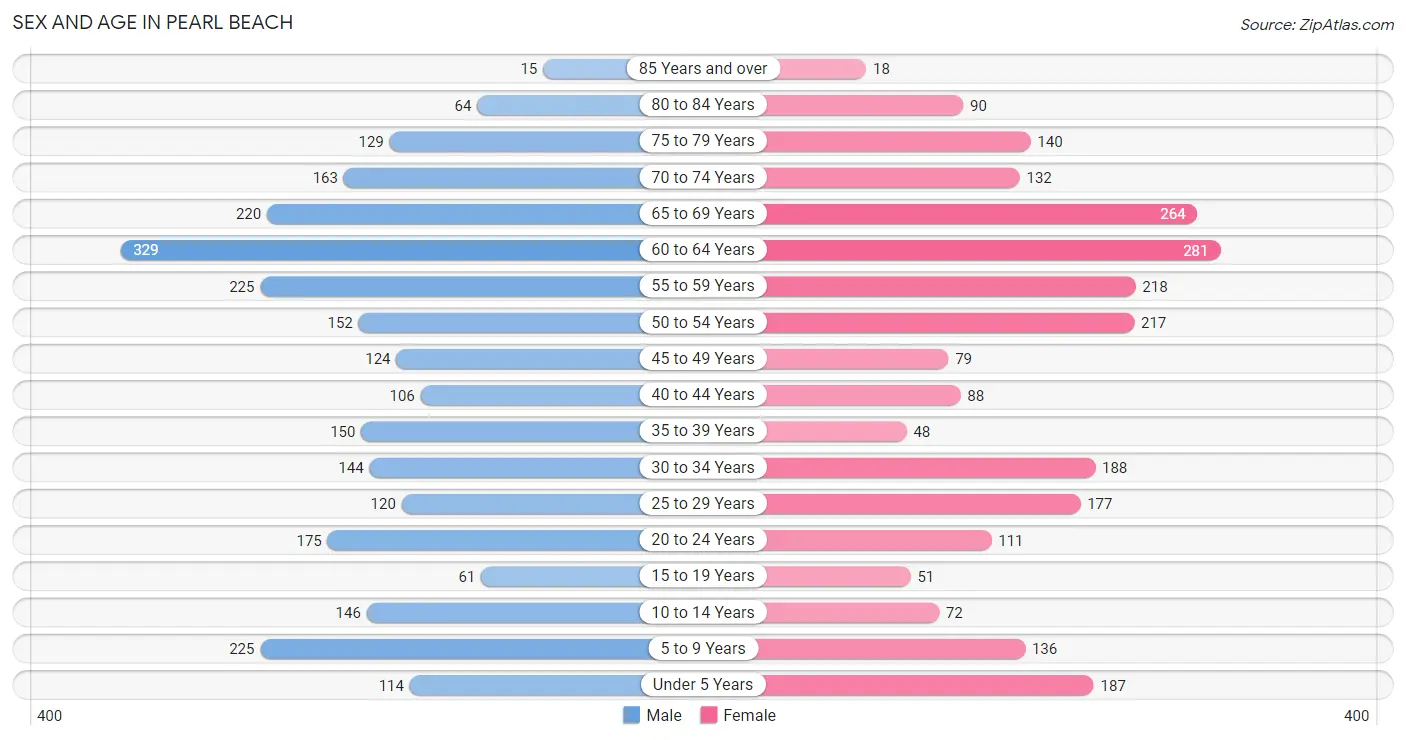
Sex and Age in Pearl Beach
Sex and Age in Pearl Beach
The most populous age groups in Pearl Beach are 60 to 64 Years (329 | 12.4%) for men and 60 to 64 Years (281 | 11.3%) for women.
| Age Bracket | Male | Female |
| Under 5 Years | 114 (4.3%) | 187 (7.5%) |
| 5 to 9 Years | 225 (8.5%) | 136 (5.4%) |
| 10 to 14 Years | 146 (5.5%) | 72 (2.9%) |
| 15 to 19 Years | 61 (2.3%) | 51 (2.0%) |
| 20 to 24 Years | 175 (6.6%) | 111 (4.4%) |
| 25 to 29 Years | 120 (4.5%) | 177 (7.1%) |
| 30 to 34 Years | 144 (5.4%) | 188 (7.5%) |
| 35 to 39 Years | 150 (5.6%) | 48 (1.9%) |
| 40 to 44 Years | 106 (4.0%) | 88 (3.5%) |
| 45 to 49 Years | 124 (4.7%) | 79 (3.2%) |
| 50 to 54 Years | 152 (5.7%) | 217 (8.7%) |
| 55 to 59 Years | 225 (8.5%) | 218 (8.7%) |
| 60 to 64 Years | 329 (12.4%) | 281 (11.3%) |
| 65 to 69 Years | 220 (8.3%) | 264 (10.6%) |
| 70 to 74 Years | 163 (6.1%) | 132 (5.3%) |
| 75 to 79 Years | 129 (4.9%) | 140 (5.6%) |
| 80 to 84 Years | 64 (2.4%) | 90 (3.6%) |
| 85 Years and over | 15 (0.6%) | 18 (0.7%) |
| Total | 2,662 (100.0%) | 2,497 (100.0%) |
Families and Households in Pearl Beach
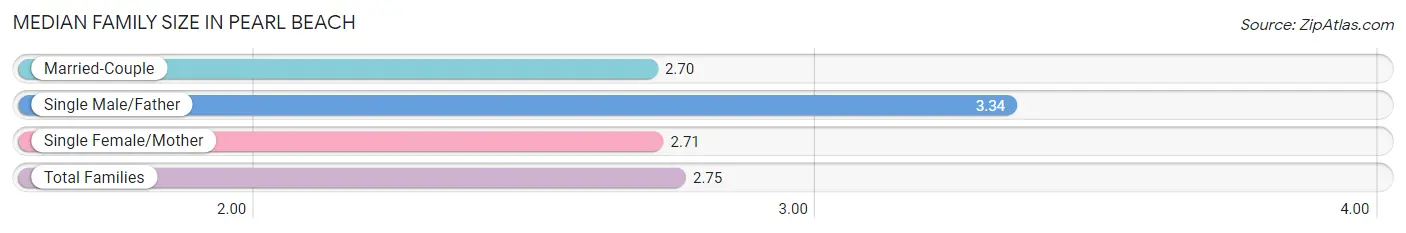
Median Family Size in Pearl Beach
The median family size in Pearl Beach is 2.75 persons per family, with single male/father families (120 | 8.3%) accounting for the largest median family size of 3.34 persons per family. On the other hand, married-couple families (1,165 | 80.1%) represent the smallest median family size with 2.70 persons per family.
| Family Type | # Families | Family Size |
| Married-Couple | 1,165 (80.1%) | 2.70 |
| Single Male/Father | 120 (8.3%) | 3.34 |
| Single Female/Mother | 169 (11.6%) | 2.71 |
| Total Families | 1,454 (100.0%) | 2.75 |
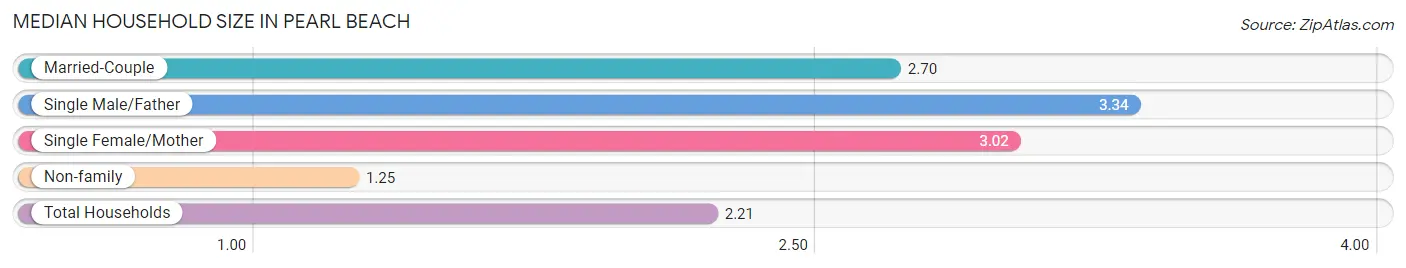
Median Household Size in Pearl Beach
The median household size in Pearl Beach is 2.21 persons per household, with single male/father households (120 | 5.1%) accounting for the largest median household size of 3.34 persons per household. non-family households (883 | 37.8%) represent the smallest median household size with 1.25 persons per household.
| Household Type | # Households | Household Size |
| Married-Couple | 1,165 (49.8%) | 2.70 |
| Single Male/Father | 120 (5.1%) | 3.34 |
| Single Female/Mother | 169 (7.2%) | 3.02 |
| Non-family | 883 (37.8%) | 1.25 |
| Total Households | 2,337 (100.0%) | 2.21 |
Household Size by Marriage Status in Pearl Beach
Out of a total of 2,337 households in Pearl Beach, 1,454 (62.2%) are family households, while 883 (37.8%) are nonfamily households. The most numerous type of family households are 2-person households, comprising 890, and the most common type of nonfamily households are 1-person households, comprising 645.
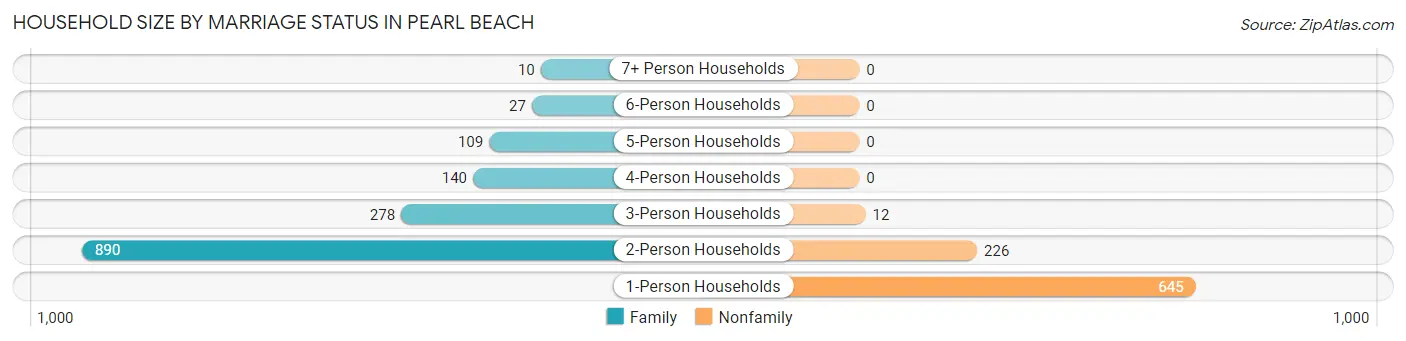
| Household Size | Family Households | Nonfamily Households |
| 1-Person Households | - | 645 (27.6%) |
| 2-Person Households | 890 (38.1%) | 226 (9.7%) |
| 3-Person Households | 278 (11.9%) | 12 (0.5%) |
| 4-Person Households | 140 (6.0%) | 0 (0.0%) |
| 5-Person Households | 109 (4.7%) | 0 (0.0%) |
| 6-Person Households | 27 (1.2%) | 0 (0.0%) |
| 7+ Person Households | 10 (0.4%) | 0 (0.0%) |
| Total | 1,454 (62.2%) | 883 (37.8%) |
Female Fertility in Pearl Beach
Fertility by Age in Pearl Beach
Average fertility rate in Pearl Beach is 35.0 births per 1,000 women. Women in the age bracket of 15 to 19 years have the highest fertility rate with 157.0 births per 1,000 women. Women in the age bracket of 35 to 50 years acount for 37.0% of all women with births.
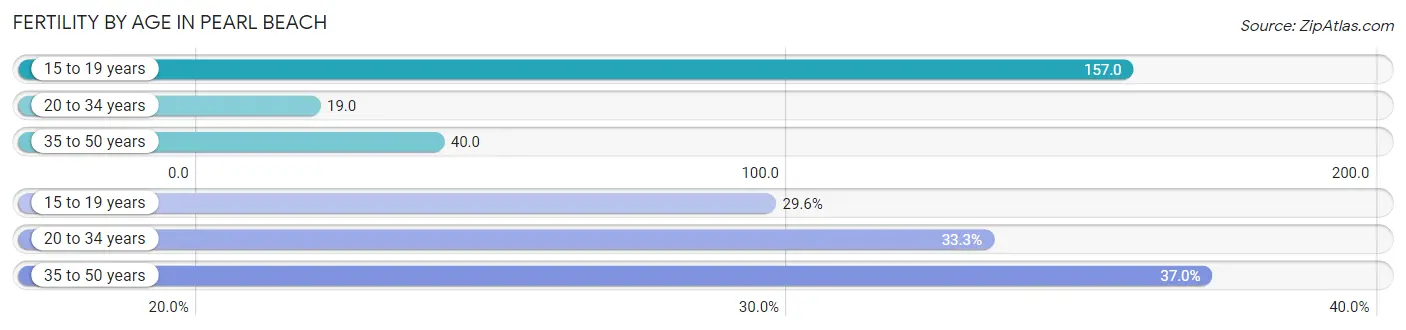
| Age Bracket | Women with Births | Births / 1,000 Women |
| 15 to 19 years | 8 (29.6%) | 157.0 |
| 20 to 34 years | 9 (33.3%) | 19.0 |
| 35 to 50 years | 10 (37.0%) | 40.0 |
| Total | 27 (100.0%) | 35.0 |
Fertility by Age by Marriage Status in Pearl Beach
70.4% of women with births (27) in Pearl Beach are married. The highest percentage of unmarried women with births falls into 15 to 19 years age bracket with 100.0% of them unmarried at the time of birth, while the lowest percentage of unmarried women with births belong to 20 to 34 years age bracket with 0.0% of them unmarried.
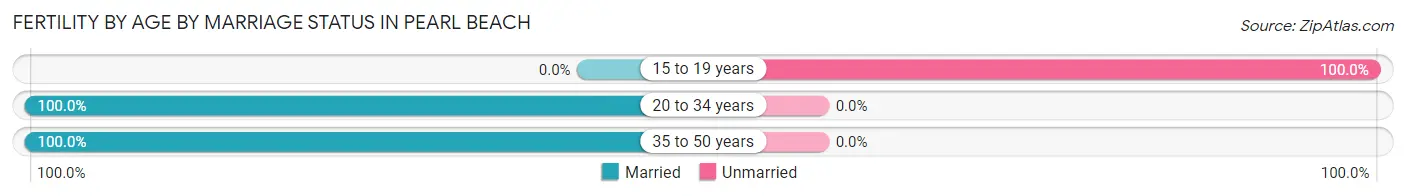
| Age Bracket | Married | Unmarried |
| 15 to 19 years | 0 (0.0%) | 8 (100.0%) |
| 20 to 34 years | 9 (100.0%) | 0 (0.0%) |
| 35 to 50 years | 10 (100.0%) | 0 (0.0%) |
| Total | 19 (70.4%) | 8 (29.6%) |
Fertility by Education in Pearl Beach
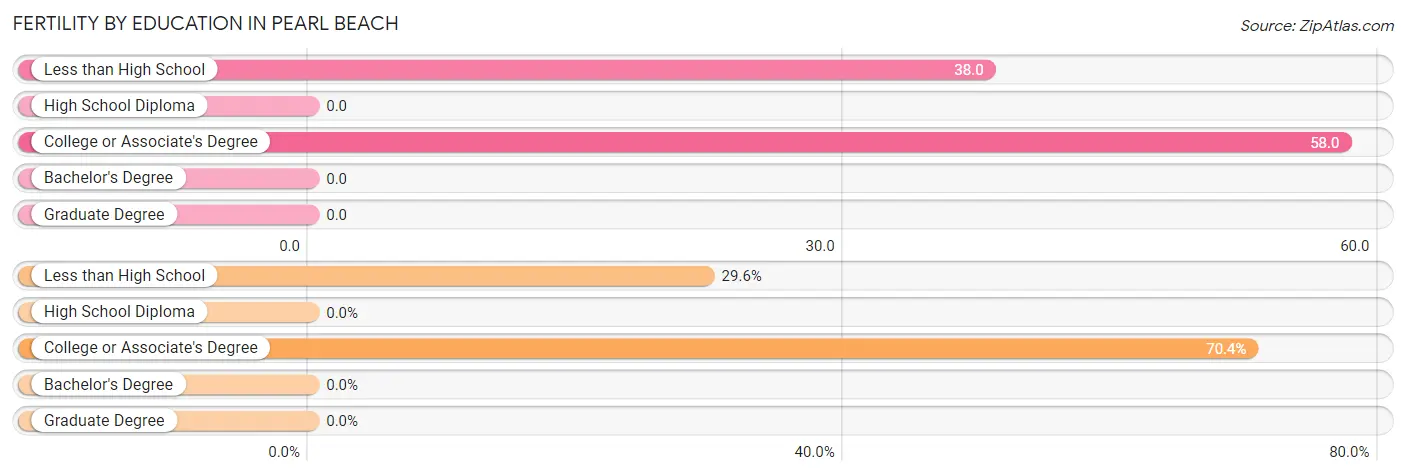
| Educational Attainment | Women with Births | Births / 1,000 Women |
| Less than High School | 8 (29.6%) | 38.0 |
| High School Diploma | 0 (0.0%) | 0.0 |
| College or Associate's Degree | 19 (70.4%) | 58.0 |
| Bachelor's Degree | 0 (0.0%) | 0.0 |
| Graduate Degree | 0 (0.0%) | 0.0 |
| Total | 27 (100.0%) | 35.0 |
Fertility by Education by Marriage Status in Pearl Beach
29.6% of women with births in Pearl Beach are unmarried. Women with the educational attainment of college or associate's degree are most likely to be married with 100.0% of them married at childbirth, while women with the educational attainment of less than high school are least likely to be married with 100.0% of them unmarried at childbirth.
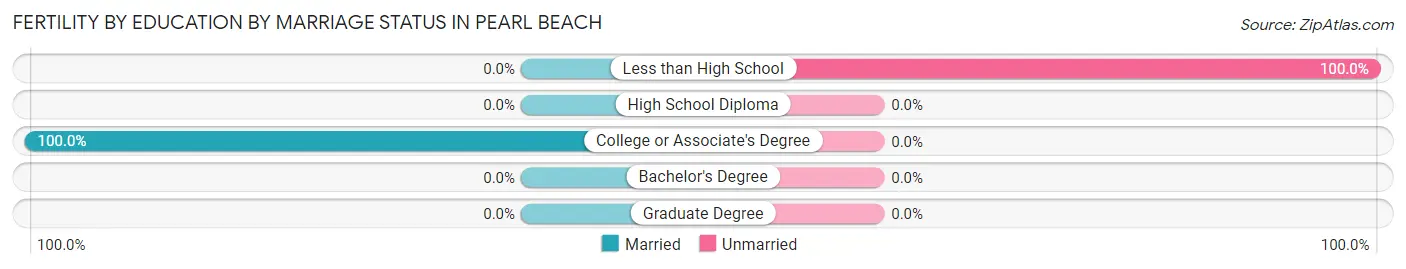
| Educational Attainment | Married | Unmarried |
| Less than High School | 0 (0.0%) | 8 (100.0%) |
| High School Diploma | 0 (0.0%) | 0 (0.0%) |
| College or Associate's Degree | 19 (100.0%) | 0 (0.0%) |
| Bachelor's Degree | 0 (0.0%) | 0 (0.0%) |
| Graduate Degree | 0 (0.0%) | 0 (0.0%) |
| Total | 19 (70.4%) | 8 (29.6%) |
Employment Characteristics in Pearl Beach
Employment by Class of Employer in Pearl Beach
Among the 2,064 employed individuals in Pearl Beach, private company employees (1,592 | 77.1%), not-for-profit organizations (112 | 5.4%), and self-employed (not incorporated) (82 | 4.0%) make up the most common classes of employment.
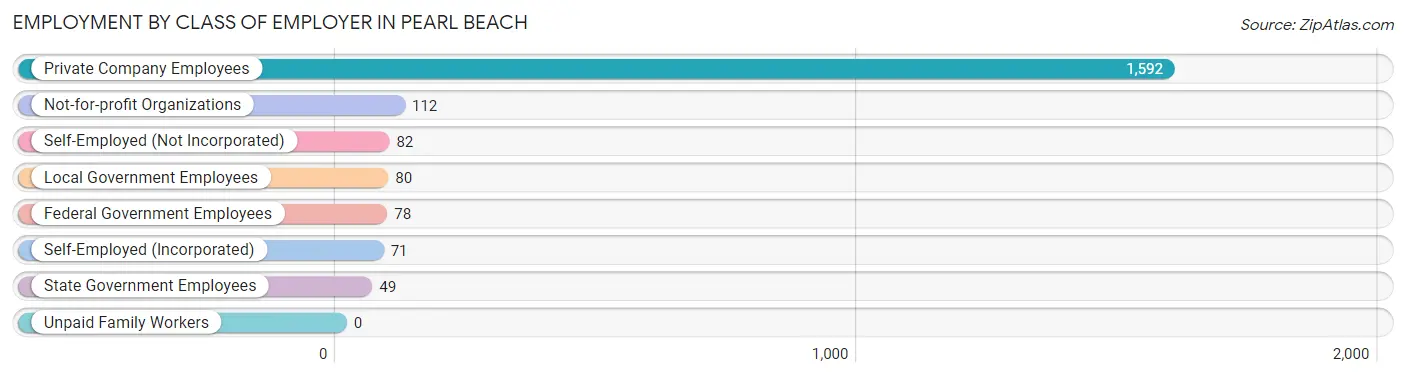
| Employer Class | # Employees | % Employees |
| Private Company Employees | 1,592 | 77.1% |
| Self-Employed (Incorporated) | 71 | 3.4% |
| Self-Employed (Not Incorporated) | 82 | 4.0% |
| Not-for-profit Organizations | 112 | 5.4% |
| Local Government Employees | 80 | 3.9% |
| State Government Employees | 49 | 2.4% |
| Federal Government Employees | 78 | 3.8% |
| Unpaid Family Workers | 0 | 0.0% |
| Total | 2,064 | 100.0% |
Employment Status by Age in Pearl Beach
According to the labor force statistics for Pearl Beach, out of the total population over 16 years of age (4,253), 53.8% or 2,288 individuals are in the labor force, with 4.3% or 98 of them unemployed. The age group with the highest labor force participation rate is 20 to 24 years, with 90.9% or 260 individuals in the labor force. Within the labor force, the 45 to 54 years age range has the highest percentage of unemployed individuals, with 9.6% or 46 of them being unemployed.
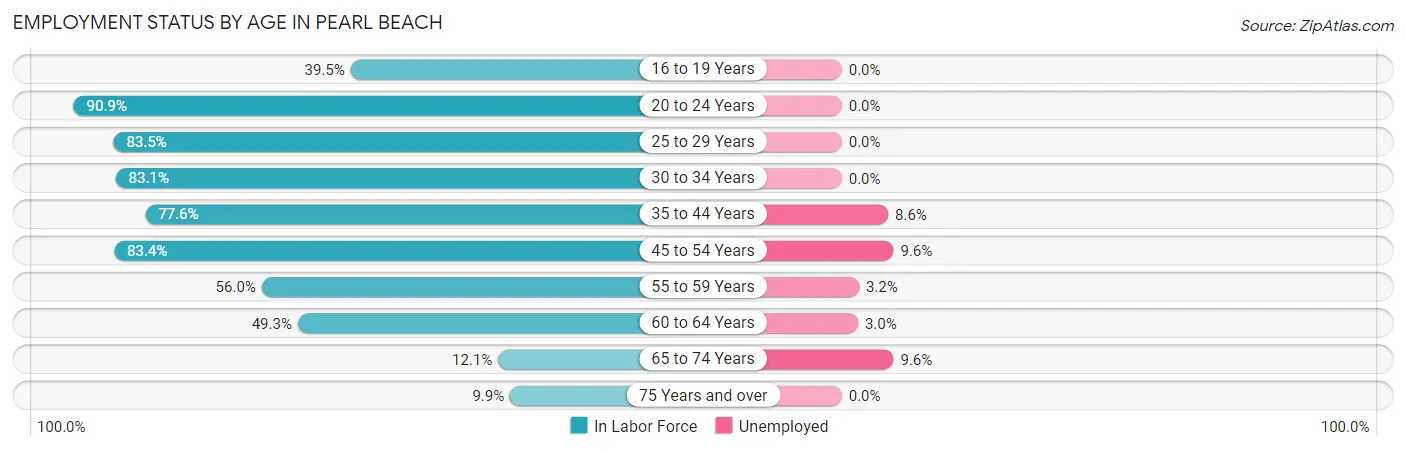
| Age Bracket | In Labor Force | Unemployed |
| 16 to 19 Years | 34 (39.5%) | 0 (0.0%) |
| 20 to 24 Years | 260 (90.9%) | 0 (0.0%) |
| 25 to 29 Years | 248 (83.5%) | 0 (0.0%) |
| 30 to 34 Years | 276 (83.1%) | 0 (0.0%) |
| 35 to 44 Years | 304 (77.6%) | 26 (8.6%) |
| 45 to 54 Years | 477 (83.4%) | 46 (9.6%) |
| 55 to 59 Years | 248 (56.0%) | 8 (3.2%) |
| 60 to 64 Years | 301 (49.3%) | 9 (3.0%) |
| 65 to 74 Years | 94 (12.1%) | 9 (9.6%) |
| 75 Years and over | 45 (9.9%) | 0 (0.0%) |
| Total | 2,288 (53.8%) | 98 (4.3%) |
Employment Status by Educational Attainment in Pearl Beach
According to labor force statistics for Pearl Beach, 70.1% of individuals (1,855) out of the total population between 25 and 64 years of age (2,646) are in the labor force, with 4.8% or 89 of them being unemployed. The group with the highest labor force participation rate are those with the educational attainment of less than high school, with 83.4% or 241 individuals in the labor force. Within the labor force, individuals with college / associate degree education have the highest percentage of unemployment, with 8.9% or 66 of them being unemployed.
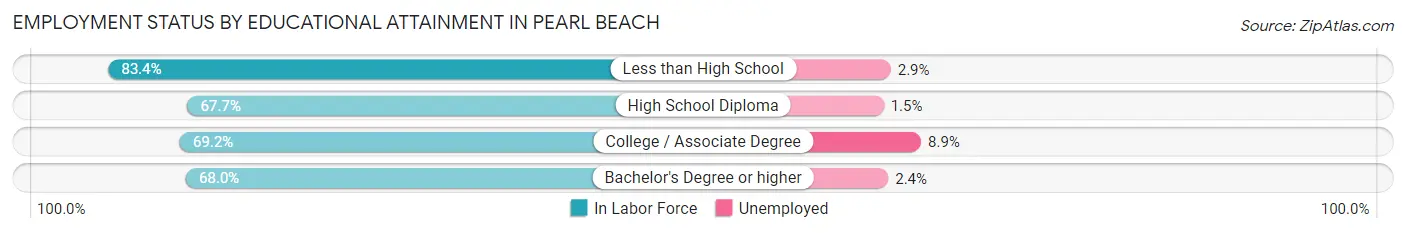
| Educational Attainment | In Labor Force | Unemployed |
| Less than High School | 241 (83.4%) | 8 (2.9%) |
| High School Diploma | 543 (67.7%) | 12 (1.5%) |
| College / Associate Degree | 739 (69.2%) | 95 (8.9%) |
| Bachelor's Degree or higher | 331 (68.0%) | 12 (2.4%) |
| Total | 1,855 (70.1%) | 127 (4.8%) |
Employment Occupations by Sex in Pearl Beach
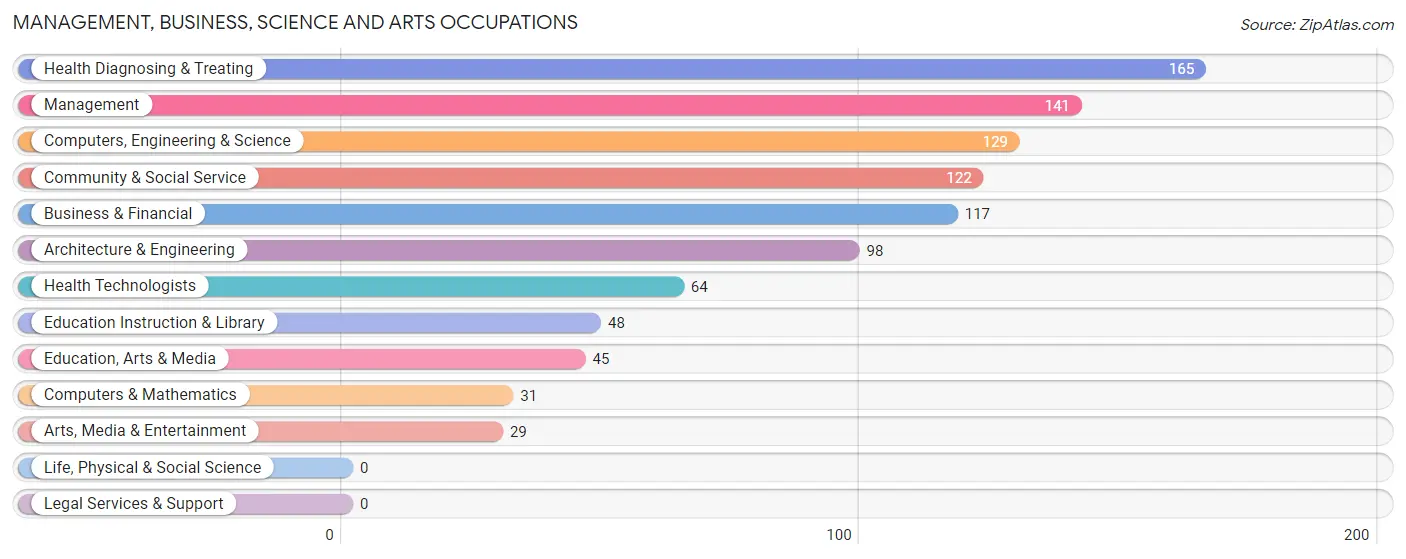
Management, Business, Science and Arts Occupations
The most common Management, Business, Science and Arts occupations in Pearl Beach are Health Diagnosing & Treating (165 | 7.5%), Management (141 | 6.4%), Computers, Engineering & Science (129 | 5.9%), Community & Social Service (122 | 5.6%), and Business & Financial (117 | 5.3%).
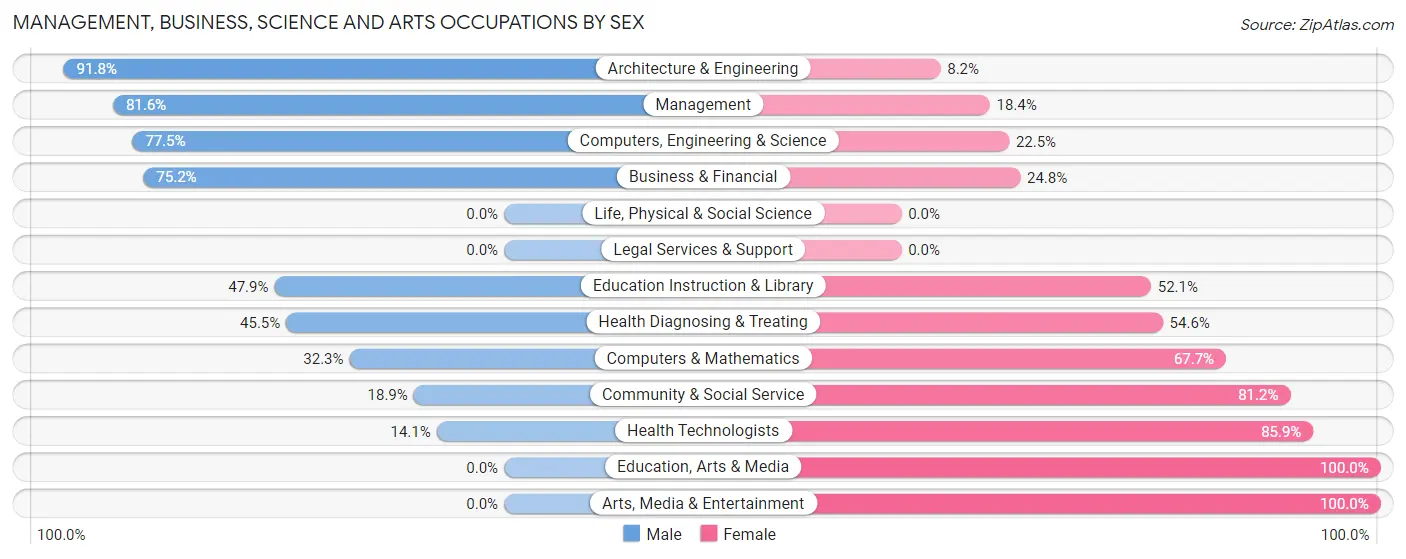
Management, Business, Science and Arts Occupations by Sex
Within the Management, Business, Science and Arts occupations in Pearl Beach, the most male-oriented occupations are Architecture & Engineering (91.8%), Management (81.6%), and Computers, Engineering & Science (77.5%), while the most female-oriented occupations are Education, Arts & Media (100.0%), Arts, Media & Entertainment (100.0%), and Health Technologists (85.9%).
| Occupation | Male | Female |
| Management | 115 (81.6%) | 26 (18.4%) |
| Business & Financial | 88 (75.2%) | 29 (24.8%) |
| Computers, Engineering & Science | 100 (77.5%) | 29 (22.5%) |
| Computers & Mathematics | 10 (32.3%) | 21 (67.7%) |
| Architecture & Engineering | 90 (91.8%) | 8 (8.2%) |
| Life, Physical & Social Science | 0 (0.0%) | 0 (0.0%) |
| Community & Social Service | 23 (18.9%) | 99 (81.1%) |
| Education, Arts & Media | 0 (0.0%) | 45 (100.0%) |
| Legal Services & Support | 0 (0.0%) | 0 (0.0%) |
| Education Instruction & Library | 23 (47.9%) | 25 (52.1%) |
| Arts, Media & Entertainment | 0 (0.0%) | 29 (100.0%) |
| Health Diagnosing & Treating | 75 (45.5%) | 90 (54.5%) |
| Health Technologists | 9 (14.1%) | 55 (85.9%) |
| Total (Category) | 401 (59.5%) | 273 (40.5%) |
| Total (Overall) | 1,258 (57.5%) | 931 (42.5%) |
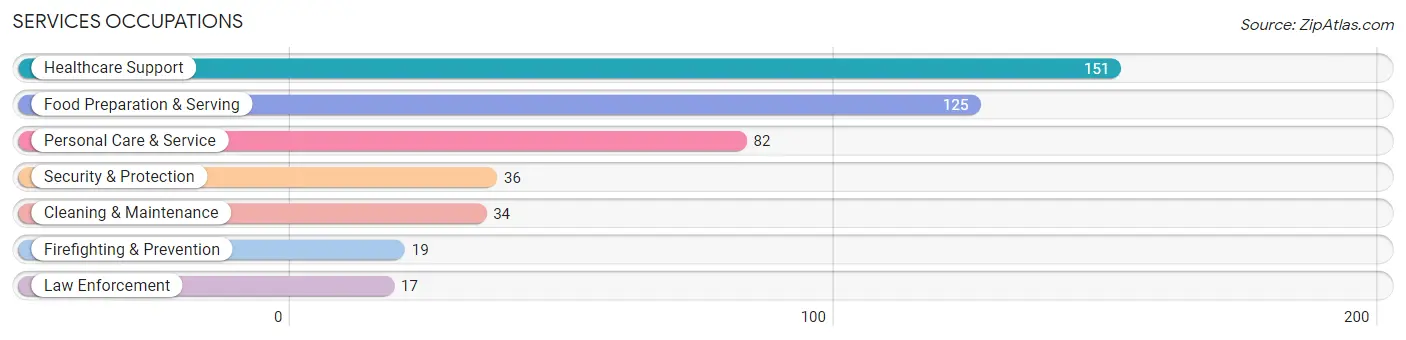
Services Occupations
The most common Services occupations in Pearl Beach are Healthcare Support (151 | 6.9%), Food Preparation & Serving (125 | 5.7%), Personal Care & Service (82 | 3.7%), Security & Protection (36 | 1.6%), and Cleaning & Maintenance (34 | 1.5%).
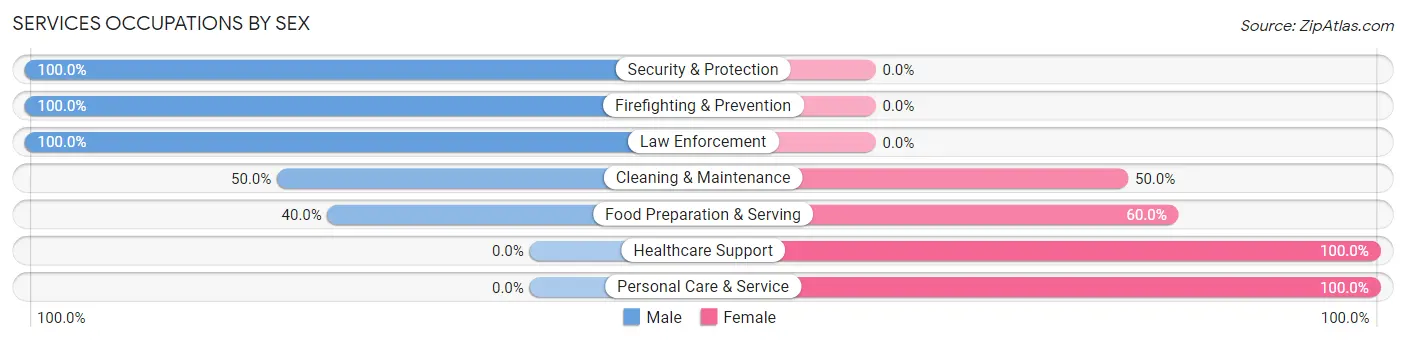
Services Occupations by Sex
Within the Services occupations in Pearl Beach, the most male-oriented occupations are Security & Protection (100.0%), Firefighting & Prevention (100.0%), and Law Enforcement (100.0%), while the most female-oriented occupations are Healthcare Support (100.0%), Personal Care & Service (100.0%), and Food Preparation & Serving (60.0%).
| Occupation | Male | Female |
| Healthcare Support | 0 (0.0%) | 151 (100.0%) |
| Security & Protection | 36 (100.0%) | 0 (0.0%) |
| Firefighting & Prevention | 19 (100.0%) | 0 (0.0%) |
| Law Enforcement | 17 (100.0%) | 0 (0.0%) |
| Food Preparation & Serving | 50 (40.0%) | 75 (60.0%) |
| Cleaning & Maintenance | 17 (50.0%) | 17 (50.0%) |
| Personal Care & Service | 0 (0.0%) | 82 (100.0%) |
| Total (Category) | 103 (24.1%) | 325 (75.9%) |
| Total (Overall) | 1,258 (57.5%) | 931 (42.5%) |
Sales and Office Occupations
The most common Sales and Office occupations in Pearl Beach are Sales & Related (275 | 12.6%), and Office & Administration (116 | 5.3%).
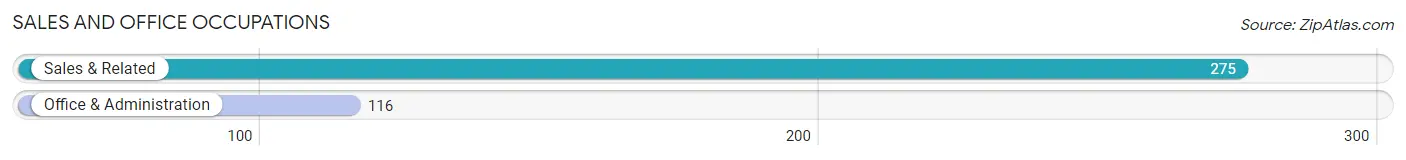
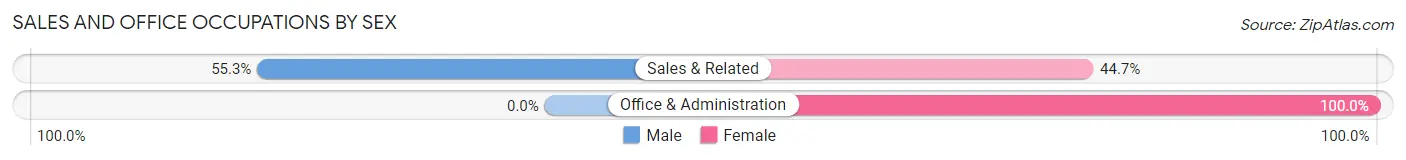
Sales and Office Occupations by Sex
| Occupation | Male | Female |
| Sales & Related | 152 (55.3%) | 123 (44.7%) |
| Office & Administration | 0 (0.0%) | 116 (100.0%) |
| Total (Category) | 152 (38.9%) | 239 (61.1%) |
| Total (Overall) | 1,258 (57.5%) | 931 (42.5%) |
Natural Resources, Construction and Maintenance Occupations
The most common Natural Resources, Construction and Maintenance occupations in Pearl Beach are Construction & Extraction (285 | 13.0%), and Installation, Maintenance & Repair (76 | 3.5%).
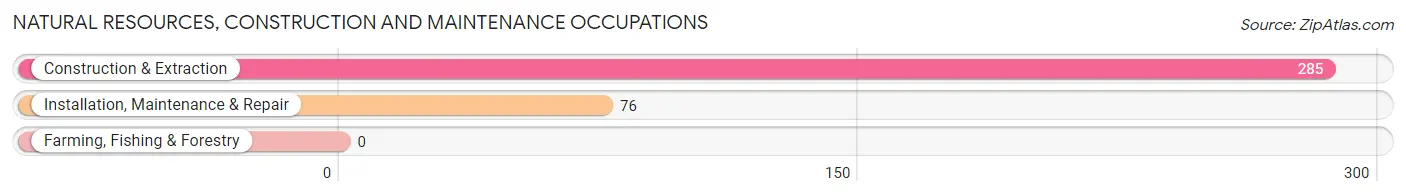
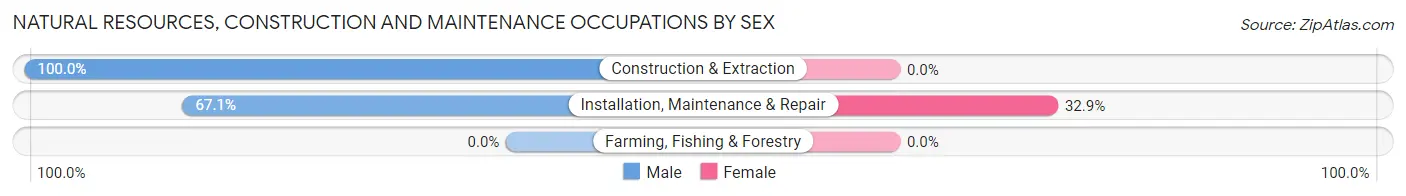
Natural Resources, Construction and Maintenance Occupations by Sex
| Occupation | Male | Female |
| Farming, Fishing & Forestry | 0 (0.0%) | 0 (0.0%) |
| Construction & Extraction | 285 (100.0%) | 0 (0.0%) |
| Installation, Maintenance & Repair | 51 (67.1%) | 25 (32.9%) |
| Total (Category) | 336 (93.1%) | 25 (6.9%) |
| Total (Overall) | 1,258 (57.5%) | 931 (42.5%) |
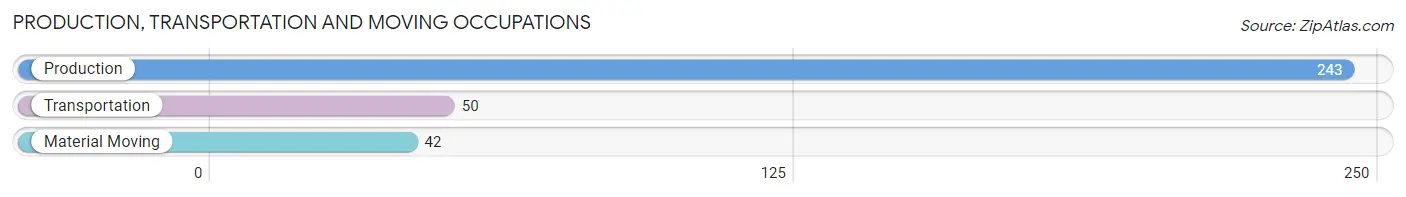
Production, Transportation and Moving Occupations
The most common Production, Transportation and Moving occupations in Pearl Beach are Production (243 | 11.1%), Transportation (50 | 2.3%), and Material Moving (42 | 1.9%).
Production, Transportation and Moving Occupations by Sex
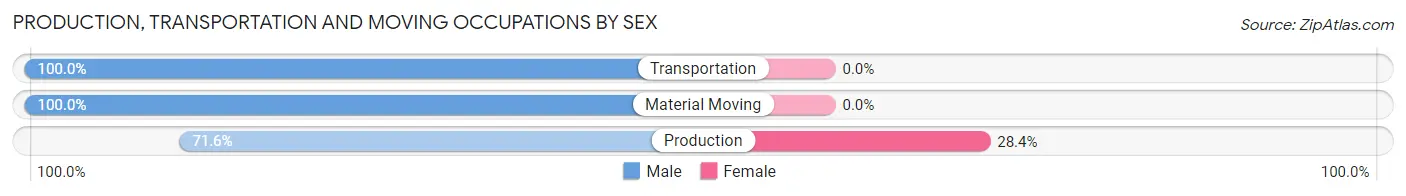
| Occupation | Male | Female |
| Production | 174 (71.6%) | 69 (28.4%) |
| Transportation | 50 (100.0%) | 0 (0.0%) |
| Material Moving | 42 (100.0%) | 0 (0.0%) |
| Total (Category) | 266 (79.4%) | 69 (20.6%) |
| Total (Overall) | 1,258 (57.5%) | 931 (42.5%) |
Employment Industries by Sex in Pearl Beach
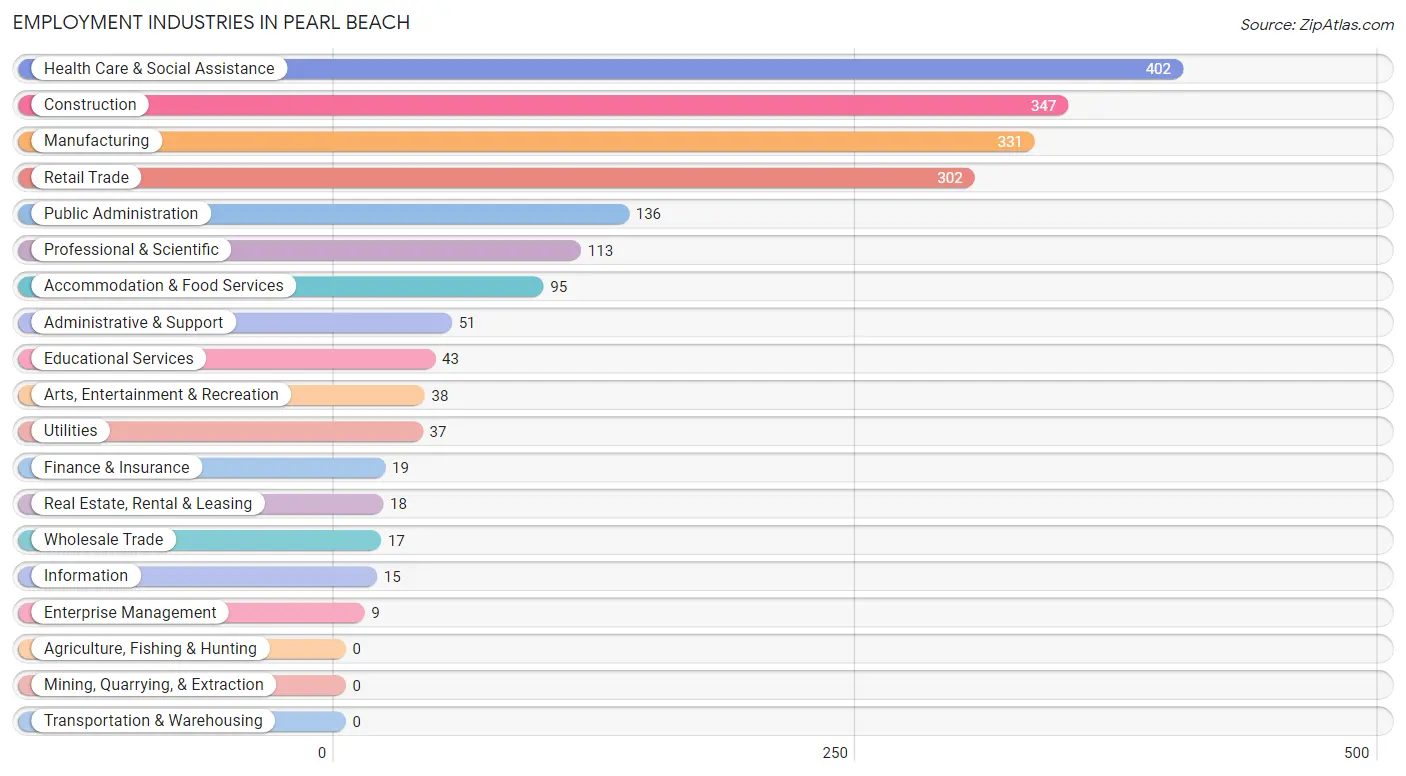
Employment Industries in Pearl Beach
The major employment industries in Pearl Beach include Health Care & Social Assistance (402 | 18.4%), Construction (347 | 15.9%), Manufacturing (331 | 15.1%), Retail Trade (302 | 13.8%), and Public Administration (136 | 6.2%).
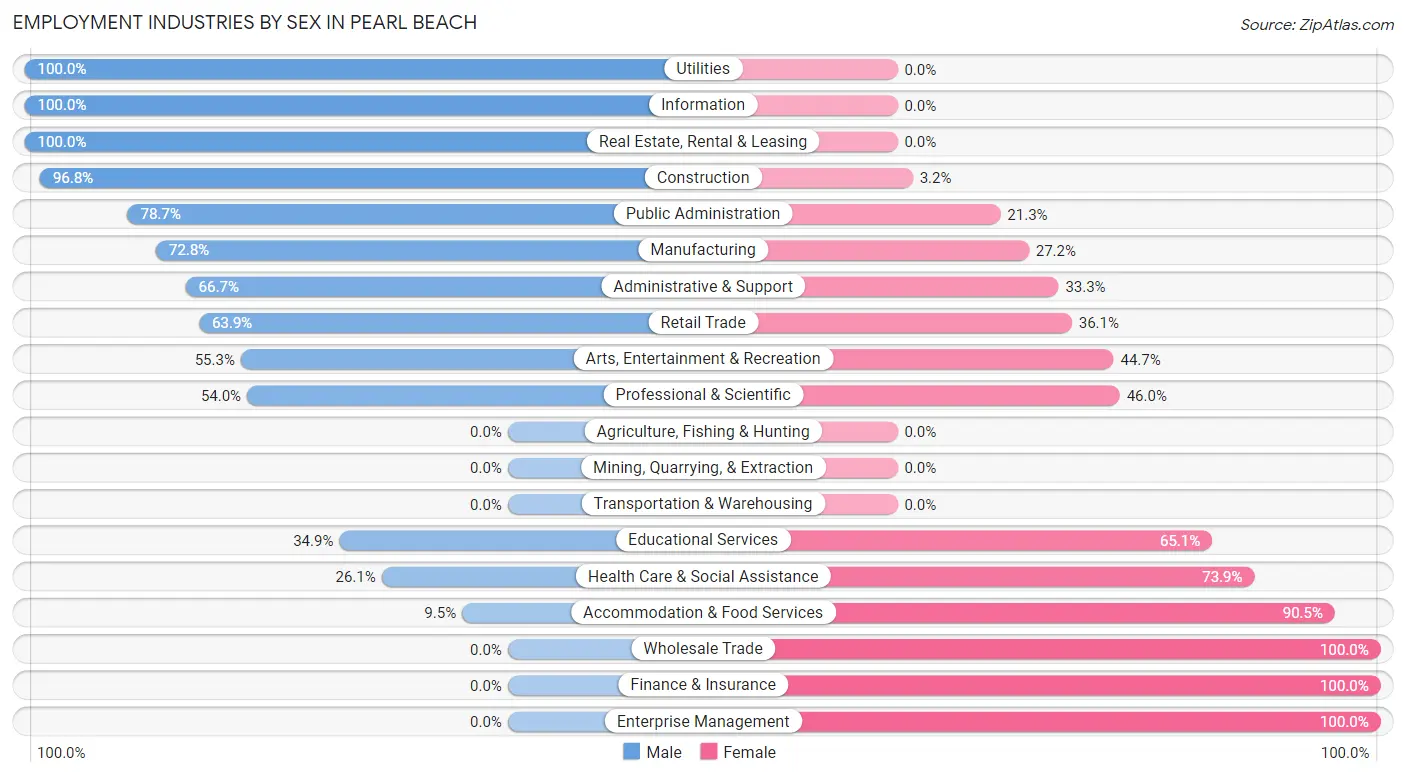
Employment Industries by Sex in Pearl Beach
The Pearl Beach industries that see more men than women are Utilities (100.0%), Information (100.0%), and Real Estate, Rental & Leasing (100.0%), whereas the industries that tend to have a higher number of women are Wholesale Trade (100.0%), Finance & Insurance (100.0%), and Enterprise Management (100.0%).
| Industry | Male | Female |
| Agriculture, Fishing & Hunting | 0 (0.0%) | 0 (0.0%) |
| Mining, Quarrying, & Extraction | 0 (0.0%) | 0 (0.0%) |
| Construction | 336 (96.8%) | 11 (3.2%) |
| Manufacturing | 241 (72.8%) | 90 (27.2%) |
| Wholesale Trade | 0 (0.0%) | 17 (100.0%) |
| Retail Trade | 193 (63.9%) | 109 (36.1%) |
| Transportation & Warehousing | 0 (0.0%) | 0 (0.0%) |
| Utilities | 37 (100.0%) | 0 (0.0%) |
| Information | 15 (100.0%) | 0 (0.0%) |
| Finance & Insurance | 0 (0.0%) | 19 (100.0%) |
| Real Estate, Rental & Leasing | 18 (100.0%) | 0 (0.0%) |
| Professional & Scientific | 61 (54.0%) | 52 (46.0%) |
| Enterprise Management | 0 (0.0%) | 9 (100.0%) |
| Administrative & Support | 34 (66.7%) | 17 (33.3%) |
| Educational Services | 15 (34.9%) | 28 (65.1%) |
| Health Care & Social Assistance | 105 (26.1%) | 297 (73.9%) |
| Arts, Entertainment & Recreation | 21 (55.3%) | 17 (44.7%) |
| Accommodation & Food Services | 9 (9.5%) | 86 (90.5%) |
| Public Administration | 107 (78.7%) | 29 (21.3%) |
| Total | 1,258 (57.5%) | 931 (42.5%) |
Education in Pearl Beach
School Enrollment in Pearl Beach
The most common levels of schooling among the 842 students in Pearl Beach are elementary school (262 | 31.1%), middle school (164 | 19.5%), and high school (148 | 17.6%).
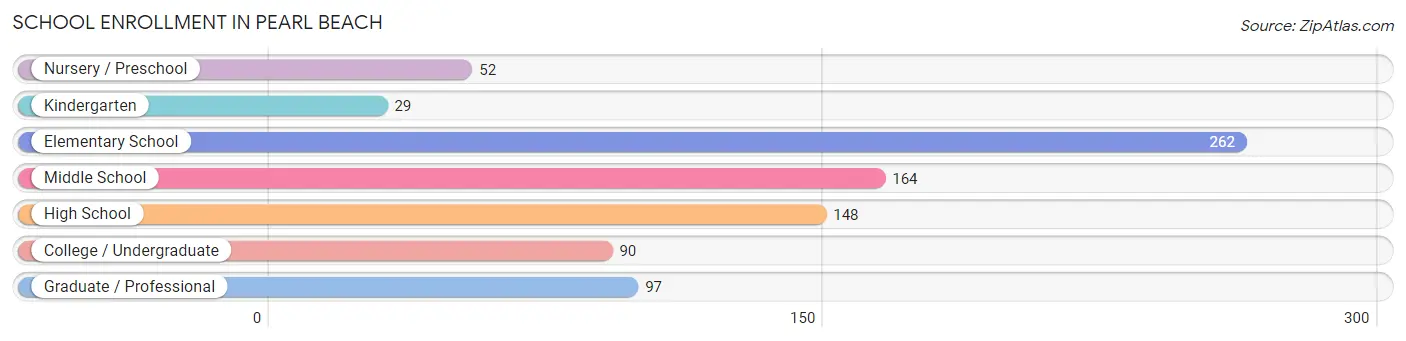
| School Level | # Students | % Students |
| Nursery / Preschool | 52 | 6.2% |
| Kindergarten | 29 | 3.4% |
| Elementary School | 262 | 31.1% |
| Middle School | 164 | 19.5% |
| High School | 148 | 17.6% |
| College / Undergraduate | 90 | 10.7% |
| Graduate / Professional | 97 | 11.5% |
| Total | 842 | 100.0% |
School Enrollment by Age by Funding Source in Pearl Beach
Out of a total of 842 students who are enrolled in schools in Pearl Beach, 161 (19.1%) attend a private institution, while the remaining 681 (80.9%) are enrolled in public schools. The age group of 35 years and over has the highest likelihood of being enrolled in private schools, with 55 (58.5% in the age bracket) enrolled. Conversely, the age group of 3 to 4 year olds has the lowest likelihood of being enrolled in a private school, with 10 (100.0% in the age bracket) attending a public institution.
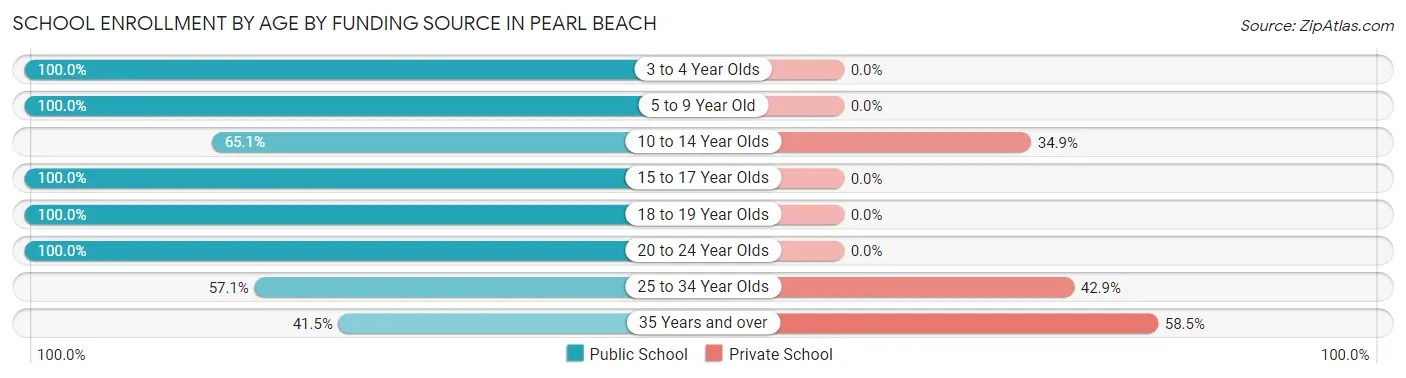
| Age Bracket | Public School | Private School |
| 3 to 4 Year Olds | 10 (100.0%) | 0 (0.0%) |
| 5 to 9 Year Old | 324 (100.0%) | 0 (0.0%) |
| 10 to 14 Year Olds | 142 (65.1%) | 76 (34.9%) |
| 15 to 17 Year Olds | 78 (100.0%) | 0 (0.0%) |
| 18 to 19 Year Olds | 25 (100.0%) | 0 (0.0%) |
| 20 to 24 Year Olds | 23 (100.0%) | 0 (0.0%) |
| 25 to 34 Year Olds | 40 (57.1%) | 30 (42.9%) |
| 35 Years and over | 39 (41.5%) | 55 (58.5%) |
| Total | 681 (80.9%) | 161 (19.1%) |
Educational Attainment by Field of Study in Pearl Beach
Business (160 | 20.2%), education (125 | 15.8%), arts & humanities (100 | 12.6%), science & technology (82 | 10.3%), and physical & health sciences (81 | 10.2%) are the most common fields of study among 793 individuals in Pearl Beach who have obtained a bachelor's degree or higher.
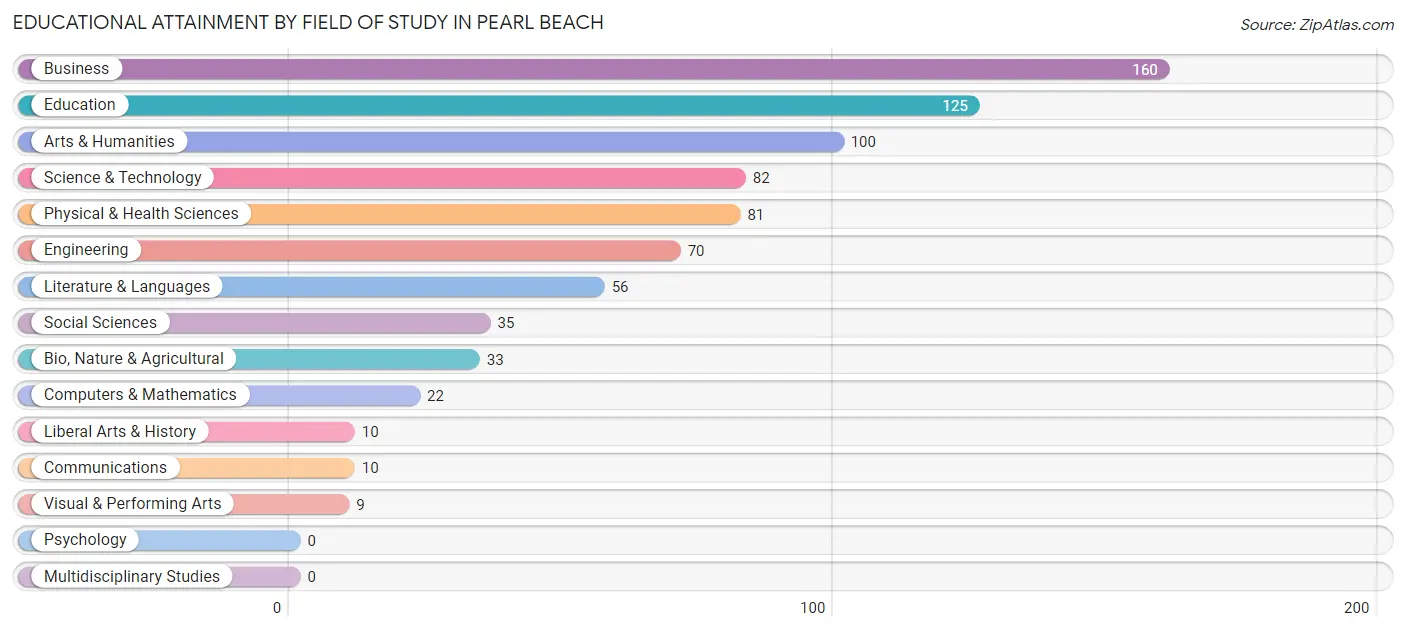
| Field of Study | # Graduates | % Graduates |
| Computers & Mathematics | 22 | 2.8% |
| Bio, Nature & Agricultural | 33 | 4.2% |
| Physical & Health Sciences | 81 | 10.2% |
| Psychology | 0 | 0.0% |
| Social Sciences | 35 | 4.4% |
| Engineering | 70 | 8.8% |
| Multidisciplinary Studies | 0 | 0.0% |
| Science & Technology | 82 | 10.3% |
| Business | 160 | 20.2% |
| Education | 125 | 15.8% |
| Literature & Languages | 56 | 7.1% |
| Liberal Arts & History | 10 | 1.3% |
| Visual & Performing Arts | 9 | 1.1% |
| Communications | 10 | 1.3% |
| Arts & Humanities | 100 | 12.6% |
| Total | 793 | 100.0% |
Transportation & Commute in Pearl Beach
Vehicle Availability by Sex in Pearl Beach
The most prevalent vehicle ownership categories in Pearl Beach are males with 2 vehicles (544, accounting for 44.6%) and females with 2 vehicles (400, making up 64.4%).
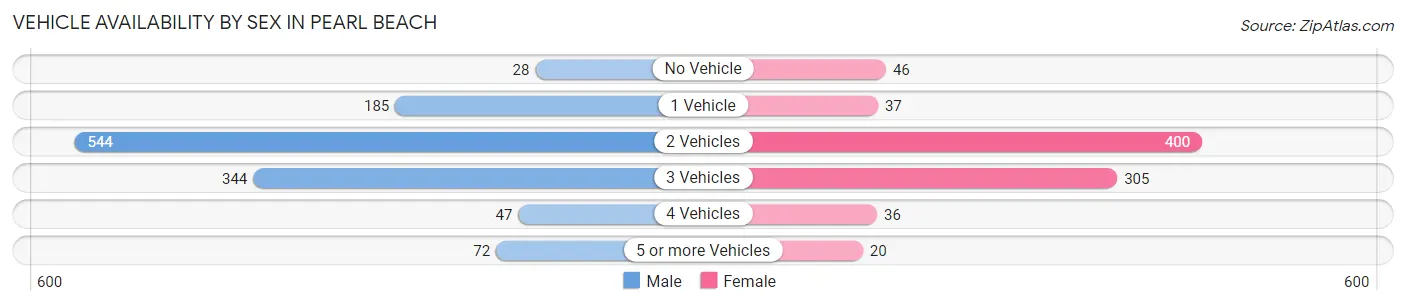
| Vehicles Available | Male | Female |
| No Vehicle | 28 (2.3%) | 46 (5.4%) |
| 1 Vehicle | 185 (15.2%) | 37 (4.4%) |
| 2 Vehicles | 544 (44.6%) | 400 (47.4%) |
| 3 Vehicles | 344 (28.2%) | 305 (36.1%) |
| 4 Vehicles | 47 (3.8%) | 36 (4.3%) |
| 5 or more Vehicles | 72 (5.9%) | 20 (2.4%) |
| Total | 1,220 (100.0%) | 844 (100.0%) |
Commute Time in Pearl Beach
The most frequently occuring commute durations in Pearl Beach are 30 to 34 minutes (330 commuters, 17.0%), 45 to 59 minutes (283 commuters, 14.6%), and 40 to 44 minutes (262 commuters, 13.5%).
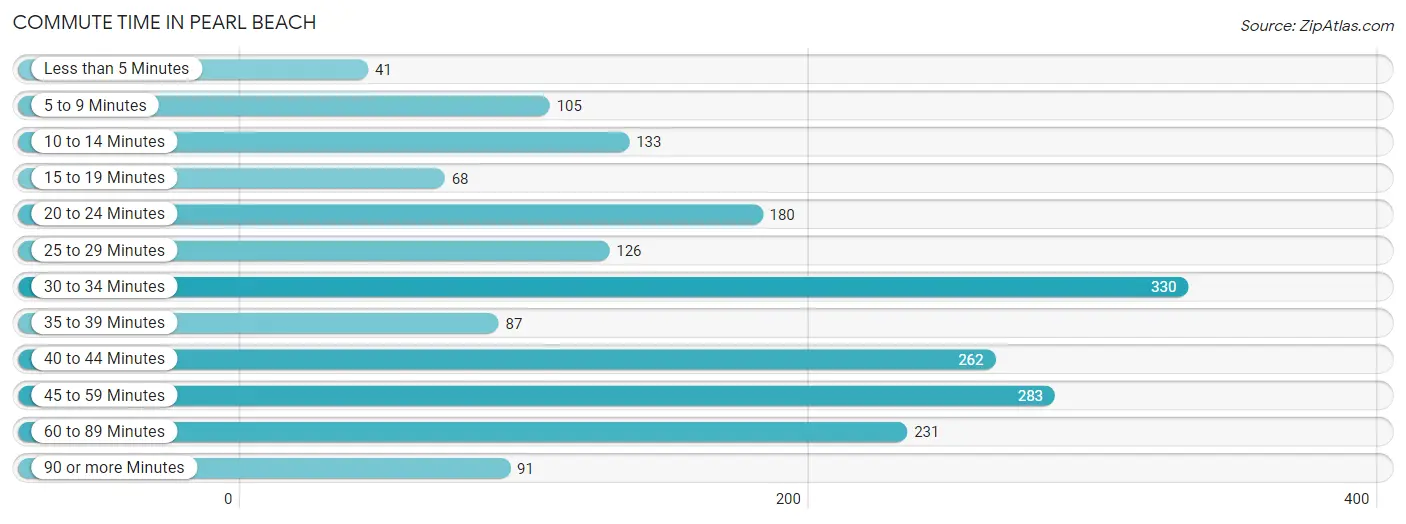
| Commute Time | # Commuters | % Commuters |
| Less than 5 Minutes | 41 | 2.1% |
| 5 to 9 Minutes | 105 | 5.4% |
| 10 to 14 Minutes | 133 | 6.9% |
| 15 to 19 Minutes | 68 | 3.5% |
| 20 to 24 Minutes | 180 | 9.3% |
| 25 to 29 Minutes | 126 | 6.5% |
| 30 to 34 Minutes | 330 | 17.0% |
| 35 to 39 Minutes | 87 | 4.5% |
| 40 to 44 Minutes | 262 | 13.5% |
| 45 to 59 Minutes | 283 | 14.6% |
| 60 to 89 Minutes | 231 | 11.9% |
| 90 or more Minutes | 91 | 4.7% |
Commute Time by Sex in Pearl Beach
The most common commute times in Pearl Beach are 30 to 34 minutes (279 commuters, 25.2%) for males and 45 to 59 minutes (175 commuters, 21.1%) for females.
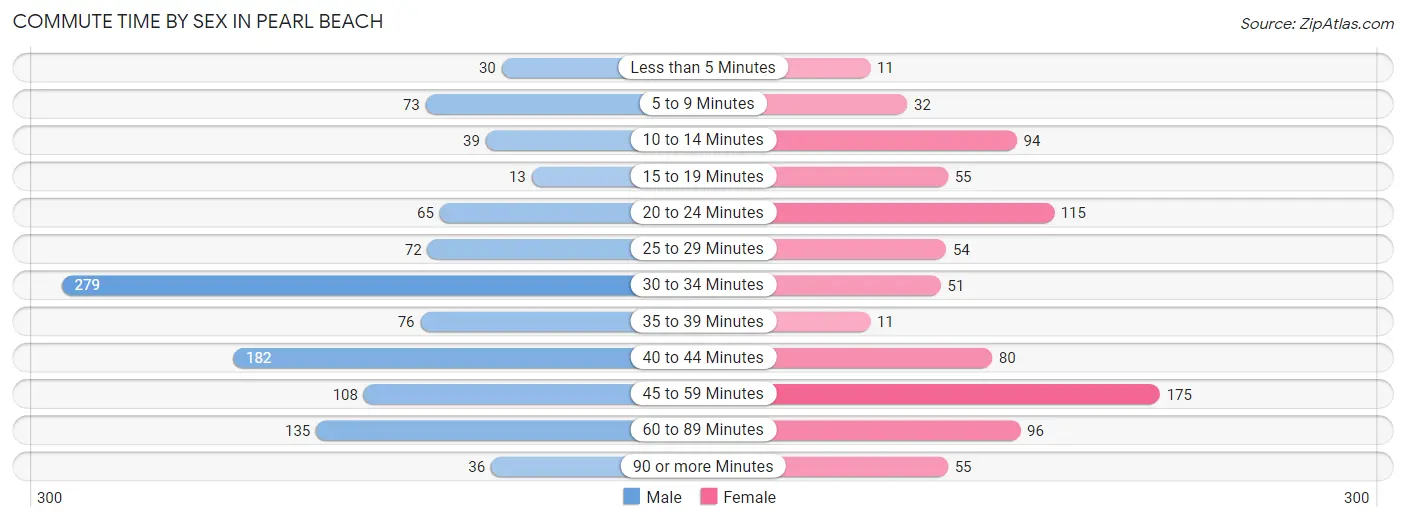
| Commute Time | Male | Female |
| Less than 5 Minutes | 30 (2.7%) | 11 (1.3%) |
| 5 to 9 Minutes | 73 (6.6%) | 32 (3.9%) |
| 10 to 14 Minutes | 39 (3.5%) | 94 (11.3%) |
| 15 to 19 Minutes | 13 (1.2%) | 55 (6.6%) |
| 20 to 24 Minutes | 65 (5.9%) | 115 (13.9%) |
| 25 to 29 Minutes | 72 (6.5%) | 54 (6.5%) |
| 30 to 34 Minutes | 279 (25.2%) | 51 (6.1%) |
| 35 to 39 Minutes | 76 (6.9%) | 11 (1.3%) |
| 40 to 44 Minutes | 182 (16.4%) | 80 (9.7%) |
| 45 to 59 Minutes | 108 (9.8%) | 175 (21.1%) |
| 60 to 89 Minutes | 135 (12.2%) | 96 (11.6%) |
| 90 or more Minutes | 36 (3.3%) | 55 (6.6%) |
Time of Departure to Work by Sex in Pearl Beach
The most frequent times of departure to work in Pearl Beach are 8:00 AM to 8:29 AM (165, 14.9%) for males and 7:00 AM to 7:29 AM (211, 25.5%) for females.
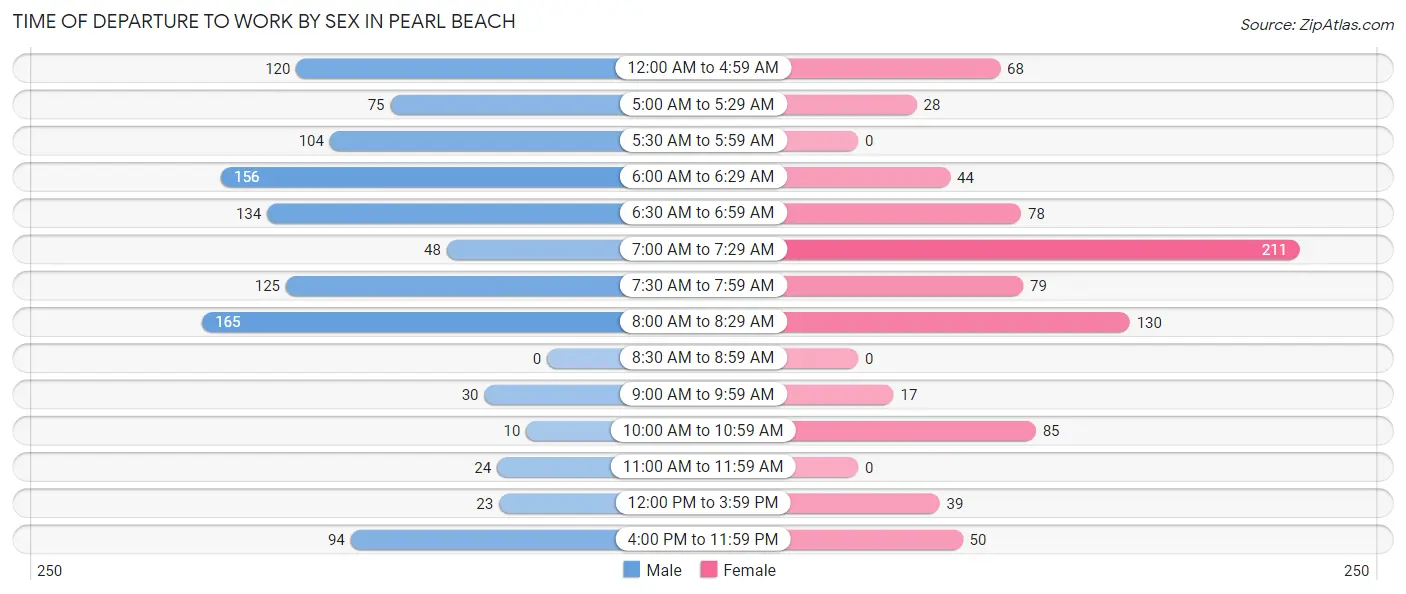
| Time of Departure | Male | Female |
| 12:00 AM to 4:59 AM | 120 (10.8%) | 68 (8.2%) |
| 5:00 AM to 5:29 AM | 75 (6.8%) | 28 (3.4%) |
| 5:30 AM to 5:59 AM | 104 (9.4%) | 0 (0.0%) |
| 6:00 AM to 6:29 AM | 156 (14.1%) | 44 (5.3%) |
| 6:30 AM to 6:59 AM | 134 (12.1%) | 78 (9.4%) |
| 7:00 AM to 7:29 AM | 48 (4.3%) | 211 (25.5%) |
| 7:30 AM to 7:59 AM | 125 (11.3%) | 79 (9.5%) |
| 8:00 AM to 8:29 AM | 165 (14.9%) | 130 (15.7%) |
| 8:30 AM to 8:59 AM | 0 (0.0%) | 0 (0.0%) |
| 9:00 AM to 9:59 AM | 30 (2.7%) | 17 (2.1%) |
| 10:00 AM to 10:59 AM | 10 (0.9%) | 85 (10.2%) |
| 11:00 AM to 11:59 AM | 24 (2.2%) | 0 (0.0%) |
| 12:00 PM to 3:59 PM | 23 (2.1%) | 39 (4.7%) |
| 4:00 PM to 11:59 PM | 94 (8.5%) | 50 (6.0%) |
| Total | 1,108 (100.0%) | 829 (100.0%) |
Housing Occupancy in Pearl Beach
Occupancy by Ownership in Pearl Beach
Of the total 2,337 dwellings in Pearl Beach, owner-occupied units account for 2,108 (90.2%), while renter-occupied units make up 229 (9.8%).
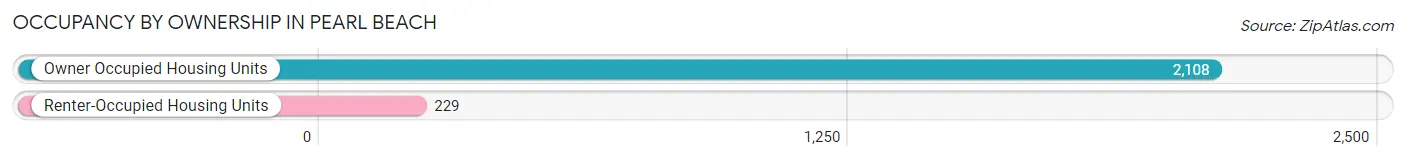
| Occupancy | # Housing Units | % Housing Units |
| Owner Occupied Housing Units | 2,108 | 90.2% |
| Renter-Occupied Housing Units | 229 | 9.8% |
| Total Occupied Housing Units | 2,337 | 100.0% |
Occupancy by Household Size in Pearl Beach
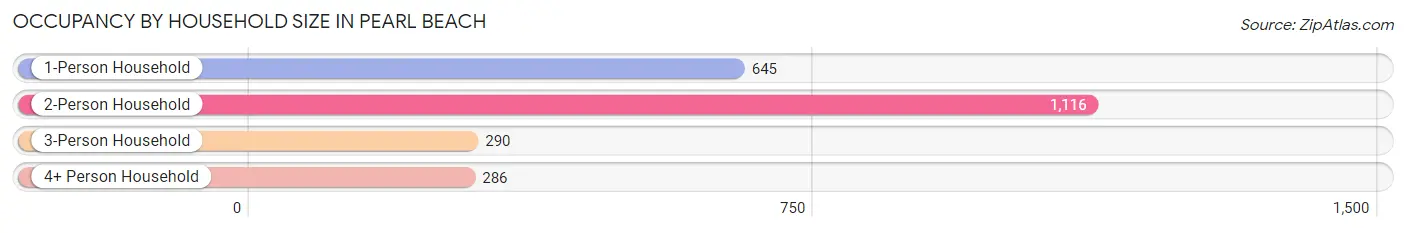
| Household Size | # Housing Units | % Housing Units |
| 1-Person Household | 645 | 27.6% |
| 2-Person Household | 1,116 | 47.7% |
| 3-Person Household | 290 | 12.4% |
| 4+ Person Household | 286 | 12.2% |
| Total Housing Units | 2,337 | 100.0% |
Occupancy by Ownership by Household Size in Pearl Beach
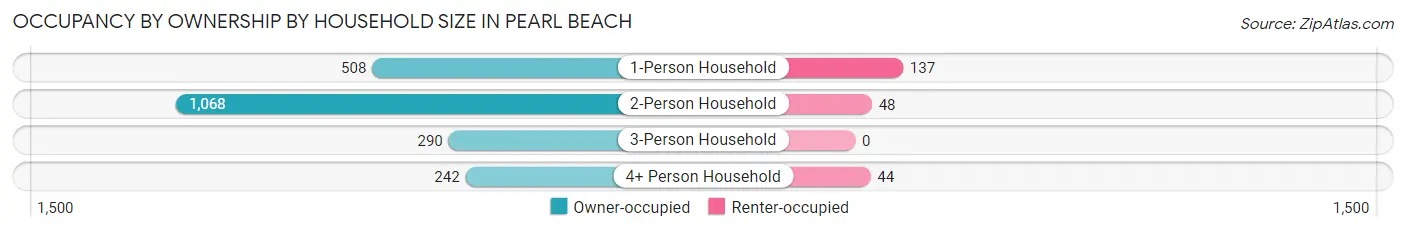
| Household Size | Owner-occupied | Renter-occupied |
| 1-Person Household | 508 (78.8%) | 137 (21.2%) |
| 2-Person Household | 1,068 (95.7%) | 48 (4.3%) |
| 3-Person Household | 290 (100.0%) | 0 (0.0%) |
| 4+ Person Household | 242 (84.6%) | 44 (15.4%) |
| Total Housing Units | 2,108 (90.2%) | 229 (9.8%) |
Occupancy by Educational Attainment in Pearl Beach
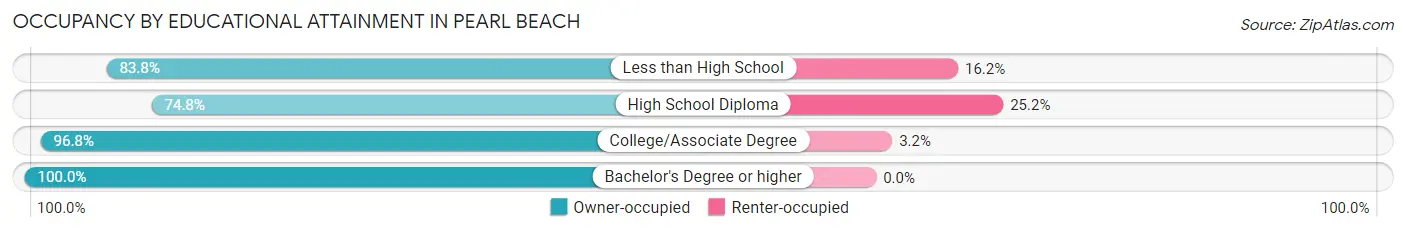
| Household Size | Owner-occupied | Renter-occupied |
| Less than High School | 165 (83.8%) | 32 (16.2%) |
| High School Diploma | 490 (74.8%) | 165 (25.2%) |
| College/Associate Degree | 973 (96.8%) | 32 (3.2%) |
| Bachelor's Degree or higher | 480 (100.0%) | 0 (0.0%) |
Occupancy by Age of Householder in Pearl Beach
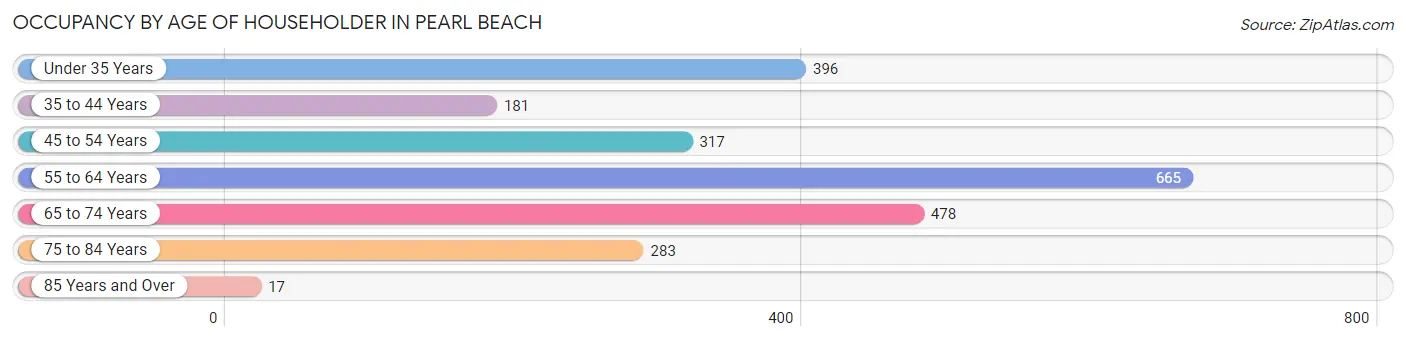
| Age Bracket | # Households | % Households |
| Under 35 Years | 396 | 16.9% |
| 35 to 44 Years | 181 | 7.7% |
| 45 to 54 Years | 317 | 13.6% |
| 55 to 64 Years | 665 | 28.5% |
| 65 to 74 Years | 478 | 20.4% |
| 75 to 84 Years | 283 | 12.1% |
| 85 Years and Over | 17 | 0.7% |
| Total | 2,337 | 100.0% |
Housing Finances in Pearl Beach
Median Income by Occupancy in Pearl Beach
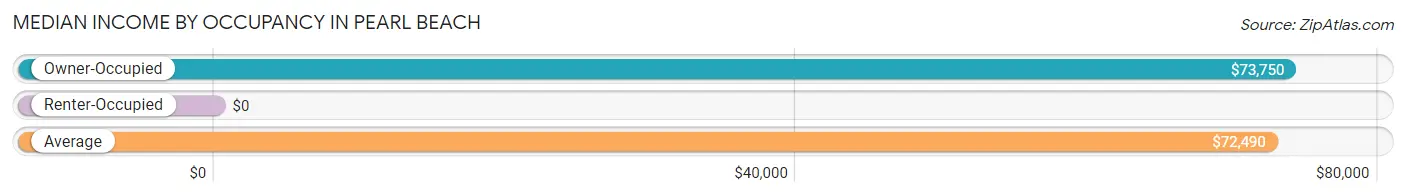
| Occupancy Type | # Households | Median Income |
| Owner-Occupied | 2,108 (90.2%) | $73,750 |
| Renter-Occupied | 229 (9.8%) | $0 |
| Average | 2,337 (100.0%) | $72,490 |
Occupancy by Householder Income Bracket in Pearl Beach
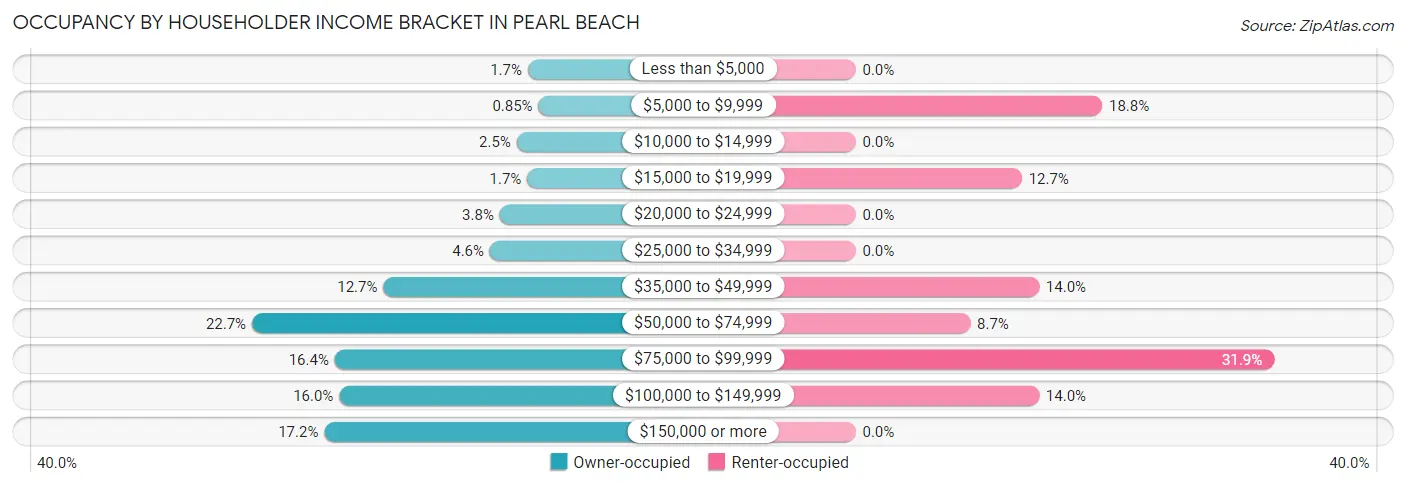
| Income Bracket | Owner-occupied | Renter-occupied |
| Less than $5,000 | 35 (1.7%) | 0 (0.0%) |
| $5,000 to $9,999 | 18 (0.9%) | 43 (18.8%) |
| $10,000 to $14,999 | 53 (2.5%) | 0 (0.0%) |
| $15,000 to $19,999 | 36 (1.7%) | 29 (12.7%) |
| $20,000 to $24,999 | 80 (3.8%) | 0 (0.0%) |
| $25,000 to $34,999 | 96 (4.5%) | 0 (0.0%) |
| $35,000 to $49,999 | 267 (12.7%) | 32 (14.0%) |
| $50,000 to $74,999 | 478 (22.7%) | 20 (8.7%) |
| $75,000 to $99,999 | 345 (16.4%) | 73 (31.9%) |
| $100,000 to $149,999 | 338 (16.0%) | 32 (14.0%) |
| $150,000 or more | 362 (17.2%) | 0 (0.0%) |
| Total | 2,108 (100.0%) | 229 (100.0%) |
Monthly Housing Cost Tiers in Pearl Beach
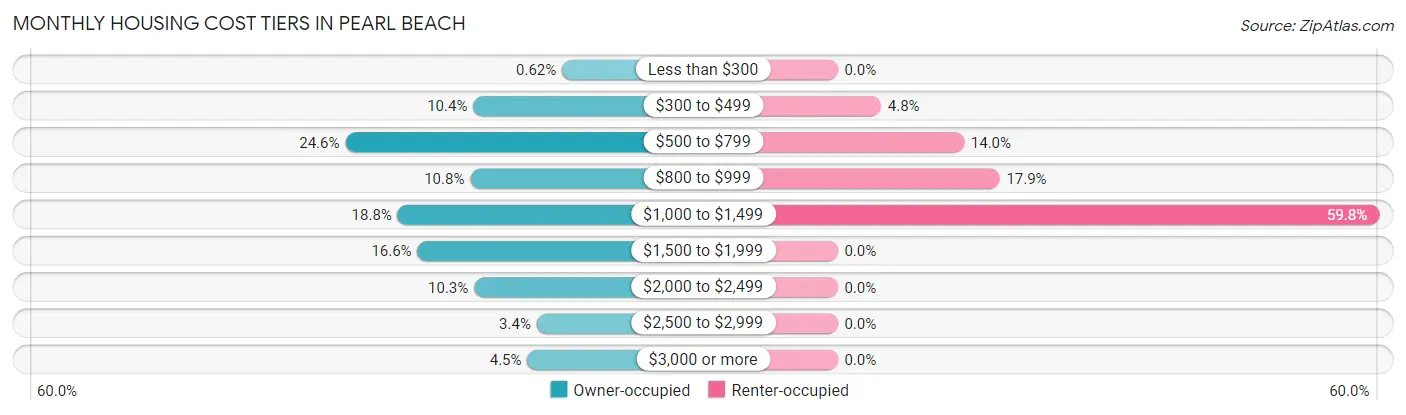
| Monthly Cost | Owner-occupied | Renter-occupied |
| Less than $300 | 13 (0.6%) | 0 (0.0%) |
| $300 to $499 | 220 (10.4%) | 11 (4.8%) |
| $500 to $799 | 518 (24.6%) | 32 (14.0%) |
| $800 to $999 | 227 (10.8%) | 41 (17.9%) |
| $1,000 to $1,499 | 396 (18.8%) | 137 (59.8%) |
| $1,500 to $1,999 | 350 (16.6%) | 0 (0.0%) |
| $2,000 to $2,499 | 218 (10.3%) | 0 (0.0%) |
| $2,500 to $2,999 | 72 (3.4%) | 0 (0.0%) |
| $3,000 or more | 94 (4.5%) | 0 (0.0%) |
| Total | 2,108 (100.0%) | 229 (100.0%) |
Physical Housing Characteristics in Pearl Beach
Housing Structures in Pearl Beach
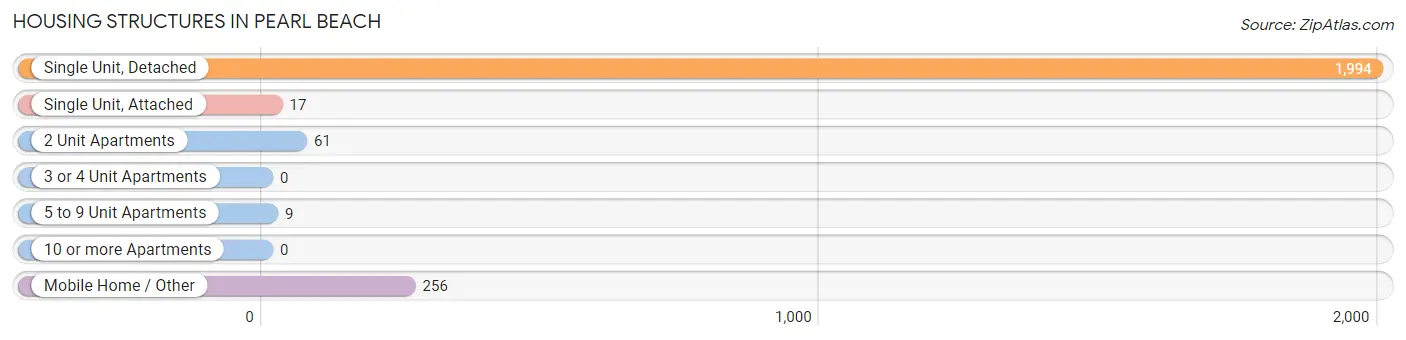
| Structure Type | # Housing Units | % Housing Units |
| Single Unit, Detached | 1,994 | 85.3% |
| Single Unit, Attached | 17 | 0.7% |
| 2 Unit Apartments | 61 | 2.6% |
| 3 or 4 Unit Apartments | 0 | 0.0% |
| 5 to 9 Unit Apartments | 9 | 0.4% |
| 10 or more Apartments | 0 | 0.0% |
| Mobile Home / Other | 256 | 11.0% |
| Total | 2,337 | 100.0% |
Housing Structures by Occupancy in Pearl Beach
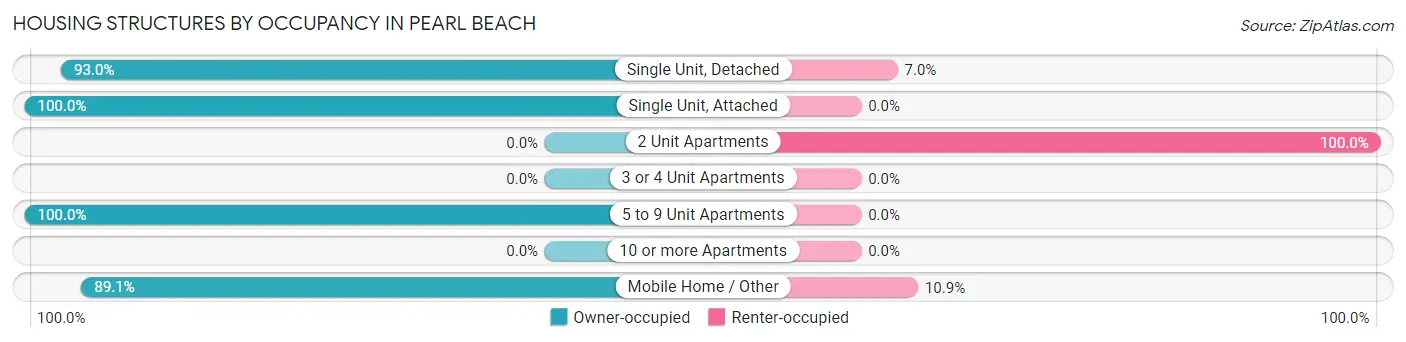
| Structure Type | Owner-occupied | Renter-occupied |
| Single Unit, Detached | 1,854 (93.0%) | 140 (7.0%) |
| Single Unit, Attached | 17 (100.0%) | 0 (0.0%) |
| 2 Unit Apartments | 0 (0.0%) | 61 (100.0%) |
| 3 or 4 Unit Apartments | 0 (0.0%) | 0 (0.0%) |
| 5 to 9 Unit Apartments | 9 (100.0%) | 0 (0.0%) |
| 10 or more Apartments | 0 (0.0%) | 0 (0.0%) |
| Mobile Home / Other | 228 (89.1%) | 28 (10.9%) |
| Total | 2,108 (90.2%) | 229 (9.8%) |
Housing Structures by Number of Rooms in Pearl Beach
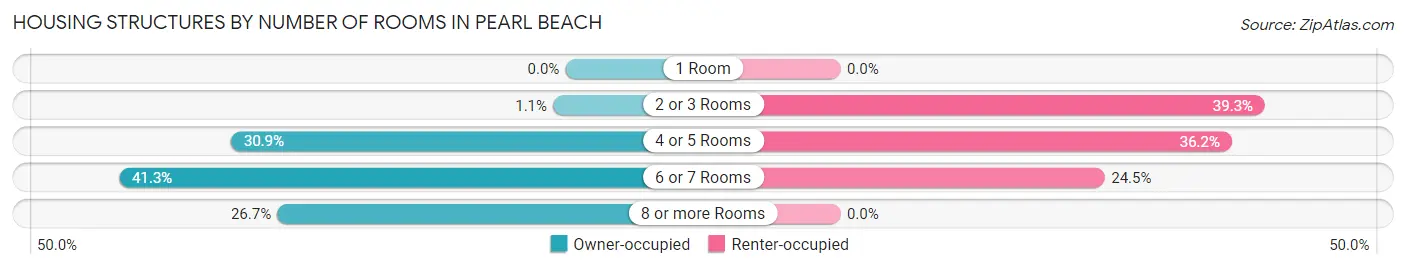
| Number of Rooms | Owner-occupied | Renter-occupied |
| 1 Room | 0 (0.0%) | 0 (0.0%) |
| 2 or 3 Rooms | 24 (1.1%) | 90 (39.3%) |
| 4 or 5 Rooms | 652 (30.9%) | 83 (36.2%) |
| 6 or 7 Rooms | 870 (41.3%) | 56 (24.4%) |
| 8 or more Rooms | 562 (26.7%) | 0 (0.0%) |
| Total | 2,108 (100.0%) | 229 (100.0%) |
Housing Structure by Heating Type in Pearl Beach
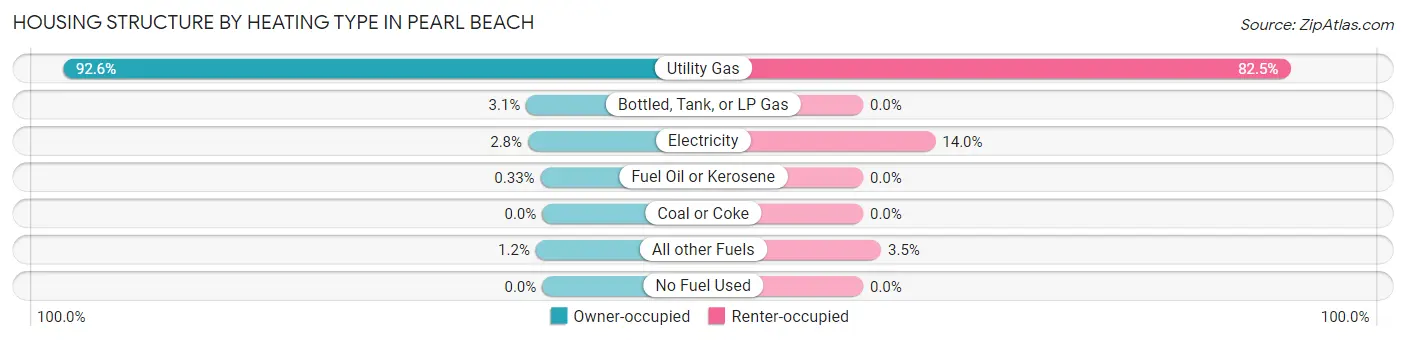
| Heating Type | Owner-occupied | Renter-occupied |
| Utility Gas | 1,952 (92.6%) | 189 (82.5%) |
| Bottled, Tank, or LP Gas | 65 (3.1%) | 0 (0.0%) |
| Electricity | 58 (2.8%) | 32 (14.0%) |
| Fuel Oil or Kerosene | 7 (0.3%) | 0 (0.0%) |
| Coal or Coke | 0 (0.0%) | 0 (0.0%) |
| All other Fuels | 26 (1.2%) | 8 (3.5%) |
| No Fuel Used | 0 (0.0%) | 0 (0.0%) |
| Total | 2,108 (100.0%) | 229 (100.0%) |
Household Vehicle Usage in Pearl Beach
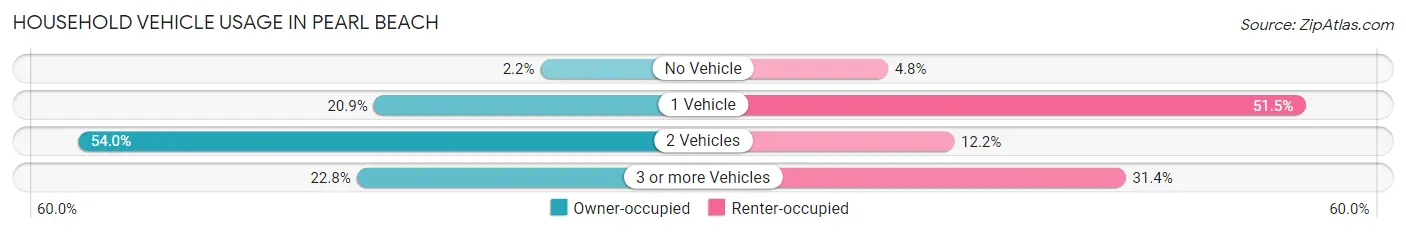
| Vehicles per Household | Owner-occupied | Renter-occupied |
| No Vehicle | 47 (2.2%) | 11 (4.8%) |
| 1 Vehicle | 441 (20.9%) | 118 (51.5%) |
| 2 Vehicles | 1,139 (54.0%) | 28 (12.2%) |
| 3 or more Vehicles | 481 (22.8%) | 72 (31.4%) |
| Total | 2,108 (100.0%) | 229 (100.0%) |
Real Estate & Mortgages in Pearl Beach
Real Estate and Mortgage Overview in Pearl Beach
| Characteristic | Without Mortgage | With Mortgage |
| Housing Units | 919 | 1,189 |
| Median Property Value | $262,100 | $317,900 |
| Median Household Income | $63,795 | $236 |
| Monthly Housing Costs | $588 | $94 |
| Real Estate Taxes | $3,504 | $79 |
Property Value by Mortgage Status in Pearl Beach
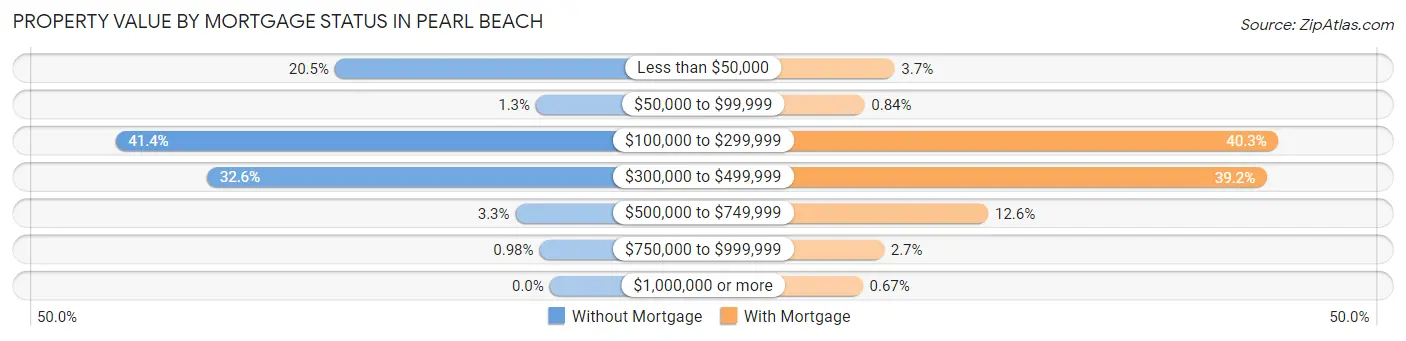
| Property Value | Without Mortgage | With Mortgage |
| Less than $50,000 | 188 (20.5%) | 44 (3.7%) |
| $50,000 to $99,999 | 12 (1.3%) | 10 (0.8%) |
| $100,000 to $299,999 | 380 (41.3%) | 479 (40.3%) |
| $300,000 to $499,999 | 300 (32.6%) | 466 (39.2%) |
| $500,000 to $749,999 | 30 (3.3%) | 150 (12.6%) |
| $750,000 to $999,999 | 9 (1.0%) | 32 (2.7%) |
| $1,000,000 or more | 0 (0.0%) | 8 (0.7%) |
| Total | 919 (100.0%) | 1,189 (100.0%) |
Household Income by Mortgage Status in Pearl Beach
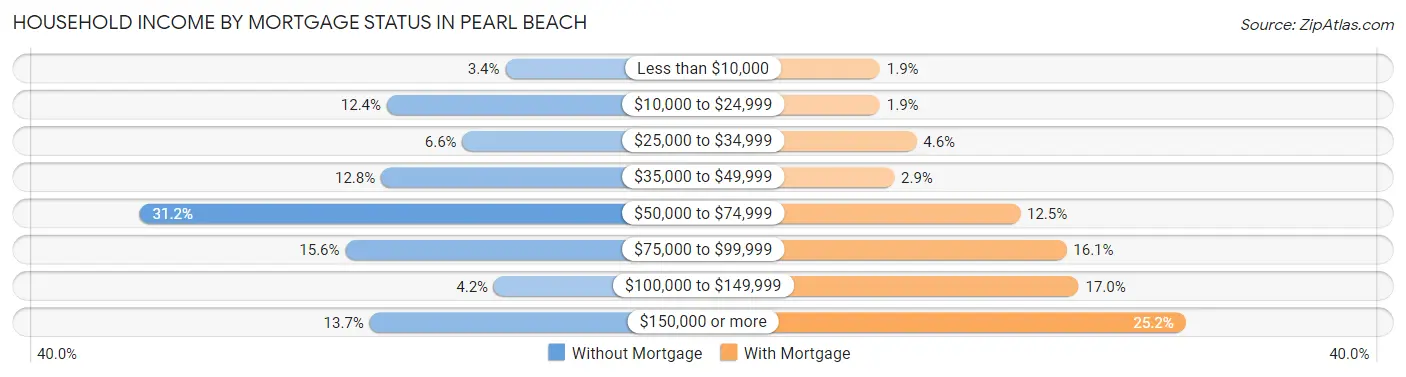
| Household Income | Without Mortgage | With Mortgage |
| Less than $10,000 | 31 (3.4%) | 22 (1.8%) |
| $10,000 to $24,999 | 114 (12.4%) | 22 (1.8%) |
| $25,000 to $34,999 | 61 (6.6%) | 55 (4.6%) |
| $35,000 to $49,999 | 118 (12.8%) | 35 (2.9%) |
| $50,000 to $74,999 | 287 (31.2%) | 149 (12.5%) |
| $75,000 to $99,999 | 143 (15.6%) | 191 (16.1%) |
| $100,000 to $149,999 | 39 (4.2%) | 202 (17.0%) |
| $150,000 or more | 126 (13.7%) | 299 (25.2%) |
| Total | 919 (100.0%) | 1,189 (100.0%) |
Property Value to Household Income Ratio in Pearl Beach
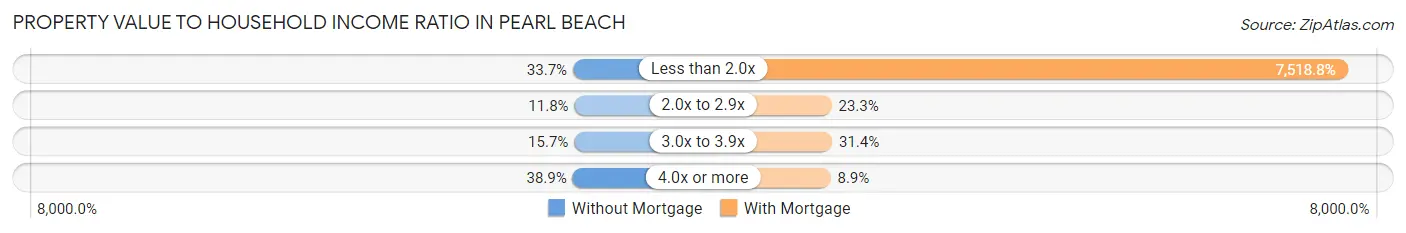
| Value-to-Income Ratio | Without Mortgage | With Mortgage |
| Less than 2.0x | 310 (33.7%) | 89,399 (7,518.8%) |
| 2.0x to 2.9x | 108 (11.7%) | 277 (23.3%) |
| 3.0x to 3.9x | 144 (15.7%) | 373 (31.4%) |
| 4.0x or more | 357 (38.9%) | 106 (8.9%) |
| Total | 919 (100.0%) | 1,189 (100.0%) |
Real Estate Taxes by Mortgage Status in Pearl Beach
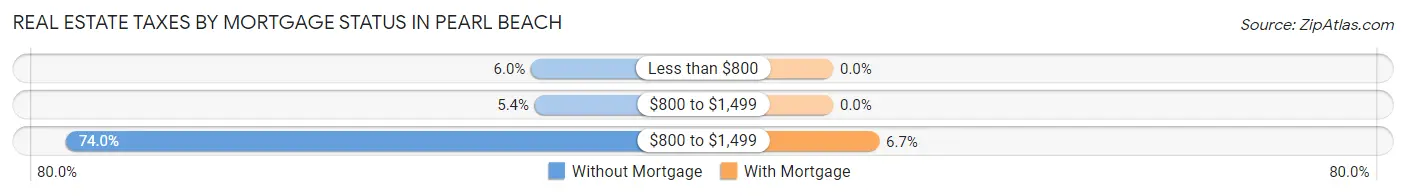
| Property Taxes | Without Mortgage | With Mortgage |
| Less than $800 | 55 (6.0%) | 0 (0.0%) |
| $800 to $1,499 | 50 (5.4%) | 0 (0.0%) |
| $800 to $1,499 | 680 (74.0%) | 80 (6.7%) |
| Total | 919 (100.0%) | 1,189 (100.0%) |
Health & Disability in Pearl Beach
Health Insurance Coverage by Age in Pearl Beach
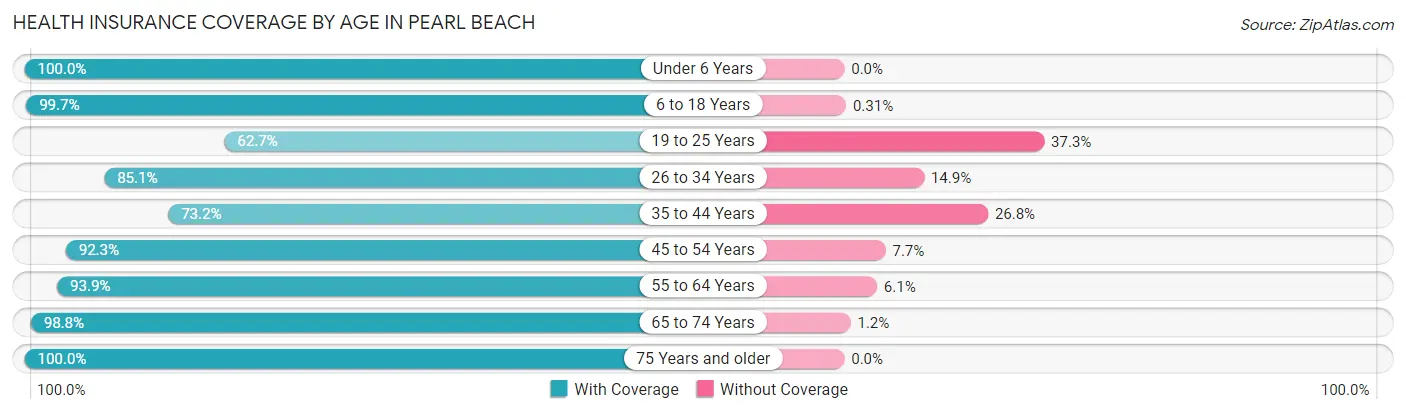
| Age Bracket | With Coverage | Without Coverage |
| Under 6 Years | 343 (100.0%) | 0 (0.0%) |
| 6 to 18 Years | 640 (99.7%) | 2 (0.3%) |
| 19 to 25 Years | 207 (62.7%) | 123 (37.3%) |
| 26 to 34 Years | 504 (85.1%) | 88 (14.9%) |
| 35 to 44 Years | 287 (73.2%) | 105 (26.8%) |
| 45 to 54 Years | 528 (92.3%) | 44 (7.7%) |
| 55 to 64 Years | 989 (93.9%) | 64 (6.1%) |
| 65 to 74 Years | 770 (98.8%) | 9 (1.2%) |
| 75 Years and older | 456 (100.0%) | 0 (0.0%) |
| Total | 4,724 (91.6%) | 435 (8.4%) |
Health Insurance Coverage by Citizenship Status in Pearl Beach
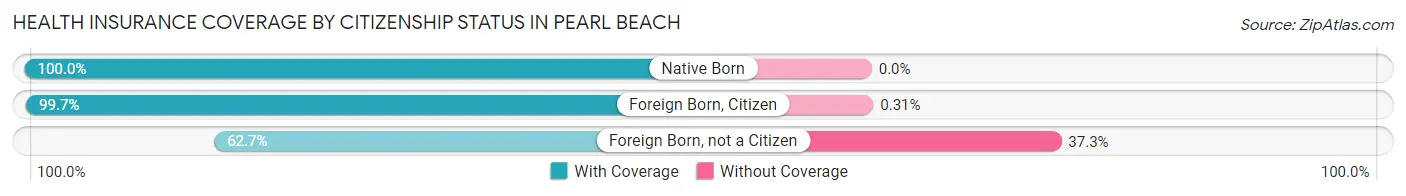
| Citizenship Status | With Coverage | Without Coverage |
| Native Born | 343 (100.0%) | 0 (0.0%) |
| Foreign Born, Citizen | 640 (99.7%) | 2 (0.3%) |
| Foreign Born, not a Citizen | 207 (62.7%) | 123 (37.3%) |
Health Insurance Coverage by Household Income in Pearl Beach
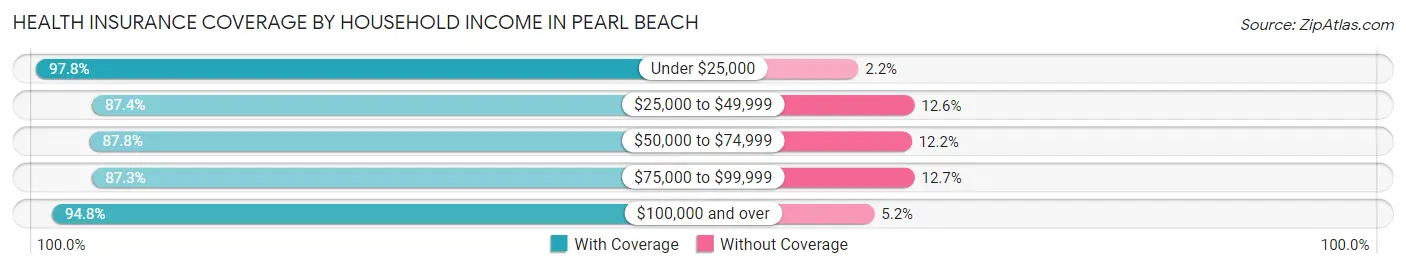
| Household Income | With Coverage | Without Coverage |
| Under $25,000 | 635 (97.8%) | 14 (2.2%) |
| $25,000 to $49,999 | 539 (87.4%) | 78 (12.6%) |
| $50,000 to $74,999 | 845 (87.8%) | 117 (12.2%) |
| $75,000 to $99,999 | 867 (87.3%) | 126 (12.7%) |
| $100,000 and over | 1,838 (94.8%) | 100 (5.2%) |
Public vs Private Health Insurance Coverage by Age in Pearl Beach
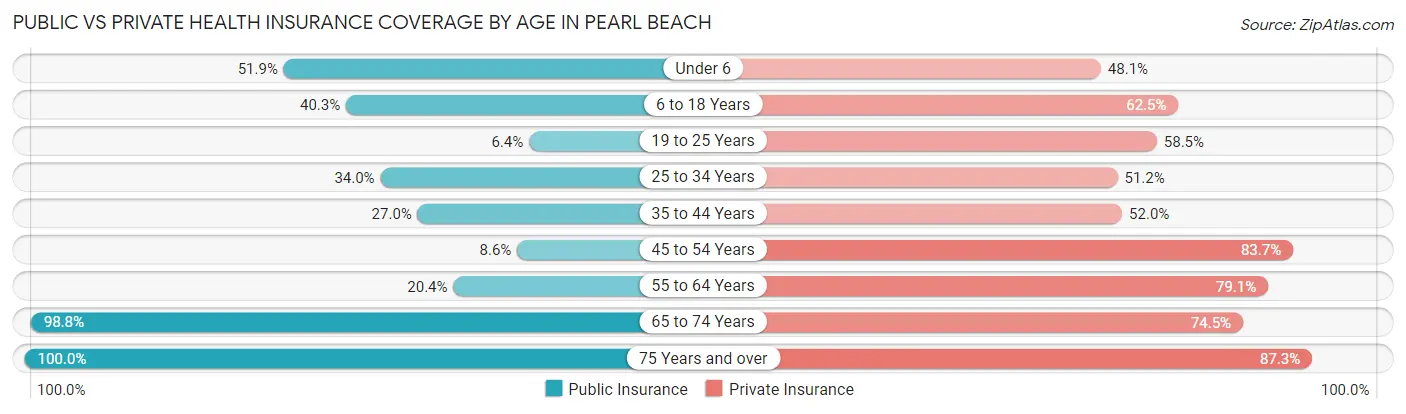
| Age Bracket | Public Insurance | Private Insurance |
| Under 6 | 178 (51.9%) | 165 (48.1%) |
| 6 to 18 Years | 259 (40.3%) | 401 (62.5%) |
| 19 to 25 Years | 21 (6.4%) | 193 (58.5%) |
| 25 to 34 Years | 201 (34.0%) | 303 (51.2%) |
| 35 to 44 Years | 106 (27.0%) | 204 (52.0%) |
| 45 to 54 Years | 49 (8.6%) | 479 (83.7%) |
| 55 to 64 Years | 215 (20.4%) | 833 (79.1%) |
| 65 to 74 Years | 770 (98.8%) | 580 (74.5%) |
| 75 Years and over | 456 (100.0%) | 398 (87.3%) |
| Total | 2,255 (43.7%) | 3,556 (68.9%) |
Disability Status by Sex by Age in Pearl Beach
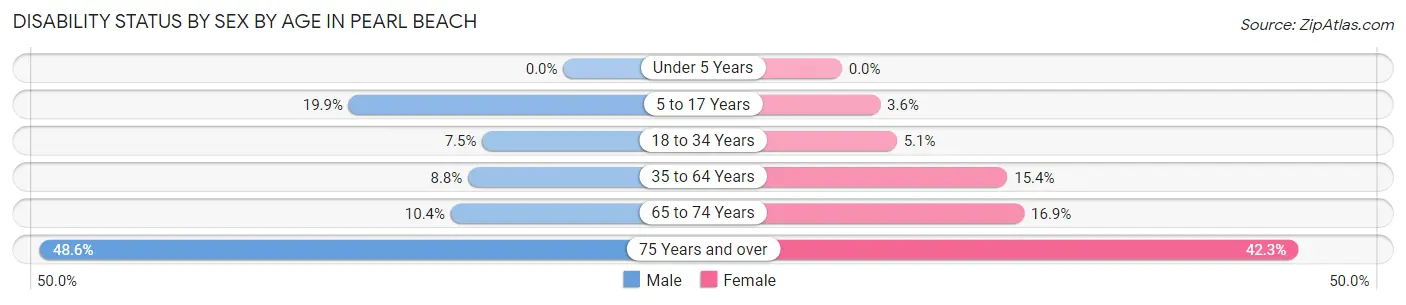
| Age Bracket | Male | Female |
| Under 5 Years | 0 (0.0%) | 0 (0.0%) |
| 5 to 17 Years | 86 (19.9%) | 8 (3.6%) |
| 18 to 34 Years | 33 (7.5%) | 26 (5.1%) |
| 35 to 64 Years | 96 (8.8%) | 143 (15.4%) |
| 65 to 74 Years | 40 (10.4%) | 67 (16.9%) |
| 75 Years and over | 101 (48.6%) | 105 (42.3%) |
Disability Class by Sex by Age in Pearl Beach
Disability Class: Hearing Difficulty
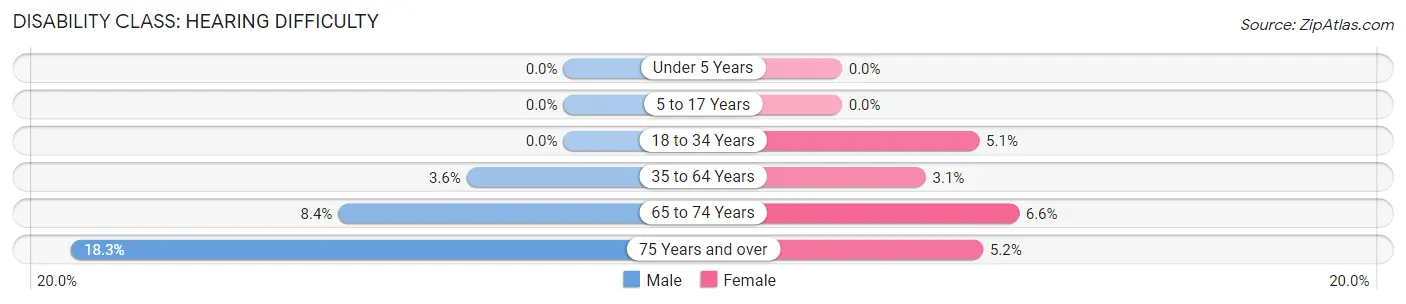
| Age Bracket | Male | Female |
| Under 5 Years | 0 (0.0%) | 0 (0.0%) |
| 5 to 17 Years | 0 (0.0%) | 0 (0.0%) |
| 18 to 34 Years | 0 (0.0%) | 26 (5.1%) |
| 35 to 64 Years | 39 (3.6%) | 29 (3.1%) |
| 65 to 74 Years | 32 (8.4%) | 26 (6.6%) |
| 75 Years and over | 38 (18.3%) | 13 (5.2%) |
Disability Class: Vision Difficulty
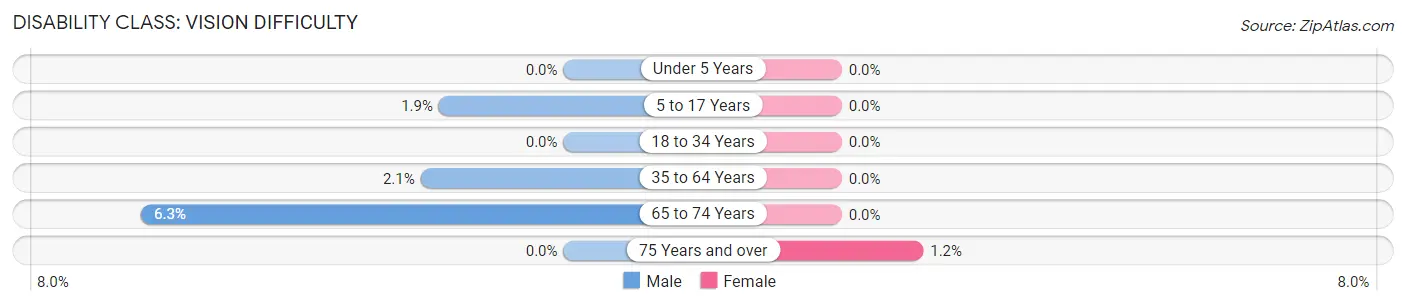
| Age Bracket | Male | Female |
| Under 5 Years | 0 (0.0%) | 0 (0.0%) |
| 5 to 17 Years | 8 (1.8%) | 0 (0.0%) |
| 18 to 34 Years | 0 (0.0%) | 0 (0.0%) |
| 35 to 64 Years | 23 (2.1%) | 0 (0.0%) |
| 65 to 74 Years | 24 (6.3%) | 0 (0.0%) |
| 75 Years and over | 0 (0.0%) | 3 (1.2%) |
Disability Class: Cognitive Difficulty
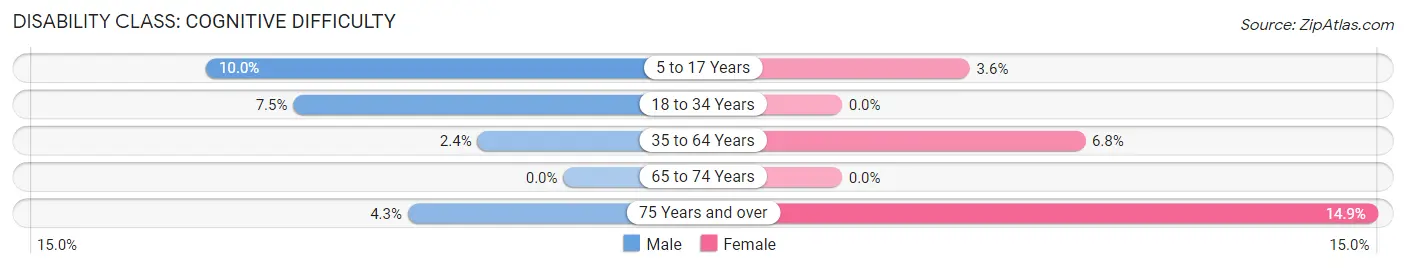
| Age Bracket | Male | Female |
| 5 to 17 Years | 43 (10.0%) | 8 (3.6%) |
| 18 to 34 Years | 33 (7.5%) | 0 (0.0%) |
| 35 to 64 Years | 26 (2.4%) | 63 (6.8%) |
| 65 to 74 Years | 0 (0.0%) | 0 (0.0%) |
| 75 Years and over | 9 (4.3%) | 37 (14.9%) |
Disability Class: Ambulatory Difficulty
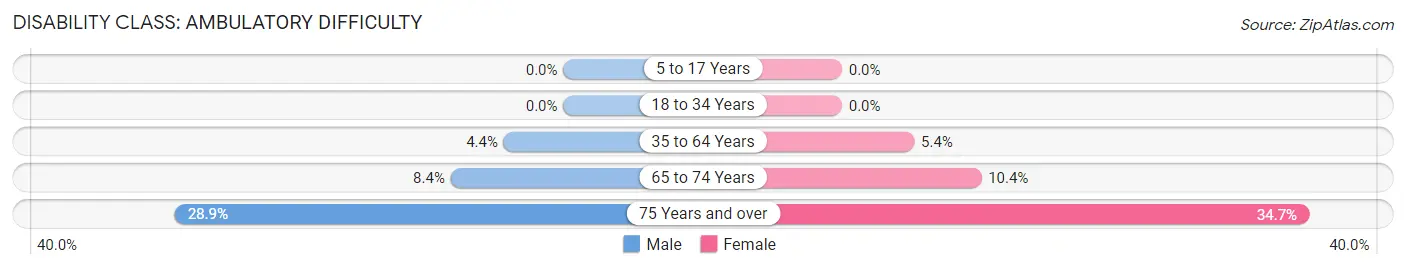
| Age Bracket | Male | Female |
| 5 to 17 Years | 0 (0.0%) | 0 (0.0%) |
| 18 to 34 Years | 0 (0.0%) | 0 (0.0%) |
| 35 to 64 Years | 48 (4.4%) | 50 (5.4%) |
| 65 to 74 Years | 32 (8.4%) | 41 (10.3%) |
| 75 Years and over | 60 (28.8%) | 86 (34.7%) |
Disability Class: Self-Care Difficulty
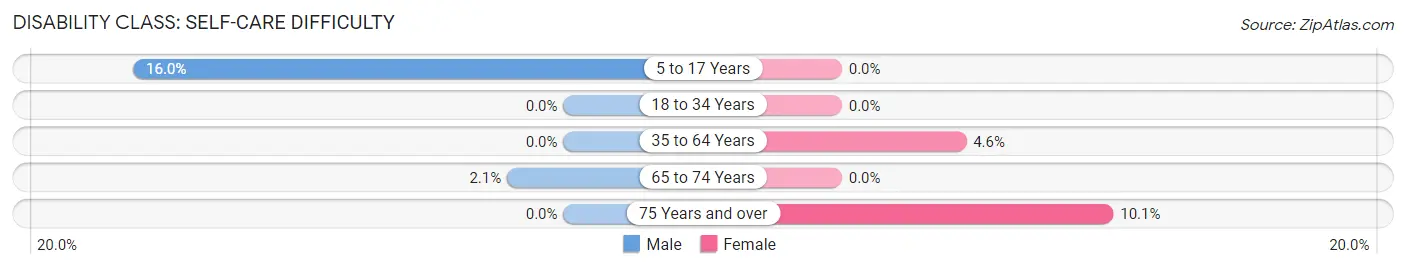
| Age Bracket | Male | Female |
| 5 to 17 Years | 69 (16.0%) | 0 (0.0%) |
| 18 to 34 Years | 0 (0.0%) | 0 (0.0%) |
| 35 to 64 Years | 0 (0.0%) | 43 (4.6%) |
| 65 to 74 Years | 8 (2.1%) | 0 (0.0%) |
| 75 Years and over | 0 (0.0%) | 25 (10.1%) |
Technology Access in Pearl Beach
Computing Device Access in Pearl Beach
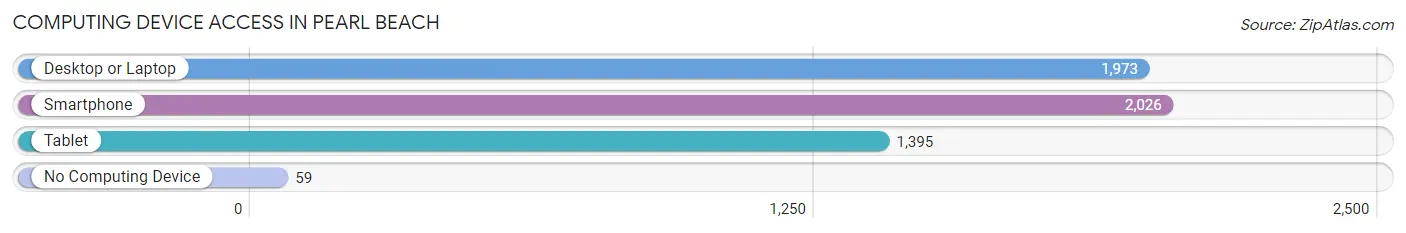
| Device Type | # Households | % Households |
| Desktop or Laptop | 1,973 | 84.4% |
| Smartphone | 2,026 | 86.7% |
| Tablet | 1,395 | 59.7% |
| No Computing Device | 59 | 2.5% |
| Total | 2,337 | 100.0% |
Internet Access in Pearl Beach
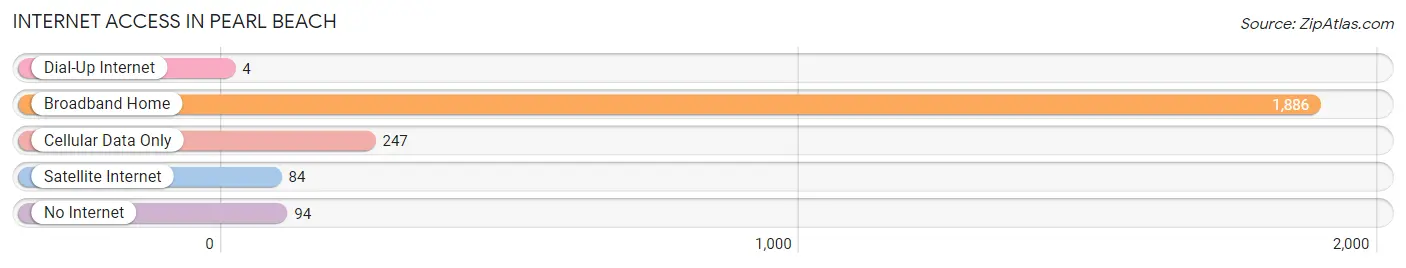
| Internet Type | # Households | % Households |
| Dial-Up Internet | 4 | 0.2% |
| Broadband Home | 1,886 | 80.7% |
| Cellular Data Only | 247 | 10.6% |
| Satellite Internet | 84 | 3.6% |
| No Internet | 94 | 4.0% |
| Total | 2,337 | 100.0% |
Pearl Beach Summary
Pearl Beach is a small unincorporated community located in St. Clair County, Michigan. It is situated on the western shore of Lake Huron, approximately 25 miles northeast of Port Huron. The community is part of the Thumb region of Michigan and is bordered by the townships of Clay, Grant, and Burtchville.
History
Pearl Beach was first settled in the late 1800s by a group of fishermen from Canada. The fishermen were attracted to the area due to its abundance of fish and the easy access to Lake Huron. The community was originally known as “Fisherman’s Point” and was later renamed “Pearl Beach” in honor of the pearl-like shells found in the area.
In the early 1900s, the community began to grow as more people moved to the area. The first post office was established in 1906 and the first school was built in 1908. The community was also home to a number of businesses, including a general store, a hotel, and a dance hall.
In the 1920s, the community began to decline as the fishing industry declined and the population began to move away. The post office closed in 1929 and the school closed in 1933. The community was largely abandoned by the 1950s.
In the late 1970s, the community began to experience a resurgence as people began to move back to the area. The post office was reopened in 1979 and the school was reopened in 1980. The community has since experienced a slow but steady growth and is now home to a number of businesses, including a marina, a restaurant, and a bed and breakfast.
Geography
Pearl Beach is located on the western shore of Lake Huron, approximately 25 miles northeast of Port Huron. The community is part of the Thumb region of Michigan and is bordered by the townships of Clay, Grant, and Burtchville.
The community is situated on a small peninsula that juts out into Lake Huron. The peninsula is surrounded by a number of small islands, including Middle Island, North Island, and South Island. The peninsula is also home to a number of small coves and inlets, including Pearl Beach Cove and Little Cove.
The community is located in a temperate climate zone and experiences warm summers and cold winters. The average temperature in the summer is around 70 degrees Fahrenheit and the average temperature in the winter is around 30 degrees Fahrenheit.
Economy
The economy of Pearl Beach is largely based on tourism and fishing. The community is home to a number of businesses, including a marina, a restaurant, and a bed and breakfast. The marina offers boat rentals and fishing charters, while the restaurant and bed and breakfast offer a variety of dining and lodging options.
The community is also home to a number of small businesses, including a bait shop, a convenience store, and a gift shop. The bait shop offers a variety of fishing supplies, while the convenience store offers a variety of groceries and other items. The gift shop offers a variety of souvenirs and other items.
Demographics
As of the 2010 census, the population of Pearl Beach was 545. The population is largely white (97.3%) and the median age is 44. The median household income is $45,000 and the median home value is $150,000.
Conclusion
Pearl Beach is a small unincorporated community located in St. Clair County, Michigan. It is situated on the western shore of Lake Huron, approximately 25 miles northeast of Port Huron. The community is part of the Thumb region of Michigan and is bordered by the townships of Clay, Grant, and Burtchville. The economy of Pearl Beach is largely based on tourism and fishing, and the population is largely white. The median age is 44 and the median household income is $45,000.
Common Questions
What is Per Capita Income in Pearl Beach?
Per Capita income in Pearl Beach is $40,294.
What is the Median Family Income in Pearl Beach?
Median Family Income in Pearl Beach is $87,948.
What is the Median Household income in Pearl Beach?
Median Household Income in Pearl Beach is $72,490.
What is Income or Wage Gap in Pearl Beach?
Income or Wage Gap in Pearl Beach is 69.2%.
Women in Pearl Beach earn 30.8 cents for every dollar earned by a man.
What is Family Income Deficit in Pearl Beach?
Family Income Deficit in Pearl Beach is $13,313.
Families that are below poverty line in Pearl Beach earn $13,313 less on average than the poverty threshold level.
What is Inequality or Gini Index in Pearl Beach?
Inequality or Gini Index in Pearl Beach is 0.38.
What is the Total Population of Pearl Beach?
Total Population of Pearl Beach is 5,159.
What is the Total Male Population of Pearl Beach?
Total Male Population of Pearl Beach is 2,662.
What is the Total Female Population of Pearl Beach?
Total Female Population of Pearl Beach is 2,497.
What is the Ratio of Males per 100 Females in Pearl Beach?
There are 106.61 Males per 100 Females in Pearl Beach.
What is the Ratio of Females per 100 Males in Pearl Beach?
There are 93.80 Females per 100 Males in Pearl Beach.
What is the Median Population Age in Pearl Beach?
Median Population Age in Pearl Beach is 51.2 Years.
What is the Average Family Size in Pearl Beach
Average Family Size in Pearl Beach is 2.8 People.
What is the Average Household Size in Pearl Beach
Average Household Size in Pearl Beach is 2.2 People.
How Large is the Labor Force in Pearl Beach?
There are 2,288 People in the Labor Forcein in Pearl Beach.
What is the Percentage of People in the Labor Force in Pearl Beach?
53.8% of People are in the Labor Force in Pearl Beach.
What is the Unemployment Rate in Pearl Beach?
Unemployment Rate in Pearl Beach is 4.3%.