Forestville, MI Map & Demographics
Forestville Map
Forestville Overview
$28,820
PER CAPITA INCOME
$42,500
AVG HOUSEHOLD INCOME
0.41
INEQUALITY / GINI INDEX
132
TOTAL POPULATION
65
MALE POPULATION
67
FEMALE POPULATION
97.01
MALES / 100 FEMALES
103.08
FEMALES / 100 MALES
62.8
MEDIAN AGE
2.4
AVG FAMILY SIZE
2.1
AVG HOUSEHOLD SIZE
33
LABOR FORCE [ PEOPLE ]
27.7%
PERCENT IN LABOR FORCE
Forestville Zip Codes
Income in Forestville
Income Overview in Forestville
| Characteristic | Number | Measure |
| Per Capita Income | 132 | $28,820 |
| Median Family Income | 46 | $0 |
| Mean Family Income | 46 | $47,683 |
| Median Household Income | 64 | $42,500 |
| Mean Household Income | 64 | $55,211 |
| Income Deficit | 46 | $0 |
| Wage / Income Gap (%) | 132 | 0.00% |
| Wage / Income Gap ($) | 132 | 100.00¢ per $1 |
| Gini / Inequality Index | 132 | 0.41 |
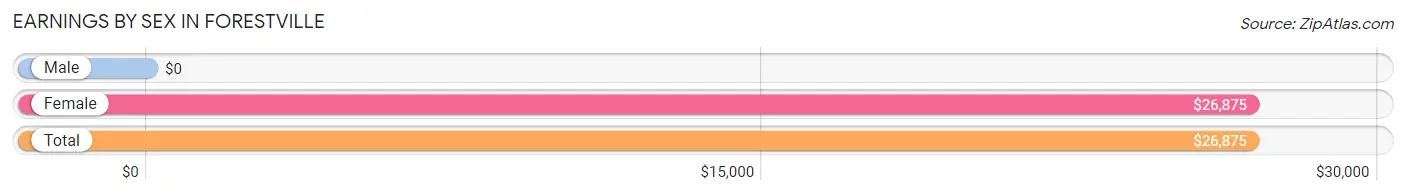
Earnings by Sex in Forestville
| Sex | Number | Average Earnings |
| Male | 16 (40.0%) | $0 |
| Female | 24 (60.0%) | $26,875 |
| Total | 40 (100.0%) | $26,875 |
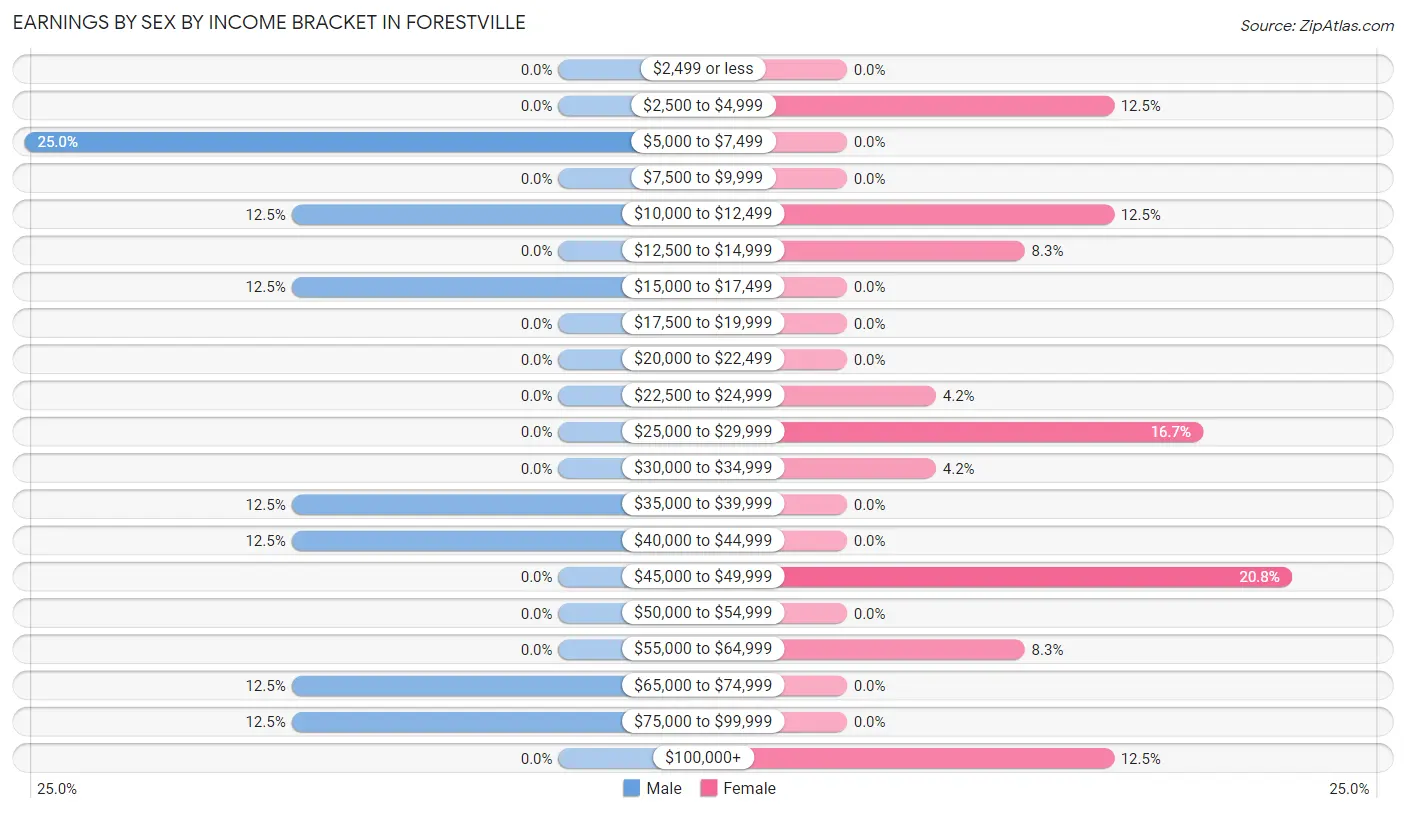
Earnings by Sex by Income Bracket in Forestville
The most common earnings brackets in Forestville are $5,000 to $7,499 for men (4 | 25.0%) and $45,000 to $49,999 for women (5 | 20.8%).
| Income | Male | Female |
| $2,499 or less | 0 (0.0%) | 0 (0.0%) |
| $2,500 to $4,999 | 0 (0.0%) | 3 (12.5%) |
| $5,000 to $7,499 | 4 (25.0%) | 0 (0.0%) |
| $7,500 to $9,999 | 0 (0.0%) | 0 (0.0%) |
| $10,000 to $12,499 | 2 (12.5%) | 3 (12.5%) |
| $12,500 to $14,999 | 0 (0.0%) | 2 (8.3%) |
| $15,000 to $17,499 | 2 (12.5%) | 0 (0.0%) |
| $17,500 to $19,999 | 0 (0.0%) | 0 (0.0%) |
| $20,000 to $22,499 | 0 (0.0%) | 0 (0.0%) |
| $22,500 to $24,999 | 0 (0.0%) | 1 (4.2%) |
| $25,000 to $29,999 | 0 (0.0%) | 4 (16.7%) |
| $30,000 to $34,999 | 0 (0.0%) | 1 (4.2%) |
| $35,000 to $39,999 | 2 (12.5%) | 0 (0.0%) |
| $40,000 to $44,999 | 2 (12.5%) | 0 (0.0%) |
| $45,000 to $49,999 | 0 (0.0%) | 5 (20.8%) |
| $50,000 to $54,999 | 0 (0.0%) | 0 (0.0%) |
| $55,000 to $64,999 | 0 (0.0%) | 2 (8.3%) |
| $65,000 to $74,999 | 2 (12.5%) | 0 (0.0%) |
| $75,000 to $99,999 | 2 (12.5%) | 0 (0.0%) |
| $100,000+ | 0 (0.0%) | 3 (12.5%) |
| Total | 16 (100.0%) | 24 (100.0%) |
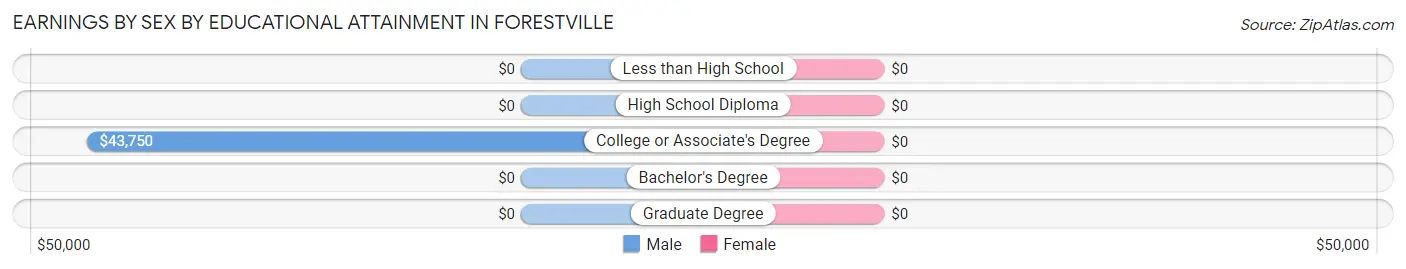
Earnings by Sex by Educational Attainment in Forestville
| Educational Attainment | Male Income | Female Income |
| Less than High School | - | - |
| High School Diploma | - | - |
| College or Associate's Degree | $43,750 | $0 |
| Bachelor's Degree | - | - |
| Graduate Degree | - | - |
| Total | $38,750 | $27,188 |
Family Income in Forestville
Family Income Brackets in Forestville
According to the Forestville family income data, there are 17 families falling into the $10,000 to $14,999 income range, which is the most common income bracket and makes up 37.0% of all families.
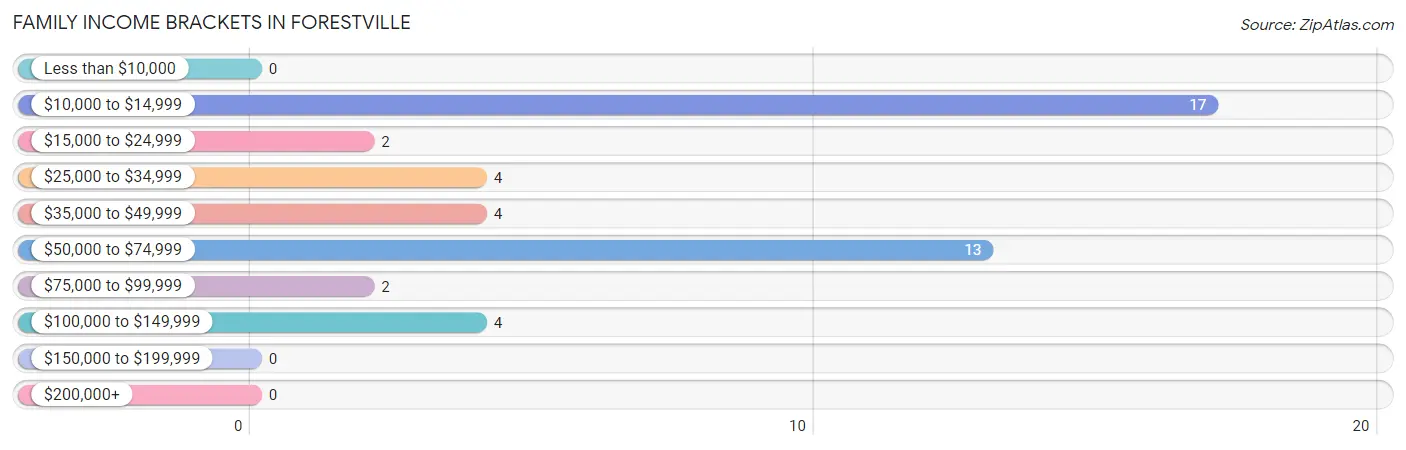
| Income Bracket | # Families | % Families |
| Less than $10,000 | 0 | 0.0% |
| $10,000 to $14,999 | 17 | 37.0% |
| $15,000 to $24,999 | 2 | 4.3% |
| $25,000 to $34,999 | 4 | 8.7% |
| $35,000 to $49,999 | 4 | 8.7% |
| $50,000 to $74,999 | 13 | 28.3% |
| $75,000 to $99,999 | 2 | 4.3% |
| $100,000 to $149,999 | 4 | 8.7% |
| $150,000 to $199,999 | 0 | 0.0% |
| $200,000+ | 0 | 0.0% |
Family Income by Famaliy Size in Forestville
| Income Bracket | # Families | Median Income |
| 2-Person Families | 37 (80.4%) | $0 |
| 3-Person Families | 3 (6.5%) | $0 |
| 4-Person Families | 2 (4.3%) | $0 |
| 5-Person Families | 0 (0.0%) | $0 |
| 6-Person Families | 4 (8.7%) | $0 |
| 7+ Person Families | 0 (0.0%) | $0 |
| Total | 46 (100.0%) | $0 |
Family Income by Number of Earners in Forestville
| Number of Earners | # Families | Median Income |
| No Earners | 32 (69.6%) | $0 |
| 1 Earner | 8 (17.4%) | $0 |
| 2 Earners | 3 (6.5%) | $0 |
| 3+ Earners | 3 (6.5%) | $0 |
| Total | 46 (100.0%) | $0 |
Household Income in Forestville
Household Income Brackets in Forestville
With 17 households falling in the category, the $10,000 to $14,999 income range is the most frequent in Forestville, accounting for 26.6% of all households.
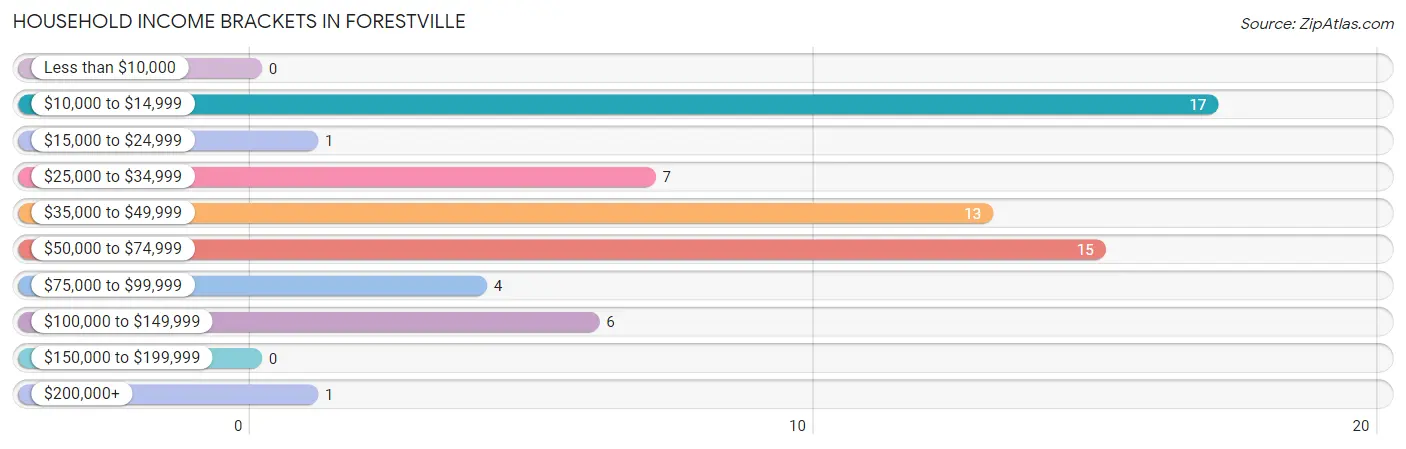
| Income Bracket | # Households | % Households |
| Less than $10,000 | 0 | 0.0% |
| $10,000 to $14,999 | 17 | 26.6% |
| $15,000 to $24,999 | 1 | 1.6% |
| $25,000 to $34,999 | 7 | 10.9% |
| $35,000 to $49,999 | 13 | 20.3% |
| $50,000 to $74,999 | 15 | 23.4% |
| $75,000 to $99,999 | 4 | 6.3% |
| $100,000 to $149,999 | 6 | 9.4% |
| $150,000 to $199,999 | 0 | 0.0% |
| $200,000+ | 1 | 1.6% |
Household Income by Householder Age in Forestville
The median household income in Forestville is $42,500, with the highest median household income of $66,875 found in the 25 to 44 years age bracket for the primary householder. A total of 7 households (10.9%) fall into this category.
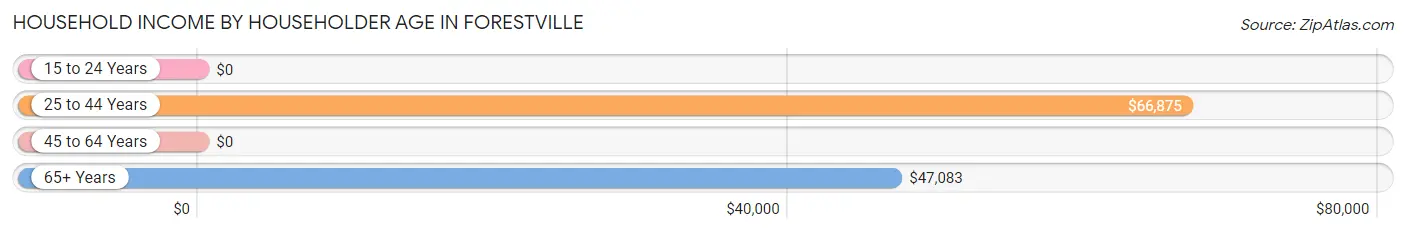
| Income Bracket | # Households | Median Income |
| 15 to 24 Years | 0 (0.0%) | $0 |
| 25 to 44 Years | 7 (10.9%) | $66,875 |
| 45 to 64 Years | 32 (50.0%) | $0 |
| 65+ Years | 25 (39.1%) | $47,083 |
| Total | 64 (100.0%) | $42,500 |
Poverty in Forestville
Income Below Poverty by Sex and Age in Forestville
With 18.5% poverty level for males and 28.4% for females among the residents of Forestville, 65 to 74 year old males and 55 to 64 year old females are the most vulnerable to poverty, with 12 males (42.9%) and 19 females (61.3%) in their respective age groups living below the poverty level.
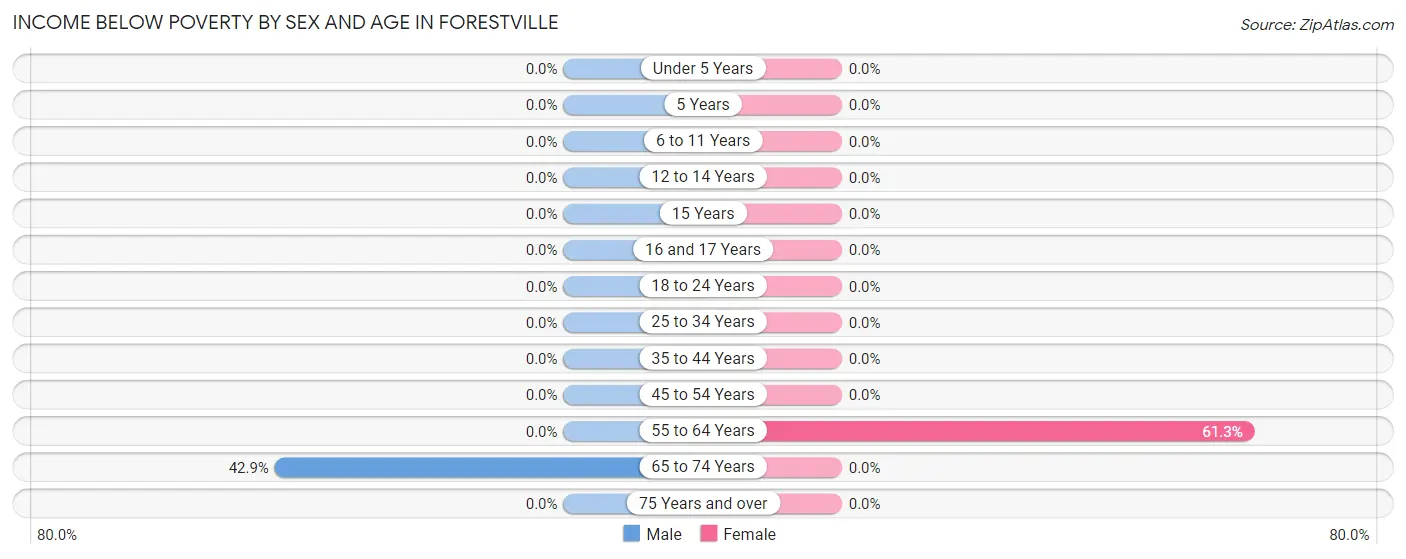
| Age Bracket | Male | Female |
| Under 5 Years | 0 (0.0%) | 0 (0.0%) |
| 5 Years | 0 (0.0%) | 0 (0.0%) |
| 6 to 11 Years | 0 (0.0%) | 0 (0.0%) |
| 12 to 14 Years | 0 (0.0%) | 0 (0.0%) |
| 15 Years | 0 (0.0%) | 0 (0.0%) |
| 16 and 17 Years | 0 (0.0%) | 0 (0.0%) |
| 18 to 24 Years | 0 (0.0%) | 0 (0.0%) |
| 25 to 34 Years | 0 (0.0%) | 0 (0.0%) |
| 35 to 44 Years | 0 (0.0%) | 0 (0.0%) |
| 45 to 54 Years | 0 (0.0%) | 0 (0.0%) |
| 55 to 64 Years | 0 (0.0%) | 19 (61.3%) |
| 65 to 74 Years | 12 (42.9%) | 0 (0.0%) |
| 75 Years and over | 0 (0.0%) | 0 (0.0%) |
| Total | 12 (18.5%) | 19 (28.4%) |
Income Above Poverty by Sex and Age in Forestville
According to the poverty statistics in Forestville, males aged under 5 years and females aged under 5 years are the age groups that are most secure financially, with 100.0% of males and 100.0% of females in these age groups living above the poverty line.
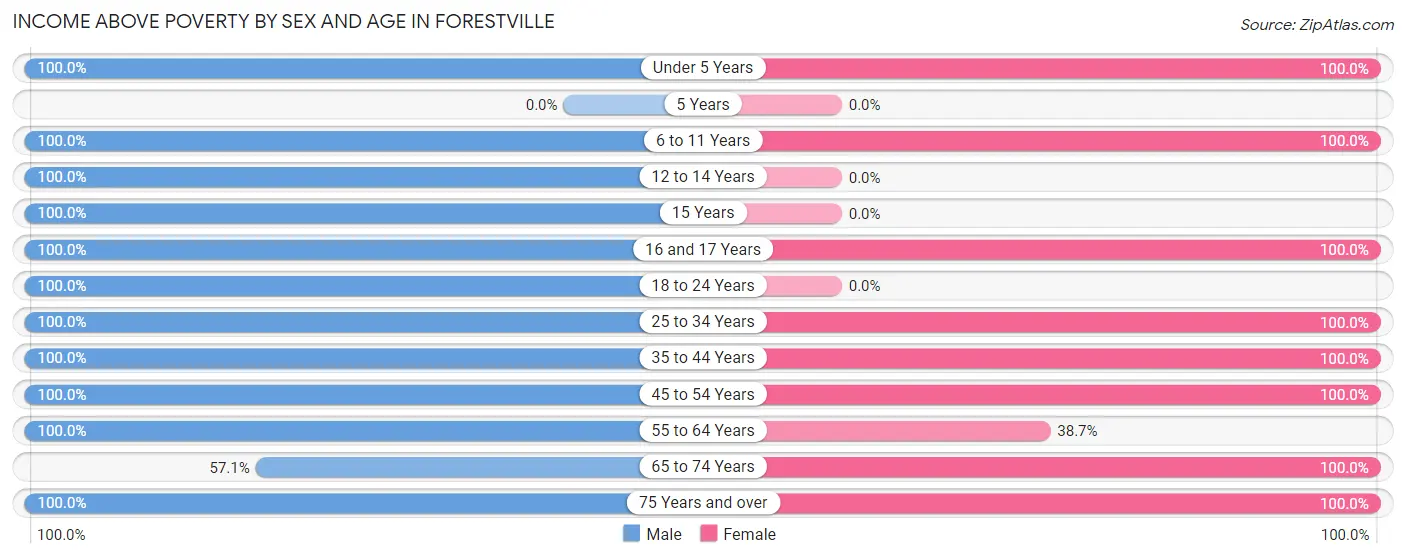
| Age Bracket | Male | Female |
| Under 5 Years | 1 (100.0%) | 2 (100.0%) |
| 5 Years | 0 (0.0%) | 0 (0.0%) |
| 6 to 11 Years | 1 (100.0%) | 1 (100.0%) |
| 12 to 14 Years | 7 (100.0%) | 0 (0.0%) |
| 15 Years | 1 (100.0%) | 0 (0.0%) |
| 16 and 17 Years | 1 (100.0%) | 1 (100.0%) |
| 18 to 24 Years | 6 (100.0%) | 0 (0.0%) |
| 25 to 34 Years | 2 (100.0%) | 1 (100.0%) |
| 35 to 44 Years | 3 (100.0%) | 7 (100.0%) |
| 45 to 54 Years | 3 (100.0%) | 3 (100.0%) |
| 55 to 64 Years | 5 (100.0%) | 12 (38.7%) |
| 65 to 74 Years | 16 (57.1%) | 17 (100.0%) |
| 75 Years and over | 7 (100.0%) | 4 (100.0%) |
| Total | 53 (81.5%) | 48 (71.6%) |
Income Below Poverty Among Married-Couple Families in Forestville
The poverty statistics for married-couple families in Forestville show that 40.5% or 17 of the total 42 families live below the poverty line. Families with no children have the highest poverty rate of 47.2%, comprising of 17 families. On the other hand, families with 1 or 2 children have the lowest poverty rate of 0.0%, which includes 0 families.
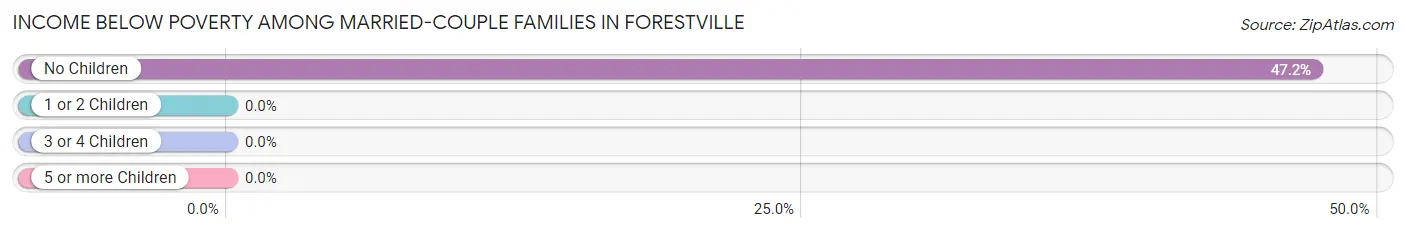
| Children | Above Poverty | Below Poverty |
| No Children | 19 (52.8%) | 17 (47.2%) |
| 1 or 2 Children | 4 (100.0%) | 0 (0.0%) |
| 3 or 4 Children | 2 (100.0%) | 0 (0.0%) |
| 5 or more Children | 0 (0.0%) | 0 (0.0%) |
| Total | 25 (59.5%) | 17 (40.5%) |
Income Below Poverty Among Single-Parent Households in Forestville
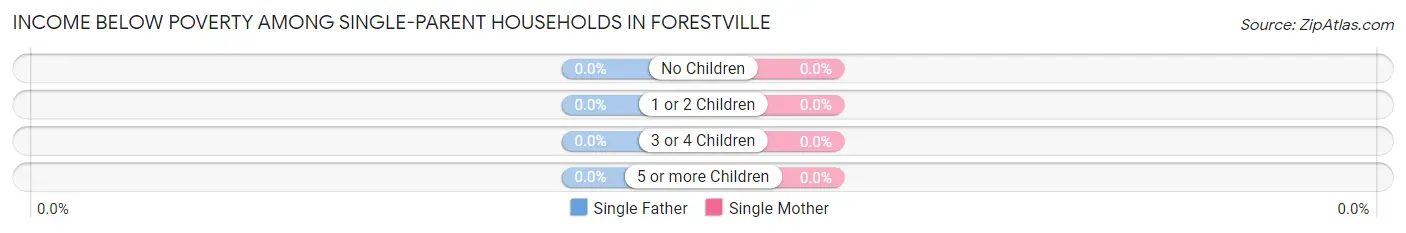
| Children | Single Father | Single Mother |
| No Children | 0 (0.0%) | 0 (0.0%) |
| 1 or 2 Children | 0 (0.0%) | 0 (0.0%) |
| 3 or 4 Children | 0 (0.0%) | 0 (0.0%) |
| 5 or more Children | 0 (0.0%) | 0 (0.0%) |
| Total | 0 (0.0%) | 0 (0.0%) |
Income Below Poverty Among Married-Couple vs Single-Parent Households in Forestville
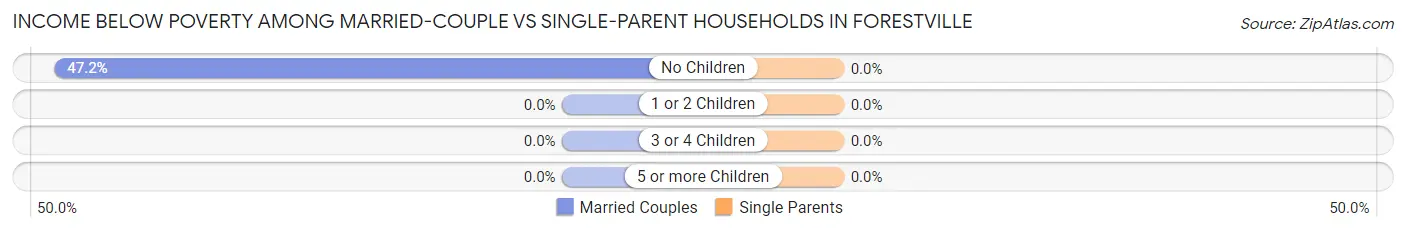
| Children | Married-Couple Families | Single-Parent Households |
| No Children | 17 (47.2%) | 0 (0.0%) |
| 1 or 2 Children | 0 (0.0%) | 0 (0.0%) |
| 3 or 4 Children | 0 (0.0%) | 0 (0.0%) |
| 5 or more Children | 0 (0.0%) | 0 (0.0%) |
| Total | 17 (40.5%) | 0 (0.0%) |
Race in Forestville
The most populous races in Forestville are White / Caucasian (127 | 96.2%), Hispanic or Latino (14 | 10.6%), and Two or more Races (5 | 3.8%).
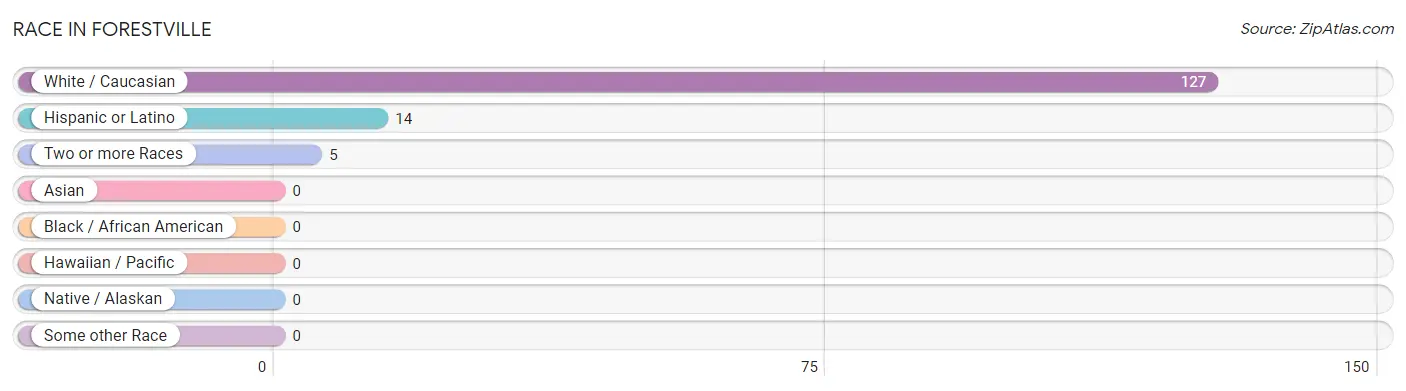
| Race | # Population | % Population |
| Asian | 0 | 0.0% |
| Black / African American | 0 | 0.0% |
| Hawaiian / Pacific | 0 | 0.0% |
| Hispanic or Latino | 14 | 10.6% |
| Native / Alaskan | 0 | 0.0% |
| White / Caucasian | 127 | 96.2% |
| Two or more Races | 5 | 3.8% |
| Some other Race | 0 | 0.0% |
| Total | 132 | 100.0% |
Ancestry in Forestville
The most populous ancestries reported in Forestville are German (33 | 25.0%), English (16 | 12.1%), Irish (15 | 11.4%), Mexican (9 | 6.8%), and French (8 | 6.1%), together accounting for 61.4% of all Forestville residents.
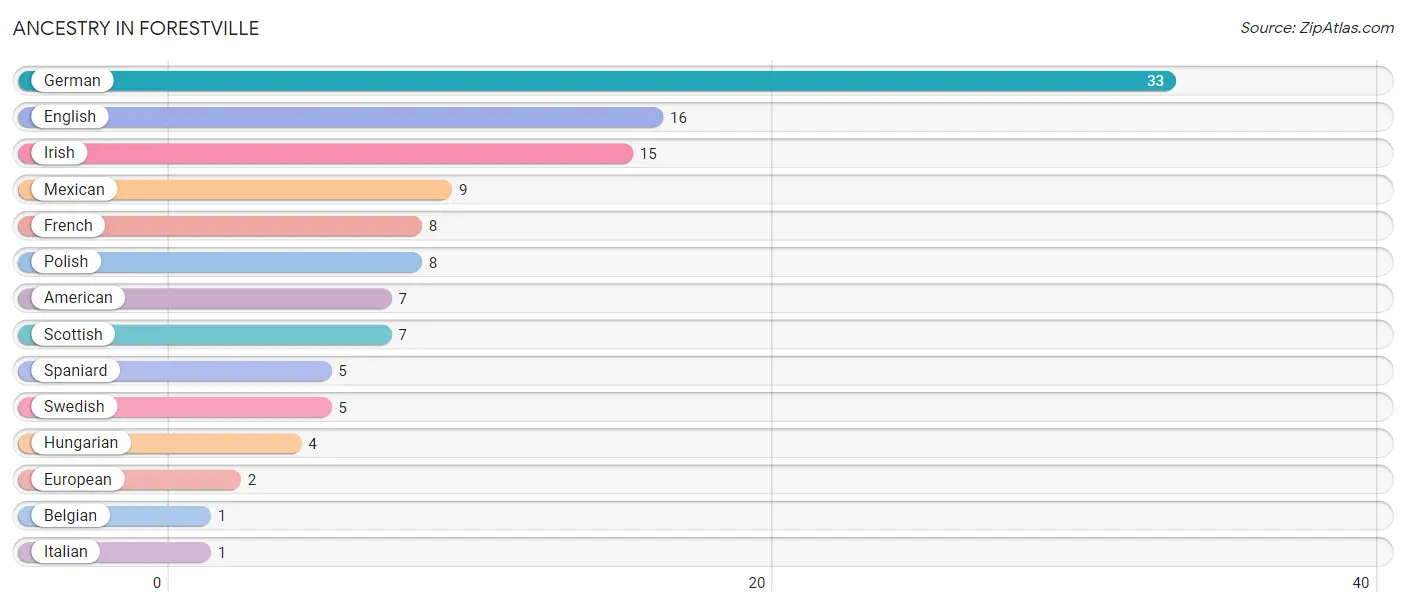
| Ancestry | # Population | % Population |
| American | 7 | 5.3% |
| Belgian | 1 | 0.8% |
| English | 16 | 12.1% |
| European | 2 | 1.5% |
| French | 8 | 6.1% |
| German | 33 | 25.0% |
| Hungarian | 4 | 3.0% |
| Irish | 15 | 11.4% |
| Italian | 1 | 0.8% |
| Mexican | 9 | 6.8% |
| Polish | 8 | 6.1% |
| Scottish | 7 | 5.3% |
| Spaniard | 5 | 3.8% |
| Swedish | 5 | 3.8% | View All 14 Rows |
Immigrants in Forestville
The most numerous immigrant groups reported in Forestville came from Central America (2 | 1.5%), Latin America (2 | 1.5%), and Mexico (2 | 1.5%), together accounting for 4.6% of all Forestville residents.
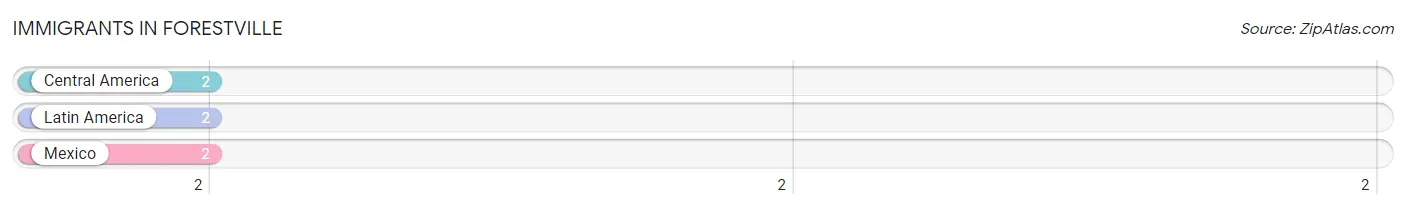
| Immigration Origin | # Population | % Population |
| Central America | 2 | 1.5% |
| Latin America | 2 | 1.5% |
| Mexico | 2 | 1.5% | View All 3 Rows |
Sex and Age in Forestville
Sex and Age in Forestville
The most populous age groups in Forestville are 70 to 74 Years (18 | 27.7%) for men and 60 to 64 Years (26 | 38.8%) for women.
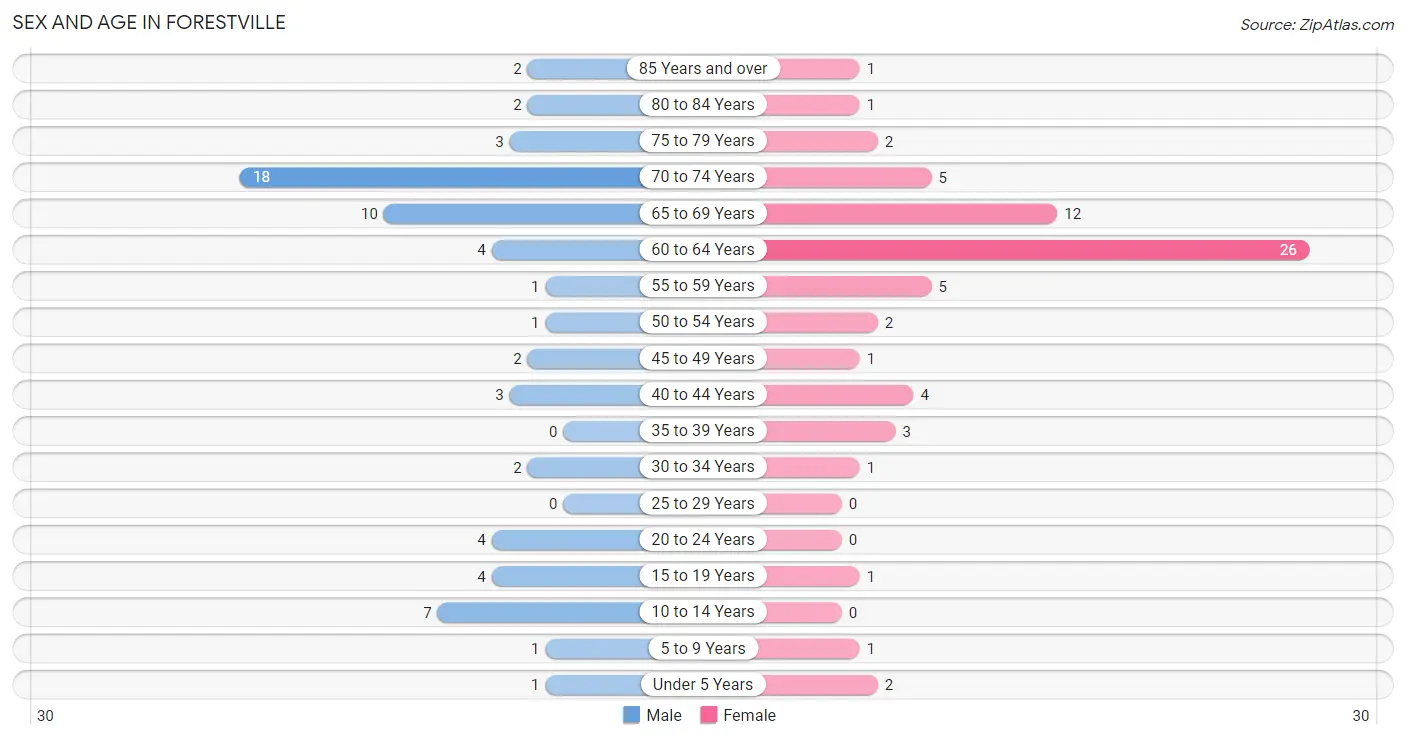
| Age Bracket | Male | Female |
| Under 5 Years | 1 (1.5%) | 2 (3.0%) |
| 5 to 9 Years | 1 (1.5%) | 1 (1.5%) |
| 10 to 14 Years | 7 (10.8%) | 0 (0.0%) |
| 15 to 19 Years | 4 (6.1%) | 1 (1.5%) |
| 20 to 24 Years | 4 (6.1%) | 0 (0.0%) |
| 25 to 29 Years | 0 (0.0%) | 0 (0.0%) |
| 30 to 34 Years | 2 (3.1%) | 1 (1.5%) |
| 35 to 39 Years | 0 (0.0%) | 3 (4.5%) |
| 40 to 44 Years | 3 (4.6%) | 4 (6.0%) |
| 45 to 49 Years | 2 (3.1%) | 1 (1.5%) |
| 50 to 54 Years | 1 (1.5%) | 2 (3.0%) |
| 55 to 59 Years | 1 (1.5%) | 5 (7.5%) |
| 60 to 64 Years | 4 (6.1%) | 26 (38.8%) |
| 65 to 69 Years | 10 (15.4%) | 12 (17.9%) |
| 70 to 74 Years | 18 (27.7%) | 5 (7.5%) |
| 75 to 79 Years | 3 (4.6%) | 2 (3.0%) |
| 80 to 84 Years | 2 (3.1%) | 1 (1.5%) |
| 85 Years and over | 2 (3.1%) | 1 (1.5%) |
| Total | 65 (100.0%) | 67 (100.0%) |
Families and Households in Forestville
Median Family Size in Forestville
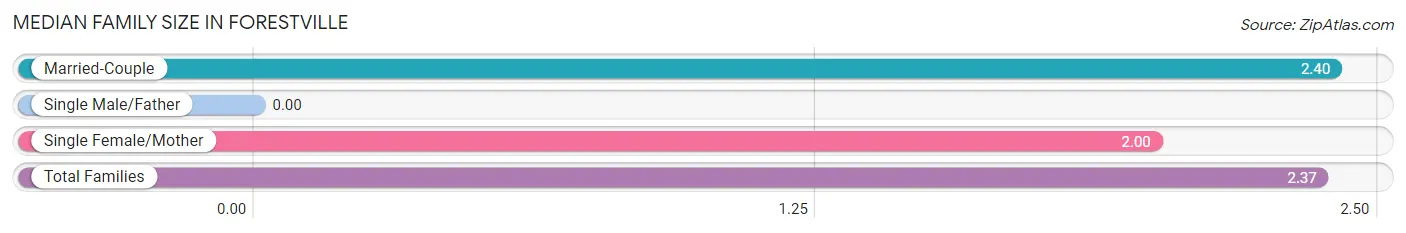
| Family Type | # Families | Family Size |
| Married-Couple | 42 (91.3%) | 2.40 |
| Single Male/Father | 0 (0.0%) | - |
| Single Female/Mother | 4 (8.7%) | 2.00 |
| Total Families | 46 (100.0%) | 2.37 |
Median Household Size in Forestville
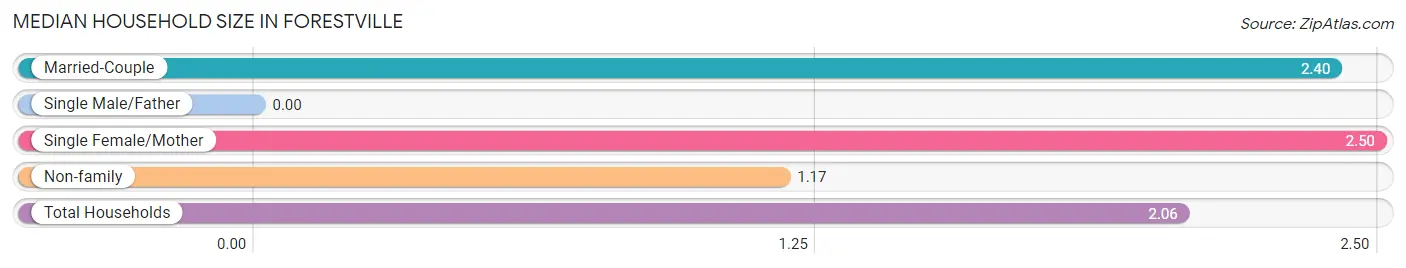
| Household Type | # Households | Household Size |
| Married-Couple | 42 (65.6%) | 2.40 |
| Single Male/Father | 0 (0.0%) | - |
| Single Female/Mother | 4 (6.2%) | 2.50 |
| Non-family | 18 (28.1%) | 1.17 |
| Total Households | 64 (100.0%) | 2.06 |
Household Size by Marriage Status in Forestville
Out of a total of 64 households in Forestville, 46 (71.9%) are family households, while 18 (28.1%) are nonfamily households. The most numerous type of family households are 2-person households, comprising 35, and the most common type of nonfamily households are 1-person households, comprising 15.
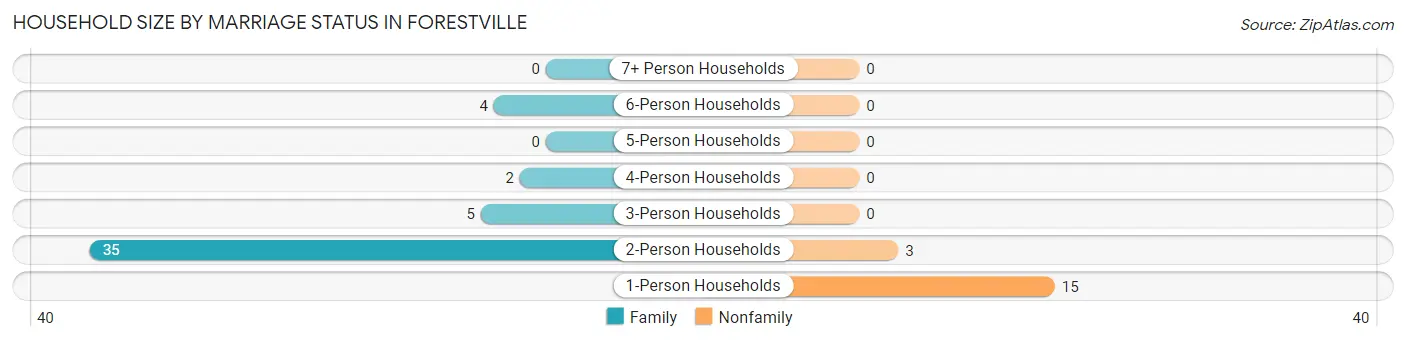
| Household Size | Family Households | Nonfamily Households |
| 1-Person Households | - | 15 (23.4%) |
| 2-Person Households | 35 (54.7%) | 3 (4.7%) |
| 3-Person Households | 5 (7.8%) | 0 (0.0%) |
| 4-Person Households | 2 (3.1%) | 0 (0.0%) |
| 5-Person Households | 0 (0.0%) | 0 (0.0%) |
| 6-Person Households | 4 (6.2%) | 0 (0.0%) |
| 7+ Person Households | 0 (0.0%) | 0 (0.0%) |
| Total | 46 (71.9%) | 18 (28.1%) |
Female Fertility in Forestville
Fertility by Age in Forestville
Average fertility rate in Forestville is 250.0 births per 1,000 women. Women in the age bracket of 20 to 34 years have the highest fertility rate with 1,000.0 births per 1,000 women. Women in the age bracket of 35 to 50 years acount for 66.7% of all women with births.
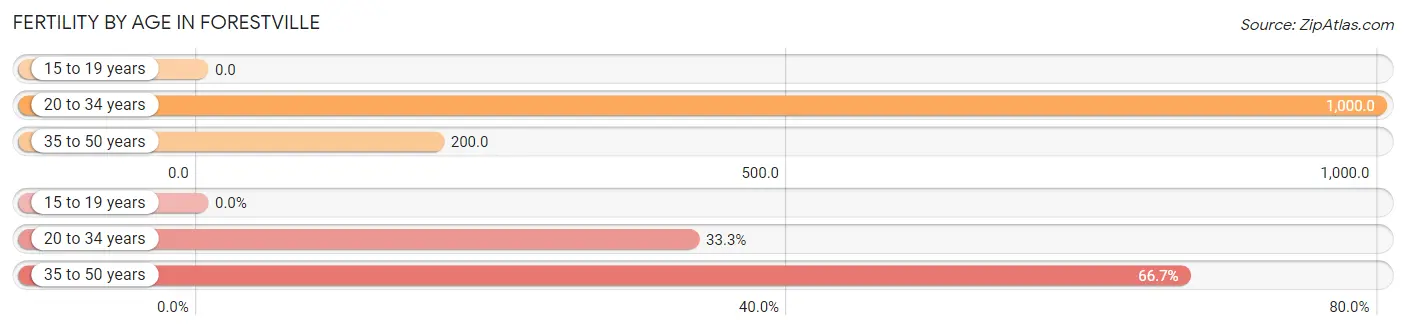
| Age Bracket | Women with Births | Births / 1,000 Women |
| 15 to 19 years | 0 (0.0%) | 0.0 |
| 20 to 34 years | 1 (33.3%) | 1,000.0 |
| 35 to 50 years | 2 (66.7%) | 200.0 |
| Total | 3 (100.0%) | 250.0 |
Fertility by Age by Marriage Status in Forestville
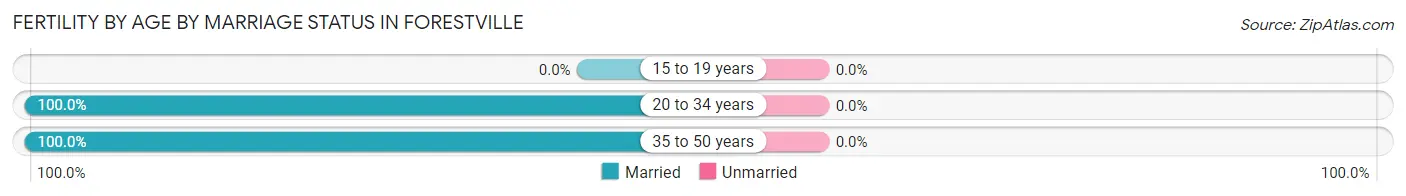
| Age Bracket | Married | Unmarried |
| 15 to 19 years | 0 (0.0%) | 0 (0.0%) |
| 20 to 34 years | 1 (100.0%) | 0 (0.0%) |
| 35 to 50 years | 2 (100.0%) | 0 (0.0%) |
| Total | 3 (100.0%) | 0 (0.0%) |
Fertility by Education in Forestville
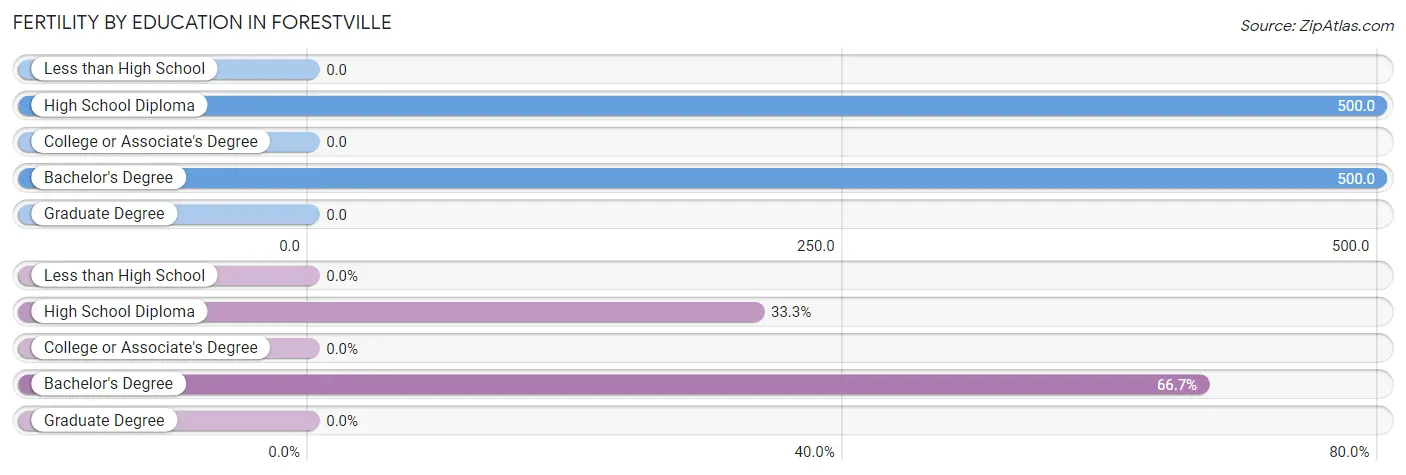
| Educational Attainment | Women with Births | Births / 1,000 Women |
| Less than High School | 0 (0.0%) | 0.0 |
| High School Diploma | 1 (33.3%) | 500.0 |
| College or Associate's Degree | 0 (0.0%) | 0.0 |
| Bachelor's Degree | 2 (66.7%) | 500.0 |
| Graduate Degree | 0 (0.0%) | 0.0 |
| Total | 3 (100.0%) | 250.0 |
Fertility by Education by Marriage Status in Forestville
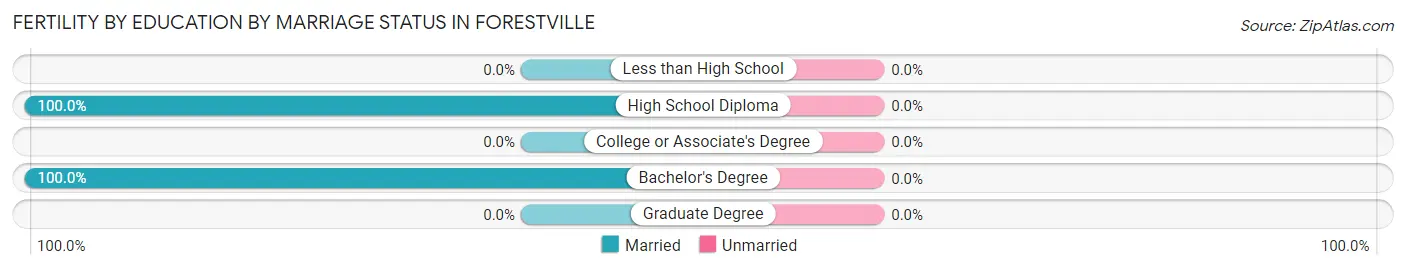
| Educational Attainment | Married | Unmarried |
| Less than High School | 0 (0.0%) | 0 (0.0%) |
| High School Diploma | 1 (100.0%) | 0 (0.0%) |
| College or Associate's Degree | 0 (0.0%) | 0 (0.0%) |
| Bachelor's Degree | 2 (100.0%) | 0 (0.0%) |
| Graduate Degree | 0 (0.0%) | 0 (0.0%) |
| Total | 3 (100.0%) | 0 (0.0%) |
Employment Characteristics in Forestville
Employment by Class of Employer in Forestville
Among the 33 employed individuals in Forestville, private company employees (23 | 69.7%), local government employees (6 | 18.2%), and self-employed (not incorporated) (2 | 6.1%) make up the most common classes of employment.
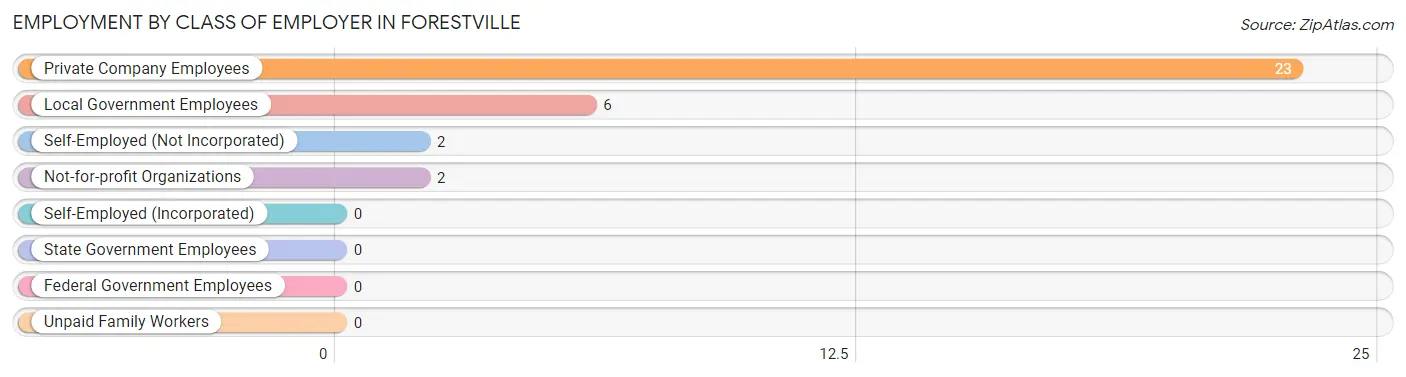
| Employer Class | # Employees | % Employees |
| Private Company Employees | 23 | 69.7% |
| Self-Employed (Incorporated) | 0 | 0.0% |
| Self-Employed (Not Incorporated) | 2 | 6.1% |
| Not-for-profit Organizations | 2 | 6.1% |
| Local Government Employees | 6 | 18.2% |
| State Government Employees | 0 | 0.0% |
| Federal Government Employees | 0 | 0.0% |
| Unpaid Family Workers | 0 | 0.0% |
| Total | 33 | 100.0% |
Employment Status by Age in Forestville
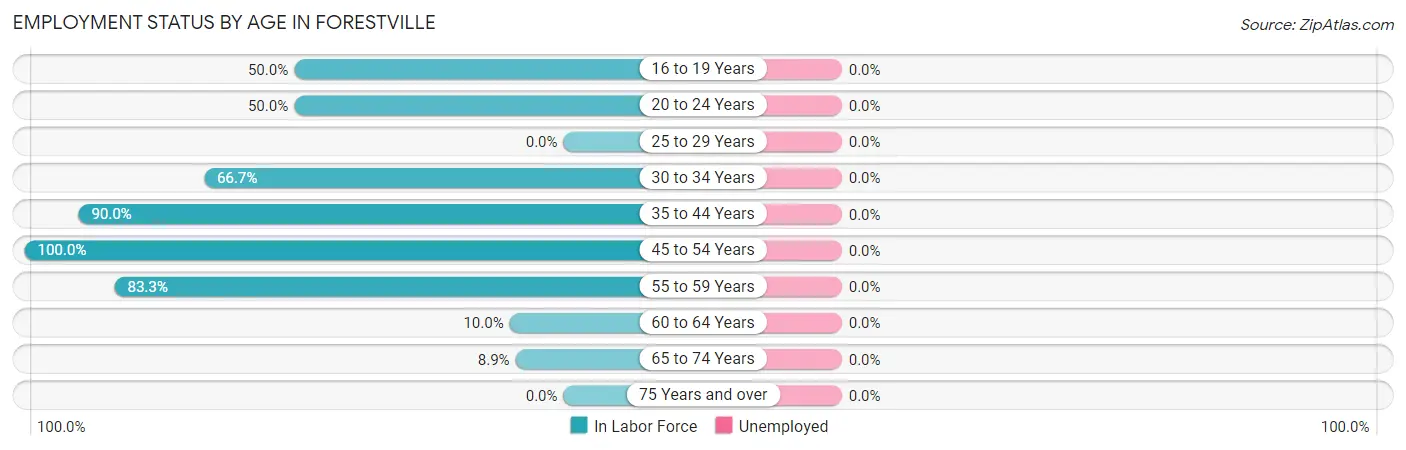
| Age Bracket | In Labor Force | Unemployed |
| 16 to 19 Years | 2 (50.0%) | 0 (0.0%) |
| 20 to 24 Years | 2 (50.0%) | 0 (0.0%) |
| 25 to 29 Years | 0 (0.0%) | 0 (0.0%) |
| 30 to 34 Years | 2 (66.7%) | 0 (0.0%) |
| 35 to 44 Years | 9 (90.0%) | 0 (0.0%) |
| 45 to 54 Years | 6 (100.0%) | 0 (0.0%) |
| 55 to 59 Years | 5 (83.3%) | 0 (0.0%) |
| 60 to 64 Years | 3 (10.0%) | 0 (0.0%) |
| 65 to 74 Years | 4 (8.9%) | 0 (0.0%) |
| 75 Years and over | 0 (0.0%) | 0 (0.0%) |
| Total | 33 (27.7%) | 0 (0.0%) |
Employment Status by Educational Attainment in Forestville
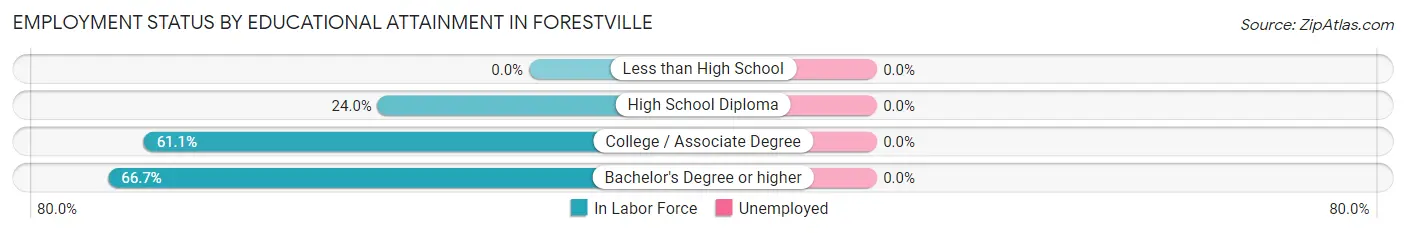
| Educational Attainment | In Labor Force | Unemployed |
| Less than High School | 0 (0.0%) | 0 (0.0%) |
| High School Diploma | 6 (24.0%) | 0 (0.0%) |
| College / Associate Degree | 11 (61.1%) | 0 (0.0%) |
| Bachelor's Degree or higher | 8 (66.7%) | 0 (0.0%) |
| Total | 25 (45.5%) | 0 (0.0%) |
Employment Occupations by Sex in Forestville
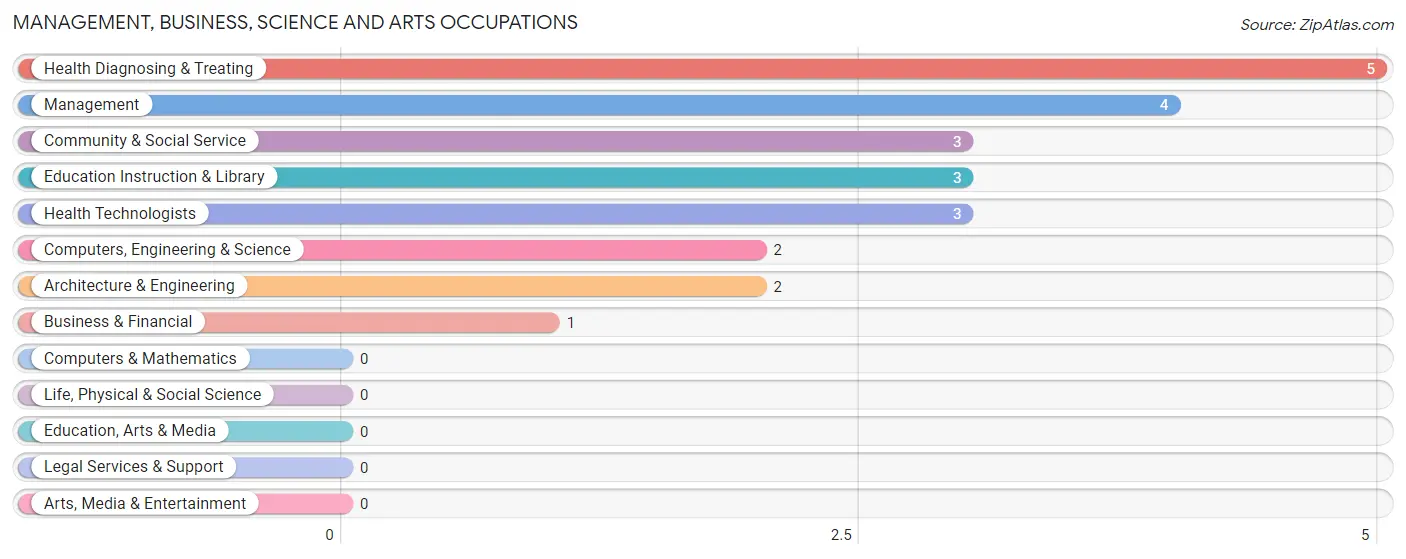
Management, Business, Science and Arts Occupations
The most common Management, Business, Science and Arts occupations in Forestville are Health Diagnosing & Treating (5 | 15.1%), Management (4 | 12.1%), Community & Social Service (3 | 9.1%), Education Instruction & Library (3 | 9.1%), and Health Technologists (3 | 9.1%).
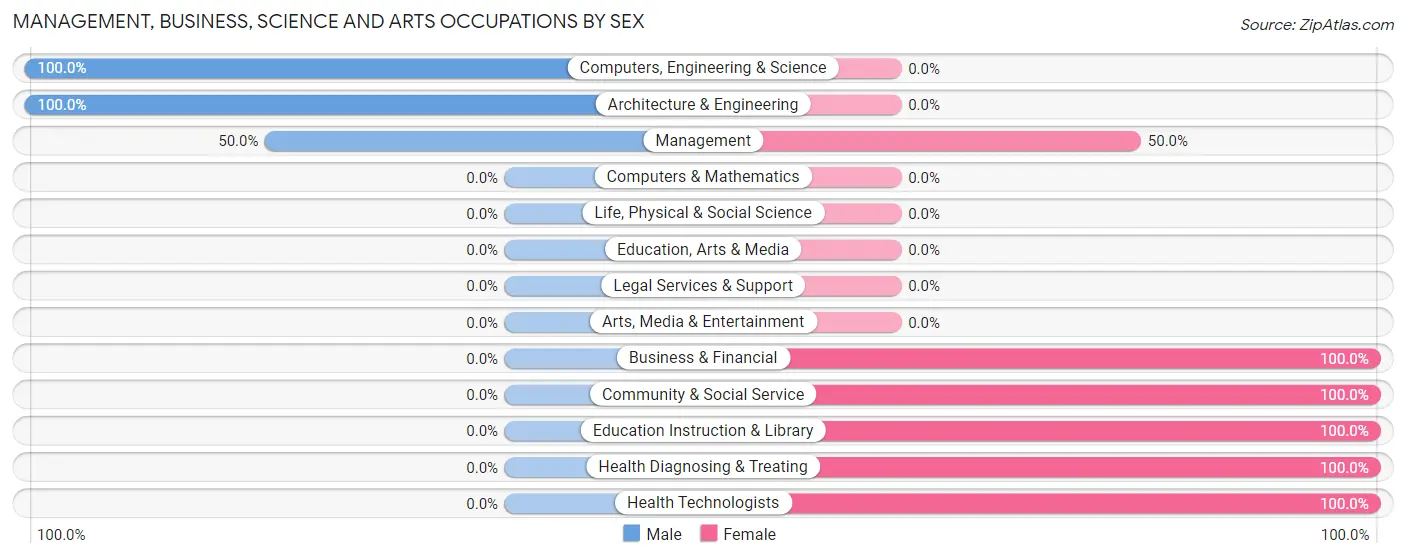
Management, Business, Science and Arts Occupations by Sex
Within the Management, Business, Science and Arts occupations in Forestville, the most male-oriented occupations are Computers, Engineering & Science (100.0%), Architecture & Engineering (100.0%), and Management (50.0%), while the most female-oriented occupations are Business & Financial (100.0%), Community & Social Service (100.0%), and Education Instruction & Library (100.0%).
| Occupation | Male | Female |
| Management | 2 (50.0%) | 2 (50.0%) |
| Business & Financial | 0 (0.0%) | 1 (100.0%) |
| Computers, Engineering & Science | 2 (100.0%) | 0 (0.0%) |
| Computers & Mathematics | 0 (0.0%) | 0 (0.0%) |
| Architecture & Engineering | 2 (100.0%) | 0 (0.0%) |
| Life, Physical & Social Science | 0 (0.0%) | 0 (0.0%) |
| Community & Social Service | 0 (0.0%) | 3 (100.0%) |
| Education, Arts & Media | 0 (0.0%) | 0 (0.0%) |
| Legal Services & Support | 0 (0.0%) | 0 (0.0%) |
| Education Instruction & Library | 0 (0.0%) | 3 (100.0%) |
| Arts, Media & Entertainment | 0 (0.0%) | 0 (0.0%) |
| Health Diagnosing & Treating | 0 (0.0%) | 5 (100.0%) |
| Health Technologists | 0 (0.0%) | 3 (100.0%) |
| Total (Category) | 4 (26.7%) | 11 (73.3%) |
| Total (Overall) | 14 (42.4%) | 19 (57.6%) |
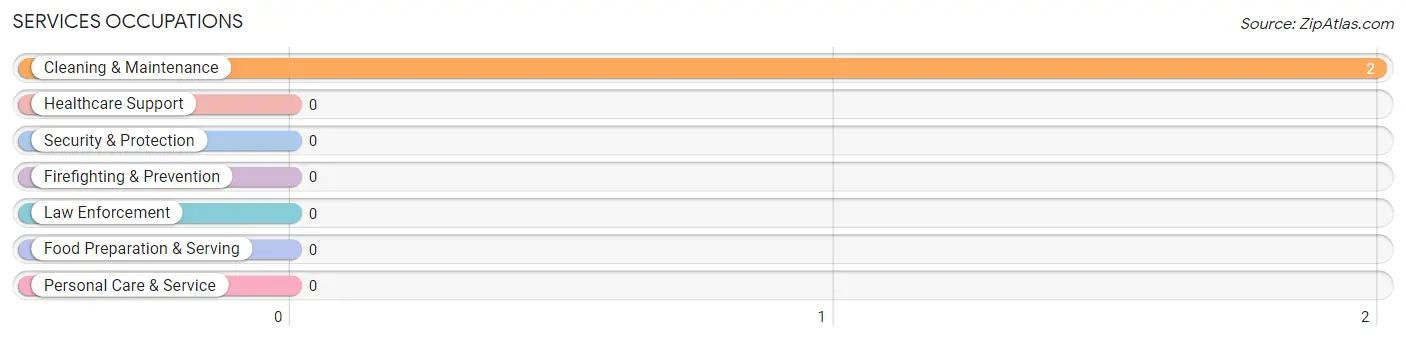
Services Occupations
The most common Services occupations in Forestville are , and Cleaning & Maintenance (2 | 6.1%).
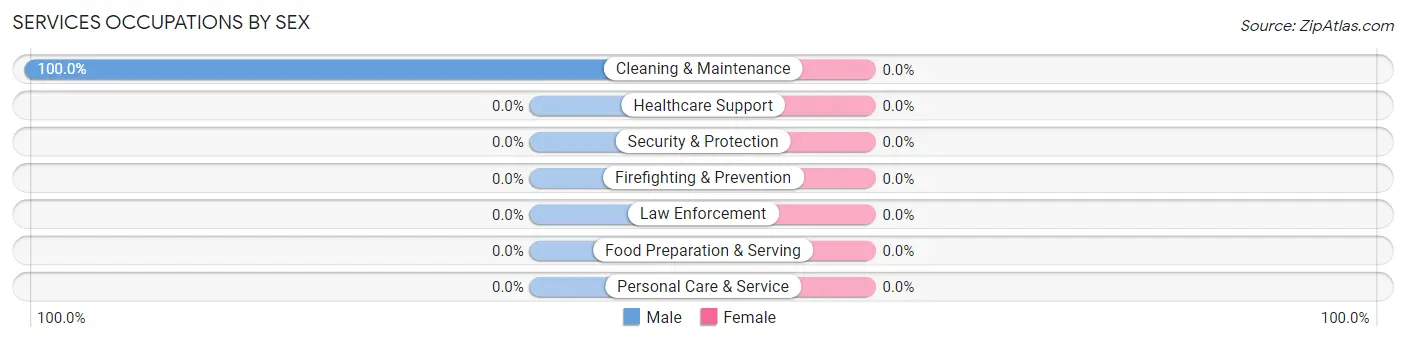
Services Occupations by Sex
| Occupation | Male | Female |
| Healthcare Support | 0 (0.0%) | 0 (0.0%) |
| Security & Protection | 0 (0.0%) | 0 (0.0%) |
| Firefighting & Prevention | 0 (0.0%) | 0 (0.0%) |
| Law Enforcement | 0 (0.0%) | 0 (0.0%) |
| Food Preparation & Serving | 0 (0.0%) | 0 (0.0%) |
| Cleaning & Maintenance | 2 (100.0%) | 0 (0.0%) |
| Personal Care & Service | 0 (0.0%) | 0 (0.0%) |
| Total (Category) | 2 (100.0%) | 0 (0.0%) |
| Total (Overall) | 14 (42.4%) | 19 (57.6%) |
Sales and Office Occupations
The most common Sales and Office occupations in Forestville are , and Office & Administration (6 | 18.2%).
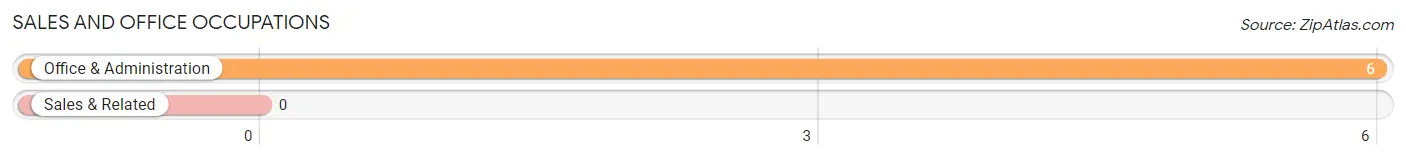
Sales and Office Occupations by Sex
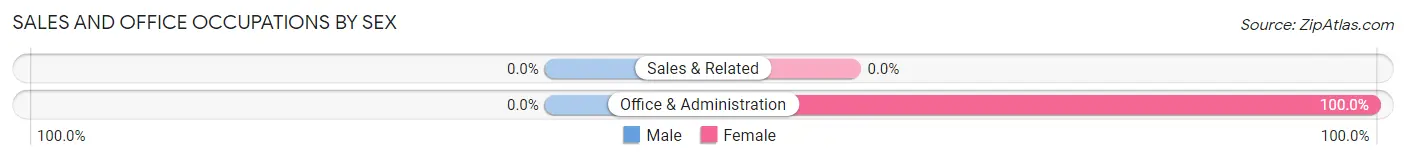
| Occupation | Male | Female |
| Sales & Related | 0 (0.0%) | 0 (0.0%) |
| Office & Administration | 0 (0.0%) | 6 (100.0%) |
| Total (Category) | 0 (0.0%) | 6 (100.0%) |
| Total (Overall) | 14 (42.4%) | 19 (57.6%) |
Natural Resources, Construction and Maintenance Occupations
The most common Natural Resources, Construction and Maintenance occupations in Forestville are , and Construction & Extraction (4 | 12.1%).
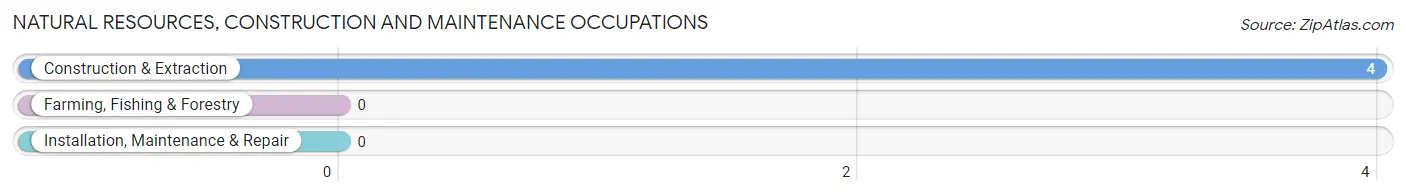
Natural Resources, Construction and Maintenance Occupations by Sex
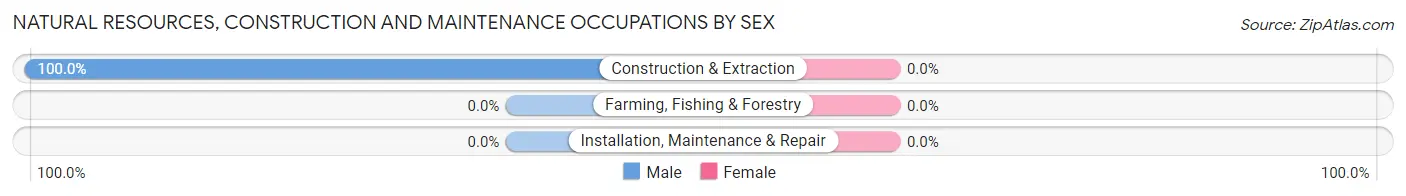
| Occupation | Male | Female |
| Farming, Fishing & Forestry | 0 (0.0%) | 0 (0.0%) |
| Construction & Extraction | 4 (100.0%) | 0 (0.0%) |
| Installation, Maintenance & Repair | 0 (0.0%) | 0 (0.0%) |
| Total (Category) | 4 (100.0%) | 0 (0.0%) |
| Total (Overall) | 14 (42.4%) | 19 (57.6%) |
Production, Transportation and Moving Occupations
The most common Production, Transportation and Moving occupations in Forestville are Production (4 | 12.1%), Transportation (1 | 3.0%), and Material Moving (1 | 3.0%).
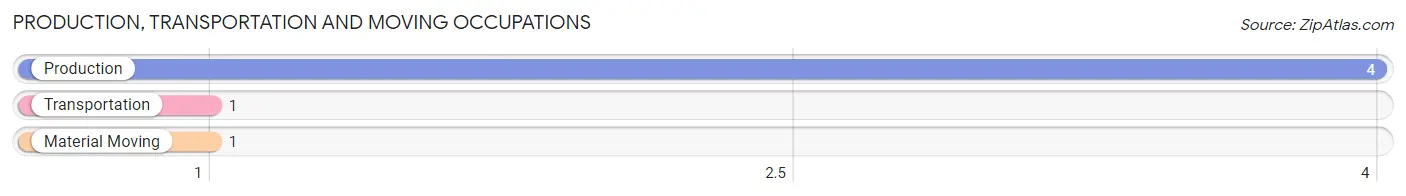
Production, Transportation and Moving Occupations by Sex
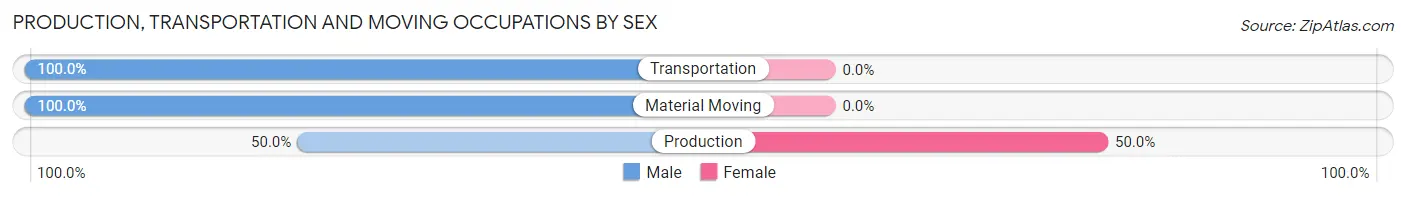
| Occupation | Male | Female |
| Production | 2 (50.0%) | 2 (50.0%) |
| Transportation | 1 (100.0%) | 0 (0.0%) |
| Material Moving | 1 (100.0%) | 0 (0.0%) |
| Total (Category) | 4 (66.7%) | 2 (33.3%) |
| Total (Overall) | 14 (42.4%) | 19 (57.6%) |
Employment Industries by Sex in Forestville
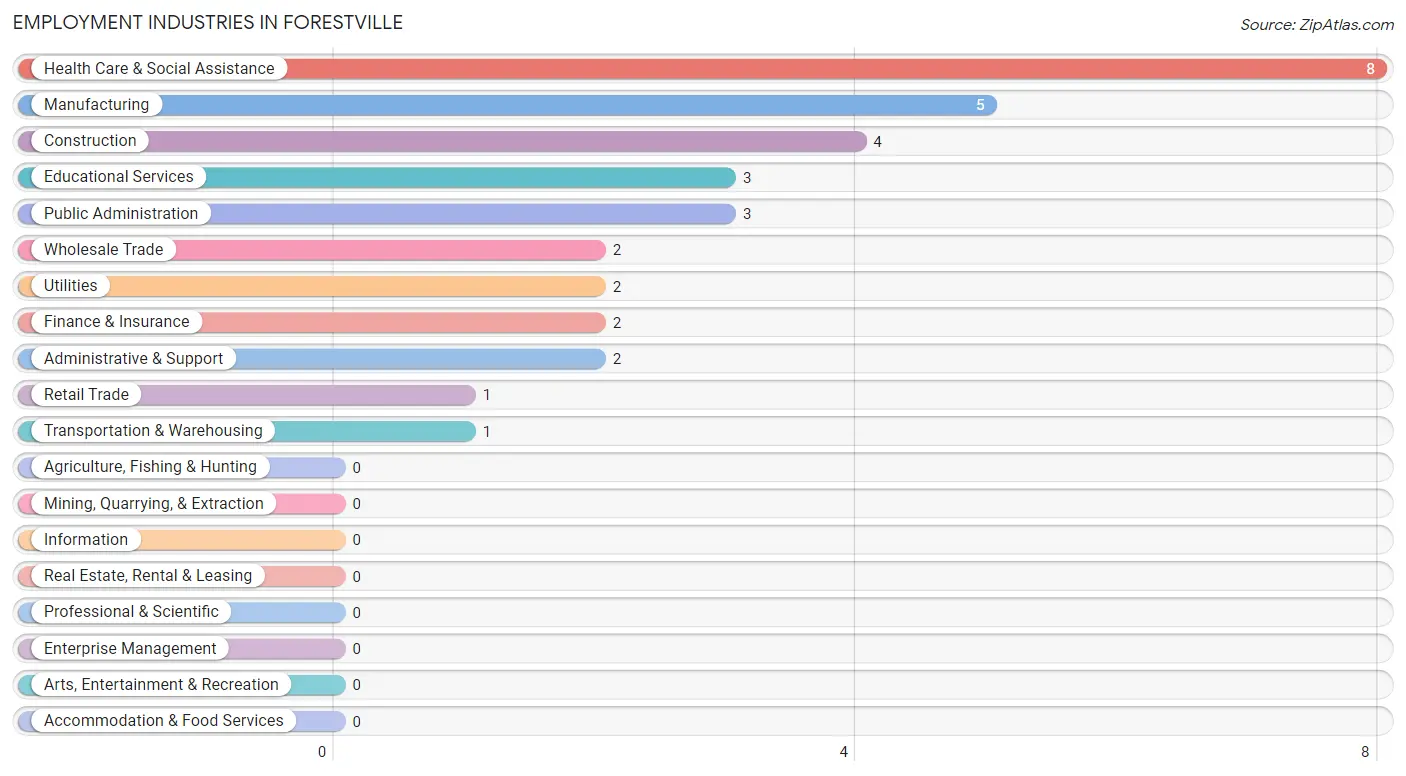
Employment Industries in Forestville
The major employment industries in Forestville include Health Care & Social Assistance (8 | 24.2%), Manufacturing (5 | 15.1%), Construction (4 | 12.1%), Educational Services (3 | 9.1%), and Public Administration (3 | 9.1%).
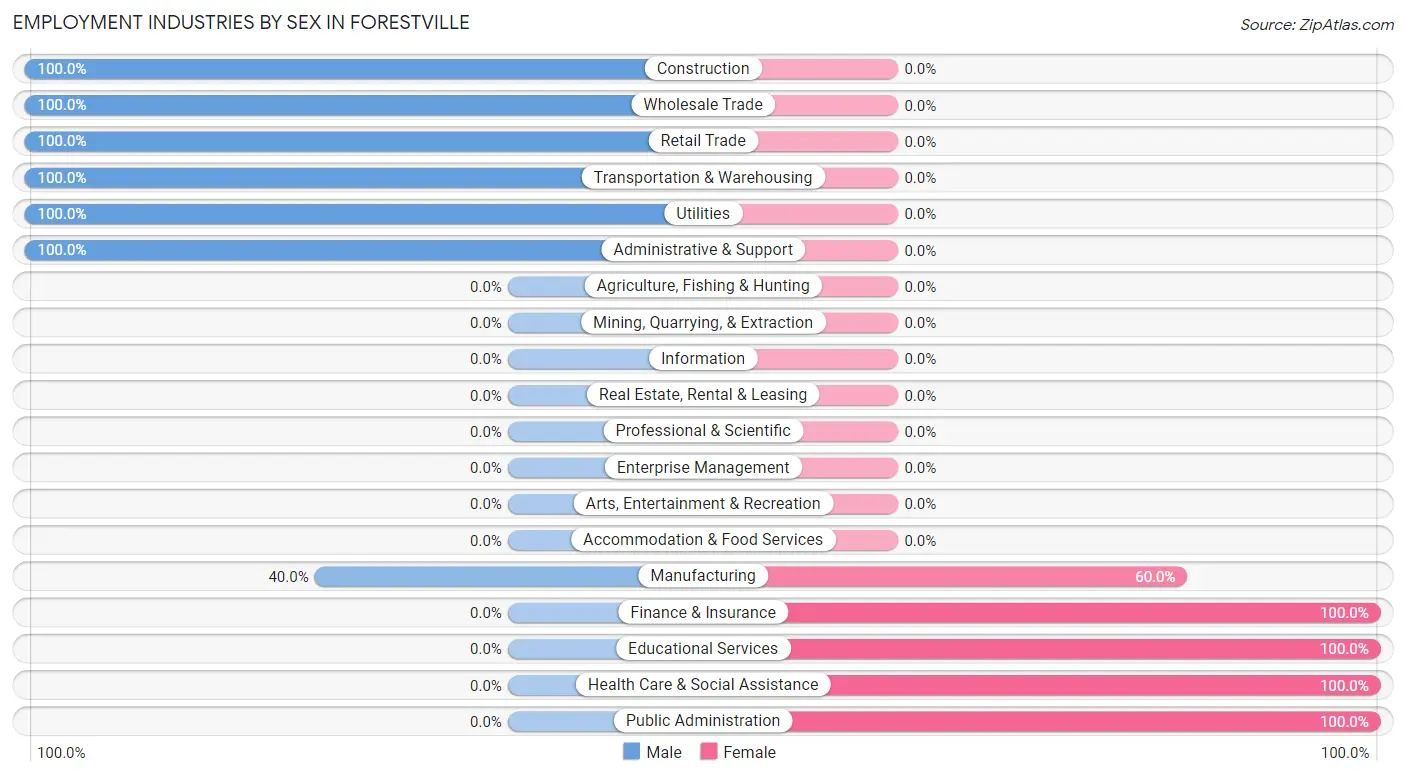
Employment Industries by Sex in Forestville
The Forestville industries that see more men than women are Construction (100.0%), Wholesale Trade (100.0%), and Retail Trade (100.0%), whereas the industries that tend to have a higher number of women are Finance & Insurance (100.0%), Educational Services (100.0%), and Health Care & Social Assistance (100.0%).
| Industry | Male | Female |
| Agriculture, Fishing & Hunting | 0 (0.0%) | 0 (0.0%) |
| Mining, Quarrying, & Extraction | 0 (0.0%) | 0 (0.0%) |
| Construction | 4 (100.0%) | 0 (0.0%) |
| Manufacturing | 2 (40.0%) | 3 (60.0%) |
| Wholesale Trade | 2 (100.0%) | 0 (0.0%) |
| Retail Trade | 1 (100.0%) | 0 (0.0%) |
| Transportation & Warehousing | 1 (100.0%) | 0 (0.0%) |
| Utilities | 2 (100.0%) | 0 (0.0%) |
| Information | 0 (0.0%) | 0 (0.0%) |
| Finance & Insurance | 0 (0.0%) | 2 (100.0%) |
| Real Estate, Rental & Leasing | 0 (0.0%) | 0 (0.0%) |
| Professional & Scientific | 0 (0.0%) | 0 (0.0%) |
| Enterprise Management | 0 (0.0%) | 0 (0.0%) |
| Administrative & Support | 2 (100.0%) | 0 (0.0%) |
| Educational Services | 0 (0.0%) | 3 (100.0%) |
| Health Care & Social Assistance | 0 (0.0%) | 8 (100.0%) |
| Arts, Entertainment & Recreation | 0 (0.0%) | 0 (0.0%) |
| Accommodation & Food Services | 0 (0.0%) | 0 (0.0%) |
| Public Administration | 0 (0.0%) | 3 (100.0%) |
| Total | 14 (42.4%) | 19 (57.6%) |
Education in Forestville
School Enrollment in Forestville
The most common levels of schooling among the 17 students in Forestville are middle school (6 | 35.3%), high school (6 | 35.3%), and elementary school (2 | 11.8%).
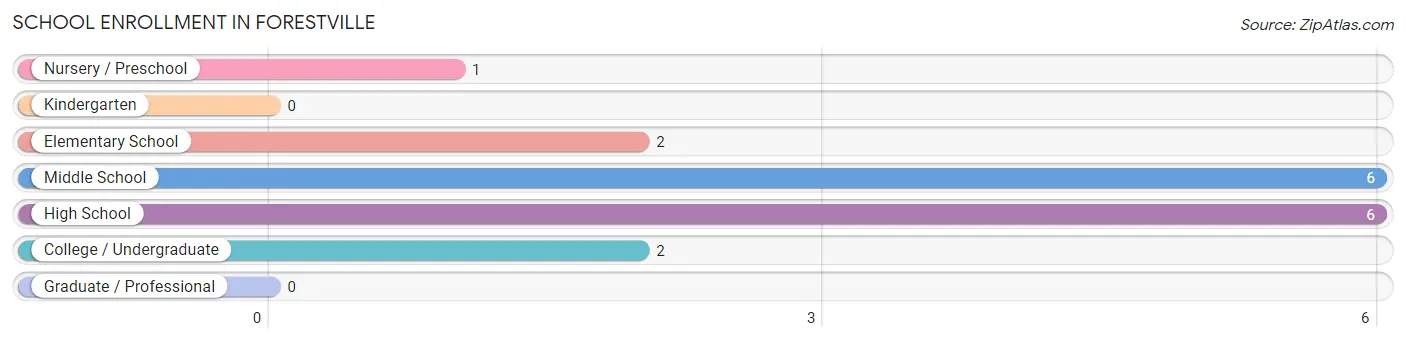
| School Level | # Students | % Students |
| Nursery / Preschool | 1 | 5.9% |
| Kindergarten | 0 | 0.0% |
| Elementary School | 2 | 11.8% |
| Middle School | 6 | 35.3% |
| High School | 6 | 35.3% |
| College / Undergraduate | 2 | 11.8% |
| Graduate / Professional | 0 | 0.0% |
| Total | 17 | 100.0% |
School Enrollment by Age by Funding Source in Forestville
Out of a total of 17 students who are enrolled in schools in Forestville, 5 (29.4%) attend a private institution, while the remaining 12 (70.6%) are enrolled in public schools. The age group of 20 to 24 year olds has the highest likelihood of being enrolled in private schools, with 2 (100.0% in the age bracket) enrolled. Conversely, the age group of 3 to 4 year olds has the lowest likelihood of being enrolled in a private school, with 1 (100.0% in the age bracket) attending a public institution.
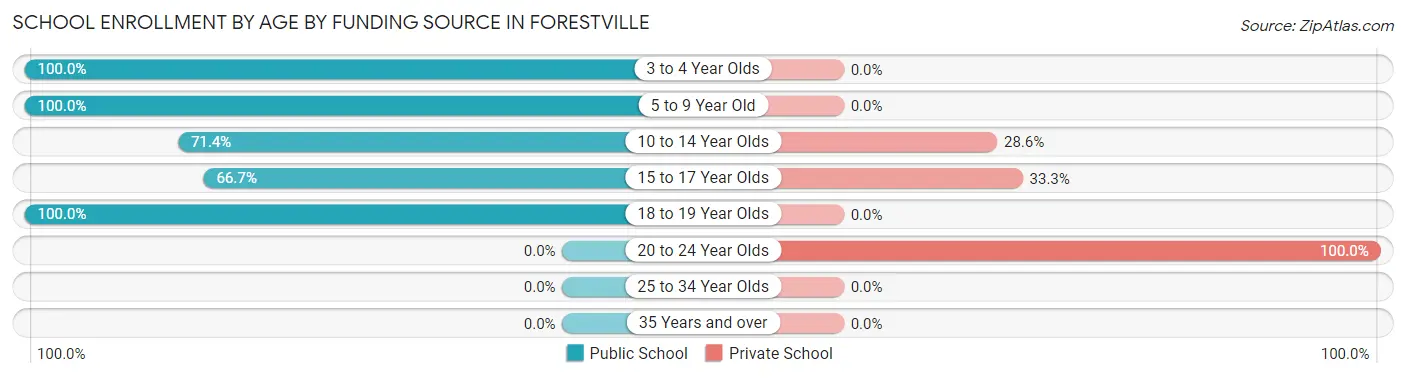
| Age Bracket | Public School | Private School |
| 3 to 4 Year Olds | 1 (100.0%) | 0 (0.0%) |
| 5 to 9 Year Old | 2 (100.0%) | 0 (0.0%) |
| 10 to 14 Year Olds | 5 (71.4%) | 2 (28.6%) |
| 15 to 17 Year Olds | 2 (66.7%) | 1 (33.3%) |
| 18 to 19 Year Olds | 2 (100.0%) | 0 (0.0%) |
| 20 to 24 Year Olds | 0 (0.0%) | 2 (100.0%) |
| 25 to 34 Year Olds | 0 (0.0%) | 0 (0.0%) |
| 35 Years and over | 0 (0.0%) | 0 (0.0%) |
| Total | 12 (70.6%) | 5 (29.4%) |
Educational Attainment by Field of Study in Forestville
Education (6 | 40.0%), communications (4 | 26.7%), science & technology (2 | 13.3%), business (2 | 13.3%), and liberal arts & history (1 | 6.7%) are the most common fields of study among 15 individuals in Forestville who have obtained a bachelor's degree or higher.
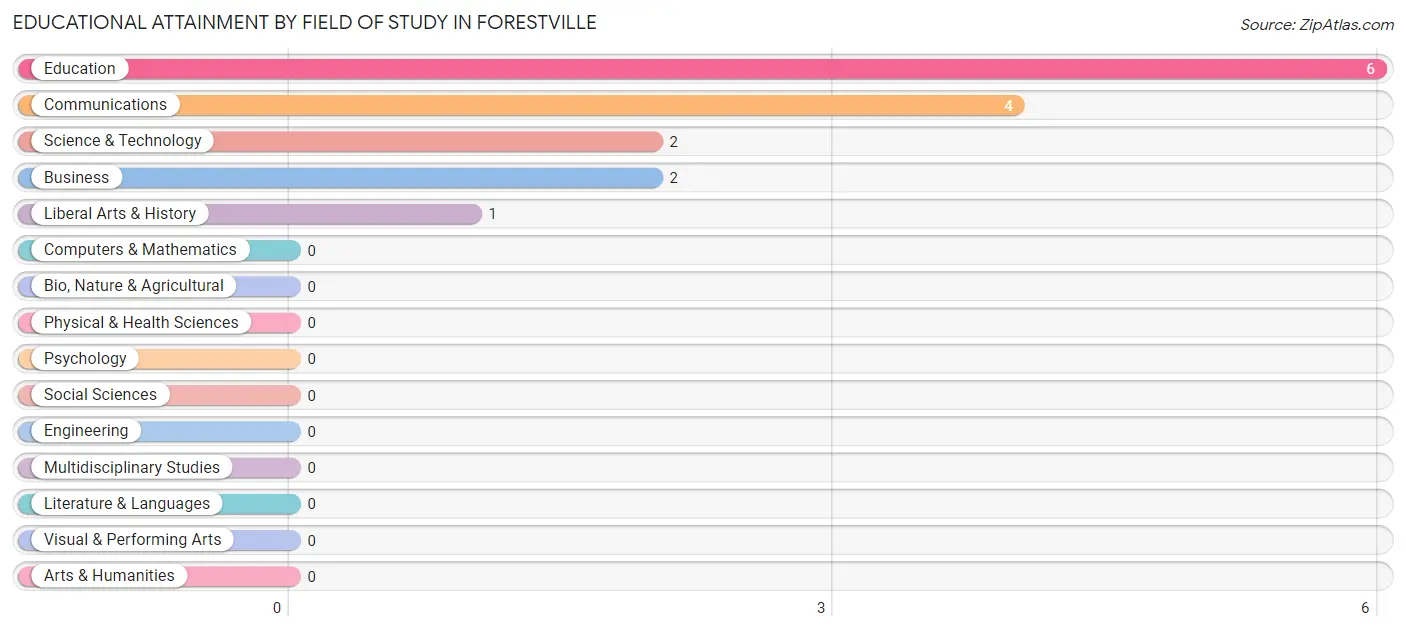
| Field of Study | # Graduates | % Graduates |
| Computers & Mathematics | 0 | 0.0% |
| Bio, Nature & Agricultural | 0 | 0.0% |
| Physical & Health Sciences | 0 | 0.0% |
| Psychology | 0 | 0.0% |
| Social Sciences | 0 | 0.0% |
| Engineering | 0 | 0.0% |
| Multidisciplinary Studies | 0 | 0.0% |
| Science & Technology | 2 | 13.3% |
| Business | 2 | 13.3% |
| Education | 6 | 40.0% |
| Literature & Languages | 0 | 0.0% |
| Liberal Arts & History | 1 | 6.7% |
| Visual & Performing Arts | 0 | 0.0% |
| Communications | 4 | 26.7% |
| Arts & Humanities | 0 | 0.0% |
| Total | 15 | 100.0% |
Transportation & Commute in Forestville
Vehicle Availability by Sex in Forestville
The most prevalent vehicle ownership categories in Forestville are males with 4 vehicles (8, accounting for 57.1%) and females with 4 vehicles (2, making up 42.1%).
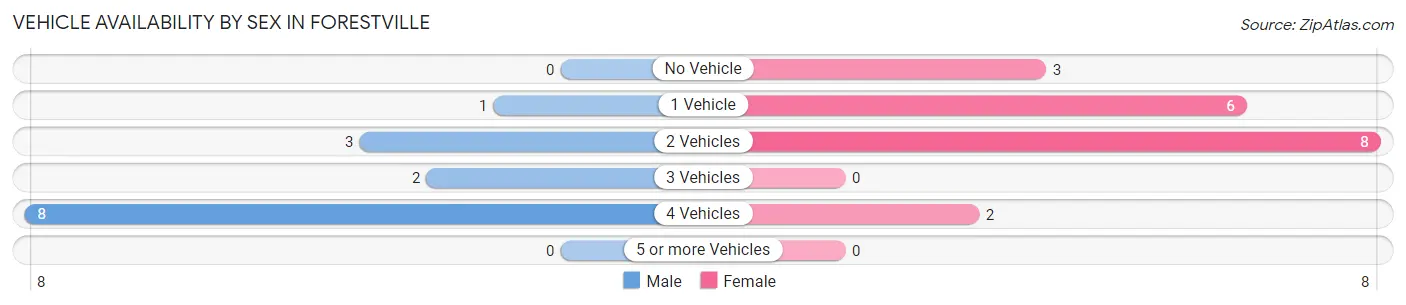
| Vehicles Available | Male | Female |
| No Vehicle | 0 (0.0%) | 3 (15.8%) |
| 1 Vehicle | 1 (7.1%) | 6 (31.6%) |
| 2 Vehicles | 3 (21.4%) | 8 (42.1%) |
| 3 Vehicles | 2 (14.3%) | 0 (0.0%) |
| 4 Vehicles | 8 (57.1%) | 2 (10.5%) |
| 5 or more Vehicles | 0 (0.0%) | 0 (0.0%) |
| Total | 14 (100.0%) | 19 (100.0%) |
Commute Time in Forestville
The most frequently occuring commute durations in Forestville are 30 to 34 minutes (9 commuters, 30.0%), 10 to 14 minutes (5 commuters, 16.7%), and 35 to 39 minutes (4 commuters, 13.3%).
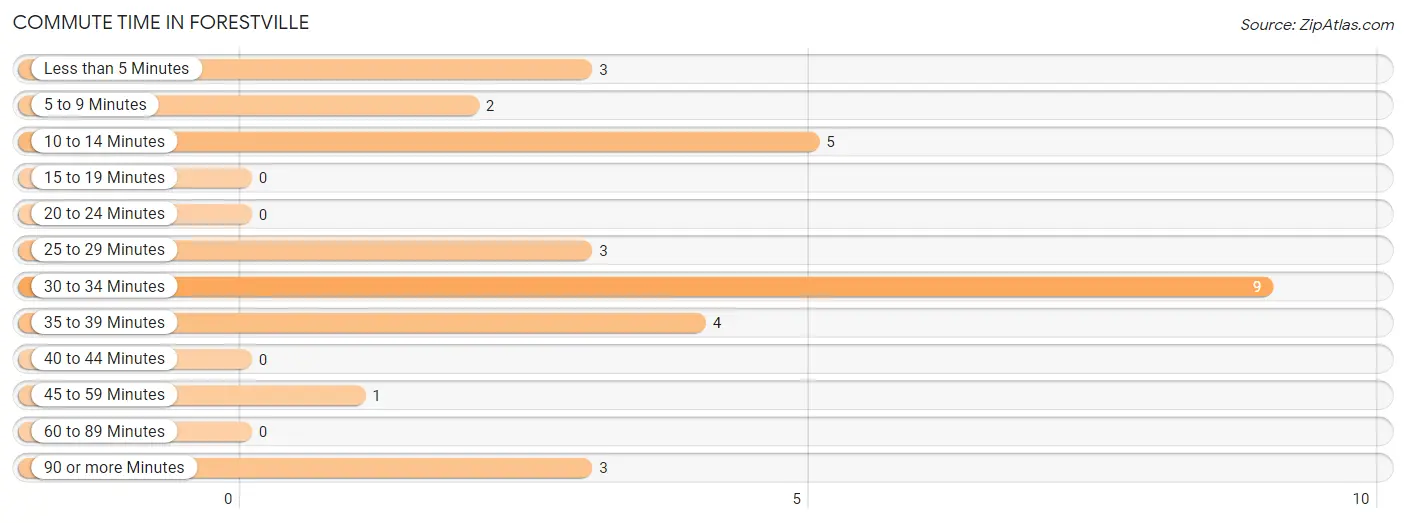
| Commute Time | # Commuters | % Commuters |
| Less than 5 Minutes | 3 | 10.0% |
| 5 to 9 Minutes | 2 | 6.7% |
| 10 to 14 Minutes | 5 | 16.7% |
| 15 to 19 Minutes | 0 | 0.0% |
| 20 to 24 Minutes | 0 | 0.0% |
| 25 to 29 Minutes | 3 | 10.0% |
| 30 to 34 Minutes | 9 | 30.0% |
| 35 to 39 Minutes | 4 | 13.3% |
| 40 to 44 Minutes | 0 | 0.0% |
| 45 to 59 Minutes | 1 | 3.3% |
| 60 to 89 Minutes | 0 | 0.0% |
| 90 or more Minutes | 3 | 10.0% |
Commute Time by Sex in Forestville
The most common commute times in Forestville are 30 to 34 minutes (5 commuters, 35.7%) for males and 30 to 34 minutes (4 commuters, 25.0%) for females.
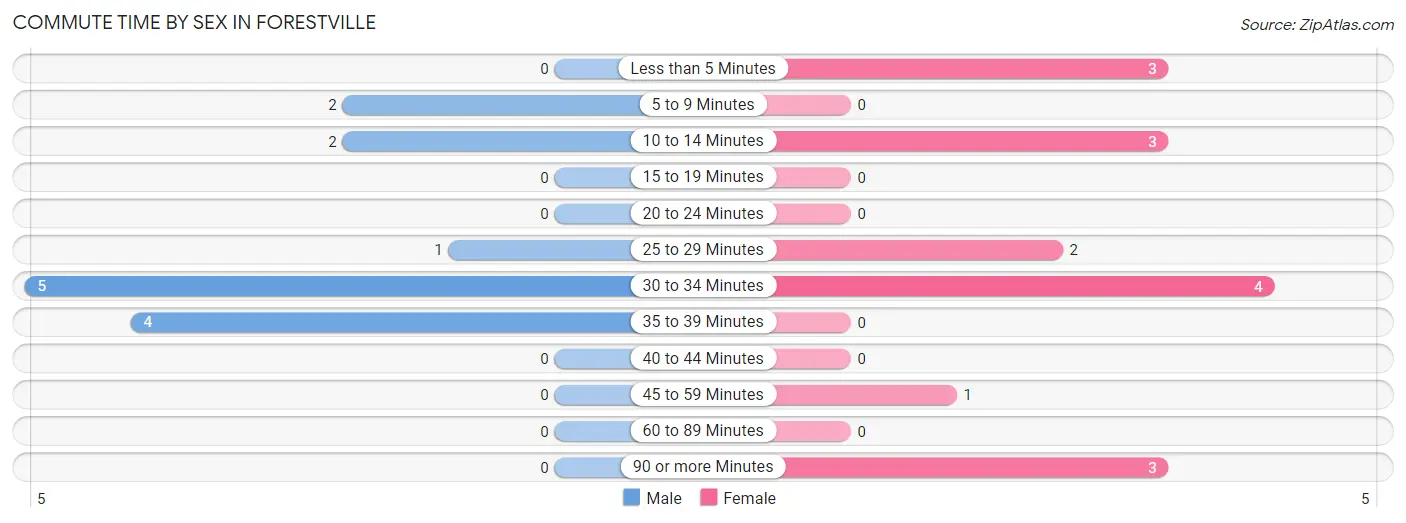
| Commute Time | Male | Female |
| Less than 5 Minutes | 0 (0.0%) | 3 (18.8%) |
| 5 to 9 Minutes | 2 (14.3%) | 0 (0.0%) |
| 10 to 14 Minutes | 2 (14.3%) | 3 (18.8%) |
| 15 to 19 Minutes | 0 (0.0%) | 0 (0.0%) |
| 20 to 24 Minutes | 0 (0.0%) | 0 (0.0%) |
| 25 to 29 Minutes | 1 (7.1%) | 2 (12.5%) |
| 30 to 34 Minutes | 5 (35.7%) | 4 (25.0%) |
| 35 to 39 Minutes | 4 (28.6%) | 0 (0.0%) |
| 40 to 44 Minutes | 0 (0.0%) | 0 (0.0%) |
| 45 to 59 Minutes | 0 (0.0%) | 1 (6.2%) |
| 60 to 89 Minutes | 0 (0.0%) | 0 (0.0%) |
| 90 or more Minutes | 0 (0.0%) | 3 (18.8%) |
Time of Departure to Work by Sex in Forestville
The most frequent times of departure to work in Forestville are 6:30 AM to 6:59 AM (5, 35.7%) for males and 5:30 AM to 5:59 AM (5, 31.2%) for females.
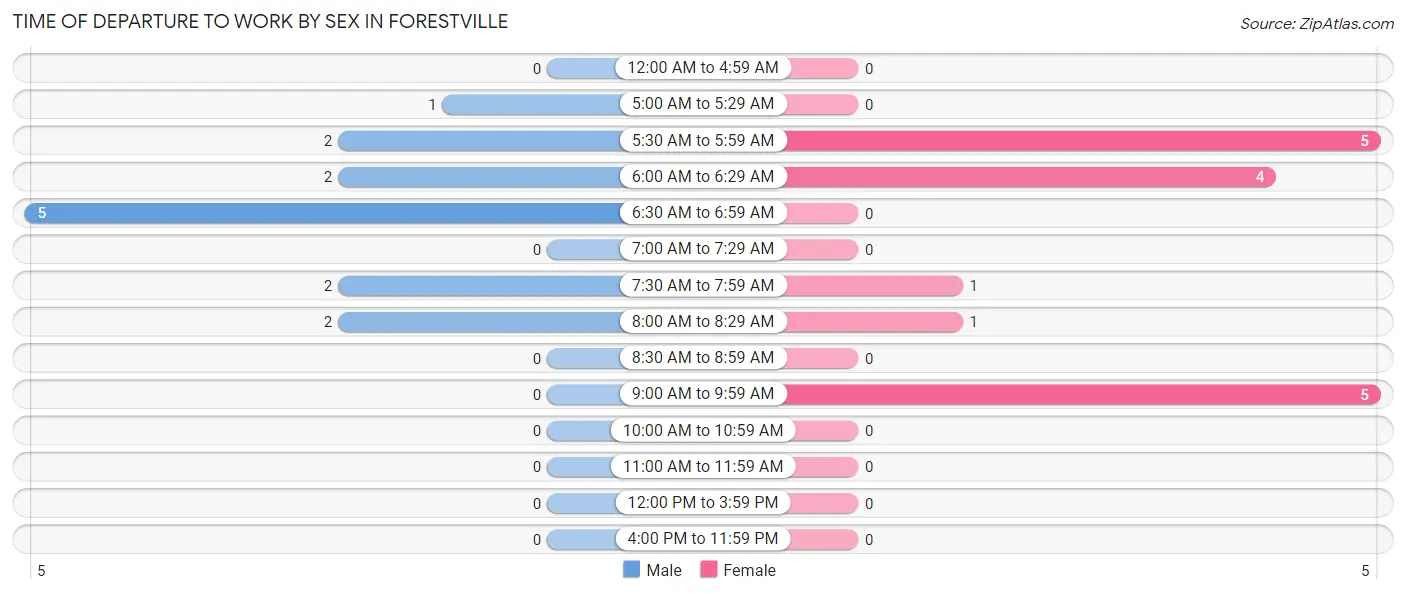
| Time of Departure | Male | Female |
| 12:00 AM to 4:59 AM | 0 (0.0%) | 0 (0.0%) |
| 5:00 AM to 5:29 AM | 1 (7.1%) | 0 (0.0%) |
| 5:30 AM to 5:59 AM | 2 (14.3%) | 5 (31.2%) |
| 6:00 AM to 6:29 AM | 2 (14.3%) | 4 (25.0%) |
| 6:30 AM to 6:59 AM | 5 (35.7%) | 0 (0.0%) |
| 7:00 AM to 7:29 AM | 0 (0.0%) | 0 (0.0%) |
| 7:30 AM to 7:59 AM | 2 (14.3%) | 1 (6.2%) |
| 8:00 AM to 8:29 AM | 2 (14.3%) | 1 (6.2%) |
| 8:30 AM to 8:59 AM | 0 (0.0%) | 0 (0.0%) |
| 9:00 AM to 9:59 AM | 0 (0.0%) | 5 (31.2%) |
| 10:00 AM to 10:59 AM | 0 (0.0%) | 0 (0.0%) |
| 11:00 AM to 11:59 AM | 0 (0.0%) | 0 (0.0%) |
| 12:00 PM to 3:59 PM | 0 (0.0%) | 0 (0.0%) |
| 4:00 PM to 11:59 PM | 0 (0.0%) | 0 (0.0%) |
| Total | 14 (100.0%) | 16 (100.0%) |
Housing Occupancy in Forestville
Occupancy by Ownership in Forestville
Of the total 64 dwellings in Forestville, owner-occupied units account for 47 (73.4%), while renter-occupied units make up 17 (26.6%).
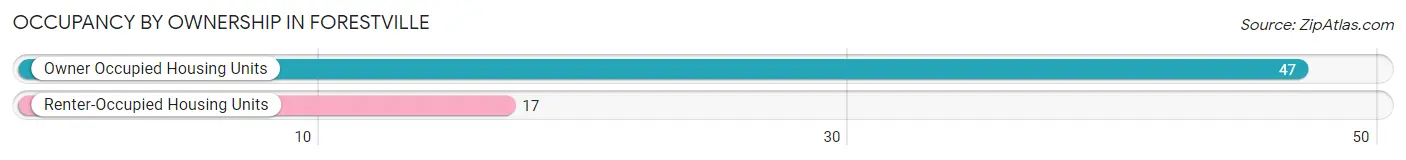
| Occupancy | # Housing Units | % Housing Units |
| Owner Occupied Housing Units | 47 | 73.4% |
| Renter-Occupied Housing Units | 17 | 26.6% |
| Total Occupied Housing Units | 64 | 100.0% |
Occupancy by Household Size in Forestville
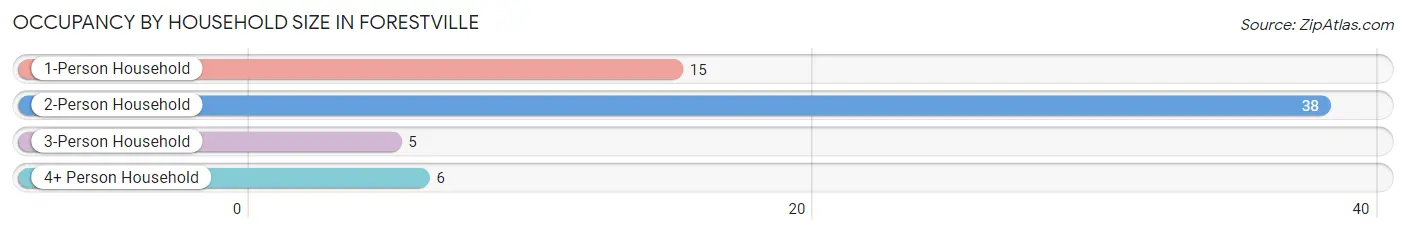
| Household Size | # Housing Units | % Housing Units |
| 1-Person Household | 15 | 23.4% |
| 2-Person Household | 38 | 59.4% |
| 3-Person Household | 5 | 7.8% |
| 4+ Person Household | 6 | 9.4% |
| Total Housing Units | 64 | 100.0% |
Occupancy by Ownership by Household Size in Forestville
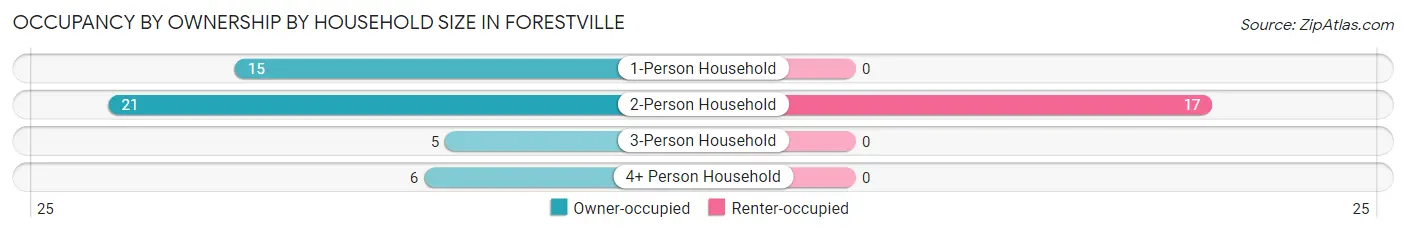
| Household Size | Owner-occupied | Renter-occupied |
| 1-Person Household | 15 (100.0%) | 0 (0.0%) |
| 2-Person Household | 21 (55.3%) | 17 (44.7%) |
| 3-Person Household | 5 (100.0%) | 0 (0.0%) |
| 4+ Person Household | 6 (100.0%) | 0 (0.0%) |
| Total Housing Units | 47 (73.4%) | 17 (26.6%) |
Occupancy by Educational Attainment in Forestville
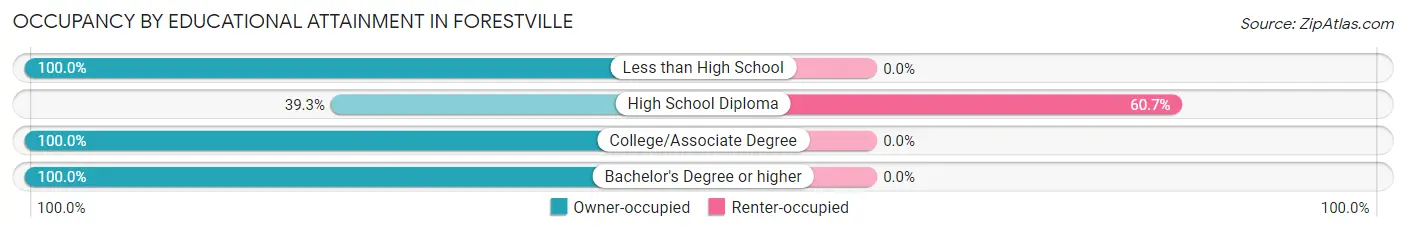
| Household Size | Owner-occupied | Renter-occupied |
| Less than High School | 6 (100.0%) | 0 (0.0%) |
| High School Diploma | 11 (39.3%) | 17 (60.7%) |
| College/Associate Degree | 23 (100.0%) | 0 (0.0%) |
| Bachelor's Degree or higher | 7 (100.0%) | 0 (0.0%) |
Occupancy by Age of Householder in Forestville
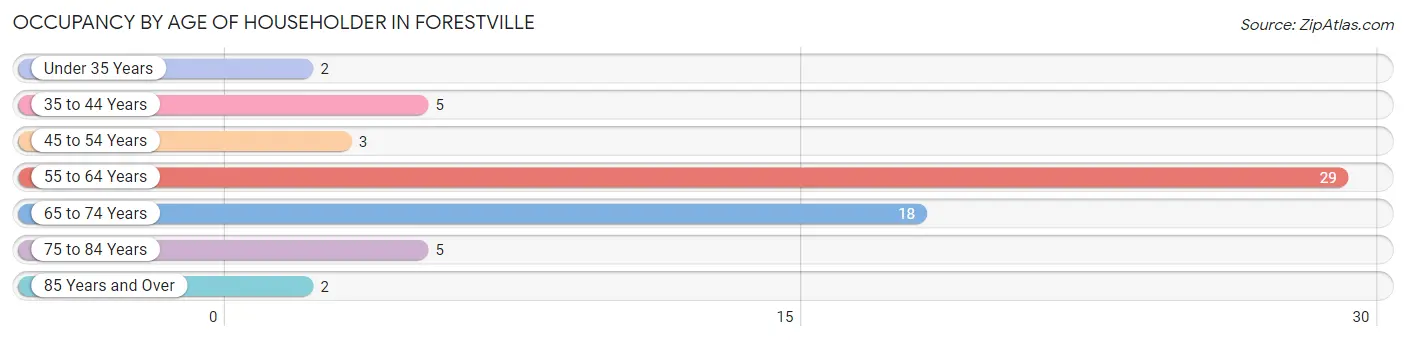
| Age Bracket | # Households | % Households |
| Under 35 Years | 2 | 3.1% |
| 35 to 44 Years | 5 | 7.8% |
| 45 to 54 Years | 3 | 4.7% |
| 55 to 64 Years | 29 | 45.3% |
| 65 to 74 Years | 18 | 28.1% |
| 75 to 84 Years | 5 | 7.8% |
| 85 Years and Over | 2 | 3.1% |
| Total | 64 | 100.0% |
Housing Finances in Forestville
Median Income by Occupancy in Forestville
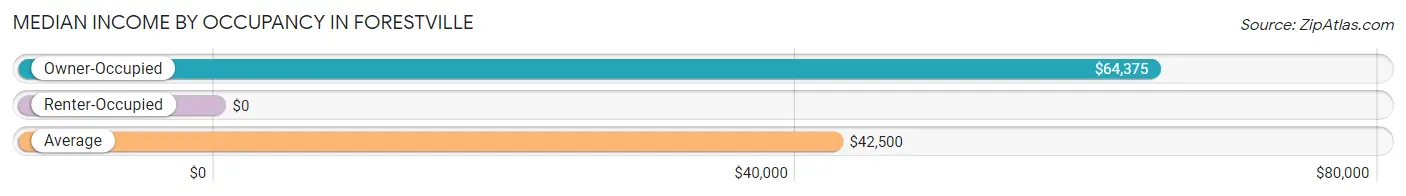
| Occupancy Type | # Households | Median Income |
| Owner-Occupied | 47 (73.4%) | $64,375 |
| Renter-Occupied | 17 (26.6%) | $0 |
| Average | 64 (100.0%) | $42,500 |
Occupancy by Householder Income Bracket in Forestville
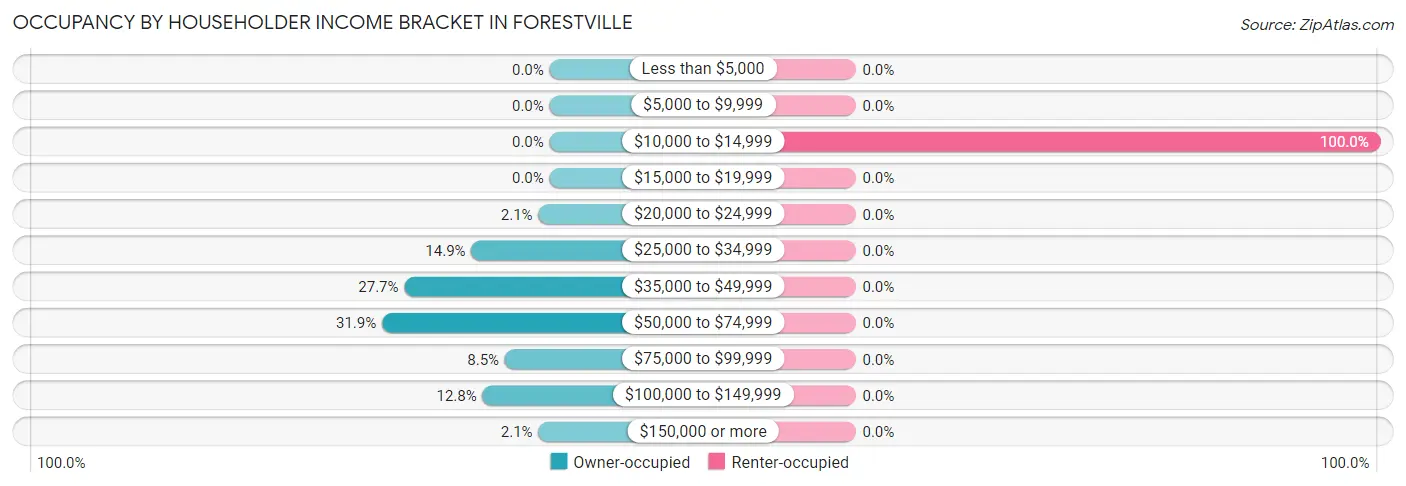
| Income Bracket | Owner-occupied | Renter-occupied |
| Less than $5,000 | 0 (0.0%) | 0 (0.0%) |
| $5,000 to $9,999 | 0 (0.0%) | 0 (0.0%) |
| $10,000 to $14,999 | 0 (0.0%) | 17 (100.0%) |
| $15,000 to $19,999 | 0 (0.0%) | 0 (0.0%) |
| $20,000 to $24,999 | 1 (2.1%) | 0 (0.0%) |
| $25,000 to $34,999 | 7 (14.9%) | 0 (0.0%) |
| $35,000 to $49,999 | 13 (27.7%) | 0 (0.0%) |
| $50,000 to $74,999 | 15 (31.9%) | 0 (0.0%) |
| $75,000 to $99,999 | 4 (8.5%) | 0 (0.0%) |
| $100,000 to $149,999 | 6 (12.8%) | 0 (0.0%) |
| $150,000 or more | 1 (2.1%) | 0 (0.0%) |
| Total | 47 (100.0%) | 17 (100.0%) |
Monthly Housing Cost Tiers in Forestville
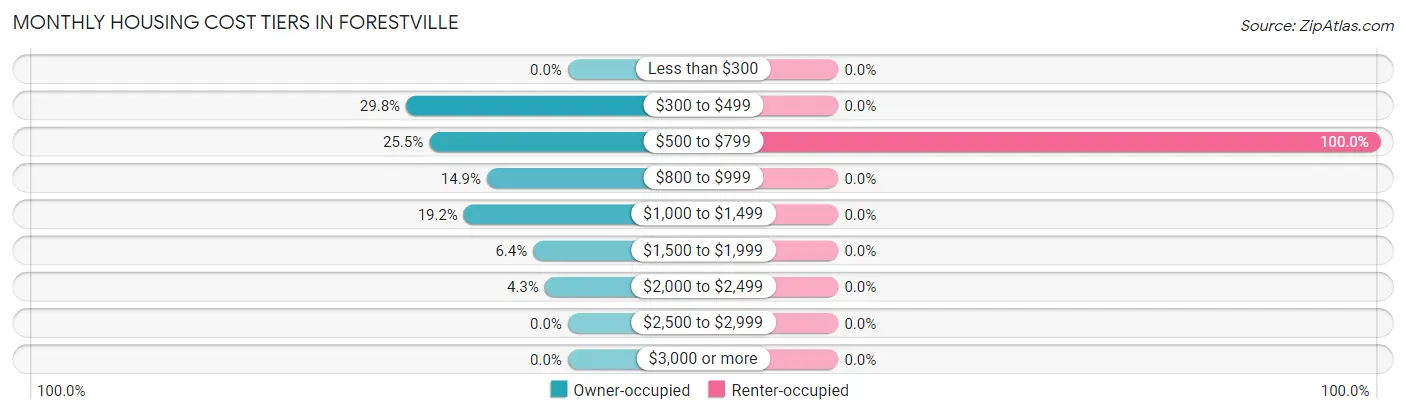
| Monthly Cost | Owner-occupied | Renter-occupied |
| Less than $300 | 0 (0.0%) | 0 (0.0%) |
| $300 to $499 | 14 (29.8%) | 0 (0.0%) |
| $500 to $799 | 12 (25.5%) | 17 (100.0%) |
| $800 to $999 | 7 (14.9%) | 0 (0.0%) |
| $1,000 to $1,499 | 9 (19.2%) | 0 (0.0%) |
| $1,500 to $1,999 | 3 (6.4%) | 0 (0.0%) |
| $2,000 to $2,499 | 2 (4.3%) | 0 (0.0%) |
| $2,500 to $2,999 | 0 (0.0%) | 0 (0.0%) |
| $3,000 or more | 0 (0.0%) | 0 (0.0%) |
| Total | 47 (100.0%) | 17 (100.0%) |
Physical Housing Characteristics in Forestville
Housing Structures in Forestville
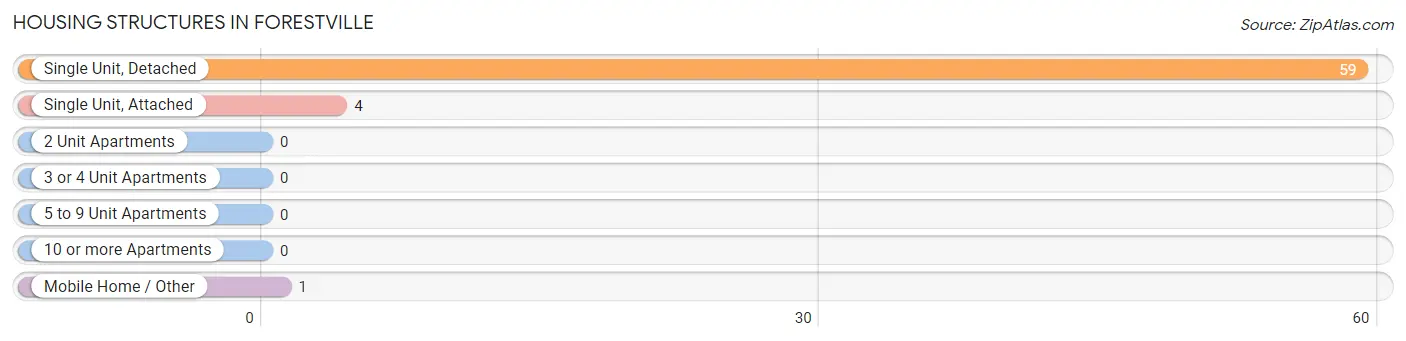
| Structure Type | # Housing Units | % Housing Units |
| Single Unit, Detached | 59 | 92.2% |
| Single Unit, Attached | 4 | 6.2% |
| 2 Unit Apartments | 0 | 0.0% |
| 3 or 4 Unit Apartments | 0 | 0.0% |
| 5 to 9 Unit Apartments | 0 | 0.0% |
| 10 or more Apartments | 0 | 0.0% |
| Mobile Home / Other | 1 | 1.6% |
| Total | 64 | 100.0% |
Housing Structures by Occupancy in Forestville
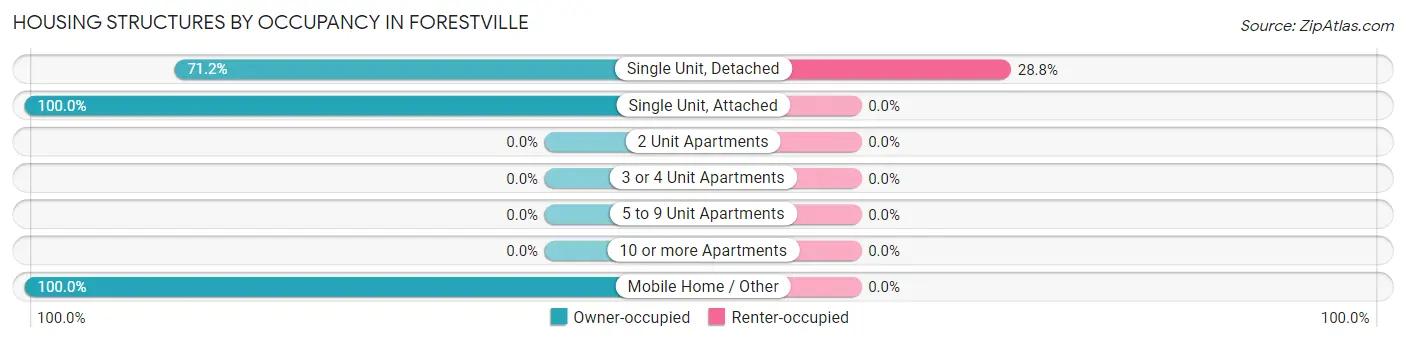
| Structure Type | Owner-occupied | Renter-occupied |
| Single Unit, Detached | 42 (71.2%) | 17 (28.8%) |
| Single Unit, Attached | 4 (100.0%) | 0 (0.0%) |
| 2 Unit Apartments | 0 (0.0%) | 0 (0.0%) |
| 3 or 4 Unit Apartments | 0 (0.0%) | 0 (0.0%) |
| 5 to 9 Unit Apartments | 0 (0.0%) | 0 (0.0%) |
| 10 or more Apartments | 0 (0.0%) | 0 (0.0%) |
| Mobile Home / Other | 1 (100.0%) | 0 (0.0%) |
| Total | 47 (73.4%) | 17 (26.6%) |
Housing Structures by Number of Rooms in Forestville
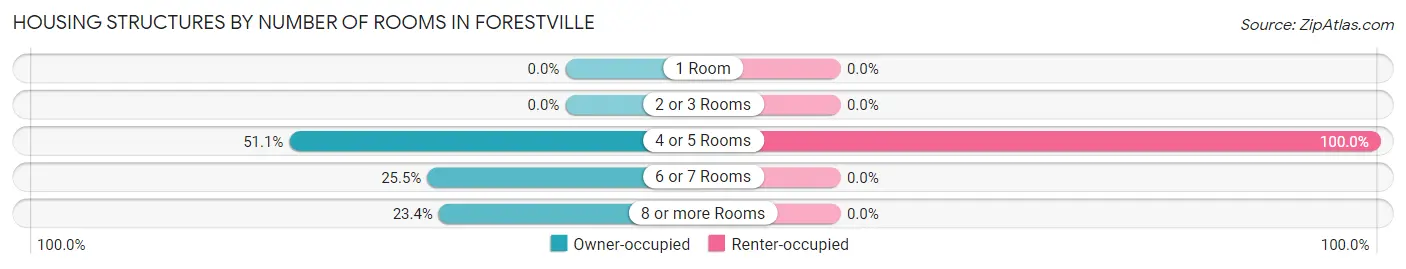
| Number of Rooms | Owner-occupied | Renter-occupied |
| 1 Room | 0 (0.0%) | 0 (0.0%) |
| 2 or 3 Rooms | 0 (0.0%) | 0 (0.0%) |
| 4 or 5 Rooms | 24 (51.1%) | 17 (100.0%) |
| 6 or 7 Rooms | 12 (25.5%) | 0 (0.0%) |
| 8 or more Rooms | 11 (23.4%) | 0 (0.0%) |
| Total | 47 (100.0%) | 17 (100.0%) |
Housing Structure by Heating Type in Forestville
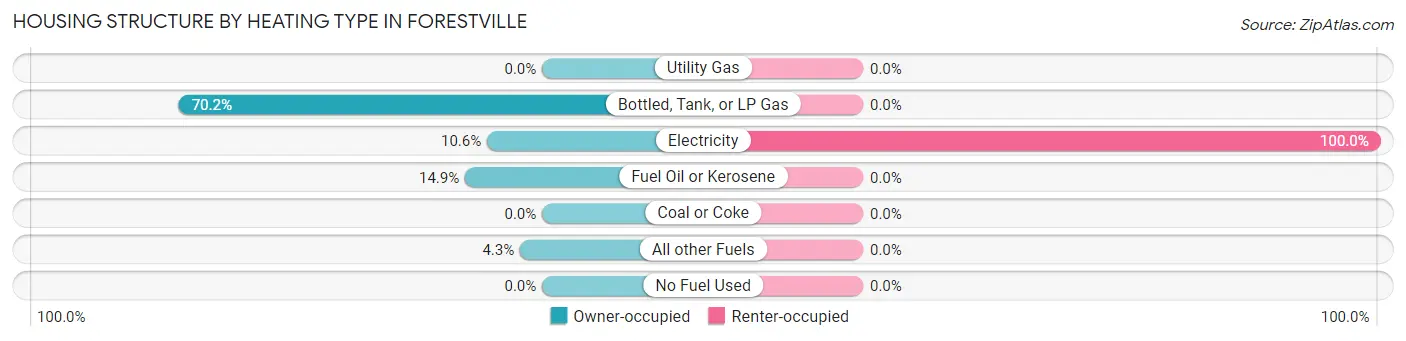
| Heating Type | Owner-occupied | Renter-occupied |
| Utility Gas | 0 (0.0%) | 0 (0.0%) |
| Bottled, Tank, or LP Gas | 33 (70.2%) | 0 (0.0%) |
| Electricity | 5 (10.6%) | 17 (100.0%) |
| Fuel Oil or Kerosene | 7 (14.9%) | 0 (0.0%) |
| Coal or Coke | 0 (0.0%) | 0 (0.0%) |
| All other Fuels | 2 (4.3%) | 0 (0.0%) |
| No Fuel Used | 0 (0.0%) | 0 (0.0%) |
| Total | 47 (100.0%) | 17 (100.0%) |
Household Vehicle Usage in Forestville
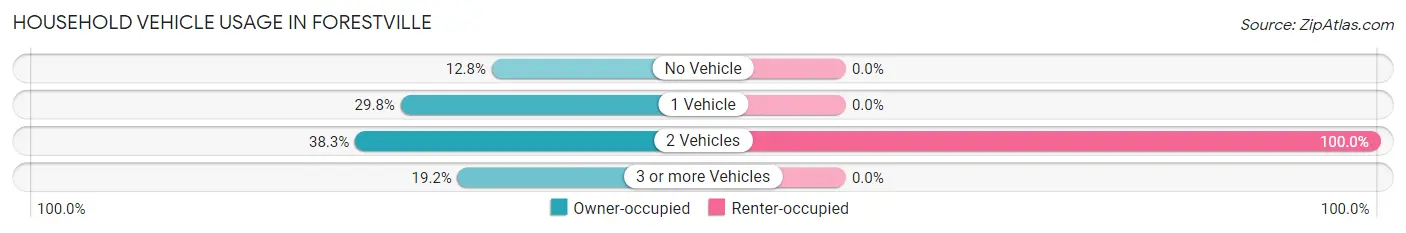
| Vehicles per Household | Owner-occupied | Renter-occupied |
| No Vehicle | 6 (12.8%) | 0 (0.0%) |
| 1 Vehicle | 14 (29.8%) | 0 (0.0%) |
| 2 Vehicles | 18 (38.3%) | 17 (100.0%) |
| 3 or more Vehicles | 9 (19.2%) | 0 (0.0%) |
| Total | 47 (100.0%) | 17 (100.0%) |
Real Estate & Mortgages in Forestville
Real Estate and Mortgage Overview in Forestville
| Characteristic | Without Mortgage | With Mortgage |
| Housing Units | 28 | 19 |
| Median Property Value | $66,700 | $144,600 |
| Median Household Income | $46,667 | $1 |
| Monthly Housing Costs | $500 | $0 |
| Real Estate Taxes | $1,450 | $3 |
Property Value by Mortgage Status in Forestville
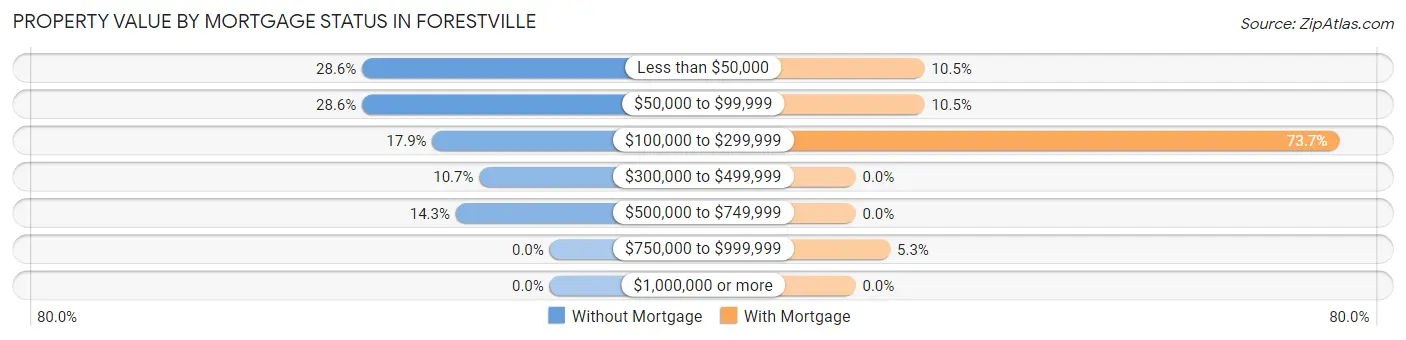
| Property Value | Without Mortgage | With Mortgage |
| Less than $50,000 | 8 (28.6%) | 2 (10.5%) |
| $50,000 to $99,999 | 8 (28.6%) | 2 (10.5%) |
| $100,000 to $299,999 | 5 (17.9%) | 14 (73.7%) |
| $300,000 to $499,999 | 3 (10.7%) | 0 (0.0%) |
| $500,000 to $749,999 | 4 (14.3%) | 0 (0.0%) |
| $750,000 to $999,999 | 0 (0.0%) | 1 (5.3%) |
| $1,000,000 or more | 0 (0.0%) | 0 (0.0%) |
| Total | 28 (100.0%) | 19 (100.0%) |
Household Income by Mortgage Status in Forestville
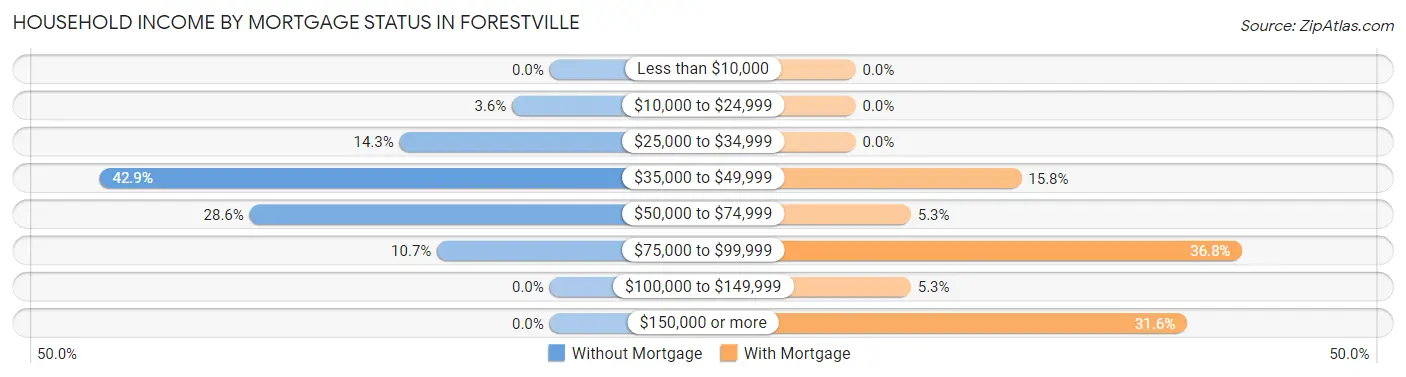
| Household Income | Without Mortgage | With Mortgage |
| Less than $10,000 | 0 (0.0%) | 0 (0.0%) |
| $10,000 to $24,999 | 1 (3.6%) | 0 (0.0%) |
| $25,000 to $34,999 | 4 (14.3%) | 0 (0.0%) |
| $35,000 to $49,999 | 12 (42.9%) | 3 (15.8%) |
| $50,000 to $74,999 | 8 (28.6%) | 1 (5.3%) |
| $75,000 to $99,999 | 3 (10.7%) | 7 (36.8%) |
| $100,000 to $149,999 | 0 (0.0%) | 1 (5.3%) |
| $150,000 or more | 0 (0.0%) | 6 (31.6%) |
| Total | 28 (100.0%) | 19 (100.0%) |
Property Value to Household Income Ratio in Forestville
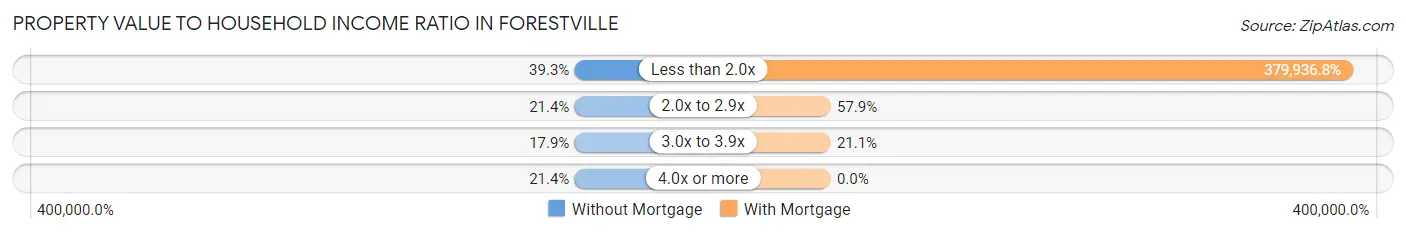
| Value-to-Income Ratio | Without Mortgage | With Mortgage |
| Less than 2.0x | 11 (39.3%) | 72,188 (379,936.8%) |
| 2.0x to 2.9x | 6 (21.4%) | 11 (57.9%) |
| 3.0x to 3.9x | 5 (17.9%) | 4 (21.0%) |
| 4.0x or more | 6 (21.4%) | 0 (0.0%) |
| Total | 28 (100.0%) | 19 (100.0%) |
Real Estate Taxes by Mortgage Status in Forestville
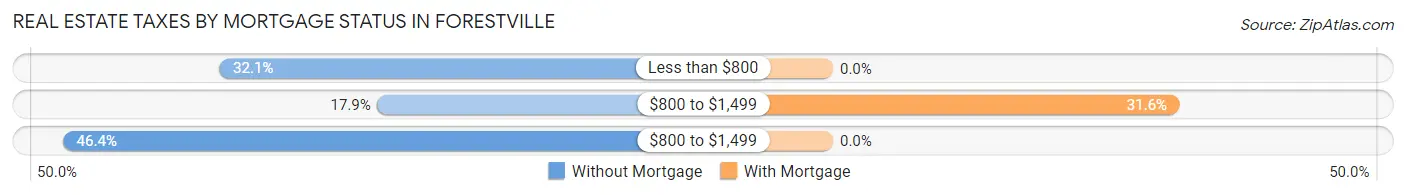
| Property Taxes | Without Mortgage | With Mortgage |
| Less than $800 | 9 (32.1%) | 0 (0.0%) |
| $800 to $1,499 | 5 (17.9%) | 6 (31.6%) |
| $800 to $1,499 | 13 (46.4%) | 0 (0.0%) |
| Total | 28 (100.0%) | 19 (100.0%) |
Health & Disability in Forestville
Health Insurance Coverage by Age in Forestville
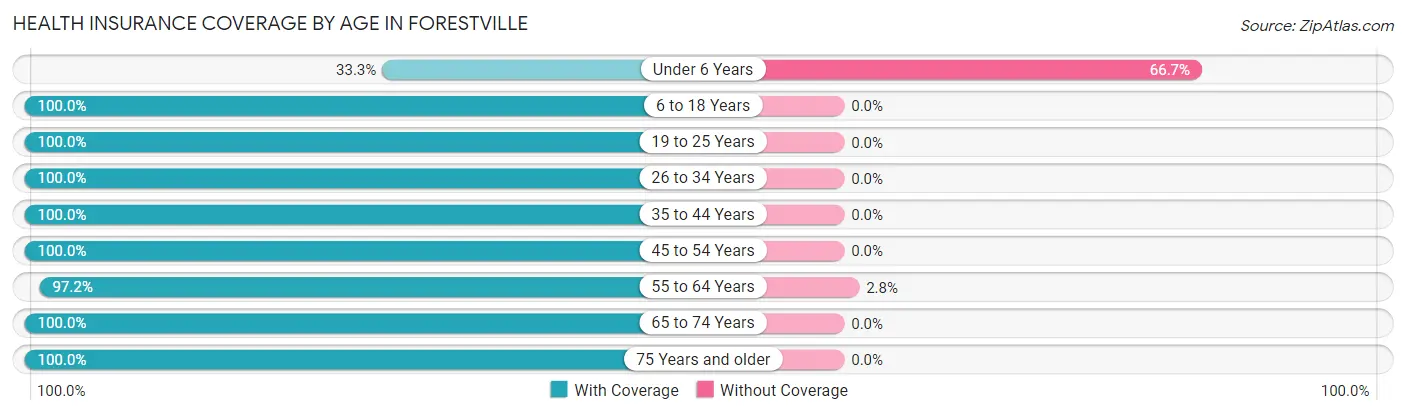
| Age Bracket | With Coverage | Without Coverage |
| Under 6 Years | 1 (33.3%) | 2 (66.7%) |
| 6 to 18 Years | 12 (100.0%) | 0 (0.0%) |
| 19 to 25 Years | 6 (100.0%) | 0 (0.0%) |
| 26 to 34 Years | 3 (100.0%) | 0 (0.0%) |
| 35 to 44 Years | 10 (100.0%) | 0 (0.0%) |
| 45 to 54 Years | 6 (100.0%) | 0 (0.0%) |
| 55 to 64 Years | 35 (97.2%) | 1 (2.8%) |
| 65 to 74 Years | 45 (100.0%) | 0 (0.0%) |
| 75 Years and older | 11 (100.0%) | 0 (0.0%) |
| Total | 129 (97.7%) | 3 (2.3%) |
Health Insurance Coverage by Citizenship Status in Forestville
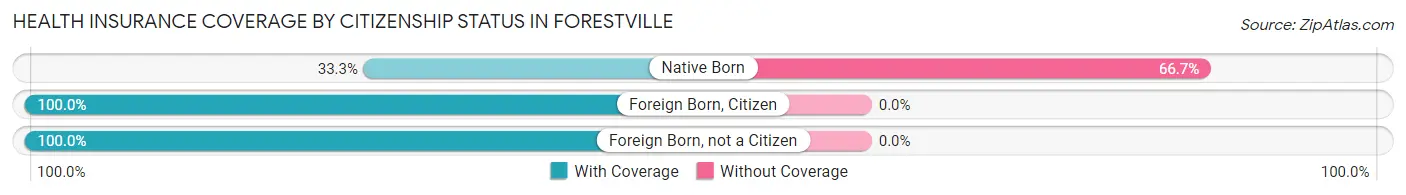
| Citizenship Status | With Coverage | Without Coverage |
| Native Born | 1 (33.3%) | 2 (66.7%) |
| Foreign Born, Citizen | 12 (100.0%) | 0 (0.0%) |
| Foreign Born, not a Citizen | 6 (100.0%) | 0 (0.0%) |
Health Insurance Coverage by Household Income in Forestville
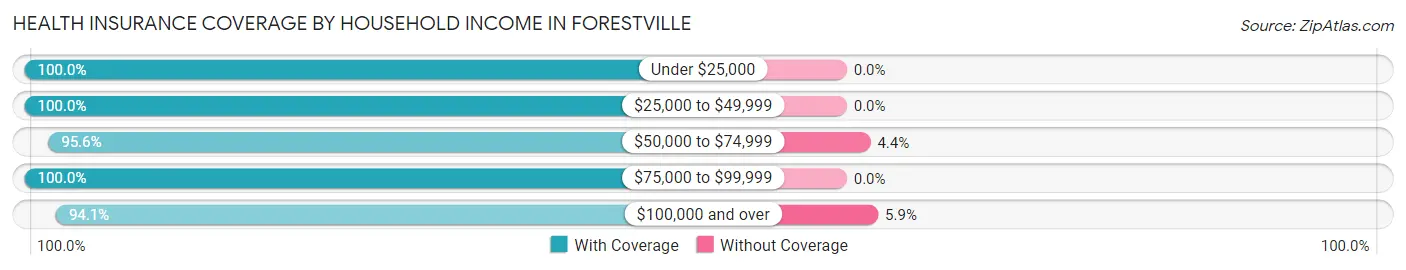
| Household Income | With Coverage | Without Coverage |
| Under $25,000 | 30 (100.0%) | 0 (0.0%) |
| $25,000 to $49,999 | 28 (100.0%) | 0 (0.0%) |
| $50,000 to $74,999 | 43 (95.6%) | 2 (4.4%) |
| $75,000 to $99,999 | 12 (100.0%) | 0 (0.0%) |
| $100,000 and over | 16 (94.1%) | 1 (5.9%) |
Public vs Private Health Insurance Coverage by Age in Forestville
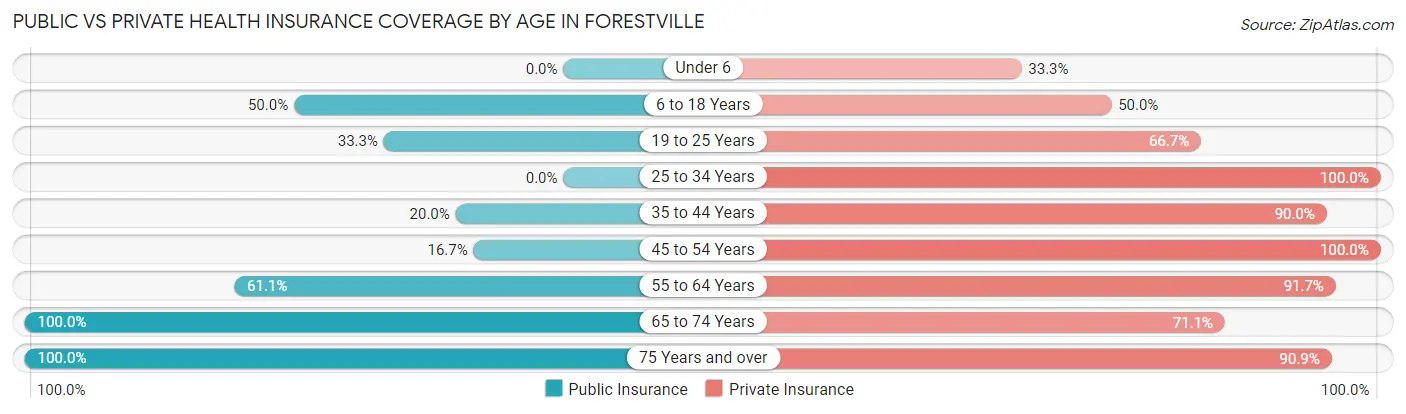
| Age Bracket | Public Insurance | Private Insurance |
| Under 6 | 0 (0.0%) | 1 (33.3%) |
| 6 to 18 Years | 6 (50.0%) | 6 (50.0%) |
| 19 to 25 Years | 2 (33.3%) | 4 (66.7%) |
| 25 to 34 Years | 0 (0.0%) | 3 (100.0%) |
| 35 to 44 Years | 2 (20.0%) | 9 (90.0%) |
| 45 to 54 Years | 1 (16.7%) | 6 (100.0%) |
| 55 to 64 Years | 22 (61.1%) | 33 (91.7%) |
| 65 to 74 Years | 45 (100.0%) | 32 (71.1%) |
| 75 Years and over | 11 (100.0%) | 10 (90.9%) |
| Total | 89 (67.4%) | 104 (78.8%) |
Disability Status by Sex by Age in Forestville
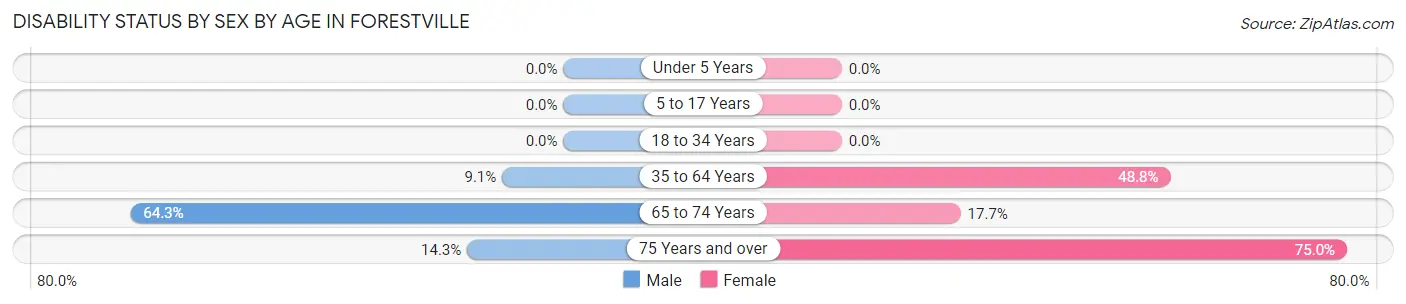
| Age Bracket | Male | Female |
| Under 5 Years | 0 (0.0%) | 0 (0.0%) |
| 5 to 17 Years | 0 (0.0%) | 0 (0.0%) |
| 18 to 34 Years | 0 (0.0%) | 0 (0.0%) |
| 35 to 64 Years | 1 (9.1%) | 20 (48.8%) |
| 65 to 74 Years | 18 (64.3%) | 3 (17.6%) |
| 75 Years and over | 1 (14.3%) | 3 (75.0%) |
Disability Class by Sex by Age in Forestville
Disability Class: Hearing Difficulty
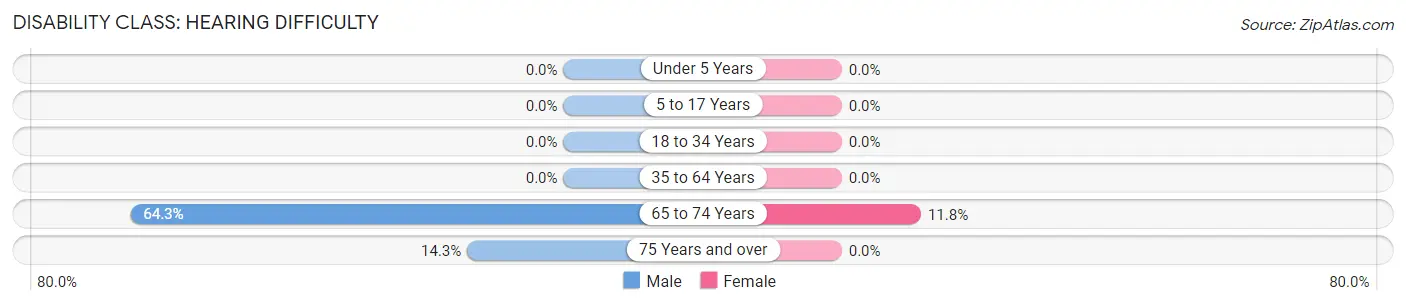
| Age Bracket | Male | Female |
| Under 5 Years | 0 (0.0%) | 0 (0.0%) |
| 5 to 17 Years | 0 (0.0%) | 0 (0.0%) |
| 18 to 34 Years | 0 (0.0%) | 0 (0.0%) |
| 35 to 64 Years | 0 (0.0%) | 0 (0.0%) |
| 65 to 74 Years | 18 (64.3%) | 2 (11.8%) |
| 75 Years and over | 1 (14.3%) | 0 (0.0%) |
Disability Class: Vision Difficulty
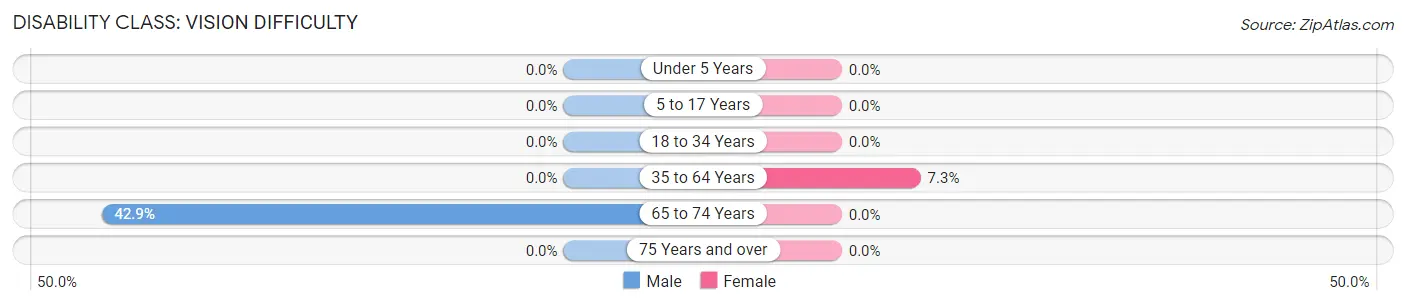
| Age Bracket | Male | Female |
| Under 5 Years | 0 (0.0%) | 0 (0.0%) |
| 5 to 17 Years | 0 (0.0%) | 0 (0.0%) |
| 18 to 34 Years | 0 (0.0%) | 0 (0.0%) |
| 35 to 64 Years | 0 (0.0%) | 3 (7.3%) |
| 65 to 74 Years | 12 (42.9%) | 0 (0.0%) |
| 75 Years and over | 0 (0.0%) | 0 (0.0%) |
Disability Class: Cognitive Difficulty
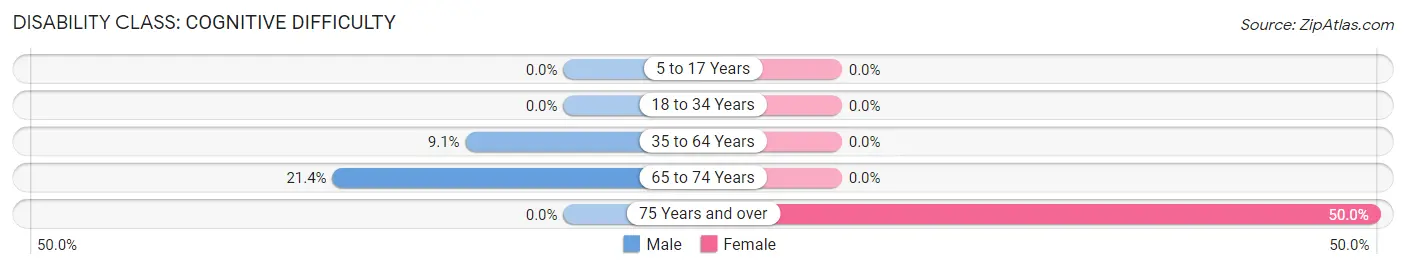
| Age Bracket | Male | Female |
| 5 to 17 Years | 0 (0.0%) | 0 (0.0%) |
| 18 to 34 Years | 0 (0.0%) | 0 (0.0%) |
| 35 to 64 Years | 1 (9.1%) | 0 (0.0%) |
| 65 to 74 Years | 6 (21.4%) | 0 (0.0%) |
| 75 Years and over | 0 (0.0%) | 2 (50.0%) |
Disability Class: Ambulatory Difficulty
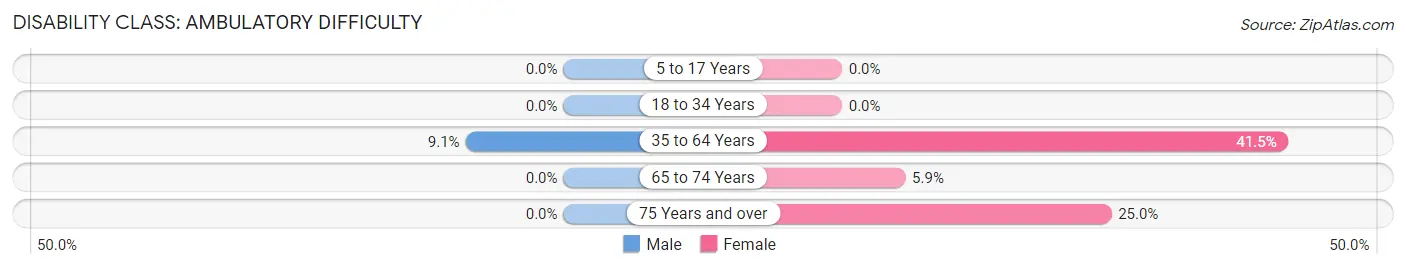
| Age Bracket | Male | Female |
| 5 to 17 Years | 0 (0.0%) | 0 (0.0%) |
| 18 to 34 Years | 0 (0.0%) | 0 (0.0%) |
| 35 to 64 Years | 1 (9.1%) | 17 (41.5%) |
| 65 to 74 Years | 0 (0.0%) | 1 (5.9%) |
| 75 Years and over | 0 (0.0%) | 1 (25.0%) |
Disability Class: Self-Care Difficulty
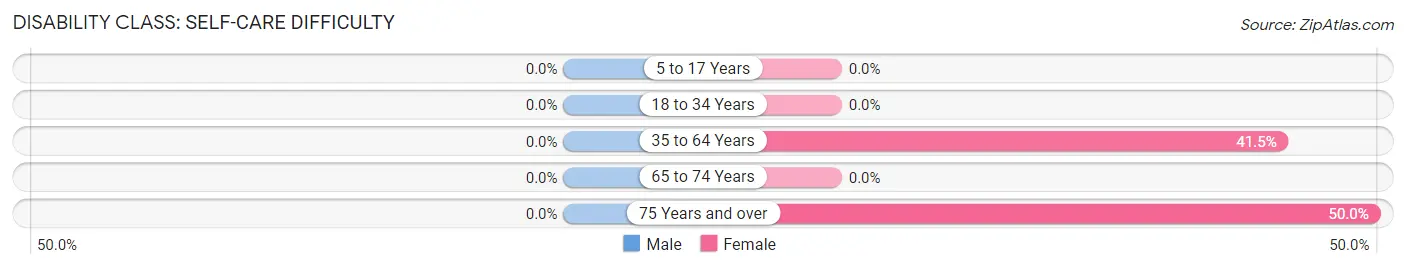
| Age Bracket | Male | Female |
| 5 to 17 Years | 0 (0.0%) | 0 (0.0%) |
| 18 to 34 Years | 0 (0.0%) | 0 (0.0%) |
| 35 to 64 Years | 0 (0.0%) | 17 (41.5%) |
| 65 to 74 Years | 0 (0.0%) | 0 (0.0%) |
| 75 Years and over | 0 (0.0%) | 2 (50.0%) |
Technology Access in Forestville
Computing Device Access in Forestville
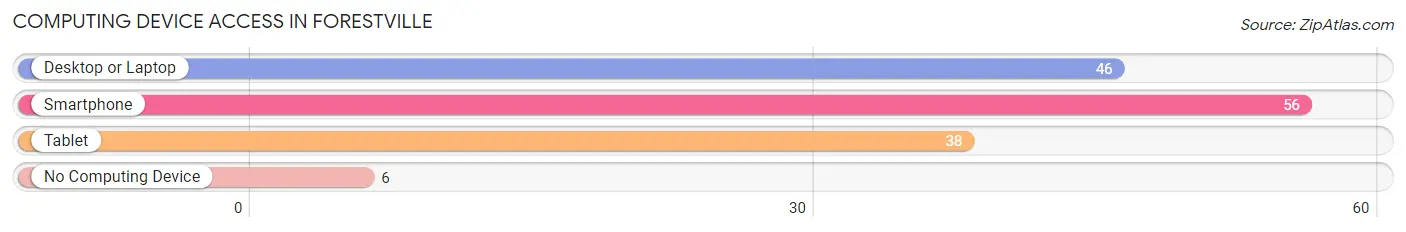
| Device Type | # Households | % Households |
| Desktop or Laptop | 46 | 71.9% |
| Smartphone | 56 | 87.5% |
| Tablet | 38 | 59.4% |
| No Computing Device | 6 | 9.4% |
| Total | 64 | 100.0% |
Internet Access in Forestville
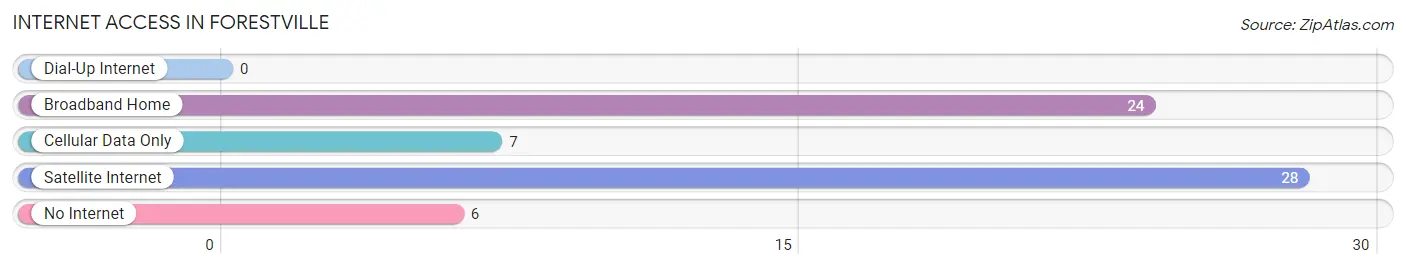
| Internet Type | # Households | % Households |
| Dial-Up Internet | 0 | 0.0% |
| Broadband Home | 24 | 37.5% |
| Cellular Data Only | 7 | 10.9% |
| Satellite Internet | 28 | 43.8% |
| No Internet | 6 | 9.4% |
| Total | 64 | 100.0% |
Forestville Summary
History
The small village of Forestville, Michigan is located in the northeast corner of the state, in the county of Cheboygan. It is situated on the banks of the Sturgeon River, and is surrounded by the Huron National Forest. The area was first settled in the late 1800s by a group of lumberjacks and farmers. The village was officially incorporated in 1891, and was named after the nearby forest.
The early settlers of Forestville were mostly of German and Scandinavian descent. They were attracted to the area by the abundance of timber and the potential for farming. The village quickly grew, and by the early 1900s, it had become a bustling community with a variety of businesses, including a sawmill, a grist mill, a general store, and a blacksmith shop.
The village was also home to a number of churches, including the Forestville Methodist Church, which was founded in 1891. The church still stands today, and is a reminder of the village’s religious heritage.
In the early 1900s, the village was a popular destination for tourists, who came to enjoy the area’s natural beauty and the abundance of outdoor activities. The village was also home to a number of resorts, which provided visitors with a variety of recreational activities, including fishing, hunting, and boating.
Geography
Forestville is located in the northeast corner of Michigan, in the county of Cheboygan. It is situated on the banks of the Sturgeon River, and is surrounded by the Huron National Forest. The village is located approximately 25 miles north of the city of Cheboygan, and is about a two-hour drive from the state capital of Lansing.
The village is situated in a rural area, and is surrounded by rolling hills and forests. The area is known for its abundance of wildlife, including deer, bear, and a variety of birds. The nearby Sturgeon River is a popular destination for fishing and boating.
Economy
The economy of Forestville is largely based on tourism and agriculture. The village is home to a number of resorts, which provide visitors with a variety of recreational activities, including fishing, hunting, and boating. The area is also home to a number of farms, which produce a variety of crops, including corn, soybeans, and wheat.
The village is also home to a number of small businesses, including a general store, a hardware store, and a restaurant. The village is also home to a number of churches, which provide a variety of services to the community.
Demographics
As of the 2010 census, the population of Forestville was 1,093. The village is predominantly white, with 95.3% of the population identifying as such. The remaining 4.7% of the population is made up of African Americans, Native Americans, Asians, and other races.
The median household income in Forestville is $37,500, and the median age is 44. The village has a high rate of homeownership, with 81.3% of the population owning their own homes. The village also has a low unemployment rate, with only 4.2% of the population being unemployed.
Common Questions
What is Per Capita Income in Forestville?
Per Capita income in Forestville is $28,820.
What is the Median Household income in Forestville?
Median Household Income in Forestville is $42,500.
What is Inequality or Gini Index in Forestville?
Inequality or Gini Index in Forestville is 0.41.
What is the Total Population of Forestville?
Total Population of Forestville is 132.
What is the Total Male Population of Forestville?
Total Male Population of Forestville is 65.
What is the Total Female Population of Forestville?
Total Female Population of Forestville is 67.
What is the Ratio of Males per 100 Females in Forestville?
There are 97.01 Males per 100 Females in Forestville.
What is the Ratio of Females per 100 Males in Forestville?
There are 103.08 Females per 100 Males in Forestville.
What is the Median Population Age in Forestville?
Median Population Age in Forestville is 62.8 Years.
What is the Average Family Size in Forestville
Average Family Size in Forestville is 2.4 People.
What is the Average Household Size in Forestville
Average Household Size in Forestville is 2.1 People.
How Large is the Labor Force in Forestville?
There are 33 People in the Labor Forcein in Forestville.
What is the Percentage of People in the Labor Force in Forestville?
27.7% of People are in the Labor Force in Forestville.