Zip Codes with the Highest Percentage of Population Employed in Architecture & Engineering in Farmington, MI
RELATED REPORTS & OPTIONS
Architecture & Engineering
Farmington
Compare Zip Codes
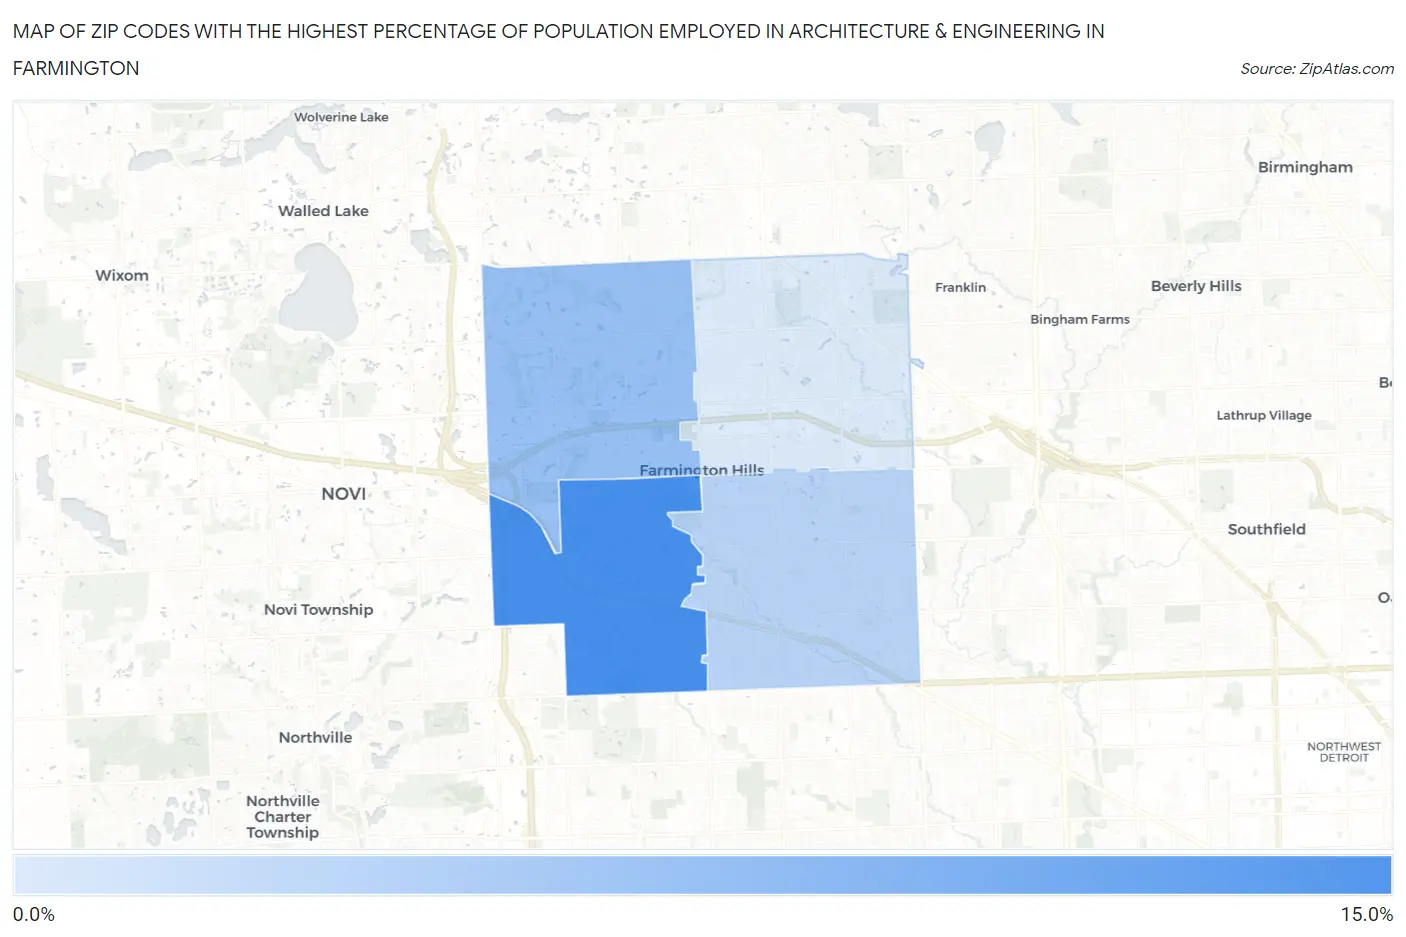
Map of Zip Codes with the Highest Percentage of Population Employed in Architecture & Engineering in Farmington
4.5%
13.0%
Zip Codes with the Highest Percentage of Population Employed in Architecture & Engineering in Farmington, MI
| Zip Code | % Employed | vs State | vs National | |
| 1. | 48335 | 13.0% | 3.4%(+9.67)#5 | 2.1%(+10.9)#199 |
| 2. | 48331 | 8.4% | 3.4%(+5.04)#31 | 2.1%(+6.26)#499 |
| 3. | 48336 | 6.5% | 3.4%(+3.10)#59 | 2.1%(+4.32)#900 |
| 4. | 48334 | 4.5% | 3.4%(+1.12)#144 | 2.1%(+2.33)#2,150 |
1
Common Questions
What are the Top 3 Zip Codes with the Highest Percentage of Population Employed in Architecture & Engineering in Farmington, MI?
Top 3 Zip Codes with the Highest Percentage of Population Employed in Architecture & Engineering in Farmington, MI are:
What zip code has the Highest Percentage of Population Employed in Architecture & Engineering in Farmington, MI?
48335 has the Highest Percentage of Population Employed in Architecture & Engineering in Farmington, MI with 13.0%.
What is the Percentage of Population Employed in Architecture & Engineering in Farmington, MI?
Percentage of Population Employed in Architecture & Engineering in Farmington is 8.8%.
What is the Percentage of Population Employed in Architecture & Engineering in Michigan?
Percentage of Population Employed in Architecture & Engineering in Michigan is 3.4%.
What is the Percentage of Population Employed in Architecture & Engineering in the United States?
Percentage of Population Employed in Architecture & Engineering in the United States is 2.1%.