Cities with the Fewest Births per 1,000 Women in Michigan
RELATED REPORTS & OPTIONS
Lowest Birth Rate | All Women
Michigan
Compare Cities
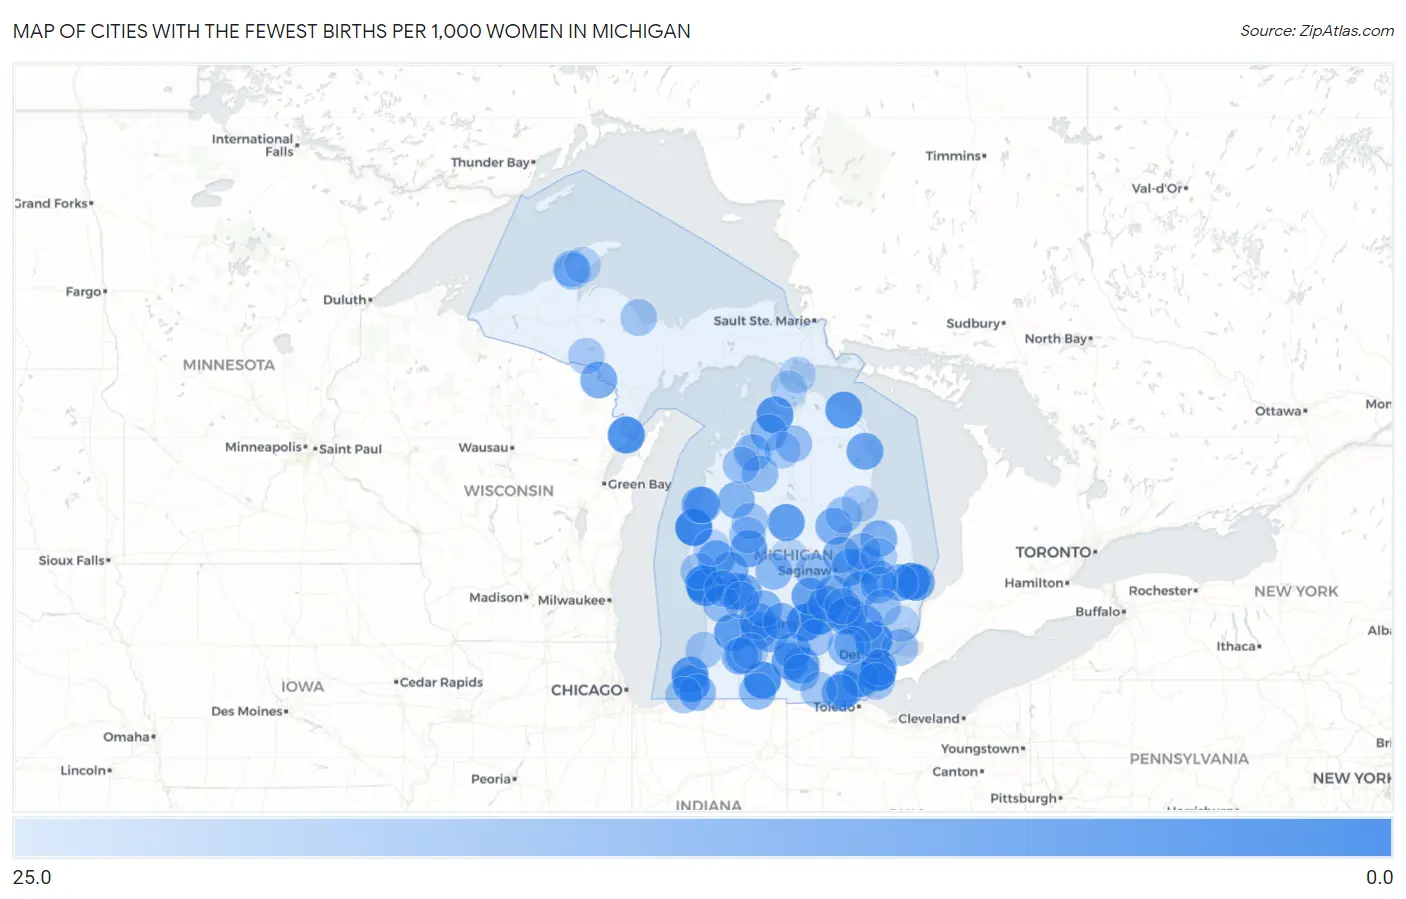
Map of Cities with the Fewest Births per 1,000 Women in Michigan
25.0
0.0
Cities with the Fewest Births per 1,000 Women in Michigan
| City | Births / 1,000 Women | vs State | vs National | |
| 1. | Gibraltar | 4.0 | 52.0(-48.0)#1 | 52.0(-48.0)#60 |
| 2. | Ludington | 5.0 | 52.0(-47.0)#2 | 52.0(-47.0)#94 |
| 3. | Bingham Farms | 6.0 | 52.0(-46.0)#3 | 52.0(-46.0)#169 |
| 4. | North Muskegon | 7.0 | 52.0(-45.0)#4 | 52.0(-45.0)#213 |
| 5. | Croswell | 7.0 | 52.0(-45.0)#5 | 52.0(-45.0)#228 |
| 6. | Sherwood | 7.0 | 52.0(-45.0)#6 | 52.0(-45.0)#282 |
| 7. | East Lansing | 8.0 | 52.0(-44.0)#7 | 52.0(-44.0)#284 |
| 8. | Menominee | 8.0 | 52.0(-44.0)#8 | 52.0(-44.0)#291 |
| 9. | Perry | 8.0 | 52.0(-44.0)#9 | 52.0(-44.0)#329 |
| 10. | Lake Fenton | 9.0 | 52.0(-43.0)#10 | 52.0(-43.0)#390 |
| 11. | Petoskey | 9.0 | 52.0(-43.0)#11 | 52.0(-43.0)#393 |
| 12. | Muskegon Heights | 10.0 | 52.0(-42.0)#12 | 52.0(-42.0)#488 |
| 13. | Rogers City | 10.0 | 52.0(-42.0)#13 | 52.0(-42.0)#519 |
| 14. | Deerfield | 10.0 | 52.0(-42.0)#14 | 52.0(-42.0)#571 |
| 15. | Baroda | 10.0 | 52.0(-42.0)#15 | 52.0(-42.0)#573 |
| 16. | Hopkins | 10.0 | 52.0(-42.0)#16 | 52.0(-42.0)#578 |
| 17. | Maybee | 10.0 | 52.0(-42.0)#17 | 52.0(-42.0)#582 |
| 18. | Harrison | 11.0 | 52.0(-41.0)#18 | 52.0(-41.0)#652 |
| 19. | Shoreham | 11.0 | 52.0(-41.0)#19 | 52.0(-41.0)#676 |
| 20. | Big Rapids | 12.0 | 52.0(-40.0)#20 | 52.0(-40.0)#726 |
| 21. | Albion | 12.0 | 52.0(-40.0)#21 | 52.0(-40.0)#727 |
| 22. | Sparta | 12.0 | 52.0(-40.0)#22 | 52.0(-40.0)#748 |
| 23. | Spring Arbor | 12.0 | 52.0(-40.0)#23 | 52.0(-40.0)#771 |
| 24. | Elsie | 12.0 | 52.0(-40.0)#24 | 52.0(-40.0)#799 |
| 25. | Lexington | 13.0 | 52.0(-39.0)#25 | 52.0(-39.0)#924 |
| 26. | Reese | 13.0 | 52.0(-39.0)#26 | 52.0(-39.0)#925 |
| 27. | Ossineke | 13.0 | 52.0(-39.0)#27 | 52.0(-39.0)#946 |
| 28. | Hastings | 14.0 | 52.0(-38.0)#28 | 52.0(-38.0)#1,006 |
| 29. | Manistee | 14.0 | 52.0(-38.0)#29 | 52.0(-38.0)#1,010 |
| 30. | Parchment | 14.0 | 52.0(-38.0)#30 | 52.0(-38.0)#1,052 |
| 31. | Nashville | 14.0 | 52.0(-38.0)#31 | 52.0(-38.0)#1,065 |
| 32. | Hesperia | 14.0 | 52.0(-38.0)#32 | 52.0(-38.0)#1,091 |
| 33. | Rockford | 15.0 | 52.0(-37.0)#33 | 52.0(-37.0)#1,175 |
| 34. | Kingsford | 15.0 | 52.0(-37.0)#34 | 52.0(-37.0)#1,186 |
| 35. | Corunna | 15.0 | 52.0(-37.0)#35 | 52.0(-37.0)#1,212 |
| 36. | Springport | 15.0 | 52.0(-37.0)#36 | 52.0(-37.0)#1,257 |
| 37. | Freeport | 15.0 | 52.0(-37.0)#37 | 52.0(-37.0)#1,264 |
| 38. | New Lothrop | 15.0 | 52.0(-37.0)#38 | 52.0(-37.0)#1,274 |
| 39. | Caro | 16.0 | 52.0(-36.0)#39 | 52.0(-36.0)#1,348 |
| 40. | Linden | 16.0 | 52.0(-36.0)#40 | 52.0(-36.0)#1,350 |
| 41. | Blissfield | 16.0 | 52.0(-36.0)#41 | 52.0(-36.0)#1,361 |
| 42. | Newaygo | 16.0 | 52.0(-36.0)#42 | 52.0(-36.0)#1,377 |
| 43. | Standish | 16.0 | 52.0(-36.0)#43 | 52.0(-36.0)#1,390 |
| 44. | Otisville | 16.0 | 52.0(-36.0)#44 | 52.0(-36.0)#1,421 |
| 45. | Village Of Clarkston | 16.0 | 52.0(-36.0)#45 | 52.0(-36.0)#1,431 |
| 46. | Elkton | 16.0 | 52.0(-36.0)#46 | 52.0(-36.0)#1,433 |
| 47. | Peck | 16.0 | 52.0(-36.0)#47 | 52.0(-36.0)#1,447 |
| 48. | Trufant | 16.0 | 52.0(-36.0)#48 | 52.0(-36.0)#1,449 |
| 49. | Westwood | 17.0 | 52.0(-35.0)#49 | 52.0(-35.0)#1,501 |
| 50. | Essexville | 17.0 | 52.0(-35.0)#50 | 52.0(-35.0)#1,543 |
| 51. | Saranac | 17.0 | 52.0(-35.0)#51 | 52.0(-35.0)#1,569 |
| 52. | Hermansville | 17.0 | 52.0(-35.0)#52 | 52.0(-35.0)#1,613 |
| 53. | Mulliken | 17.0 | 52.0(-35.0)#53 | 52.0(-35.0)#1,620 |
| 54. | Harrietta | 17.0 | 52.0(-35.0)#54 | 52.0(-35.0)#1,645 |
| 55. | Buchanan | 18.0 | 52.0(-34.0)#55 | 52.0(-34.0)#1,698 |
| 56. | East Jordan | 18.0 | 52.0(-34.0)#56 | 52.0(-34.0)#1,739 |
| 57. | Elk Rapids | 18.0 | 52.0(-34.0)#57 | 52.0(-34.0)#1,751 |
| 58. | Edmore | 18.0 | 52.0(-34.0)#58 | 52.0(-34.0)#1,754 |
| 59. | Burr Oak | 18.0 | 52.0(-34.0)#59 | 52.0(-34.0)#1,786 |
| 60. | Clifford | 18.0 | 52.0(-34.0)#60 | 52.0(-34.0)#1,824 |
| 61. | Allendale | 19.0 | 52.0(-33.0)#61 | 52.0(-33.0)#1,830 |
| 62. | Whitmore Lake | 19.0 | 52.0(-33.0)#62 | 52.0(-33.0)#1,852 |
| 63. | North Branch | 19.0 | 52.0(-33.0)#63 | 52.0(-33.0)#1,934 |
| 64. | Merrill | 19.0 | 52.0(-33.0)#64 | 52.0(-33.0)#1,939 |
| 65. | South Boardman | 19.0 | 52.0(-33.0)#65 | 52.0(-33.0)#1,957 |
| 66. | Hanover | 19.0 | 52.0(-33.0)#66 | 52.0(-33.0)#1,975 |
| 67. | Eastlake | 19.0 | 52.0(-33.0)#67 | 52.0(-33.0)#1,986 |
| 68. | Traverse City | 20.0 | 52.0(-32.0)#68 | 52.0(-32.0)#2,007 |
| 69. | Houghton | 20.0 | 52.0(-32.0)#69 | 52.0(-32.0)#2,027 |
| 70. | Gaylord | 20.0 | 52.0(-32.0)#70 | 52.0(-32.0)#2,054 |
| 71. | Village Of Grosse Pointe Shores | 20.0 | 52.0(-32.0)#71 | 52.0(-32.0)#2,085 |
| 72. | Dryden | 20.0 | 52.0(-32.0)#72 | 52.0(-32.0)#2,122 |
| 73. | Riverview | 21.0 | 52.0(-31.0)#73 | 52.0(-31.0)#2,201 |
| 74. | South Lyon | 21.0 | 52.0(-31.0)#74 | 52.0(-31.0)#2,203 |
| 75. | Hancock | 21.0 | 52.0(-31.0)#75 | 52.0(-31.0)#2,223 |
| 76. | Montague | 21.0 | 52.0(-31.0)#76 | 52.0(-31.0)#2,244 |
| 77. | Ravenna | 21.0 | 52.0(-31.0)#77 | 52.0(-31.0)#2,280 |
| 78. | Three Oaks | 21.0 | 52.0(-31.0)#78 | 52.0(-31.0)#2,290 |
| 79. | Unionville | 21.0 | 52.0(-31.0)#79 | 52.0(-31.0)#2,329 |
| 80. | Dansville | 21.0 | 52.0(-31.0)#80 | 52.0(-31.0)#2,332 |
| 81. | Estral Beach | 21.0 | 52.0(-31.0)#81 | 52.0(-31.0)#2,340 |
| 82. | Twining | 21.0 | 52.0(-31.0)#82 | 52.0(-31.0)#2,352 |
| 83. | Le Roy | 21.0 | 52.0(-31.0)#83 | 52.0(-31.0)#2,353 |
| 84. | Marquette | 22.0 | 52.0(-30.0)#84 | 52.0(-30.0)#2,367 |
| 85. | South Haven | 22.0 | 52.0(-30.0)#85 | 52.0(-30.0)#2,411 |
| 86. | Reed City | 22.0 | 52.0(-30.0)#86 | 52.0(-30.0)#2,437 |
| 87. | Clayton | 22.0 | 52.0(-30.0)#87 | 52.0(-30.0)#2,547 |
| 88. | Northview | 23.0 | 52.0(-29.0)#88 | 52.0(-29.0)#2,580 |
| 89. | Swartz Creek | 23.0 | 52.0(-29.0)#89 | 52.0(-29.0)#2,617 |
| 90. | Crystal Falls | 23.0 | 52.0(-29.0)#90 | 52.0(-29.0)#2,662 |
| 91. | Tawas City | 23.0 | 52.0(-29.0)#91 | 52.0(-29.0)#2,664 |
| 92. | Lakes Of The North | 23.0 | 52.0(-29.0)#92 | 52.0(-29.0)#2,690 |
| 93. | Richland | 23.0 | 52.0(-29.0)#93 | 52.0(-29.0)#2,694 |
| 94. | New Haven | 24.0 | 52.0(-28.0)#94 | 52.0(-28.0)#2,783 |
| 95. | Cass City | 24.0 | 52.0(-28.0)#95 | 52.0(-28.0)#2,833 |
| 96. | Lake Linden | 24.0 | 52.0(-28.0)#96 | 52.0(-28.0)#2,876 |
| 97. | Mackinac Island | 24.0 | 52.0(-28.0)#97 | 52.0(-28.0)#2,890 |
| 98. | Carp Lake | 24.0 | 52.0(-28.0)#98 | 52.0(-28.0)#2,921 |
| 99. | Walkerville | 24.0 | 52.0(-28.0)#99 | 52.0(-28.0)#2,943 |
| 100. | Mount Pleasant | 25.0 | 52.0(-27.0)#100 | 52.0(-27.0)#2,969 |
Common Questions
What are the Top 10 Cities with the Fewest Births per 1,000 Women in Michigan?
Top 10 Cities with the Fewest Births per 1,000 Women in Michigan are:
#1
4.0
#2
5.0
#3
6.0
#4
7.0
#5
7.0
#6
7.0
#7
8.0
#8
8.0
#9
8.0
#10
9.0
What city has the Fewest Births per 1,000 Women in Michigan?
Gibraltar has the Fewest Births per 1,000 Women in Michigan with 4.0.
What is the Number of Births per 1,000 Women in the State of Michigan?
Number of Births per 1,000 Women in Michigan is 52.0.
What is the Number of Births per 1,000 Women in the United States?
Number of Births per 1,000 Women in the United States is 52.0.