Zip Codes with the Highest Percentage of Population Employed in Architecture & Engineering in Bloomfield Hills, MI
RELATED REPORTS & OPTIONS
Architecture & Engineering
Bloomfield Hills
Compare Zip Codes
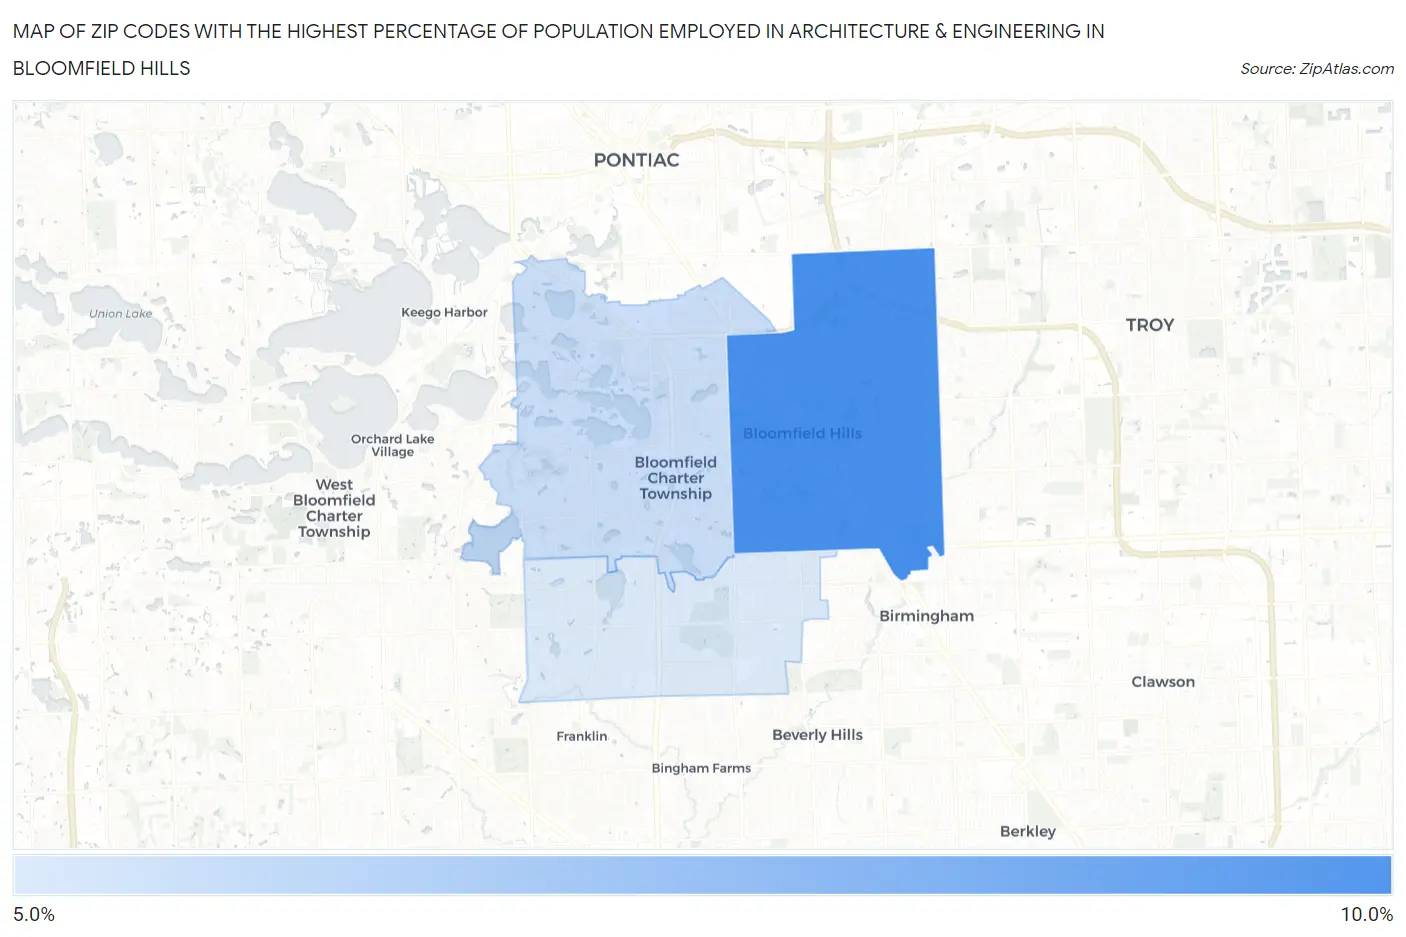
Map of Zip Codes with the Highest Percentage of Population Employed in Architecture & Engineering in Bloomfield Hills
5.5%
8.6%
Zip Codes with the Highest Percentage of Population Employed in Architecture & Engineering in Bloomfield Hills, MI
| Zip Code | % Employed | vs State | vs National | |
| 1. | 48304 | 8.6% | 3.4%(+5.21)#28 | 2.1%(+6.43)#478 |
| 2. | 48302 | 5.8% | 3.4%(+2.47)#79 | 2.1%(+3.69)#1,163 |
| 3. | 48301 | 5.5% | 3.4%(+2.11)#98 | 2.1%(+3.33)#1,339 |
1
Common Questions
What are the Top Zip Codes with the Highest Percentage of Population Employed in Architecture & Engineering in Bloomfield Hills, MI?
Top Zip Codes with the Highest Percentage of Population Employed in Architecture & Engineering in Bloomfield Hills, MI are:
What zip code has the Highest Percentage of Population Employed in Architecture & Engineering in Bloomfield Hills, MI?
48304 has the Highest Percentage of Population Employed in Architecture & Engineering in Bloomfield Hills, MI with 8.6%.
What is the Percentage of Population Employed in Architecture & Engineering in Bloomfield Hills, MI?
Percentage of Population Employed in Architecture & Engineering in Bloomfield Hills is 7.2%.
What is the Percentage of Population Employed in Architecture & Engineering in Michigan?
Percentage of Population Employed in Architecture & Engineering in Michigan is 3.4%.
What is the Percentage of Population Employed in Architecture & Engineering in the United States?
Percentage of Population Employed in Architecture & Engineering in the United States is 2.1%.