Zip Codes with the Highest Percentage of Population Employed in Architecture & Engineering in Portage, MI
RELATED REPORTS & OPTIONS
Architecture & Engineering
Portage
Compare Zip Codes
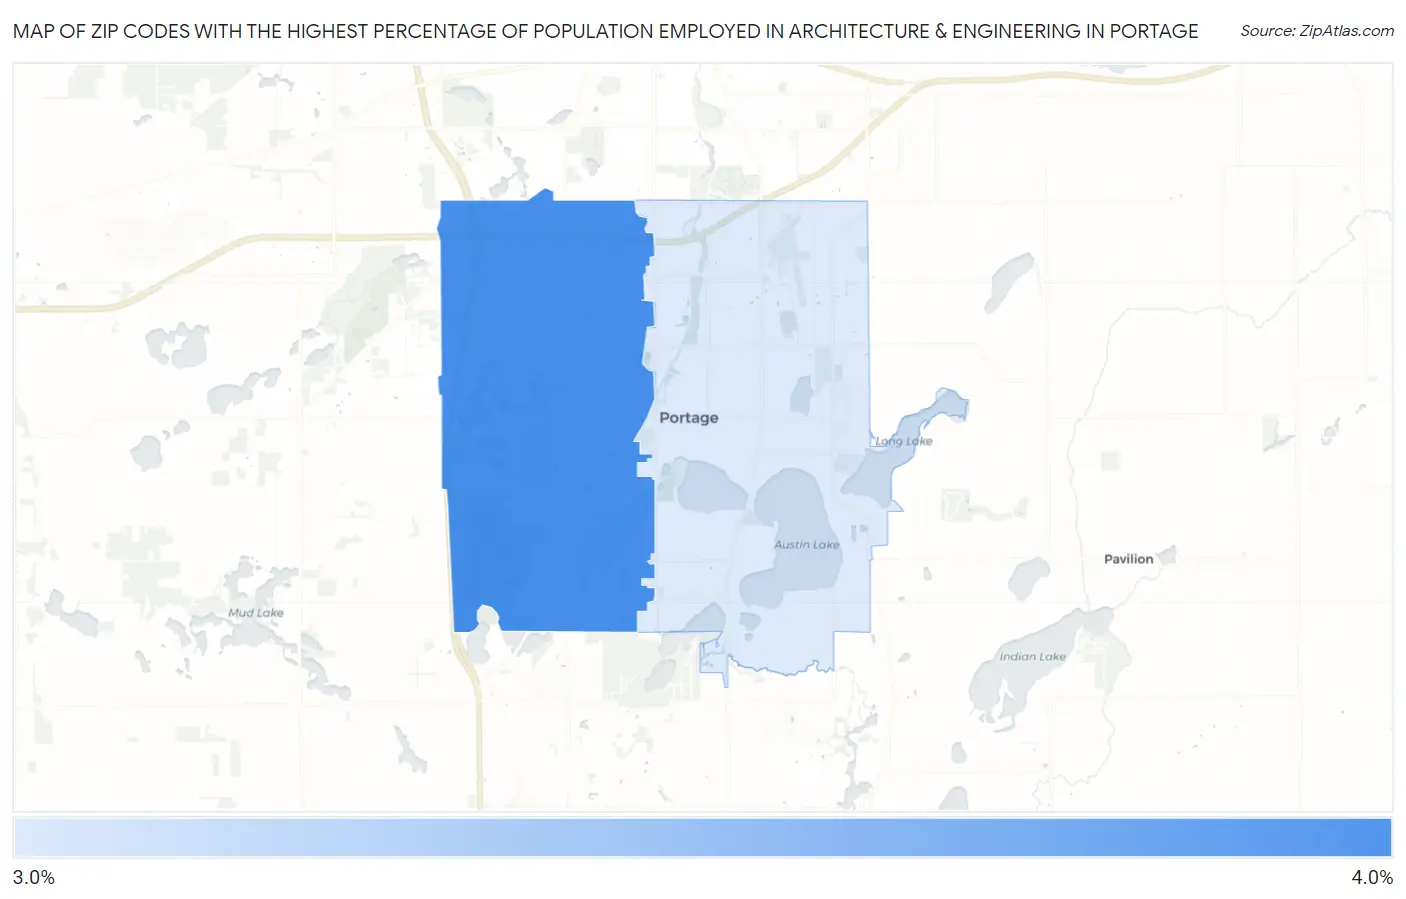
Map of Zip Codes with the Highest Percentage of Population Employed in Architecture & Engineering in Portage
3.0%
3.5%
Zip Codes with the Highest Percentage of Population Employed in Architecture & Engineering in Portage, MI
| Zip Code | % Employed | vs State | vs National | |
| 1. | 49024 | 3.5% | 3.4%(+0.126)#217 | 2.1%(+1.34)#3,753 |
| 2. | 49002 | 3.0% | 3.4%(-0.319)#274 | 2.1%(+0.899)#4,898 |
1
Common Questions
What are the Top Zip Codes with the Highest Percentage of Population Employed in Architecture & Engineering in Portage, MI?
Top Zip Codes with the Highest Percentage of Population Employed in Architecture & Engineering in Portage, MI are:
What zip code has the Highest Percentage of Population Employed in Architecture & Engineering in Portage, MI?
49024 has the Highest Percentage of Population Employed in Architecture & Engineering in Portage, MI with 3.5%.
What is the Percentage of Population Employed in Architecture & Engineering in Portage, MI?
Percentage of Population Employed in Architecture & Engineering in Portage is 3.4%.
What is the Percentage of Population Employed in Architecture & Engineering in Michigan?
Percentage of Population Employed in Architecture & Engineering in Michigan is 3.4%.
What is the Percentage of Population Employed in Architecture & Engineering in the United States?
Percentage of Population Employed in Architecture & Engineering in the United States is 2.1%.