Rochester, MI Map & Demographics
Rochester Map
Rochester Overview
$66,022
PER CAPITA INCOME
$173,299
AVG FAMILY INCOME
$102,838
AVG HOUSEHOLD INCOME
33.9%
WAGE / INCOME GAP [ % ]
66.1¢/ $1
WAGE / INCOME GAP [ $ ]
0.47
INEQUALITY / GINI INDEX
12,978
TOTAL POPULATION
6,199
MALE POPULATION
6,779
FEMALE POPULATION
91.44
MALES / 100 FEMALES
109.36
FEMALES / 100 MALES
40.0
MEDIAN AGE
3.0
AVG FAMILY SIZE
2.4
AVG HOUSEHOLD SIZE
6,948
LABOR FORCE [ PEOPLE ]
66.6%
PERCENT IN LABOR FORCE
4.0%
UNEMPLOYMENT RATE
Rochester Area Codes
Income in Rochester
Income Overview in Rochester
Per Capita Income in Rochester is $66,022, while median incomes of families and households are $173,299 and $102,838 respectively.
| Characteristic | Number | Measure |
| Per Capita Income | 12,978 | $66,022 |
| Median Family Income | 3,437 | $173,299 |
| Mean Family Income | 3,437 | $207,591 |
| Median Household Income | 5,496 | $102,838 |
| Mean Household Income | 5,496 | $155,219 |
| Income Deficit | 3,437 | $0 |
| Wage / Income Gap (%) | 12,978 | 33.88% |
| Wage / Income Gap ($) | 12,978 | 66.12¢ per $1 |
| Gini / Inequality Index | 12,978 | 0.47 |
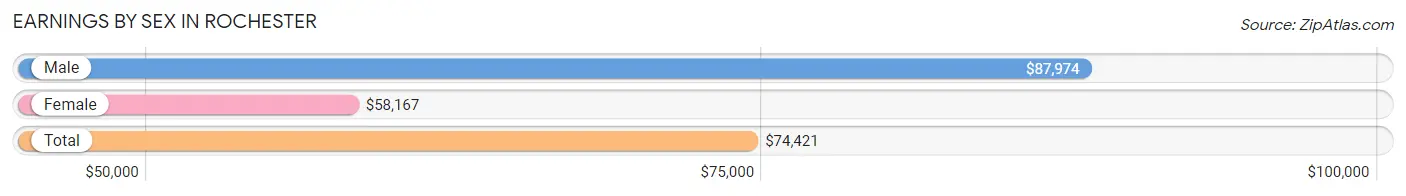
Earnings by Sex in Rochester
Average Earnings in Rochester are $74,421, $87,974 for men and $58,167 for women, a difference of 33.9%.
| Sex | Number | Average Earnings |
| Male | 3,847 (53.7%) | $87,974 |
| Female | 3,316 (46.3%) | $58,167 |
| Total | 7,163 (100.0%) | $74,421 |
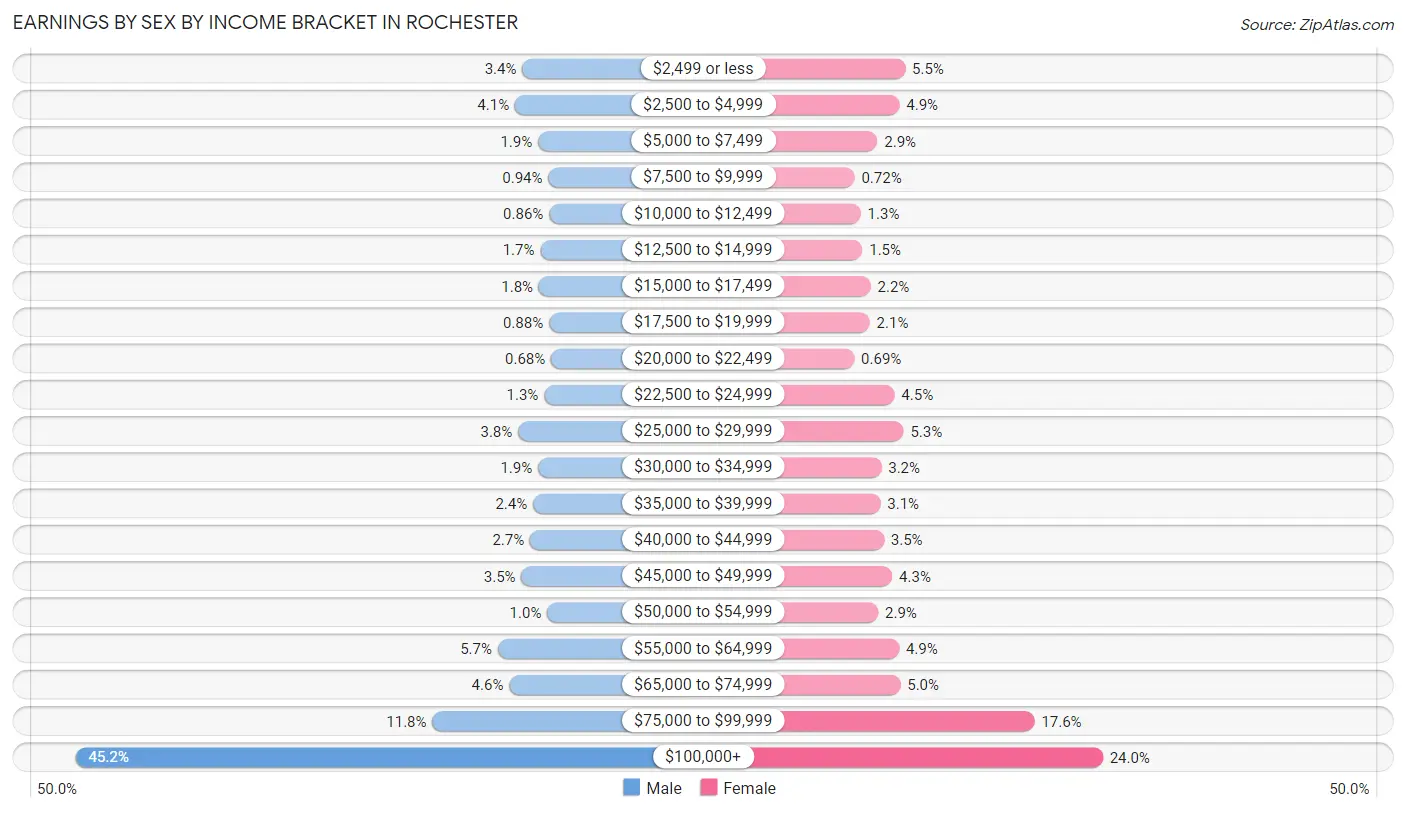
Earnings by Sex by Income Bracket in Rochester
The most common earnings brackets in Rochester are $100,000+ for men (1,740 | 45.2%) and $100,000+ for women (795 | 24.0%).
| Income | Male | Female |
| $2,499 or less | 130 (3.4%) | 181 (5.5%) |
| $2,500 to $4,999 | 156 (4.1%) | 163 (4.9%) |
| $5,000 to $7,499 | 73 (1.9%) | 95 (2.9%) |
| $7,500 to $9,999 | 36 (0.9%) | 24 (0.7%) |
| $10,000 to $12,499 | 33 (0.9%) | 43 (1.3%) |
| $12,500 to $14,999 | 65 (1.7%) | 48 (1.5%) |
| $15,000 to $17,499 | 70 (1.8%) | 74 (2.2%) |
| $17,500 to $19,999 | 34 (0.9%) | 71 (2.1%) |
| $20,000 to $22,499 | 26 (0.7%) | 23 (0.7%) |
| $22,500 to $24,999 | 51 (1.3%) | 148 (4.5%) |
| $25,000 to $29,999 | 145 (3.8%) | 176 (5.3%) |
| $30,000 to $34,999 | 73 (1.9%) | 107 (3.2%) |
| $35,000 to $39,999 | 91 (2.4%) | 104 (3.1%) |
| $40,000 to $44,999 | 102 (2.6%) | 115 (3.5%) |
| $45,000 to $49,999 | 133 (3.5%) | 141 (4.3%) |
| $50,000 to $54,999 | 40 (1.0%) | 97 (2.9%) |
| $55,000 to $64,999 | 218 (5.7%) | 162 (4.9%) |
| $65,000 to $74,999 | 177 (4.6%) | 166 (5.0%) |
| $75,000 to $99,999 | 454 (11.8%) | 583 (17.6%) |
| $100,000+ | 1,740 (45.2%) | 795 (24.0%) |
| Total | 3,847 (100.0%) | 3,316 (100.0%) |
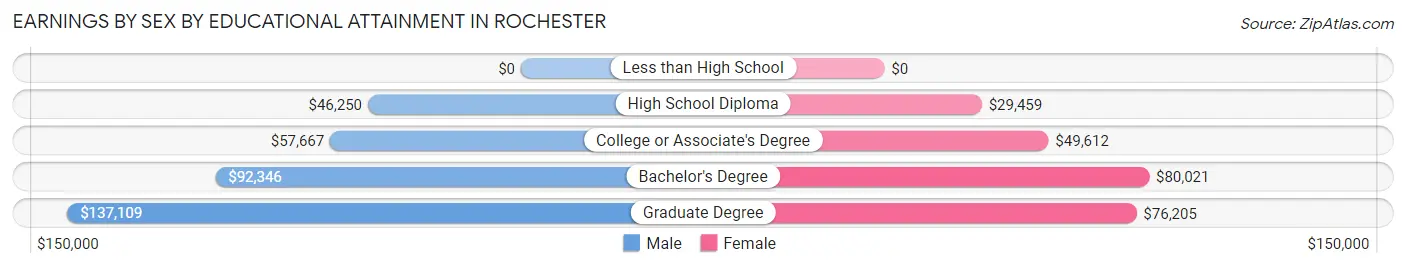
Earnings by Sex by Educational Attainment in Rochester
Average earnings in Rochester are $103,306 for men and $70,263 for women, a difference of 32.0%. Men with an educational attainment of graduate degree enjoy the highest average annual earnings of $137,109, while those with high school diploma education earn the least with $46,250. Women with an educational attainment of bachelor's degree earn the most with the average annual earnings of $80,021, while those with high school diploma education have the smallest earnings of $29,459.
| Educational Attainment | Male Income | Female Income |
| Less than High School | - | - |
| High School Diploma | $46,250 | $29,459 |
| College or Associate's Degree | $57,667 | $49,612 |
| Bachelor's Degree | $92,346 | $80,021 |
| Graduate Degree | $137,109 | $76,205 |
| Total | $103,306 | $70,263 |
Family Income in Rochester
Family Income Brackets in Rochester
According to the Rochester family income data, there are 1,354 families falling into the $200,000+ income range, which is the most common income bracket and makes up 39.4% of all families.
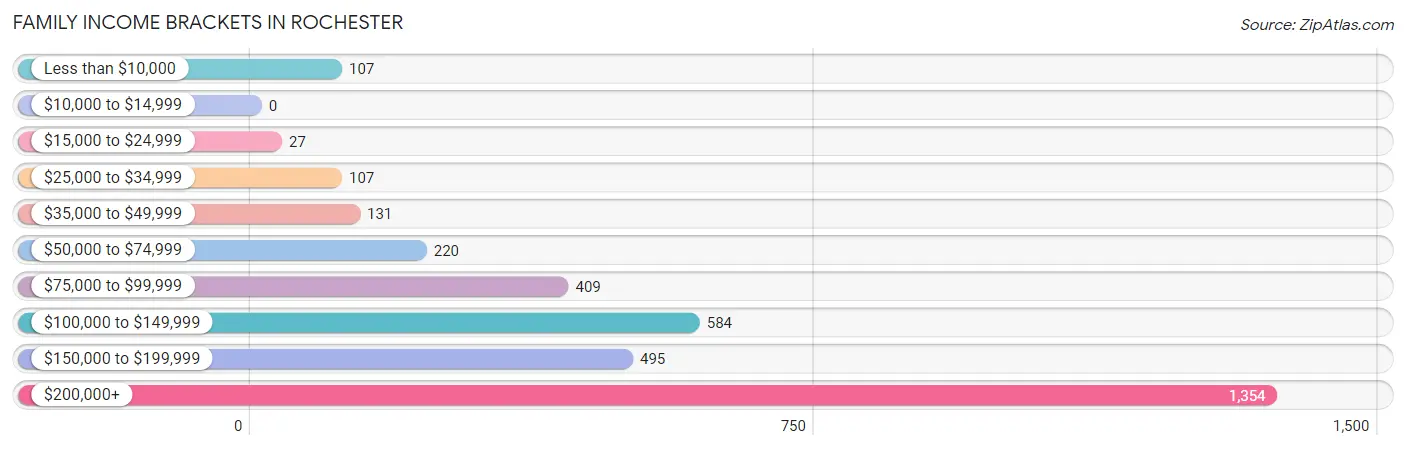
| Income Bracket | # Families | % Families |
| Less than $10,000 | 107 | 3.1% |
| $10,000 to $14,999 | 0 | 0.0% |
| $15,000 to $24,999 | 27 | 0.8% |
| $25,000 to $34,999 | 107 | 3.1% |
| $35,000 to $49,999 | 131 | 3.8% |
| $50,000 to $74,999 | 220 | 6.4% |
| $75,000 to $99,999 | 409 | 11.9% |
| $100,000 to $149,999 | 584 | 17.0% |
| $150,000 to $199,999 | 495 | 14.4% |
| $200,000+ | 1,354 | 39.4% |
Family Income by Famaliy Size in Rochester
4-person families (776 | 22.6%) account for the highest median family income in Rochester with $196,471 per family, while 2-person families (1,734 | 50.4%) have the highest median income of $71,250 per family member.
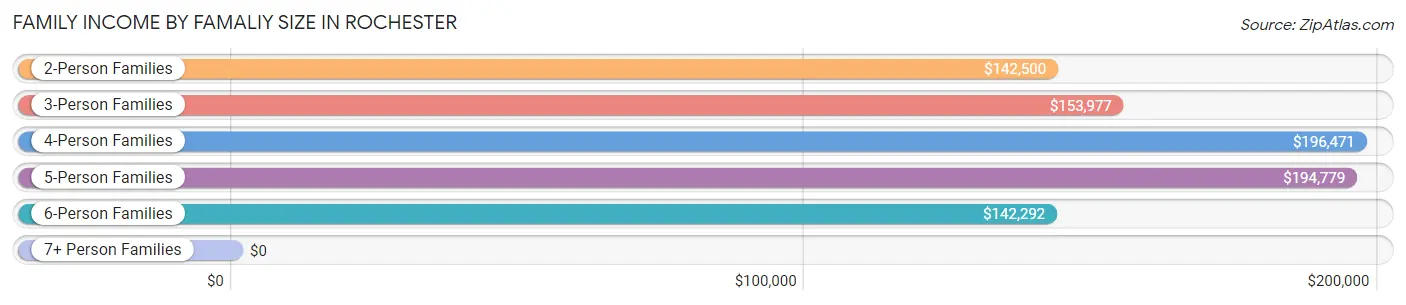
| Income Bracket | # Families | Median Income |
| 2-Person Families | 1,734 (50.4%) | $142,500 |
| 3-Person Families | 625 (18.2%) | $153,977 |
| 4-Person Families | 776 (22.6%) | $196,471 |
| 5-Person Families | 247 (7.2%) | $194,779 |
| 6-Person Families | 55 (1.6%) | $142,292 |
| 7+ Person Families | 0 (0.0%) | $0 |
| Total | 3,437 (100.0%) | $173,299 |
Family Income by Number of Earners in Rochester
The median family income in Rochester is $173,299, with families comprising 3+ earners (278) having the highest median family income of $250,001, while families with no earners (423) have the lowest median family income of $97,750, accounting for 8.1% and 12.3% of families, respectively.
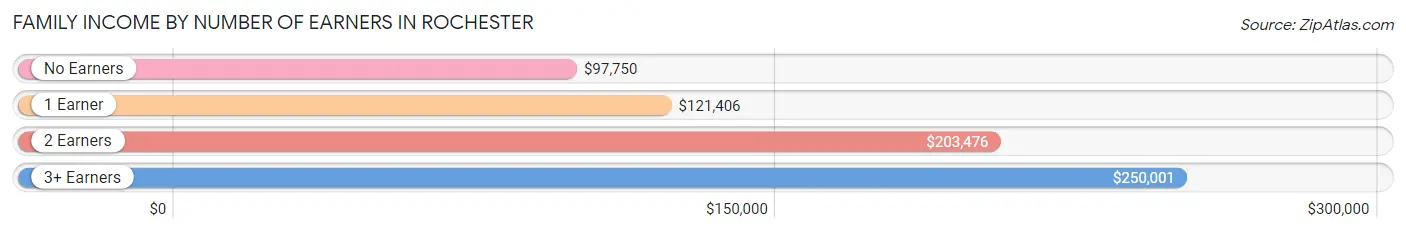
| Number of Earners | # Families | Median Income |
| No Earners | 423 (12.3%) | $97,750 |
| 1 Earner | 1,232 (35.8%) | $121,406 |
| 2 Earners | 1,504 (43.8%) | $203,476 |
| 3+ Earners | 278 (8.1%) | $250,001 |
| Total | 3,437 (100.0%) | $173,299 |
Household Income in Rochester
Household Income Brackets in Rochester
With 1,369 households falling in the category, the $200,000+ income range is the most frequent in Rochester, accounting for 24.9% of all households. In contrast, only 49 households (0.9%) fall into the $10,000 to $14,999 income bracket, making it the least populous group.
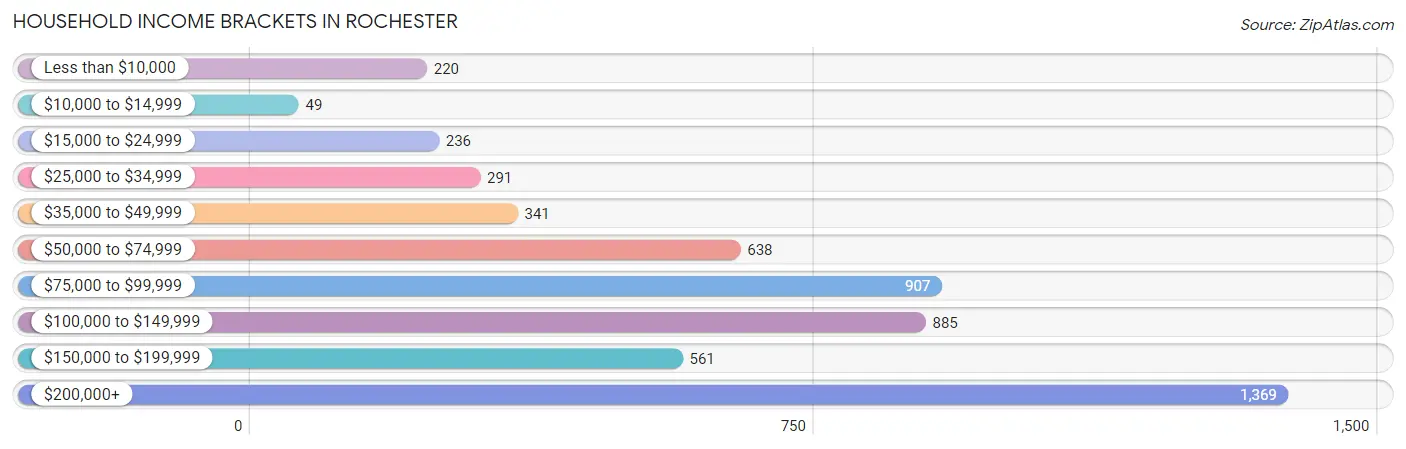
| Income Bracket | # Households | % Households |
| Less than $10,000 | 220 | 4.0% |
| $10,000 to $14,999 | 49 | 0.9% |
| $15,000 to $24,999 | 236 | 4.3% |
| $25,000 to $34,999 | 291 | 5.3% |
| $35,000 to $49,999 | 341 | 6.2% |
| $50,000 to $74,999 | 638 | 11.6% |
| $75,000 to $99,999 | 907 | 16.5% |
| $100,000 to $149,999 | 885 | 16.1% |
| $150,000 to $199,999 | 561 | 10.2% |
| $200,000+ | 1,369 | 24.9% |
Household Income by Householder Age in Rochester
The median household income in Rochester is $102,838, with the highest median household income of $145,500 found in the 45 to 64 years age bracket for the primary householder. A total of 2,224 households (40.5%) fall into this category. Meanwhile, the 15 to 24 years age bracket for the primary householder has the lowest median household income of $69,559, with 220 households (4.0%) in this group.
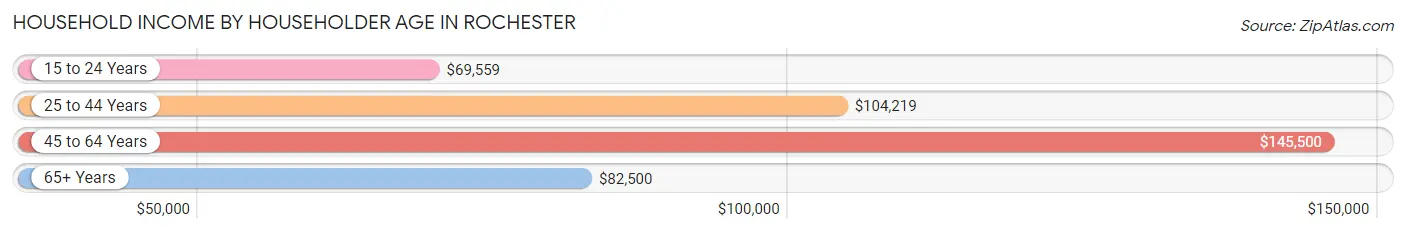
| Income Bracket | # Households | Median Income |
| 15 to 24 Years | 220 (4.0%) | $69,559 |
| 25 to 44 Years | 1,828 (33.3%) | $104,219 |
| 45 to 64 Years | 2,224 (40.5%) | $145,500 |
| 65+ Years | 1,224 (22.3%) | $82,500 |
| Total | 5,496 (100.0%) | $102,838 |
Poverty in Rochester
Income Below Poverty by Sex and Age in Rochester
With 6.5% poverty level for males and 5.4% for females among the residents of Rochester, 55 to 64 year old males and 16 and 17 year old females are the most vulnerable to poverty, with 141 males (16.7%) and 33 females (29.2%) in their respective age groups living below the poverty level.
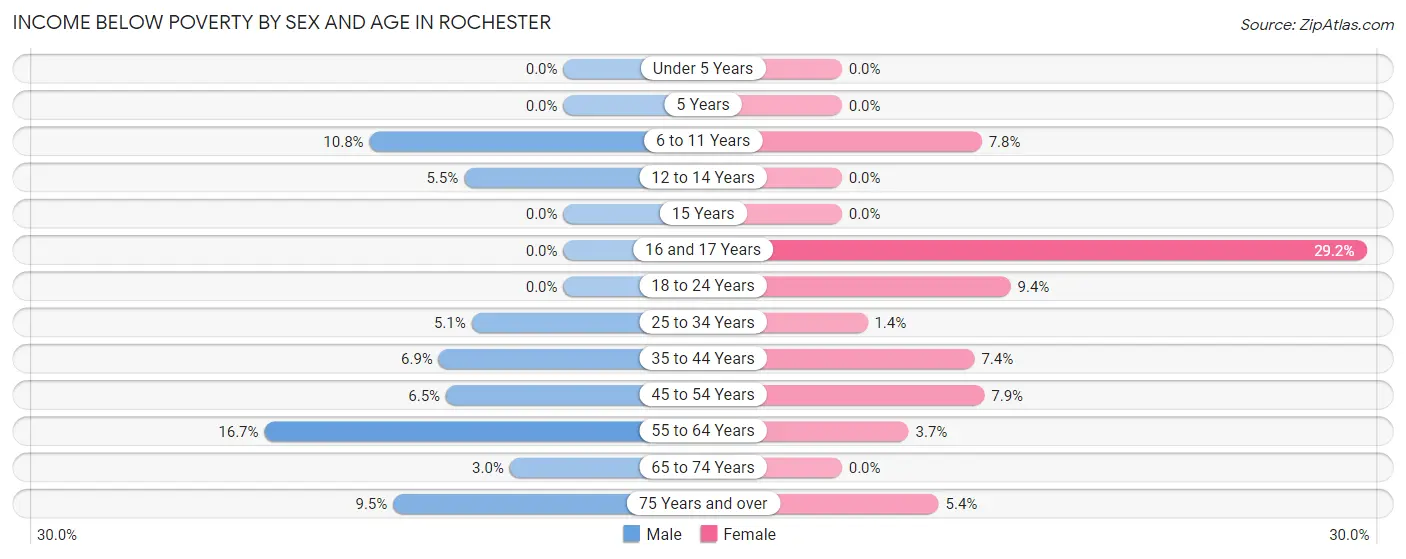
| Age Bracket | Male | Female |
| Under 5 Years | 0 (0.0%) | 0 (0.0%) |
| 5 Years | 0 (0.0%) | 0 (0.0%) |
| 6 to 11 Years | 57 (10.8%) | 43 (7.8%) |
| 12 to 14 Years | 11 (5.5%) | 0 (0.0%) |
| 15 Years | 0 (0.0%) | 0 (0.0%) |
| 16 and 17 Years | 0 (0.0%) | 33 (29.2%) |
| 18 to 24 Years | 0 (0.0%) | 58 (9.4%) |
| 25 to 34 Years | 48 (5.1%) | 10 (1.4%) |
| 35 to 44 Years | 54 (6.9%) | 65 (7.4%) |
| 45 to 54 Years | 58 (6.5%) | 85 (7.9%) |
| 55 to 64 Years | 141 (16.7%) | 35 (3.7%) |
| 65 to 74 Years | 15 (3.0%) | 0 (0.0%) |
| 75 Years and over | 20 (9.5%) | 29 (5.4%) |
| Total | 404 (6.5%) | 358 (5.4%) |
Income Above Poverty by Sex and Age in Rochester
According to the poverty statistics in Rochester, males aged under 5 years and females aged under 5 years are the age groups that are most secure financially, with 100.0% of males and 100.0% of females in these age groups living above the poverty line.
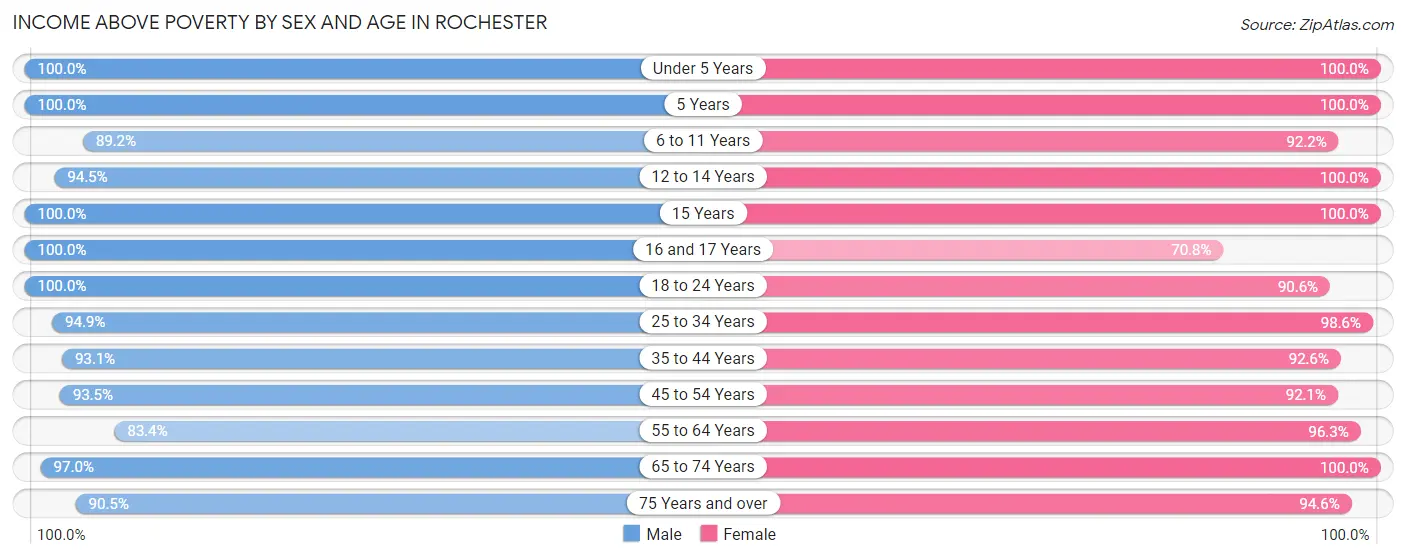
| Age Bracket | Male | Female |
| Under 5 Years | 340 (100.0%) | 280 (100.0%) |
| 5 Years | 73 (100.0%) | 59 (100.0%) |
| 6 to 11 Years | 471 (89.2%) | 509 (92.2%) |
| 12 to 14 Years | 188 (94.5%) | 232 (100.0%) |
| 15 Years | 67 (100.0%) | 62 (100.0%) |
| 16 and 17 Years | 234 (100.0%) | 80 (70.8%) |
| 18 to 24 Years | 580 (100.0%) | 559 (90.6%) |
| 25 to 34 Years | 891 (94.9%) | 690 (98.6%) |
| 35 to 44 Years | 724 (93.1%) | 815 (92.6%) |
| 45 to 54 Years | 829 (93.5%) | 986 (92.1%) |
| 55 to 64 Years | 706 (83.4%) | 905 (96.3%) |
| 65 to 74 Years | 486 (97.0%) | 554 (100.0%) |
| 75 Years and over | 191 (90.5%) | 509 (94.6%) |
| Total | 5,780 (93.5%) | 6,240 (94.6%) |
Income Below Poverty Among Married-Couple Families in Rochester
The poverty statistics for married-couple families in Rochester show that 3.1% or 88 of the total 2,836 families live below the poverty line. Families with 1 or 2 children have the highest poverty rate of 6.2%, comprising of 58 families. On the other hand, families with 3 or 4 children have the lowest poverty rate of 0.0%, which includes 0 families.
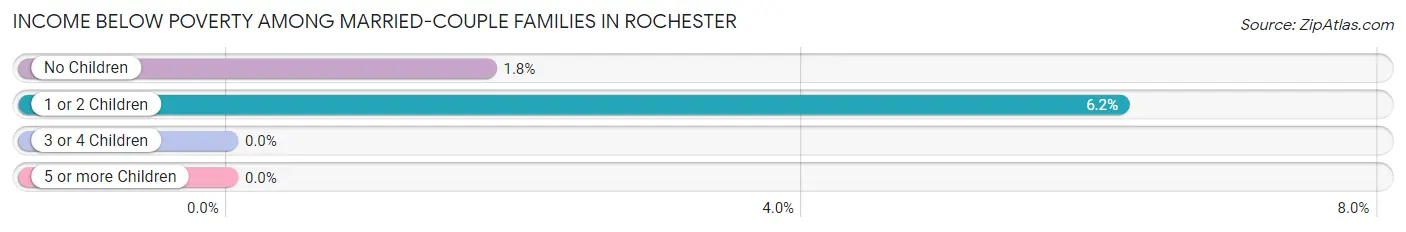
| Children | Above Poverty | Below Poverty |
| No Children | 1,633 (98.2%) | 30 (1.8%) |
| 1 or 2 Children | 876 (93.8%) | 58 (6.2%) |
| 3 or 4 Children | 239 (100.0%) | 0 (0.0%) |
| 5 or more Children | 0 (0.0%) | 0 (0.0%) |
| Total | 2,748 (96.9%) | 88 (3.1%) |
Income Below Poverty Among Single-Parent Households in Rochester
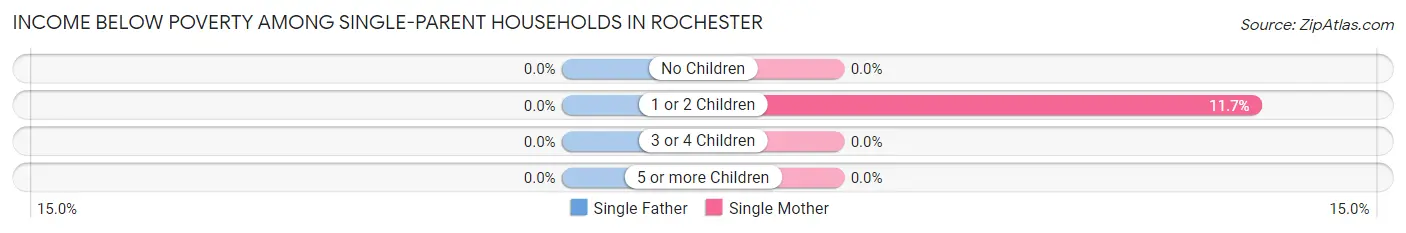
| Children | Single Father | Single Mother |
| No Children | 0 (0.0%) | 0 (0.0%) |
| 1 or 2 Children | 0 (0.0%) | 35 (11.7%) |
| 3 or 4 Children | 0 (0.0%) | 0 (0.0%) |
| 5 or more Children | 0 (0.0%) | 0 (0.0%) |
| Total | 0 (0.0%) | 35 (7.1%) |
Income Below Poverty Among Married-Couple vs Single-Parent Households in Rochester
The poverty data for Rochester shows that 88 of the married-couple family households (3.1%) and 35 of the single-parent households (5.8%) are living below the poverty level. Within the married-couple family households, those with 1 or 2 children have the highest poverty rate, with 58 households (6.2%) falling below the poverty line. Among the single-parent households, those with 1 or 2 children have the highest poverty rate, with 35 household (10.6%) living below poverty.
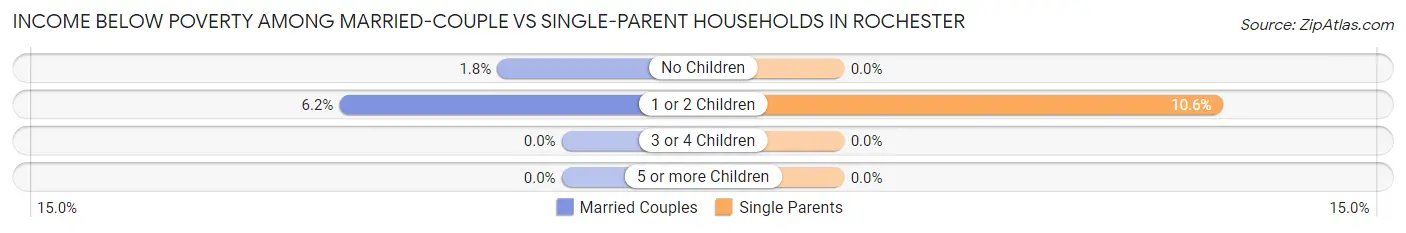
| Children | Married-Couple Families | Single-Parent Households |
| No Children | 30 (1.8%) | 0 (0.0%) |
| 1 or 2 Children | 58 (6.2%) | 35 (10.6%) |
| 3 or 4 Children | 0 (0.0%) | 0 (0.0%) |
| 5 or more Children | 0 (0.0%) | 0 (0.0%) |
| Total | 88 (3.1%) | 35 (5.8%) |
Race in Rochester
The most populous races in Rochester are White / Caucasian (10,924 | 84.2%), Asian (979 | 7.5%), and Two or more Races (762 | 5.9%).
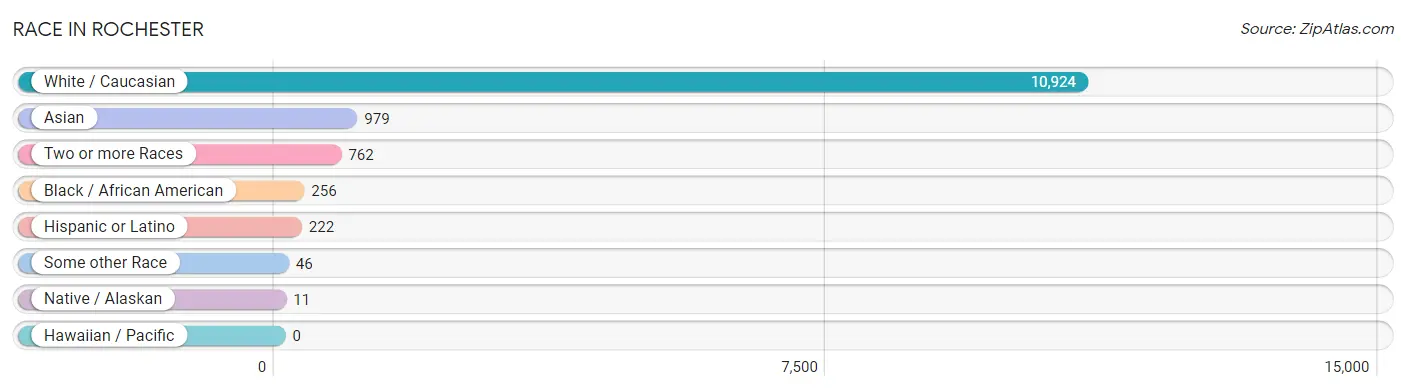
| Race | # Population | % Population |
| Asian | 979 | 7.5% |
| Black / African American | 256 | 2.0% |
| Hawaiian / Pacific | 0 | 0.0% |
| Hispanic or Latino | 222 | 1.7% |
| Native / Alaskan | 11 | 0.1% |
| White / Caucasian | 10,924 | 84.2% |
| Two or more Races | 762 | 5.9% |
| Some other Race | 46 | 0.4% |
| Total | 12,978 | 100.0% |
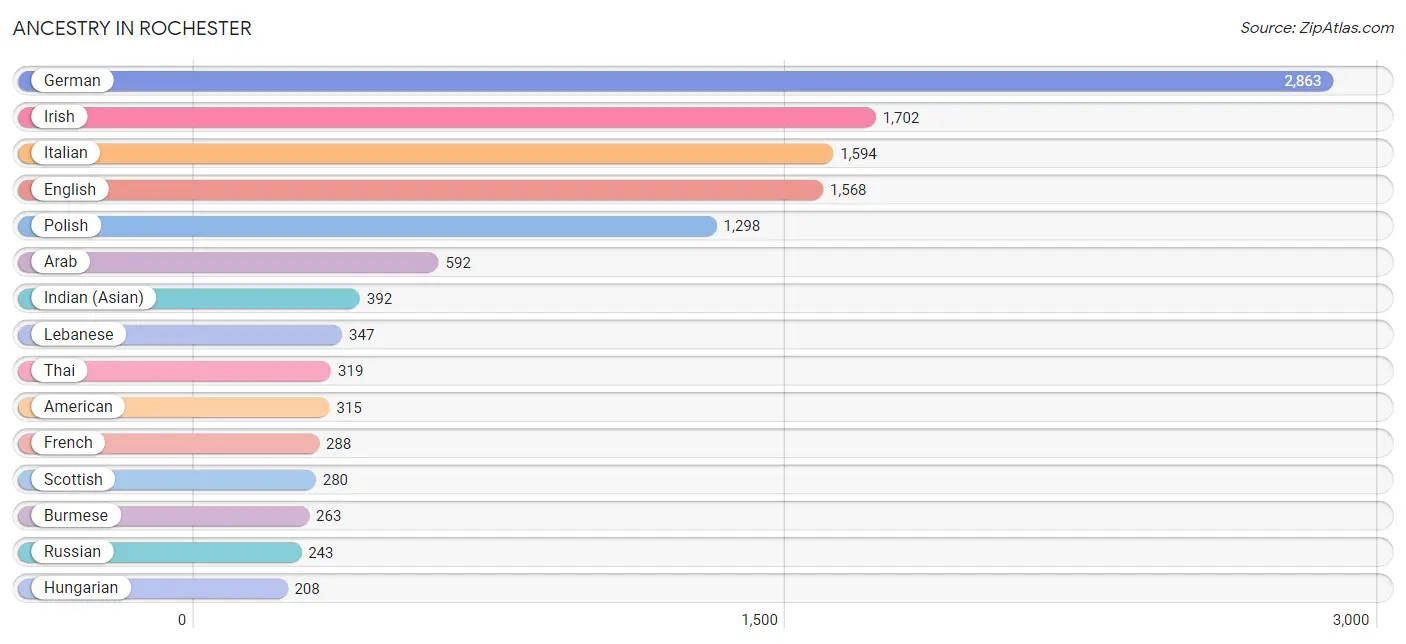
Ancestry in Rochester
The most populous ancestries reported in Rochester are German (2,863 | 22.1%), Irish (1,702 | 13.1%), Italian (1,594 | 12.3%), English (1,568 | 12.1%), and Polish (1,298 | 10.0%), together accounting for 69.5% of all Rochester residents.
| Ancestry | # Population | % Population |
| African | 19 | 0.2% |
| American | 315 | 2.4% |
| Arab | 592 | 4.6% |
| Argentinean | 15 | 0.1% |
| Armenian | 16 | 0.1% |
| Austrian | 32 | 0.3% |
| Belgian | 165 | 1.3% |
| Bhutanese | 78 | 0.6% |
| Blackfeet | 11 | 0.1% |
| Brazilian | 14 | 0.1% |
| British | 89 | 0.7% |
| Burmese | 263 | 2.0% |
| Canadian | 111 | 0.9% |
| Central American | 25 | 0.2% |
| Cherokee | 54 | 0.4% |
| Colombian | 22 | 0.2% |
| Croatian | 31 | 0.2% |
| Czech | 36 | 0.3% |
| Czechoslovakian | 15 | 0.1% |
| Danish | 53 | 0.4% |
| Dutch | 88 | 0.7% |
| Eastern European | 12 | 0.1% |
| Egyptian | 34 | 0.3% |
| English | 1,568 | 12.1% |
| European | 142 | 1.1% |
| Finnish | 55 | 0.4% |
| French | 288 | 2.2% |
| French Canadian | 165 | 1.3% |
| German | 2,863 | 22.1% |
| Greek | 61 | 0.5% |
| Hungarian | 208 | 1.6% |
| Indian (Asian) | 392 | 3.0% |
| Iranian | 2 | 0.0% |
| Iraqi | 45 | 0.4% |
| Irish | 1,702 | 13.1% |
| Italian | 1,594 | 12.3% |
| Korean | 46 | 0.4% |
| Lebanese | 347 | 2.7% |
| Lithuanian | 82 | 0.6% |
| Macedonian | 40 | 0.3% |
| Maltese | 11 | 0.1% |
| Mexican | 113 | 0.9% |
| Nicaraguan | 15 | 0.1% |
| Northern European | 30 | 0.2% |
| Norwegian | 125 | 1.0% |
| Pakistani | 54 | 0.4% |
| Palestinian | 18 | 0.1% |
| Panamanian | 10 | 0.1% |
| Polish | 1,298 | 10.0% |
| Portuguese | 18 | 0.1% |
| Puerto Rican | 17 | 0.1% |
| Romanian | 13 | 0.1% |
| Russian | 243 | 1.9% |
| Scandinavian | 65 | 0.5% |
| Scotch-Irish | 72 | 0.5% |
| Scottish | 280 | 2.2% |
| Slovak | 113 | 0.9% |
| South African | 3 | 0.0% |
| South American | 37 | 0.3% |
| Spanish | 19 | 0.2% |
| Sri Lankan | 14 | 0.1% |
| Subsaharan African | 22 | 0.2% |
| Swedish | 39 | 0.3% |
| Syrian | 148 | 1.1% |
| Thai | 319 | 2.5% |
| Ukrainian | 70 | 0.5% |
| Welsh | 60 | 0.5% | View All 67 Rows |
Immigrants in Rochester
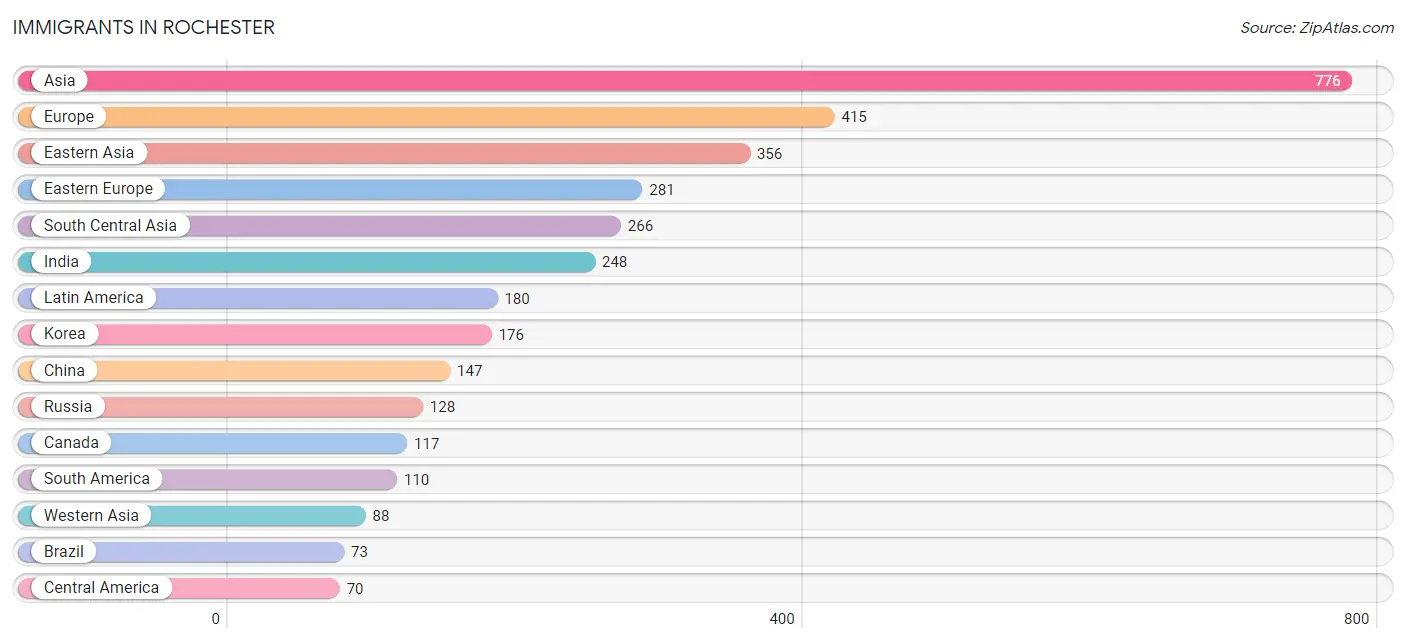
The most numerous immigrant groups reported in Rochester came from Asia (776 | 6.0%), Europe (415 | 3.2%), Eastern Asia (356 | 2.7%), Eastern Europe (281 | 2.2%), and South Central Asia (266 | 2.1%), together accounting for 16.1% of all Rochester residents.
| Immigration Origin | # Population | % Population |
| Africa | 25 | 0.2% |
| Argentina | 15 | 0.1% |
| Asia | 776 | 6.0% |
| Belarus | 43 | 0.3% |
| Bosnia and Herzegovina | 10 | 0.1% |
| Brazil | 73 | 0.6% |
| Canada | 117 | 0.9% |
| Central America | 70 | 0.5% |
| China | 147 | 1.1% |
| Colombia | 22 | 0.2% |
| Czechoslovakia | 26 | 0.2% |
| Denmark | 4 | 0.0% |
| Eastern Asia | 356 | 2.7% |
| Eastern Europe | 281 | 2.2% |
| Egypt | 17 | 0.1% |
| England | 9 | 0.1% |
| Europe | 415 | 3.2% |
| Germany | 44 | 0.3% |
| Hong Kong | 15 | 0.1% |
| India | 248 | 1.9% |
| Iran | 2 | 0.0% |
| Iraq | 21 | 0.2% |
| Italy | 20 | 0.2% |
| Japan | 33 | 0.3% |
| Korea | 176 | 1.4% |
| Latin America | 180 | 1.4% |
| Lebanon | 67 | 0.5% |
| Malaysia | 12 | 0.1% |
| Mexico | 60 | 0.5% |
| North Macedonia | 40 | 0.3% |
| Northern Africa | 17 | 0.1% |
| Northern Europe | 70 | 0.5% |
| Pakistan | 16 | 0.1% |
| Panama | 10 | 0.1% |
| Philippines | 10 | 0.1% |
| Poland | 19 | 0.2% |
| Romania | 8 | 0.1% |
| Russia | 128 | 1.0% |
| Scotland | 10 | 0.1% |
| South Africa | 8 | 0.1% |
| South America | 110 | 0.9% |
| South Central Asia | 266 | 2.1% |
| South Eastern Asia | 66 | 0.5% |
| Southern Europe | 20 | 0.2% |
| Thailand | 36 | 0.3% |
| Vietnam | 8 | 0.1% |
| Western Asia | 88 | 0.7% |
| Western Europe | 44 | 0.3% | View All 48 Rows |
Sex and Age in Rochester
Sex and Age in Rochester
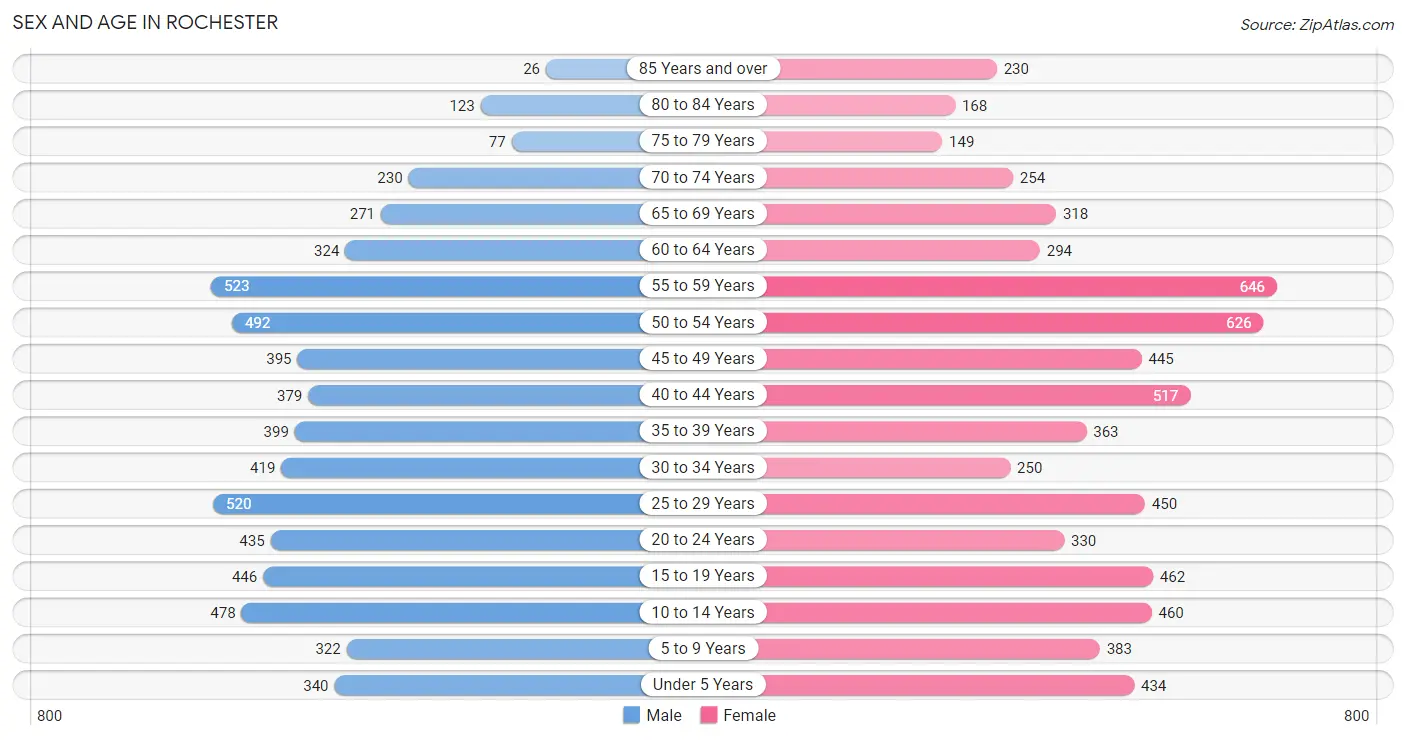
The most populous age groups in Rochester are 55 to 59 Years (523 | 8.4%) for men and 55 to 59 Years (646 | 9.5%) for women.
| Age Bracket | Male | Female |
| Under 5 Years | 340 (5.5%) | 434 (6.4%) |
| 5 to 9 Years | 322 (5.2%) | 383 (5.7%) |
| 10 to 14 Years | 478 (7.7%) | 460 (6.8%) |
| 15 to 19 Years | 446 (7.2%) | 462 (6.8%) |
| 20 to 24 Years | 435 (7.0%) | 330 (4.9%) |
| 25 to 29 Years | 520 (8.4%) | 450 (6.6%) |
| 30 to 34 Years | 419 (6.8%) | 250 (3.7%) |
| 35 to 39 Years | 399 (6.4%) | 363 (5.3%) |
| 40 to 44 Years | 379 (6.1%) | 517 (7.6%) |
| 45 to 49 Years | 395 (6.4%) | 445 (6.6%) |
| 50 to 54 Years | 492 (7.9%) | 626 (9.2%) |
| 55 to 59 Years | 523 (8.4%) | 646 (9.5%) |
| 60 to 64 Years | 324 (5.2%) | 294 (4.3%) |
| 65 to 69 Years | 271 (4.4%) | 318 (4.7%) |
| 70 to 74 Years | 230 (3.7%) | 254 (3.7%) |
| 75 to 79 Years | 77 (1.2%) | 149 (2.2%) |
| 80 to 84 Years | 123 (2.0%) | 168 (2.5%) |
| 85 Years and over | 26 (0.4%) | 230 (3.4%) |
| Total | 6,199 (100.0%) | 6,779 (100.0%) |
Families and Households in Rochester
Median Family Size in Rochester
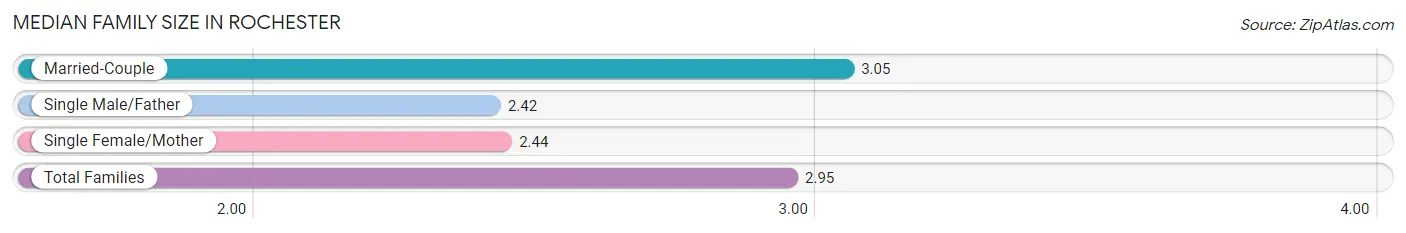
The median family size in Rochester is 2.95 persons per family, with married-couple families (2,836 | 82.5%) accounting for the largest median family size of 3.05 persons per family. On the other hand, single male/father families (107 | 3.1%) represent the smallest median family size with 2.42 persons per family.
| Family Type | # Families | Family Size |
| Married-Couple | 2,836 (82.5%) | 3.05 |
| Single Male/Father | 107 (3.1%) | 2.42 |
| Single Female/Mother | 494 (14.4%) | 2.44 |
| Total Families | 3,437 (100.0%) | 2.95 |
Median Household Size in Rochester
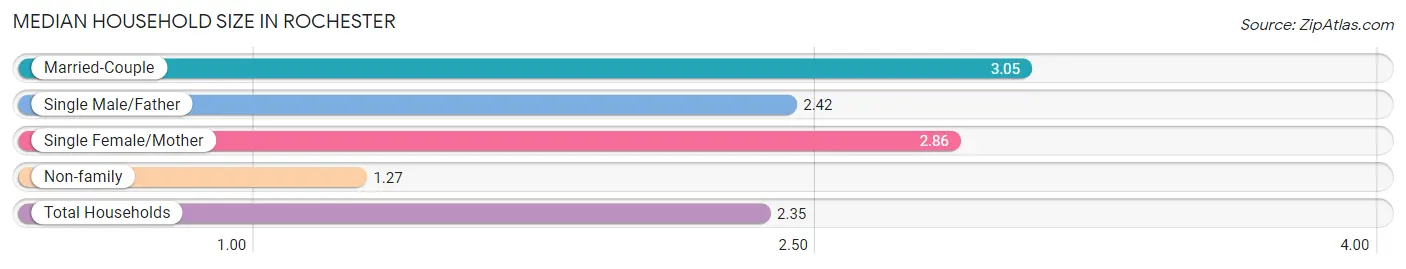
The median household size in Rochester is 2.35 persons per household, with married-couple households (2,836 | 51.6%) accounting for the largest median household size of 3.05 persons per household. non-family households (2,059 | 37.5%) represent the smallest median household size with 1.27 persons per household.
| Household Type | # Households | Household Size |
| Married-Couple | 2,836 (51.6%) | 3.05 |
| Single Male/Father | 107 (1.9%) | 2.42 |
| Single Female/Mother | 494 (9.0%) | 2.86 |
| Non-family | 2,059 (37.5%) | 1.27 |
| Total Households | 5,496 (100.0%) | 2.35 |
Household Size by Marriage Status in Rochester
Out of a total of 5,496 households in Rochester, 3,437 (62.5%) are family households, while 2,059 (37.5%) are nonfamily households. The most numerous type of family households are 2-person households, comprising 1,682, and the most common type of nonfamily households are 1-person households, comprising 1,506.
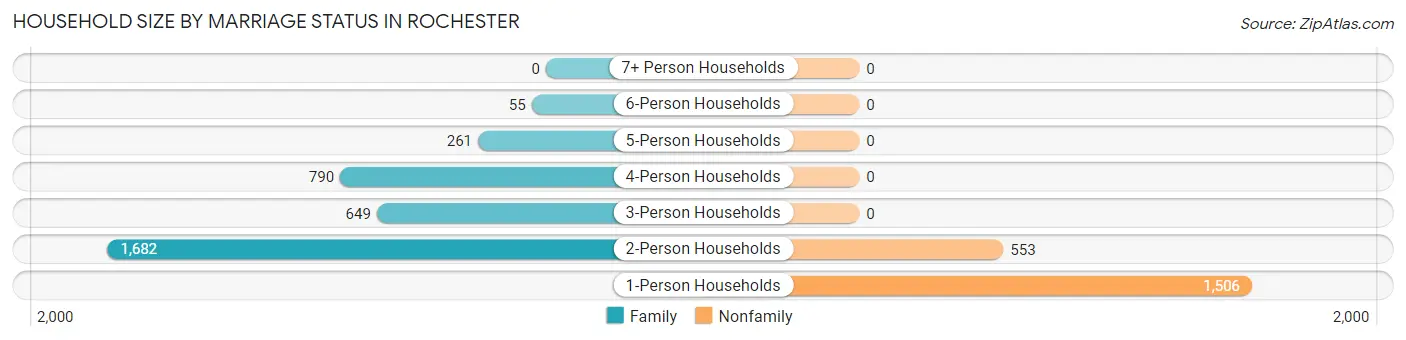
| Household Size | Family Households | Nonfamily Households |
| 1-Person Households | - | 1,506 (27.4%) |
| 2-Person Households | 1,682 (30.6%) | 553 (10.1%) |
| 3-Person Households | 649 (11.8%) | 0 (0.0%) |
| 4-Person Households | 790 (14.4%) | 0 (0.0%) |
| 5-Person Households | 261 (4.8%) | 0 (0.0%) |
| 6-Person Households | 55 (1.0%) | 0 (0.0%) |
| 7+ Person Households | 0 (0.0%) | 0 (0.0%) |
| Total | 3,437 (62.5%) | 2,059 (37.5%) |
Female Fertility in Rochester
Fertility by Age in Rochester
Average fertility rate in Rochester is 50.0 births per 1,000 women. Women in the age bracket of 20 to 34 years have the highest fertility rate with 115.0 births per 1,000 women. Women in the age bracket of 20 to 34 years acount for 79.2% of all women with births.
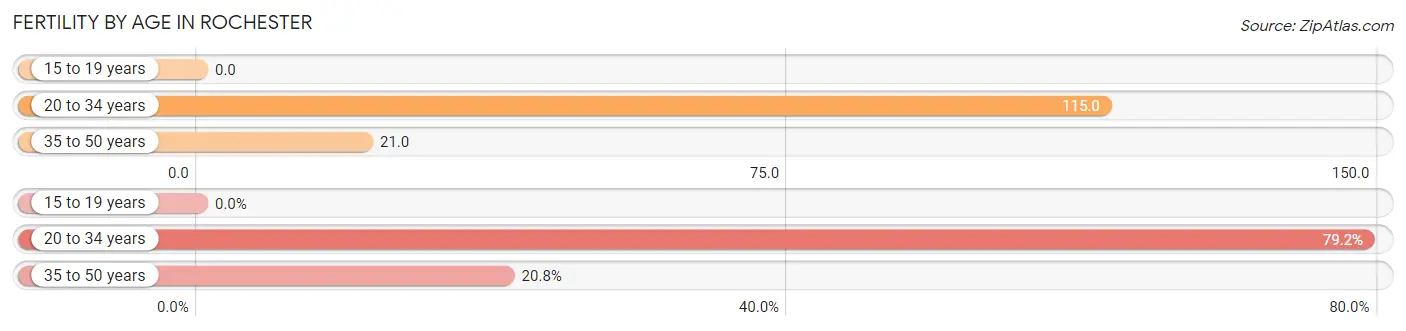
| Age Bracket | Women with Births | Births / 1,000 Women |
| 15 to 19 years | 0 (0.0%) | 0.0 |
| 20 to 34 years | 118 (79.2%) | 115.0 |
| 35 to 50 years | 31 (20.8%) | 21.0 |
| Total | 149 (100.0%) | 50.0 |
Fertility by Age by Marriage Status in Rochester
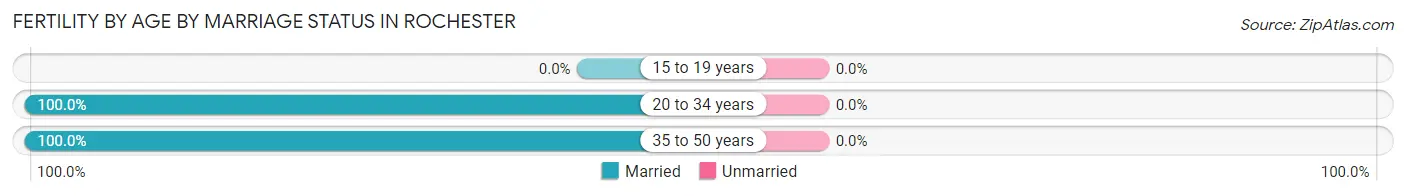
| Age Bracket | Married | Unmarried |
| 15 to 19 years | 0 (0.0%) | 0 (0.0%) |
| 20 to 34 years | 118 (100.0%) | 0 (0.0%) |
| 35 to 50 years | 31 (100.0%) | 0 (0.0%) |
| Total | 149 (100.0%) | 0 (0.0%) |
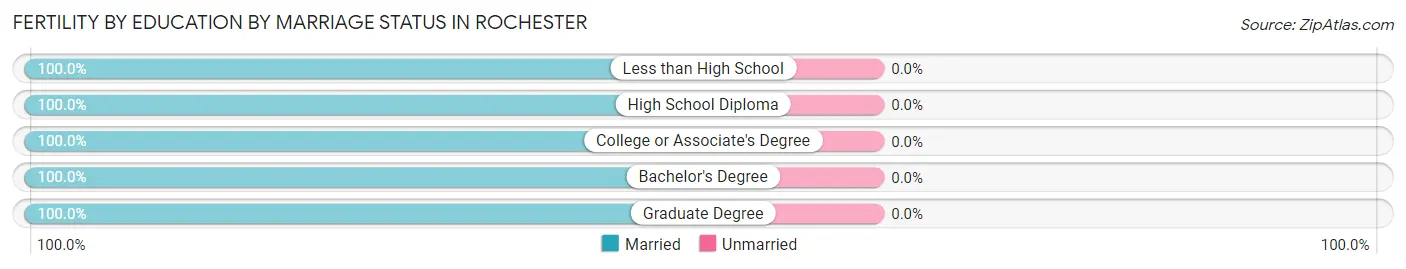
Fertility by Education in Rochester
Average fertility rate in Rochester is 50.0 births per 1,000 women. Women with the education attainment of graduate degree have the highest fertility rate of 108.0 births per 1,000 women, while women with the education attainment of high school diploma have the lowest fertility at 20.0 births per 1,000 women. Women with the education attainment of graduate degree represent 56.4% of all women with births.
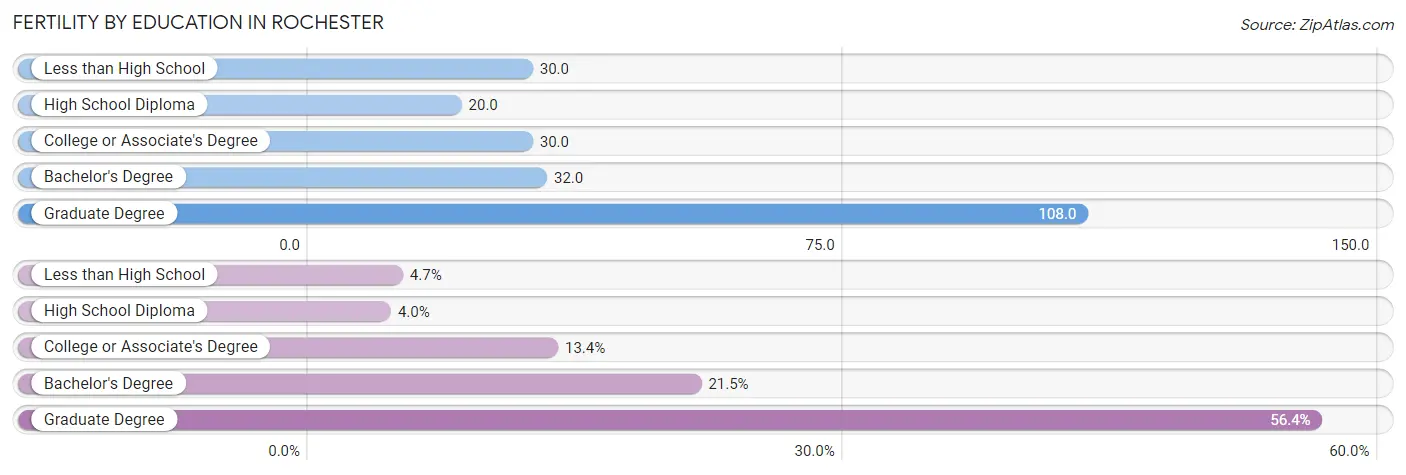
| Educational Attainment | Women with Births | Births / 1,000 Women |
| Less than High School | 7 (4.7%) | 30.0 |
| High School Diploma | 6 (4.0%) | 20.0 |
| College or Associate's Degree | 20 (13.4%) | 30.0 |
| Bachelor's Degree | 32 (21.5%) | 32.0 |
| Graduate Degree | 84 (56.4%) | 108.0 |
| Total | 149 (100.0%) | 50.0 |
Fertility by Education by Marriage Status in Rochester
| Educational Attainment | Married | Unmarried |
| Less than High School | 7 (100.0%) | 0 (0.0%) |
| High School Diploma | 6 (100.0%) | 0 (0.0%) |
| College or Associate's Degree | 20 (100.0%) | 0 (0.0%) |
| Bachelor's Degree | 32 (100.0%) | 0 (0.0%) |
| Graduate Degree | 84 (100.0%) | 0 (0.0%) |
| Total | 149 (100.0%) | 0 (0.0%) |
Employment Characteristics in Rochester
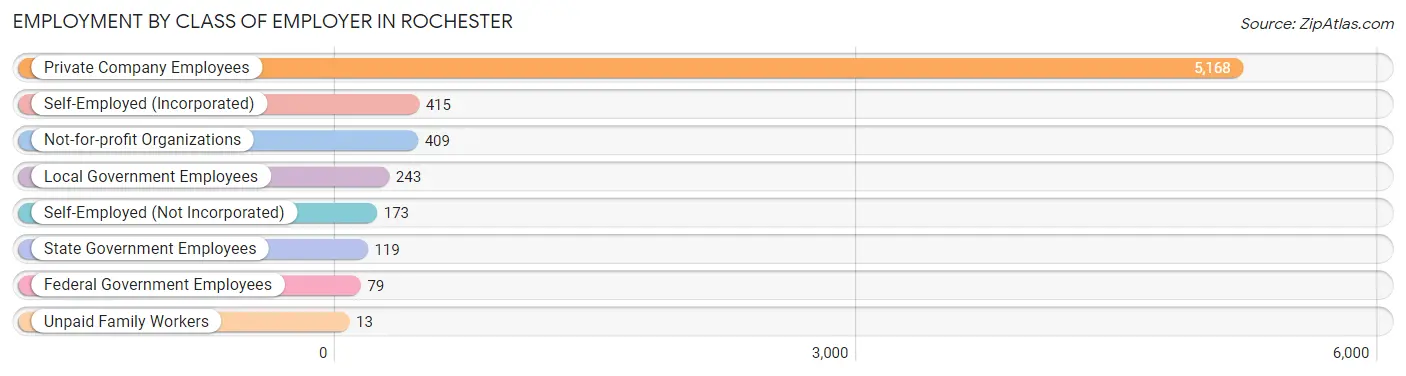
Employment by Class of Employer in Rochester
Among the 6,619 employed individuals in Rochester, private company employees (5,168 | 78.1%), self-employed (incorporated) (415 | 6.3%), and not-for-profit organizations (409 | 6.2%) make up the most common classes of employment.
| Employer Class | # Employees | % Employees |
| Private Company Employees | 5,168 | 78.1% |
| Self-Employed (Incorporated) | 415 | 6.3% |
| Self-Employed (Not Incorporated) | 173 | 2.6% |
| Not-for-profit Organizations | 409 | 6.2% |
| Local Government Employees | 243 | 3.7% |
| State Government Employees | 119 | 1.8% |
| Federal Government Employees | 79 | 1.2% |
| Unpaid Family Workers | 13 | 0.2% |
| Total | 6,619 | 100.0% |
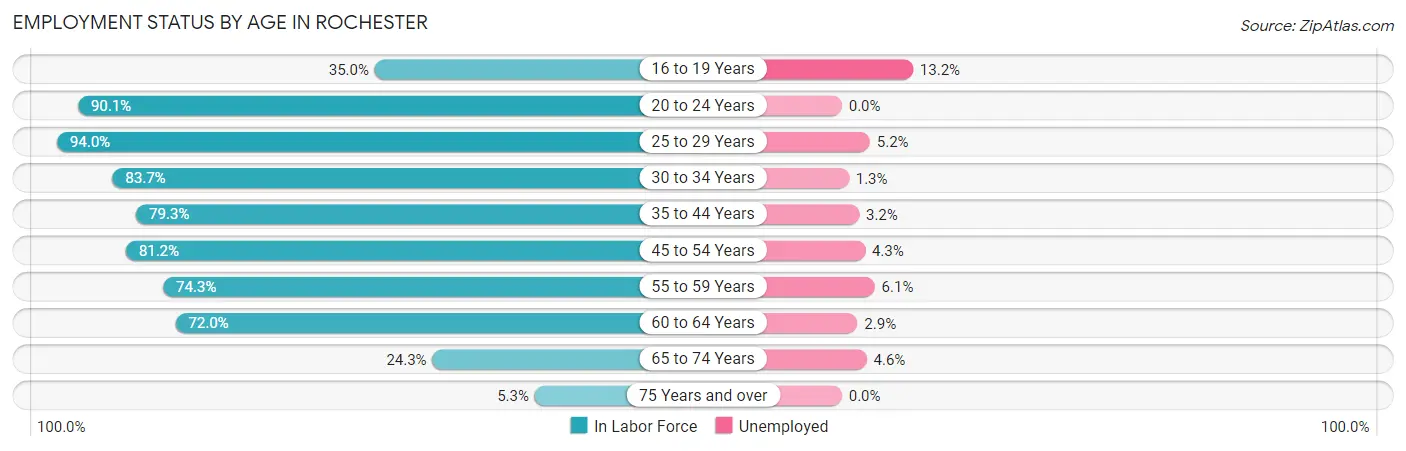
Employment Status by Age in Rochester
According to the labor force statistics for Rochester, out of the total population over 16 years of age (10,432), 66.6% or 6,948 individuals are in the labor force, with 4.0% or 278 of them unemployed. The age group with the highest labor force participation rate is 25 to 29 years, with 94.0% or 912 individuals in the labor force. Within the labor force, the 16 to 19 years age range has the highest percentage of unemployed individuals, with 13.2% or 36 of them being unemployed.
| Age Bracket | In Labor Force | Unemployed |
| 16 to 19 Years | 273 (35.0%) | 36 (13.2%) |
| 20 to 24 Years | 689 (90.1%) | 0 (0.0%) |
| 25 to 29 Years | 912 (94.0%) | 47 (5.2%) |
| 30 to 34 Years | 560 (83.7%) | 7 (1.3%) |
| 35 to 44 Years | 1,315 (79.3%) | 42 (3.2%) |
| 45 to 54 Years | 1,590 (81.2%) | 68 (4.3%) |
| 55 to 59 Years | 869 (74.3%) | 53 (6.1%) |
| 60 to 64 Years | 445 (72.0%) | 13 (2.9%) |
| 65 to 74 Years | 261 (24.3%) | 12 (4.6%) |
| 75 Years and over | 41 (5.3%) | 0 (0.0%) |
| Total | 6,948 (66.6%) | 278 (4.0%) |
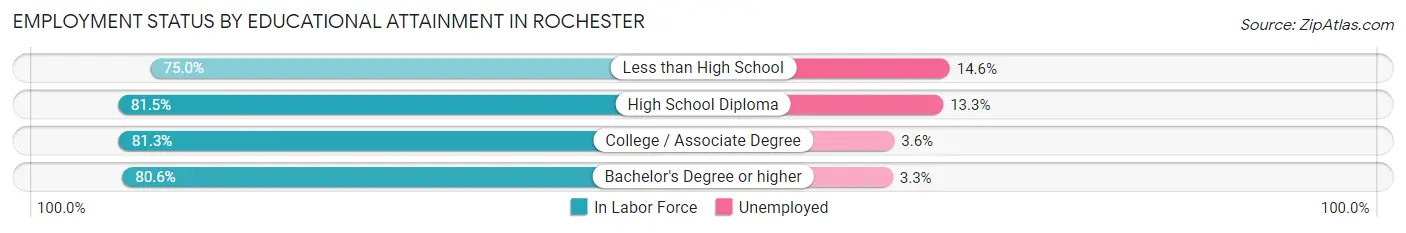
Employment Status by Educational Attainment in Rochester
According to labor force statistics for Rochester, 80.8% of individuals (5,690) out of the total population between 25 and 64 years of age (7,042) are in the labor force, with 4.0% or 228 of them being unemployed. The group with the highest labor force participation rate are those with the educational attainment of high school diploma, with 81.5% or 331 individuals in the labor force. Within the labor force, individuals with less than high school education have the highest percentage of unemployment, with 14.6% or 7 of them being unemployed.
| Educational Attainment | In Labor Force | Unemployed |
| Less than High School | 48 (75.0%) | 9 (14.6%) |
| High School Diploma | 331 (81.5%) | 54 (13.3%) |
| College / Associate Degree | 1,267 (81.3%) | 56 (3.6%) |
| Bachelor's Degree or higher | 4,041 (80.6%) | 165 (3.3%) |
| Total | 5,690 (80.8%) | 282 (4.0%) |
Employment Occupations by Sex in Rochester
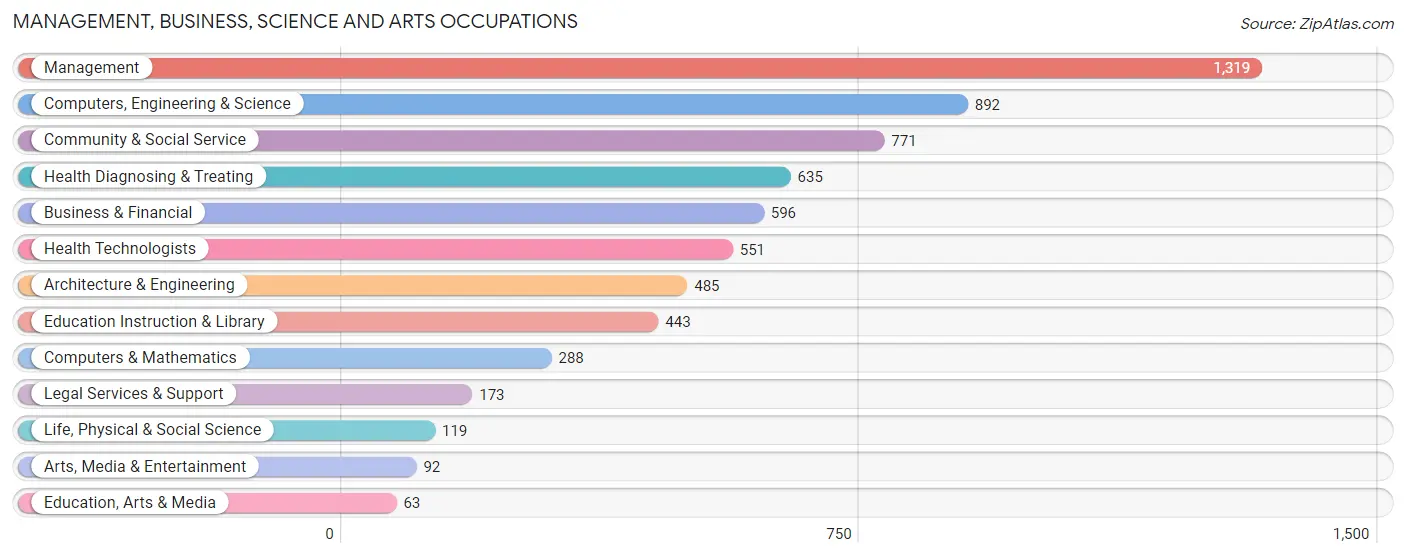
Management, Business, Science and Arts Occupations
The most common Management, Business, Science and Arts occupations in Rochester are Management (1,319 | 19.9%), Computers, Engineering & Science (892 | 13.4%), Community & Social Service (771 | 11.6%), Health Diagnosing & Treating (635 | 9.6%), and Business & Financial (596 | 9.0%).
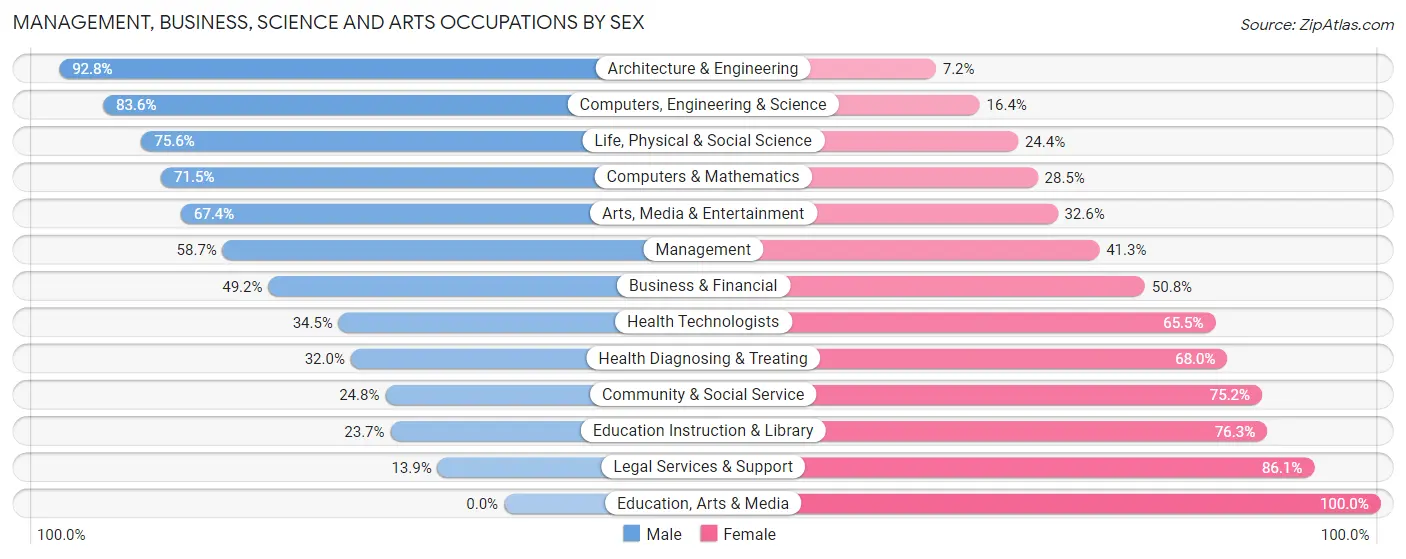
Management, Business, Science and Arts Occupations by Sex
Within the Management, Business, Science and Arts occupations in Rochester, the most male-oriented occupations are Architecture & Engineering (92.8%), Computers, Engineering & Science (83.6%), and Life, Physical & Social Science (75.6%), while the most female-oriented occupations are Education, Arts & Media (100.0%), Legal Services & Support (86.1%), and Education Instruction & Library (76.3%).
| Occupation | Male | Female |
| Management | 774 (58.7%) | 545 (41.3%) |
| Business & Financial | 293 (49.2%) | 303 (50.8%) |
| Computers, Engineering & Science | 746 (83.6%) | 146 (16.4%) |
| Computers & Mathematics | 206 (71.5%) | 82 (28.5%) |
| Architecture & Engineering | 450 (92.8%) | 35 (7.2%) |
| Life, Physical & Social Science | 90 (75.6%) | 29 (24.4%) |
| Community & Social Service | 191 (24.8%) | 580 (75.2%) |
| Education, Arts & Media | 0 (0.0%) | 63 (100.0%) |
| Legal Services & Support | 24 (13.9%) | 149 (86.1%) |
| Education Instruction & Library | 105 (23.7%) | 338 (76.3%) |
| Arts, Media & Entertainment | 62 (67.4%) | 30 (32.6%) |
| Health Diagnosing & Treating | 203 (32.0%) | 432 (68.0%) |
| Health Technologists | 190 (34.5%) | 361 (65.5%) |
| Total (Category) | 2,207 (52.4%) | 2,006 (47.6%) |
| Total (Overall) | 3,560 (53.6%) | 3,085 (46.4%) |
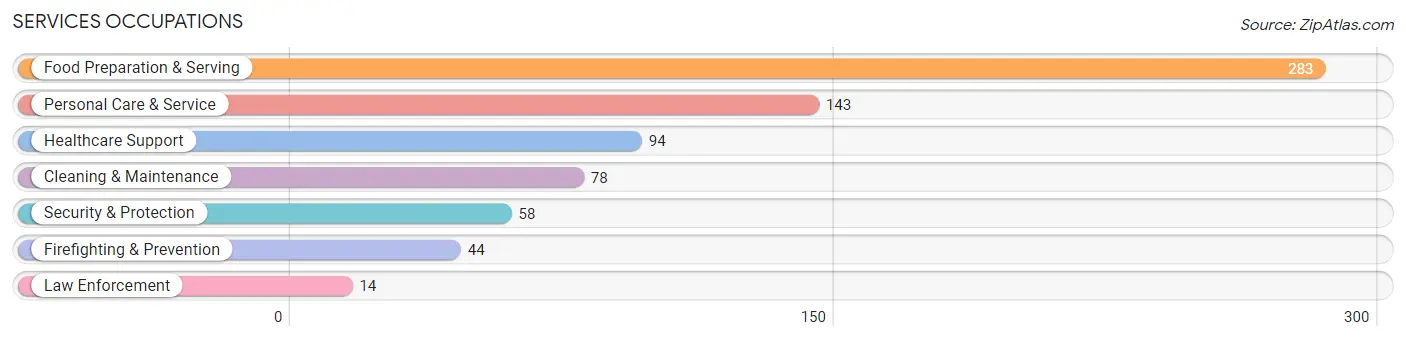
Services Occupations
The most common Services occupations in Rochester are Food Preparation & Serving (283 | 4.3%), Personal Care & Service (143 | 2.1%), Healthcare Support (94 | 1.4%), Cleaning & Maintenance (78 | 1.2%), and Security & Protection (58 | 0.9%).
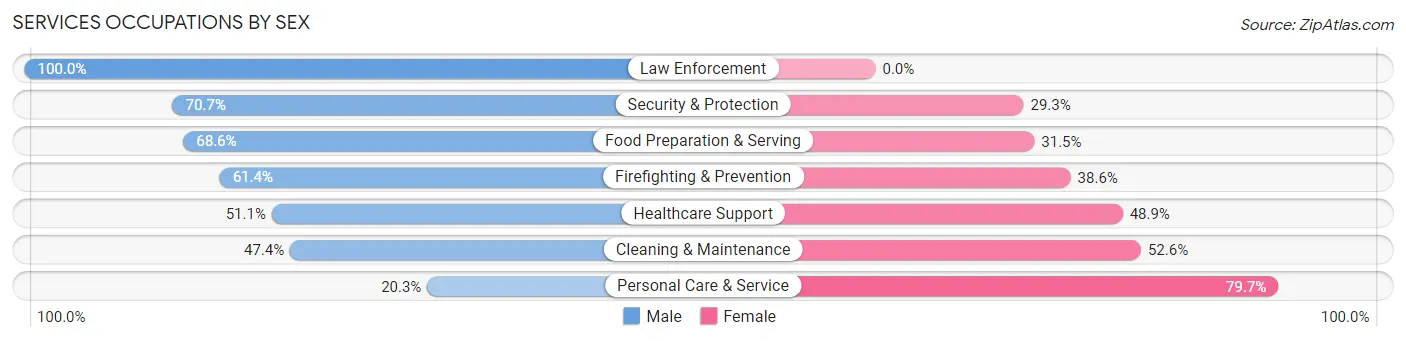
Services Occupations by Sex
Within the Services occupations in Rochester, the most male-oriented occupations are Law Enforcement (100.0%), Security & Protection (70.7%), and Food Preparation & Serving (68.5%), while the most female-oriented occupations are Personal Care & Service (79.7%), Cleaning & Maintenance (52.6%), and Healthcare Support (48.9%).
| Occupation | Male | Female |
| Healthcare Support | 48 (51.1%) | 46 (48.9%) |
| Security & Protection | 41 (70.7%) | 17 (29.3%) |
| Firefighting & Prevention | 27 (61.4%) | 17 (38.6%) |
| Law Enforcement | 14 (100.0%) | 0 (0.0%) |
| Food Preparation & Serving | 194 (68.5%) | 89 (31.5%) |
| Cleaning & Maintenance | 37 (47.4%) | 41 (52.6%) |
| Personal Care & Service | 29 (20.3%) | 114 (79.7%) |
| Total (Category) | 349 (53.2%) | 307 (46.8%) |
| Total (Overall) | 3,560 (53.6%) | 3,085 (46.4%) |
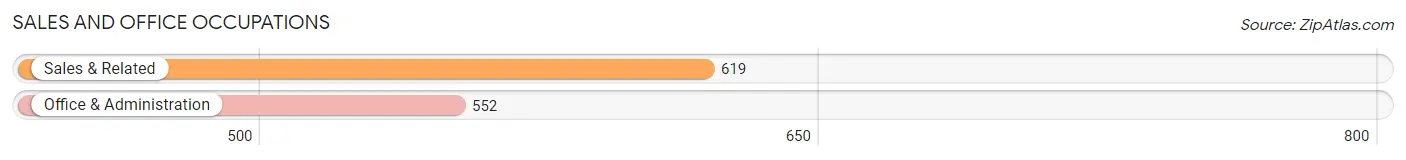
Sales and Office Occupations
The most common Sales and Office occupations in Rochester are Sales & Related (619 | 9.3%), and Office & Administration (552 | 8.3%).
Sales and Office Occupations by Sex
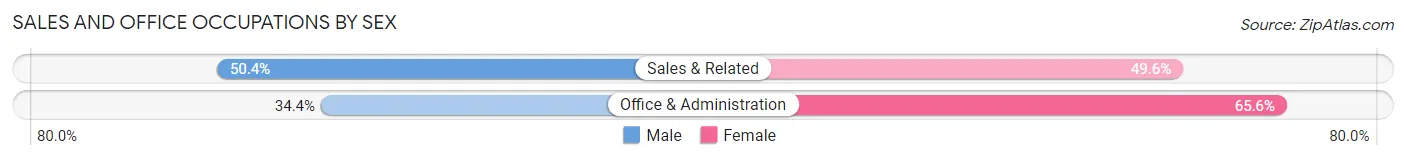
| Occupation | Male | Female |
| Sales & Related | 312 (50.4%) | 307 (49.6%) |
| Office & Administration | 190 (34.4%) | 362 (65.6%) |
| Total (Category) | 502 (42.9%) | 669 (57.1%) |
| Total (Overall) | 3,560 (53.6%) | 3,085 (46.4%) |
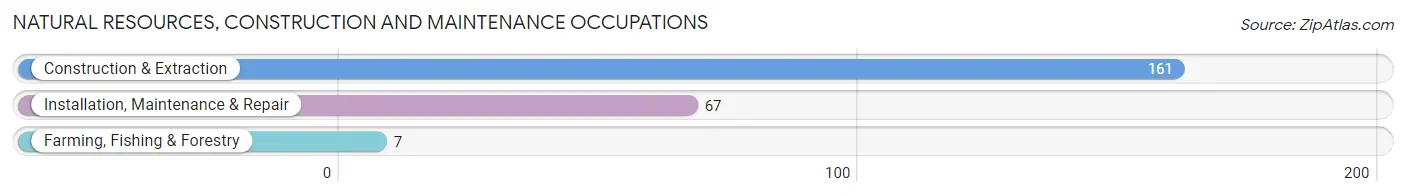
Natural Resources, Construction and Maintenance Occupations
The most common Natural Resources, Construction and Maintenance occupations in Rochester are Construction & Extraction (161 | 2.4%), Installation, Maintenance & Repair (67 | 1.0%), and Farming, Fishing & Forestry (7 | 0.1%).
Natural Resources, Construction and Maintenance Occupations by Sex
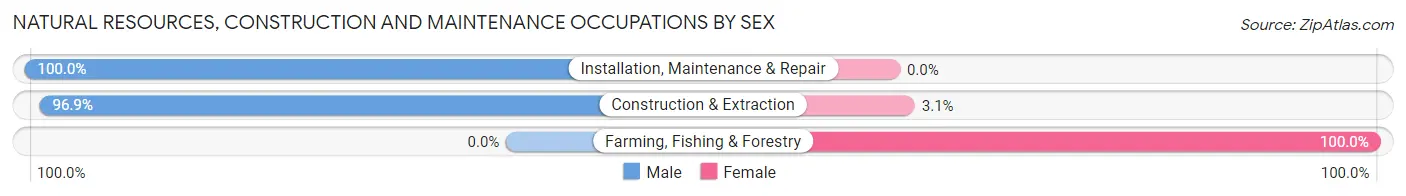
| Occupation | Male | Female |
| Farming, Fishing & Forestry | 0 (0.0%) | 7 (100.0%) |
| Construction & Extraction | 156 (96.9%) | 5 (3.1%) |
| Installation, Maintenance & Repair | 67 (100.0%) | 0 (0.0%) |
| Total (Category) | 223 (94.9%) | 12 (5.1%) |
| Total (Overall) | 3,560 (53.6%) | 3,085 (46.4%) |
Production, Transportation and Moving Occupations
The most common Production, Transportation and Moving occupations in Rochester are Material Moving (239 | 3.6%), Transportation (74 | 1.1%), and Production (57 | 0.9%).
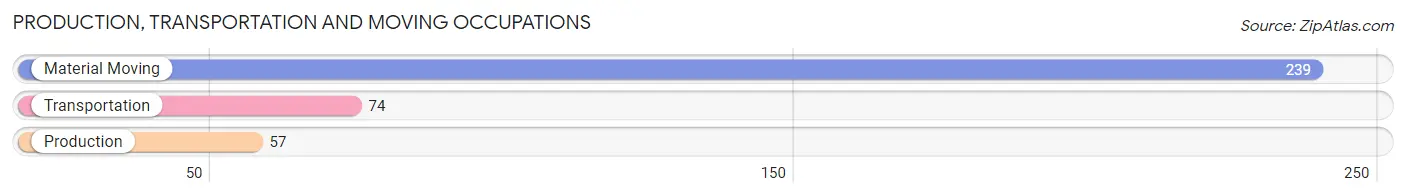
Production, Transportation and Moving Occupations by Sex
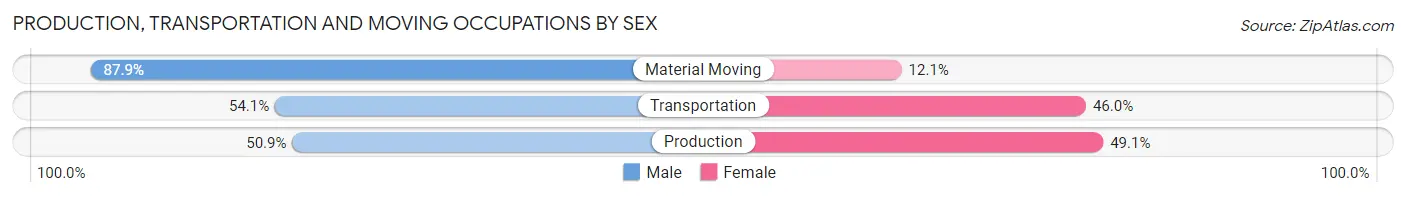
| Occupation | Male | Female |
| Production | 29 (50.9%) | 28 (49.1%) |
| Transportation | 40 (54.0%) | 34 (46.0%) |
| Material Moving | 210 (87.9%) | 29 (12.1%) |
| Total (Category) | 279 (75.4%) | 91 (24.6%) |
| Total (Overall) | 3,560 (53.6%) | 3,085 (46.4%) |
Employment Industries by Sex in Rochester
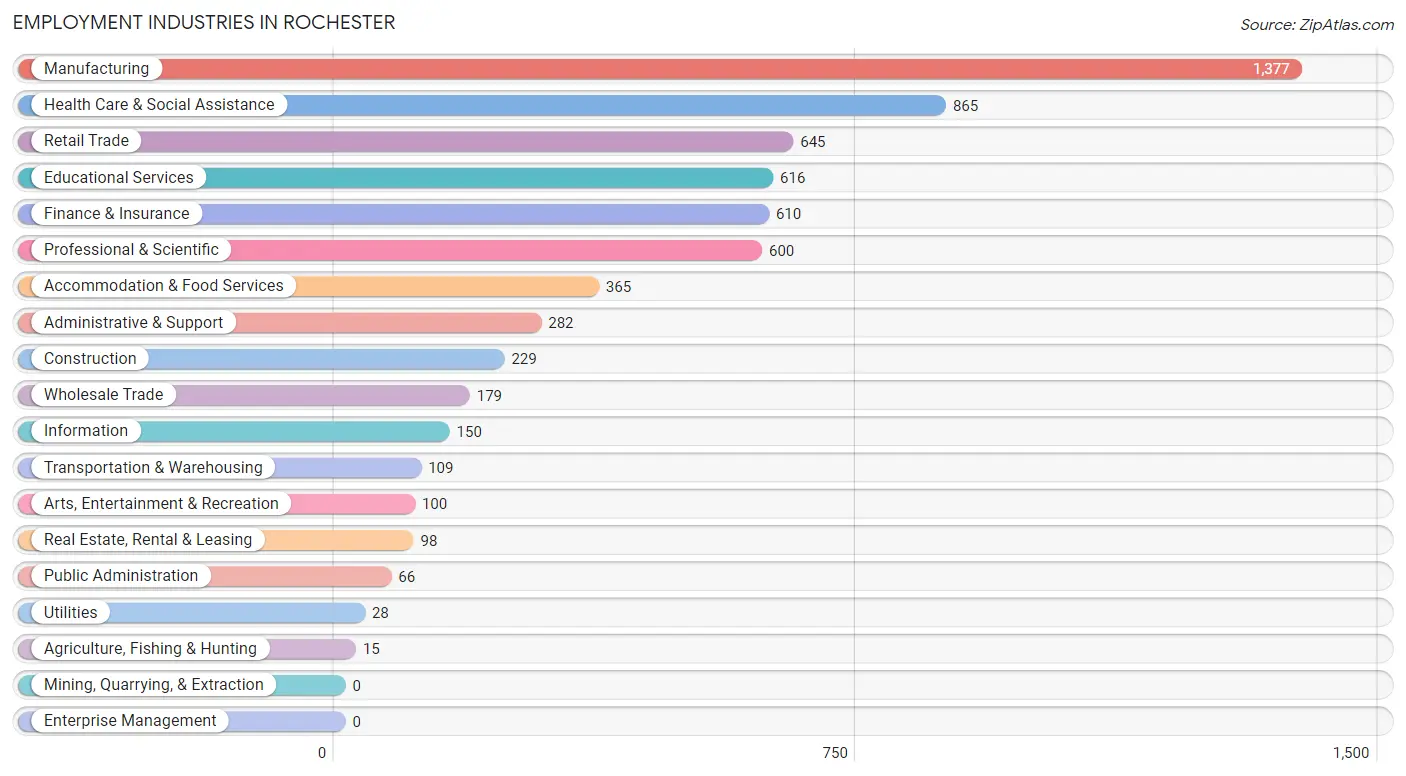
Employment Industries in Rochester
The major employment industries in Rochester include Manufacturing (1,377 | 20.7%), Health Care & Social Assistance (865 | 13.0%), Retail Trade (645 | 9.7%), Educational Services (616 | 9.3%), and Finance & Insurance (610 | 9.2%).
Employment Industries by Sex in Rochester
The Rochester industries that see more men than women are Construction (100.0%), Wholesale Trade (81.6%), and Utilities (75.0%), whereas the industries that tend to have a higher number of women are Agriculture, Fishing & Hunting (100.0%), Administrative & Support (75.5%), and Real Estate, Rental & Leasing (72.5%).
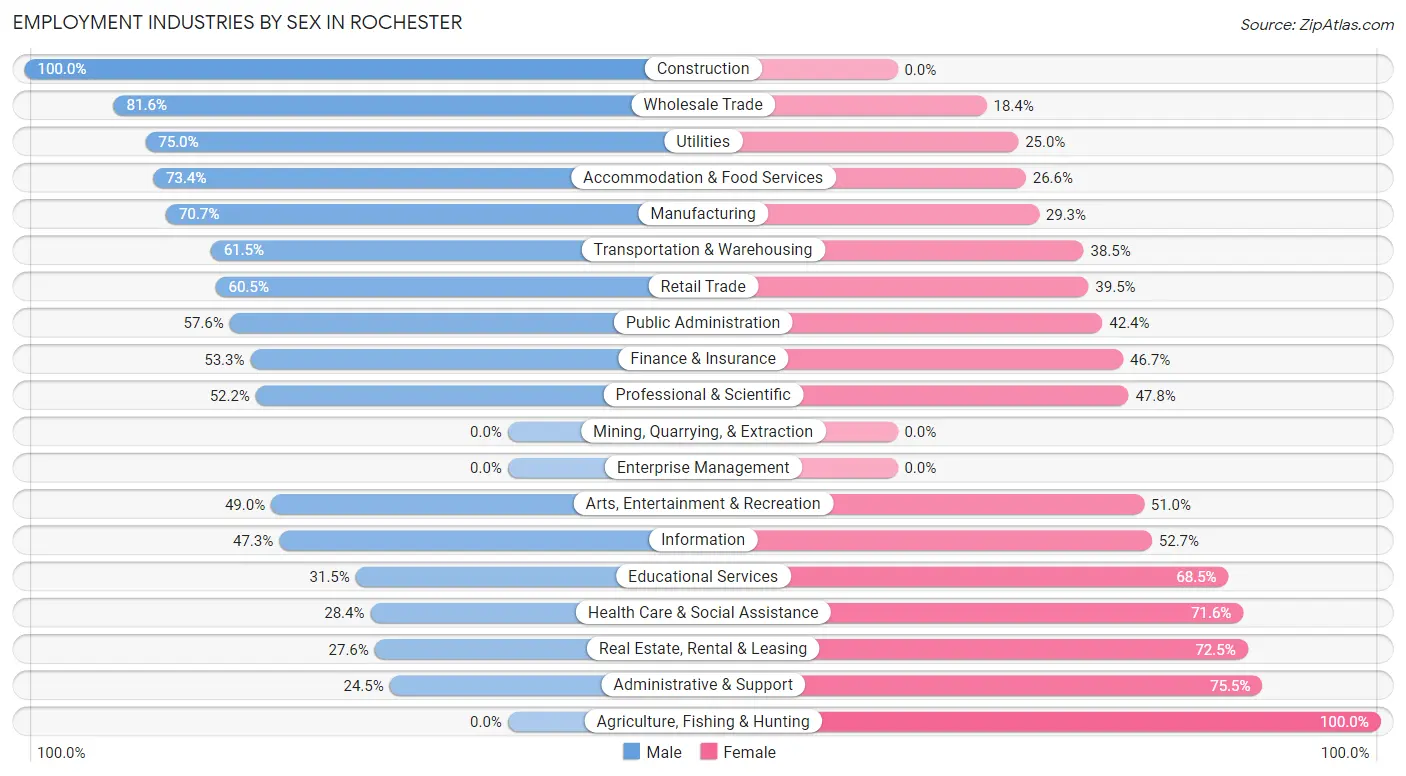
| Industry | Male | Female |
| Agriculture, Fishing & Hunting | 0 (0.0%) | 15 (100.0%) |
| Mining, Quarrying, & Extraction | 0 (0.0%) | 0 (0.0%) |
| Construction | 229 (100.0%) | 0 (0.0%) |
| Manufacturing | 974 (70.7%) | 403 (29.3%) |
| Wholesale Trade | 146 (81.6%) | 33 (18.4%) |
| Retail Trade | 390 (60.5%) | 255 (39.5%) |
| Transportation & Warehousing | 67 (61.5%) | 42 (38.5%) |
| Utilities | 21 (75.0%) | 7 (25.0%) |
| Information | 71 (47.3%) | 79 (52.7%) |
| Finance & Insurance | 325 (53.3%) | 285 (46.7%) |
| Real Estate, Rental & Leasing | 27 (27.6%) | 71 (72.5%) |
| Professional & Scientific | 313 (52.2%) | 287 (47.8%) |
| Enterprise Management | 0 (0.0%) | 0 (0.0%) |
| Administrative & Support | 69 (24.5%) | 213 (75.5%) |
| Educational Services | 194 (31.5%) | 422 (68.5%) |
| Health Care & Social Assistance | 246 (28.4%) | 619 (71.6%) |
| Arts, Entertainment & Recreation | 49 (49.0%) | 51 (51.0%) |
| Accommodation & Food Services | 268 (73.4%) | 97 (26.6%) |
| Public Administration | 38 (57.6%) | 28 (42.4%) |
| Total | 3,560 (53.6%) | 3,085 (46.4%) |
Education in Rochester
School Enrollment in Rochester
The most common levels of schooling among the 3,514 students in Rochester are college / undergraduate (847 | 24.1%), middle school (770 | 21.9%), and elementary school (641 | 18.2%).
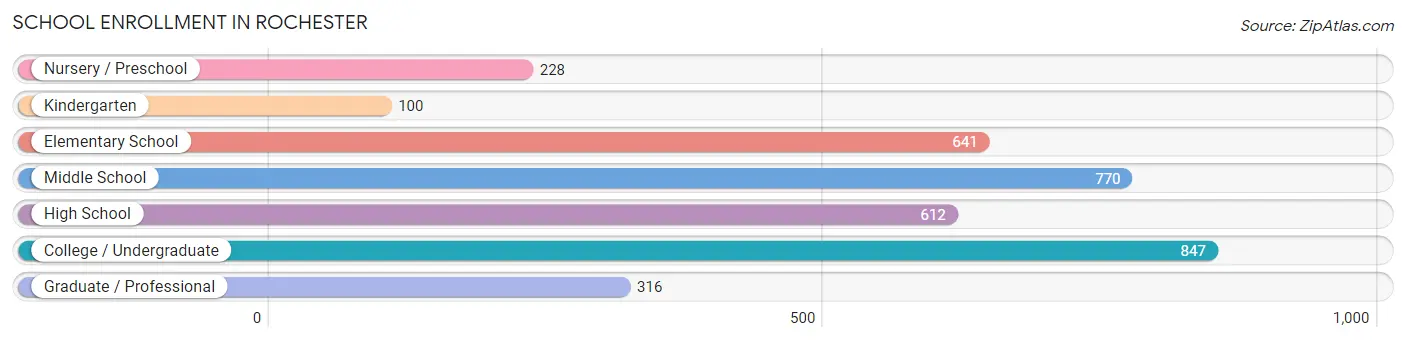
| School Level | # Students | % Students |
| Nursery / Preschool | 228 | 6.5% |
| Kindergarten | 100 | 2.9% |
| Elementary School | 641 | 18.2% |
| Middle School | 770 | 21.9% |
| High School | 612 | 17.4% |
| College / Undergraduate | 847 | 24.1% |
| Graduate / Professional | 316 | 9.0% |
| Total | 3,514 | 100.0% |
School Enrollment by Age by Funding Source in Rochester
Out of a total of 3,514 students who are enrolled in schools in Rochester, 576 (16.4%) attend a private institution, while the remaining 2,938 (83.6%) are enrolled in public schools. The age group of 3 to 4 year olds has the highest likelihood of being enrolled in private schools, with 121 (59.6% in the age bracket) enrolled. Conversely, the age group of 18 to 19 year olds has the lowest likelihood of being enrolled in a private school, with 394 (93.8% in the age bracket) attending a public institution.
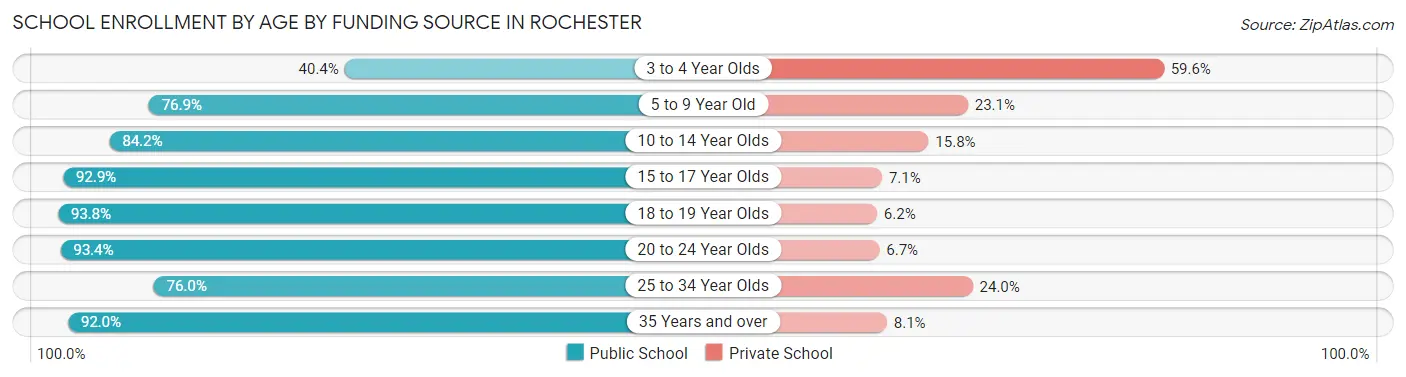
| Age Bracket | Public School | Private School |
| 3 to 4 Year Olds | 82 (40.4%) | 121 (59.6%) |
| 5 to 9 Year Old | 502 (76.9%) | 151 (23.1%) |
| 10 to 14 Year Olds | 790 (84.2%) | 148 (15.8%) |
| 15 to 17 Year Olds | 442 (92.9%) | 34 (7.1%) |
| 18 to 19 Year Olds | 394 (93.8%) | 26 (6.2%) |
| 20 to 24 Year Olds | 393 (93.3%) | 28 (6.7%) |
| 25 to 34 Year Olds | 174 (76.0%) | 55 (24.0%) |
| 35 Years and over | 160 (91.9%) | 14 (8.1%) |
| Total | 2,938 (83.6%) | 576 (16.4%) |
Educational Attainment by Field of Study in Rochester
Business (1,607 | 24.8%), engineering (1,277 | 19.7%), education (732 | 11.3%), science & technology (592 | 9.1%), and communications (307 | 4.7%) are the most common fields of study among 6,491 individuals in Rochester who have obtained a bachelor's degree or higher.
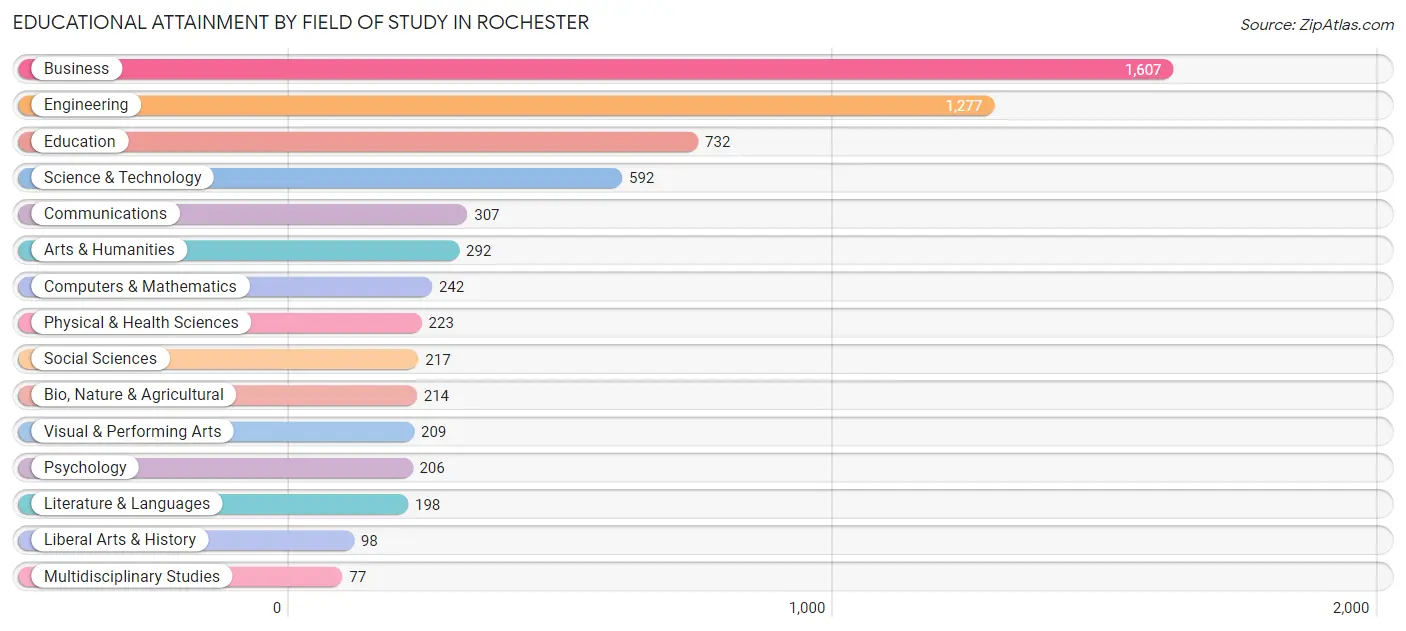
| Field of Study | # Graduates | % Graduates |
| Computers & Mathematics | 242 | 3.7% |
| Bio, Nature & Agricultural | 214 | 3.3% |
| Physical & Health Sciences | 223 | 3.4% |
| Psychology | 206 | 3.2% |
| Social Sciences | 217 | 3.3% |
| Engineering | 1,277 | 19.7% |
| Multidisciplinary Studies | 77 | 1.2% |
| Science & Technology | 592 | 9.1% |
| Business | 1,607 | 24.8% |
| Education | 732 | 11.3% |
| Literature & Languages | 198 | 3.0% |
| Liberal Arts & History | 98 | 1.5% |
| Visual & Performing Arts | 209 | 3.2% |
| Communications | 307 | 4.7% |
| Arts & Humanities | 292 | 4.5% |
| Total | 6,491 | 100.0% |
Transportation & Commute in Rochester
Vehicle Availability by Sex in Rochester
The most prevalent vehicle ownership categories in Rochester are males with 2 vehicles (2,013, accounting for 56.5%) and females with 2 vehicles (1,541, making up 65.8%).
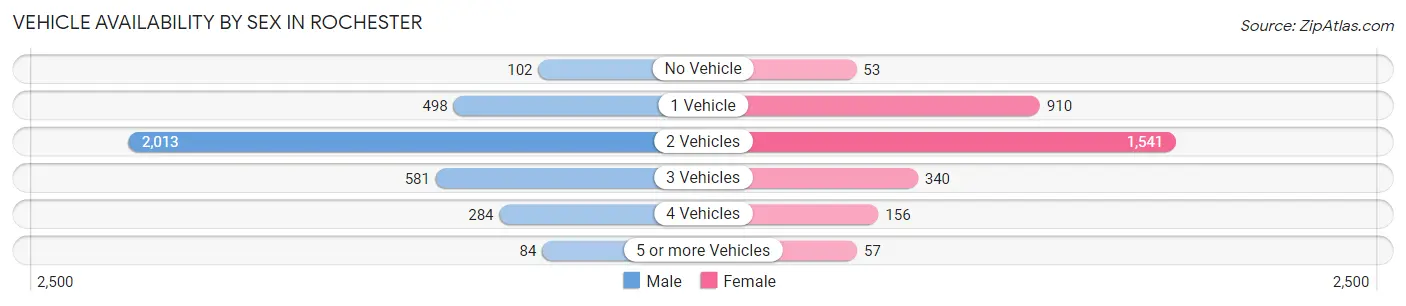
| Vehicles Available | Male | Female |
| No Vehicle | 102 (2.9%) | 53 (1.7%) |
| 1 Vehicle | 498 (14.0%) | 910 (29.8%) |
| 2 Vehicles | 2,013 (56.5%) | 1,541 (50.4%) |
| 3 Vehicles | 581 (16.3%) | 340 (11.1%) |
| 4 Vehicles | 284 (8.0%) | 156 (5.1%) |
| 5 or more Vehicles | 84 (2.4%) | 57 (1.9%) |
| Total | 3,562 (100.0%) | 3,057 (100.0%) |
Commute Time in Rochester
The most frequently occuring commute durations in Rochester are 30 to 34 minutes (998 commuters, 19.6%), 20 to 24 minutes (883 commuters, 17.3%), and 15 to 19 minutes (666 commuters, 13.1%).
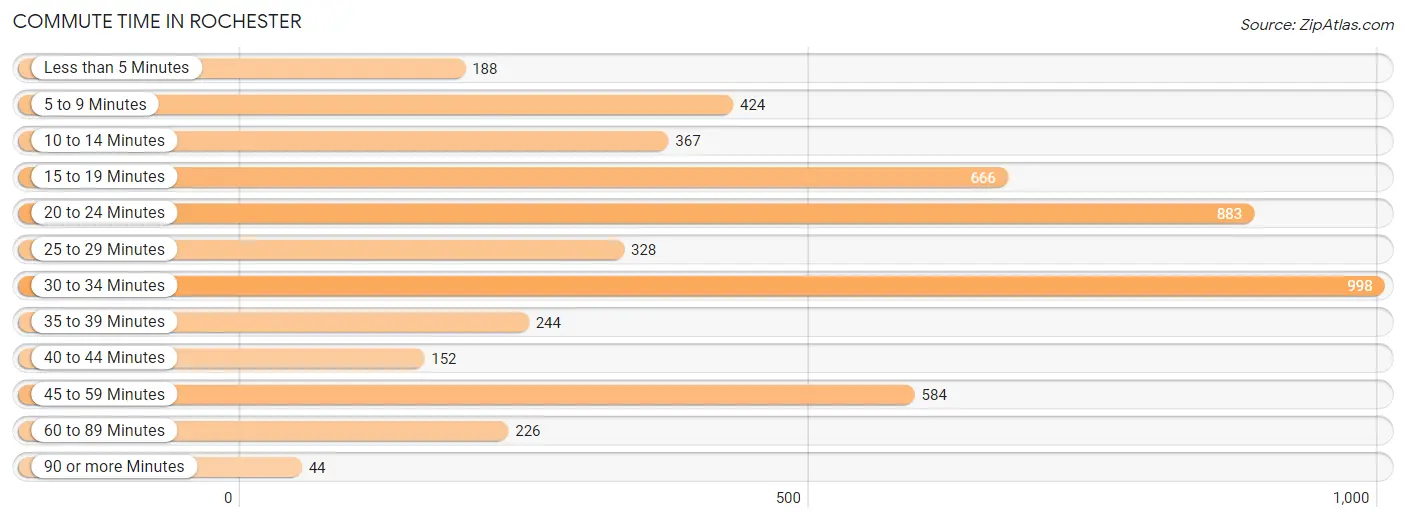
| Commute Time | # Commuters | % Commuters |
| Less than 5 Minutes | 188 | 3.7% |
| 5 to 9 Minutes | 424 | 8.3% |
| 10 to 14 Minutes | 367 | 7.2% |
| 15 to 19 Minutes | 666 | 13.1% |
| 20 to 24 Minutes | 883 | 17.3% |
| 25 to 29 Minutes | 328 | 6.4% |
| 30 to 34 Minutes | 998 | 19.6% |
| 35 to 39 Minutes | 244 | 4.8% |
| 40 to 44 Minutes | 152 | 3.0% |
| 45 to 59 Minutes | 584 | 11.4% |
| 60 to 89 Minutes | 226 | 4.4% |
| 90 or more Minutes | 44 | 0.9% |
Commute Time by Sex in Rochester
The most common commute times in Rochester are 30 to 34 minutes (617 commuters, 21.8%) for males and 20 to 24 minutes (469 commuters, 20.7%) for females.
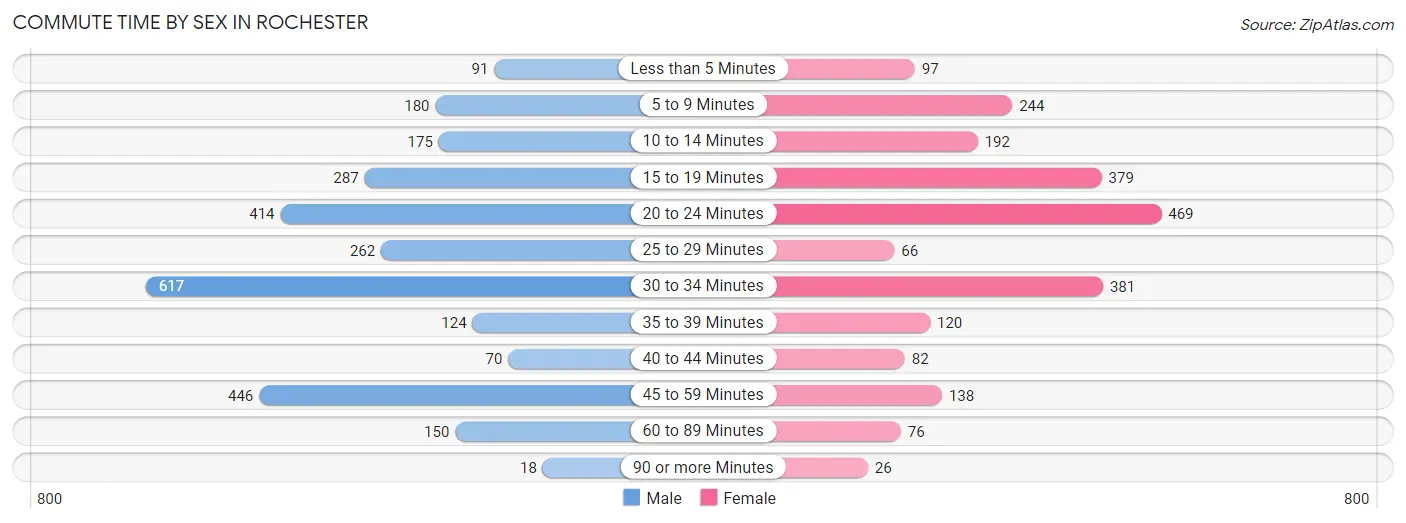
| Commute Time | Male | Female |
| Less than 5 Minutes | 91 (3.2%) | 97 (4.3%) |
| 5 to 9 Minutes | 180 (6.4%) | 244 (10.7%) |
| 10 to 14 Minutes | 175 (6.2%) | 192 (8.5%) |
| 15 to 19 Minutes | 287 (10.1%) | 379 (16.7%) |
| 20 to 24 Minutes | 414 (14.6%) | 469 (20.7%) |
| 25 to 29 Minutes | 262 (9.2%) | 66 (2.9%) |
| 30 to 34 Minutes | 617 (21.8%) | 381 (16.8%) |
| 35 to 39 Minutes | 124 (4.4%) | 120 (5.3%) |
| 40 to 44 Minutes | 70 (2.5%) | 82 (3.6%) |
| 45 to 59 Minutes | 446 (15.7%) | 138 (6.1%) |
| 60 to 89 Minutes | 150 (5.3%) | 76 (3.4%) |
| 90 or more Minutes | 18 (0.6%) | 26 (1.1%) |
Time of Departure to Work by Sex in Rochester
The most frequent times of departure to work in Rochester are 7:00 AM to 7:29 AM (478, 16.9%) for males and 8:00 AM to 8:29 AM (396, 17.4%) for females.
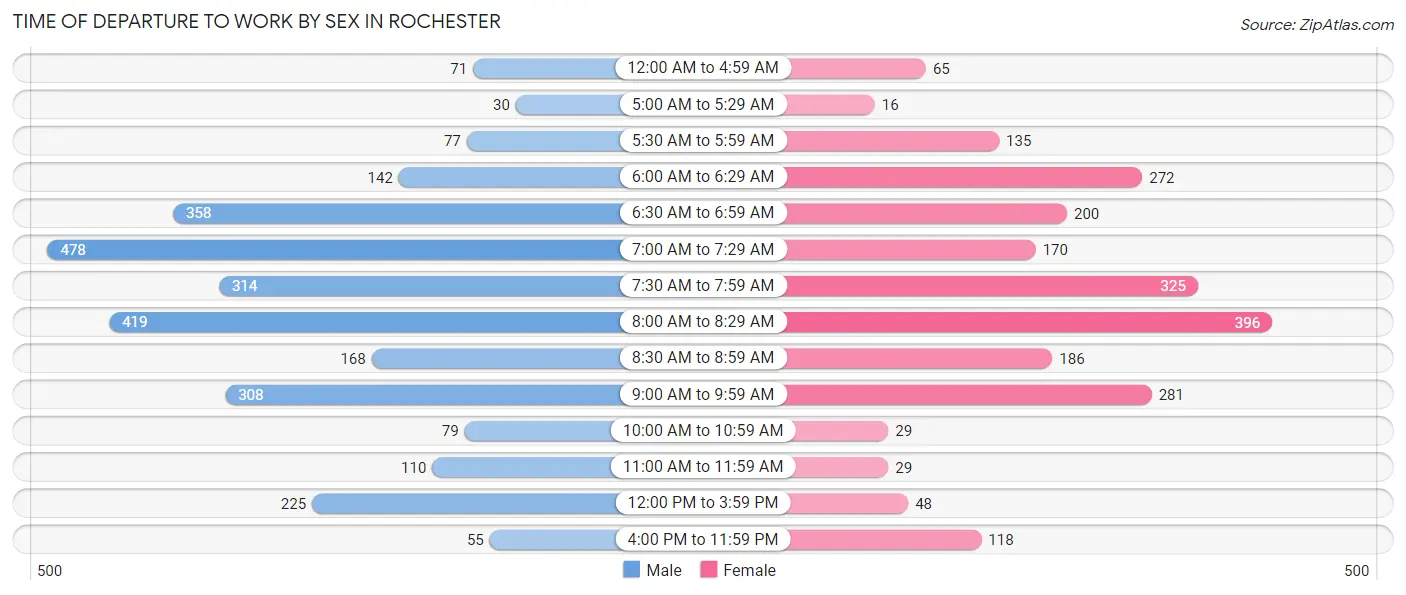
| Time of Departure | Male | Female |
| 12:00 AM to 4:59 AM | 71 (2.5%) | 65 (2.9%) |
| 5:00 AM to 5:29 AM | 30 (1.1%) | 16 (0.7%) |
| 5:30 AM to 5:59 AM | 77 (2.7%) | 135 (5.9%) |
| 6:00 AM to 6:29 AM | 142 (5.0%) | 272 (12.0%) |
| 6:30 AM to 6:59 AM | 358 (12.6%) | 200 (8.8%) |
| 7:00 AM to 7:29 AM | 478 (16.9%) | 170 (7.5%) |
| 7:30 AM to 7:59 AM | 314 (11.1%) | 325 (14.3%) |
| 8:00 AM to 8:29 AM | 419 (14.8%) | 396 (17.4%) |
| 8:30 AM to 8:59 AM | 168 (5.9%) | 186 (8.2%) |
| 9:00 AM to 9:59 AM | 308 (10.9%) | 281 (12.4%) |
| 10:00 AM to 10:59 AM | 79 (2.8%) | 29 (1.3%) |
| 11:00 AM to 11:59 AM | 110 (3.9%) | 29 (1.3%) |
| 12:00 PM to 3:59 PM | 225 (7.9%) | 48 (2.1%) |
| 4:00 PM to 11:59 PM | 55 (1.9%) | 118 (5.2%) |
| Total | 2,834 (100.0%) | 2,270 (100.0%) |
Housing Occupancy in Rochester
Occupancy by Ownership in Rochester
Of the total 5,496 dwellings in Rochester, owner-occupied units account for 3,604 (65.6%), while renter-occupied units make up 1,892 (34.4%).
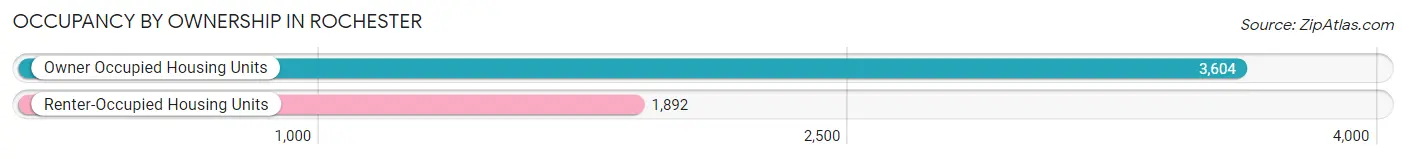
| Occupancy | # Housing Units | % Housing Units |
| Owner Occupied Housing Units | 3,604 | 65.6% |
| Renter-Occupied Housing Units | 1,892 | 34.4% |
| Total Occupied Housing Units | 5,496 | 100.0% |
Occupancy by Household Size in Rochester
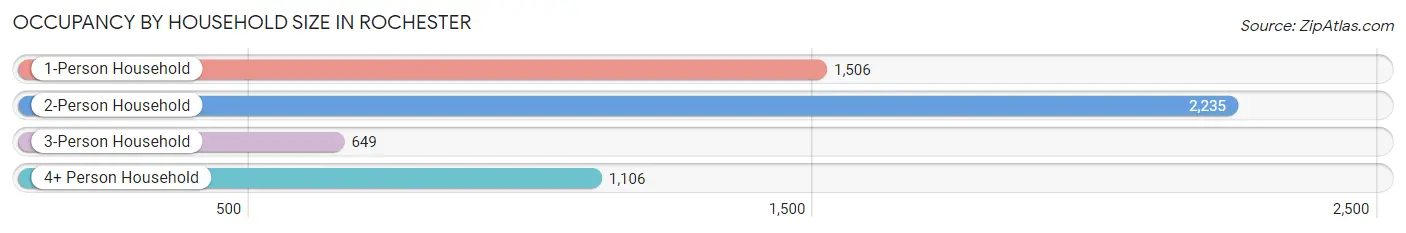
| Household Size | # Housing Units | % Housing Units |
| 1-Person Household | 1,506 | 27.4% |
| 2-Person Household | 2,235 | 40.7% |
| 3-Person Household | 649 | 11.8% |
| 4+ Person Household | 1,106 | 20.1% |
| Total Housing Units | 5,496 | 100.0% |
Occupancy by Ownership by Household Size in Rochester
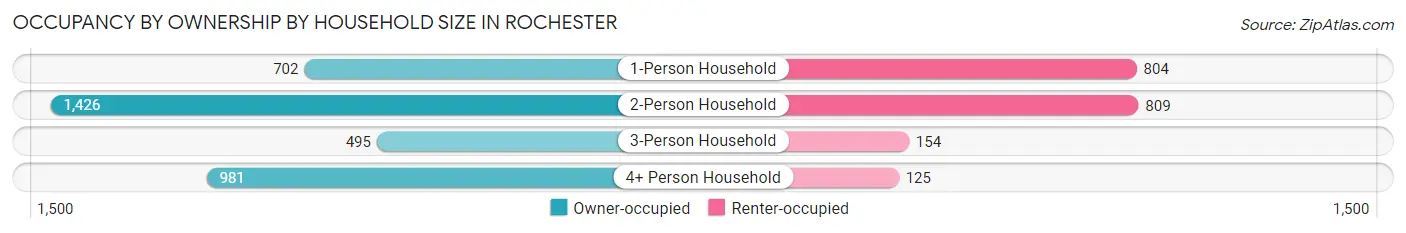
| Household Size | Owner-occupied | Renter-occupied |
| 1-Person Household | 702 (46.6%) | 804 (53.4%) |
| 2-Person Household | 1,426 (63.8%) | 809 (36.2%) |
| 3-Person Household | 495 (76.3%) | 154 (23.7%) |
| 4+ Person Household | 981 (88.7%) | 125 (11.3%) |
| Total Housing Units | 3,604 (65.6%) | 1,892 (34.4%) |
Occupancy by Educational Attainment in Rochester
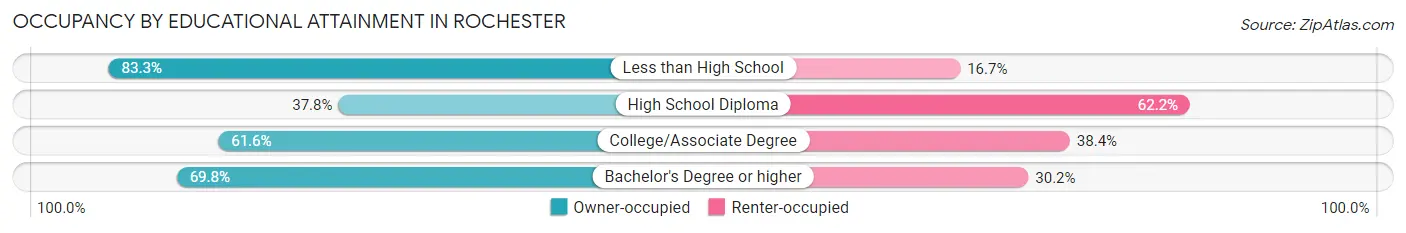
| Household Size | Owner-occupied | Renter-occupied |
| Less than High School | 55 (83.3%) | 11 (16.7%) |
| High School Diploma | 144 (37.8%) | 237 (62.2%) |
| College/Associate Degree | 901 (61.6%) | 562 (38.4%) |
| Bachelor's Degree or higher | 2,504 (69.8%) | 1,082 (30.2%) |
Occupancy by Age of Householder in Rochester
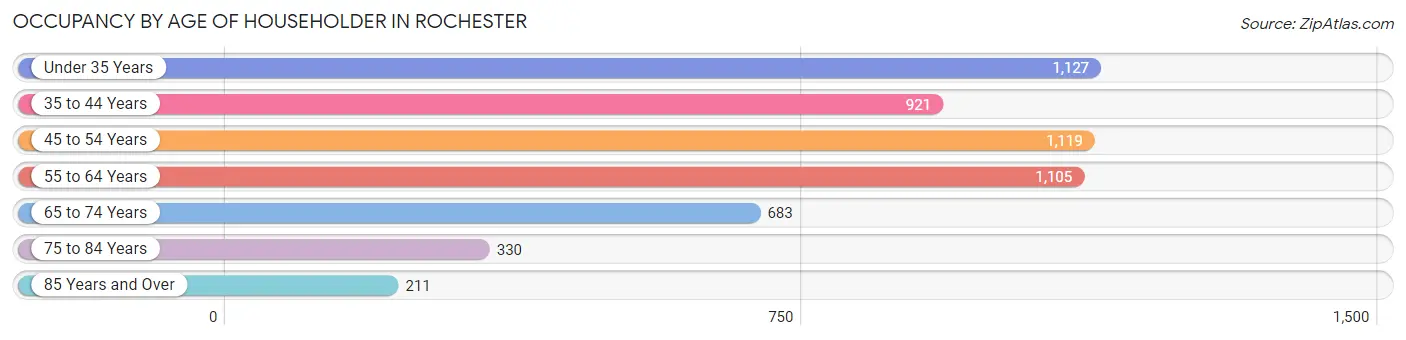
| Age Bracket | # Households | % Households |
| Under 35 Years | 1,127 | 20.5% |
| 35 to 44 Years | 921 | 16.8% |
| 45 to 54 Years | 1,119 | 20.4% |
| 55 to 64 Years | 1,105 | 20.1% |
| 65 to 74 Years | 683 | 12.4% |
| 75 to 84 Years | 330 | 6.0% |
| 85 Years and Over | 211 | 3.8% |
| Total | 5,496 | 100.0% |
Housing Finances in Rochester
Median Income by Occupancy in Rochester
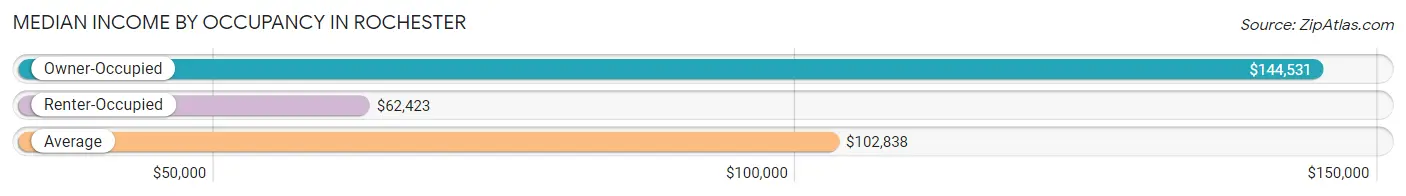
| Occupancy Type | # Households | Median Income |
| Owner-Occupied | 3,604 (65.6%) | $144,531 |
| Renter-Occupied | 1,892 (34.4%) | $62,423 |
| Average | 5,496 (100.0%) | $102,838 |
Occupancy by Householder Income Bracket in Rochester
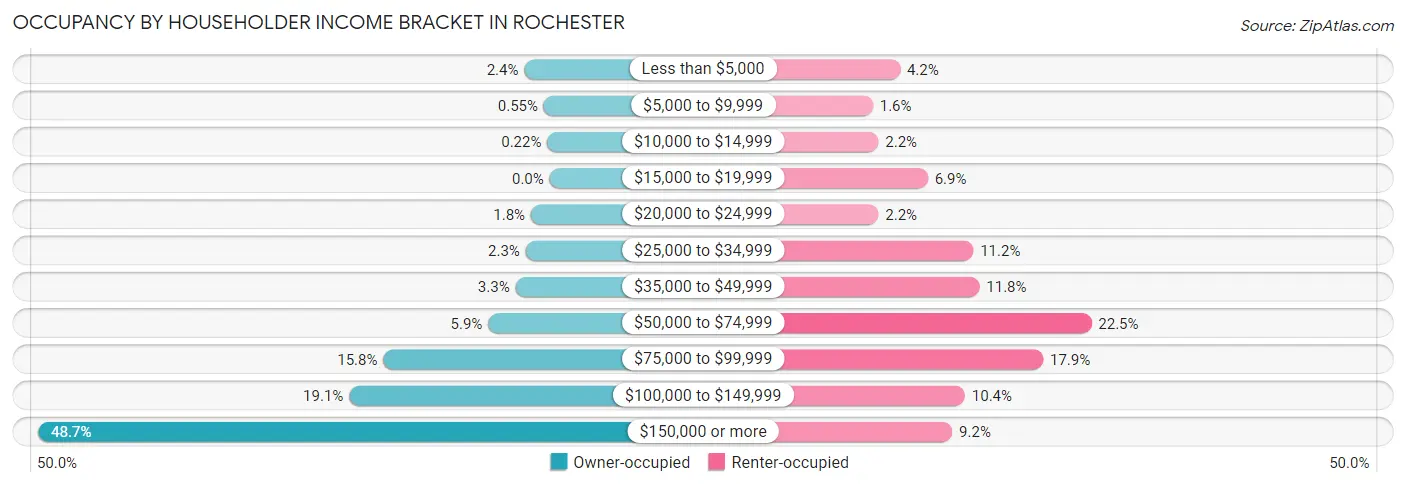
| Income Bracket | Owner-occupied | Renter-occupied |
| Less than $5,000 | 87 (2.4%) | 80 (4.2%) |
| $5,000 to $9,999 | 20 (0.5%) | 31 (1.6%) |
| $10,000 to $14,999 | 8 (0.2%) | 41 (2.2%) |
| $15,000 to $19,999 | 0 (0.0%) | 130 (6.9%) |
| $20,000 to $24,999 | 64 (1.8%) | 41 (2.2%) |
| $25,000 to $34,999 | 82 (2.3%) | 212 (11.2%) |
| $35,000 to $49,999 | 117 (3.3%) | 223 (11.8%) |
| $50,000 to $74,999 | 211 (5.9%) | 425 (22.5%) |
| $75,000 to $99,999 | 571 (15.8%) | 338 (17.9%) |
| $100,000 to $149,999 | 688 (19.1%) | 197 (10.4%) |
| $150,000 or more | 1,756 (48.7%) | 174 (9.2%) |
| Total | 3,604 (100.0%) | 1,892 (100.0%) |
Monthly Housing Cost Tiers in Rochester
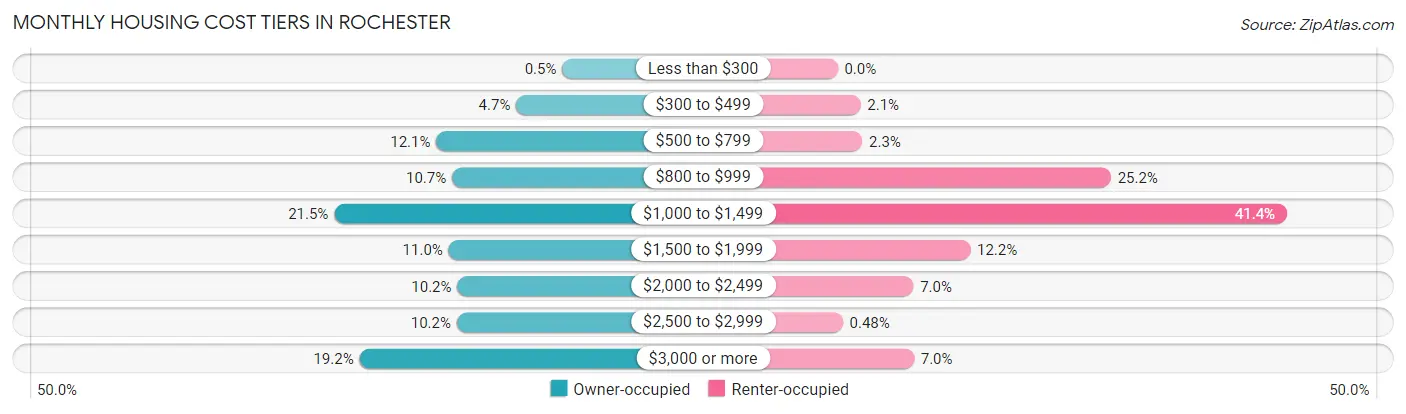
| Monthly Cost | Owner-occupied | Renter-occupied |
| Less than $300 | 18 (0.5%) | 0 (0.0%) |
| $300 to $499 | 171 (4.7%) | 40 (2.1%) |
| $500 to $799 | 436 (12.1%) | 43 (2.3%) |
| $800 to $999 | 384 (10.6%) | 476 (25.2%) |
| $1,000 to $1,499 | 775 (21.5%) | 783 (41.4%) |
| $1,500 to $1,999 | 395 (11.0%) | 231 (12.2%) |
| $2,000 to $2,499 | 366 (10.2%) | 132 (7.0%) |
| $2,500 to $2,999 | 368 (10.2%) | 9 (0.5%) |
| $3,000 or more | 691 (19.2%) | 133 (7.0%) |
| Total | 3,604 (100.0%) | 1,892 (100.0%) |
Physical Housing Characteristics in Rochester
Housing Structures in Rochester
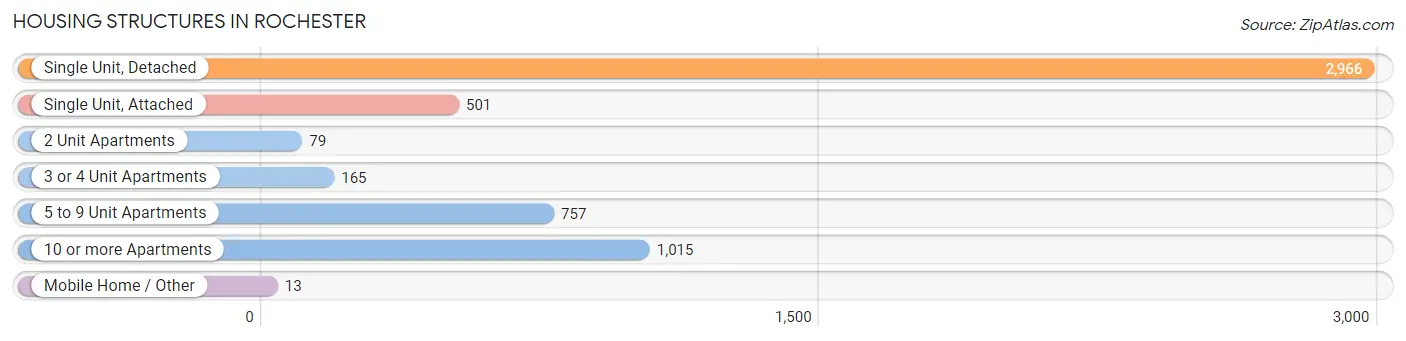
| Structure Type | # Housing Units | % Housing Units |
| Single Unit, Detached | 2,966 | 54.0% |
| Single Unit, Attached | 501 | 9.1% |
| 2 Unit Apartments | 79 | 1.4% |
| 3 or 4 Unit Apartments | 165 | 3.0% |
| 5 to 9 Unit Apartments | 757 | 13.8% |
| 10 or more Apartments | 1,015 | 18.5% |
| Mobile Home / Other | 13 | 0.2% |
| Total | 5,496 | 100.0% |
Housing Structures by Occupancy in Rochester
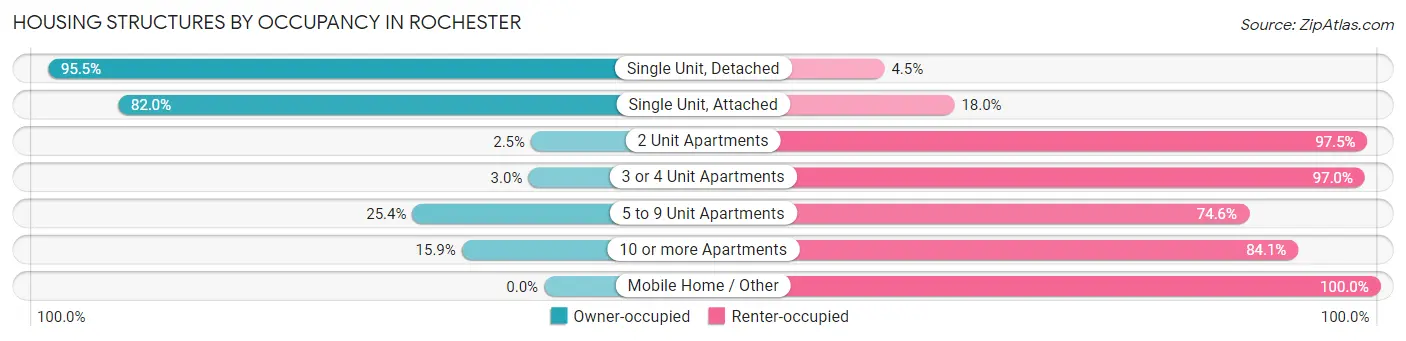
| Structure Type | Owner-occupied | Renter-occupied |
| Single Unit, Detached | 2,833 (95.5%) | 133 (4.5%) |
| Single Unit, Attached | 411 (82.0%) | 90 (18.0%) |
| 2 Unit Apartments | 2 (2.5%) | 77 (97.5%) |
| 3 or 4 Unit Apartments | 5 (3.0%) | 160 (97.0%) |
| 5 to 9 Unit Apartments | 192 (25.4%) | 565 (74.6%) |
| 10 or more Apartments | 161 (15.9%) | 854 (84.1%) |
| Mobile Home / Other | 0 (0.0%) | 13 (100.0%) |
| Total | 3,604 (65.6%) | 1,892 (34.4%) |
Housing Structures by Number of Rooms in Rochester
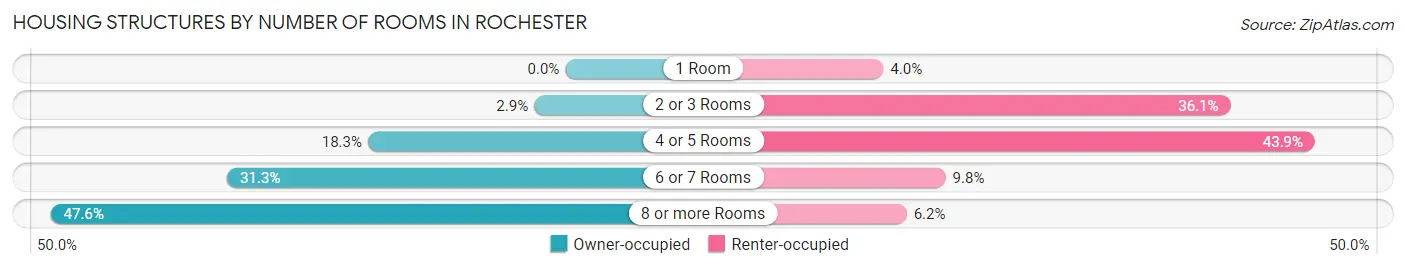
| Number of Rooms | Owner-occupied | Renter-occupied |
| 1 Room | 0 (0.0%) | 76 (4.0%) |
| 2 or 3 Rooms | 104 (2.9%) | 683 (36.1%) |
| 4 or 5 Rooms | 658 (18.3%) | 831 (43.9%) |
| 6 or 7 Rooms | 1,127 (31.3%) | 185 (9.8%) |
| 8 or more Rooms | 1,715 (47.6%) | 117 (6.2%) |
| Total | 3,604 (100.0%) | 1,892 (100.0%) |
Housing Structure by Heating Type in Rochester
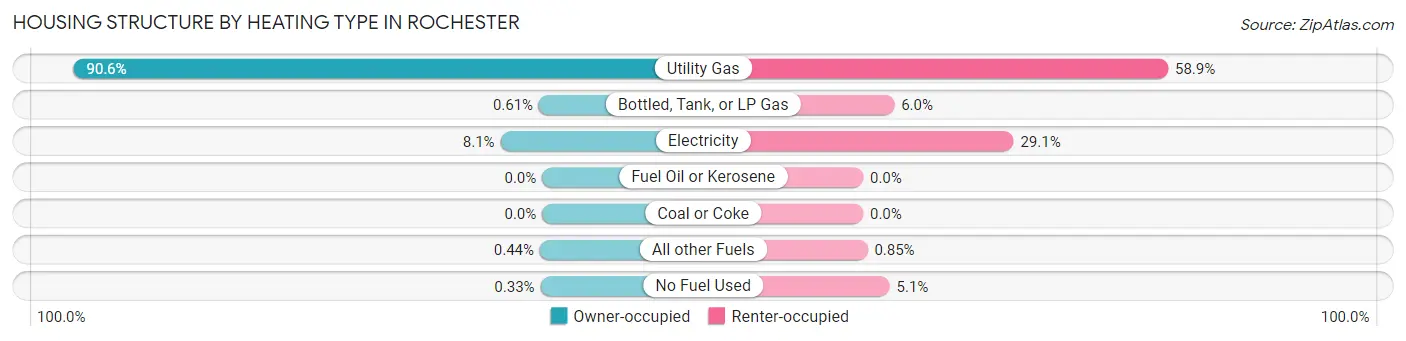
| Heating Type | Owner-occupied | Renter-occupied |
| Utility Gas | 3,264 (90.6%) | 1,115 (58.9%) |
| Bottled, Tank, or LP Gas | 22 (0.6%) | 114 (6.0%) |
| Electricity | 290 (8.1%) | 550 (29.1%) |
| Fuel Oil or Kerosene | 0 (0.0%) | 0 (0.0%) |
| Coal or Coke | 0 (0.0%) | 0 (0.0%) |
| All other Fuels | 16 (0.4%) | 16 (0.9%) |
| No Fuel Used | 12 (0.3%) | 97 (5.1%) |
| Total | 3,604 (100.0%) | 1,892 (100.0%) |
Household Vehicle Usage in Rochester
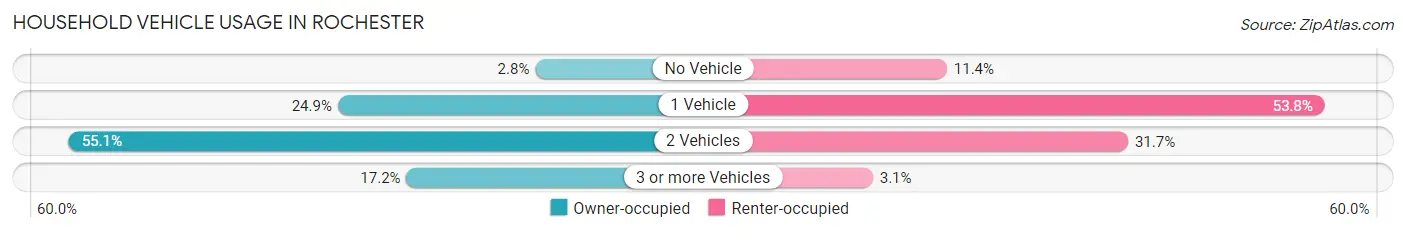
| Vehicles per Household | Owner-occupied | Renter-occupied |
| No Vehicle | 101 (2.8%) | 216 (11.4%) |
| 1 Vehicle | 898 (24.9%) | 1,017 (53.7%) |
| 2 Vehicles | 1,984 (55.0%) | 600 (31.7%) |
| 3 or more Vehicles | 621 (17.2%) | 59 (3.1%) |
| Total | 3,604 (100.0%) | 1,892 (100.0%) |
Real Estate & Mortgages in Rochester
Real Estate and Mortgage Overview in Rochester
| Characteristic | Without Mortgage | With Mortgage |
| Housing Units | 1,354 | 2,250 |
| Median Property Value | $446,400 | $448,800 |
| Median Household Income | $130,357 | $1,194 |
| Monthly Housing Costs | $888 | $691 |
| Real Estate Taxes | $5,549 | $0 |
Property Value by Mortgage Status in Rochester
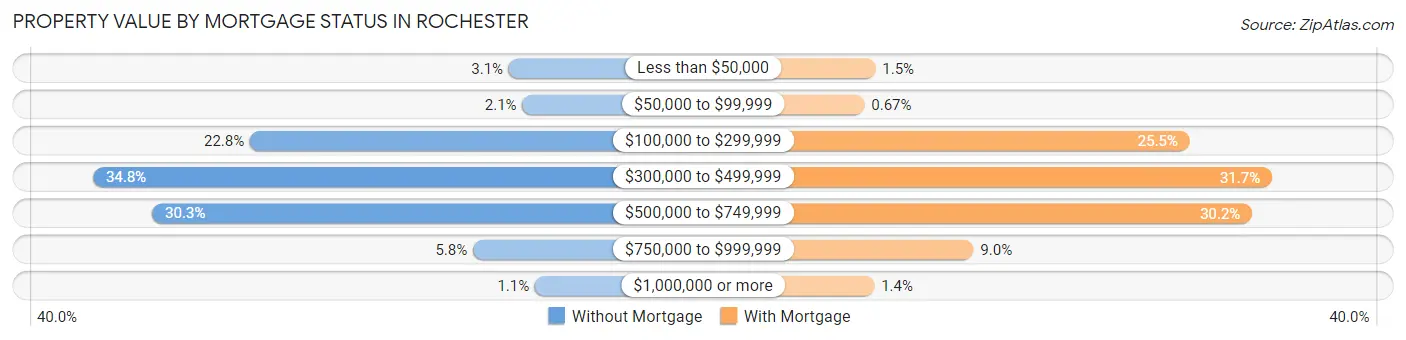
| Property Value | Without Mortgage | With Mortgage |
| Less than $50,000 | 42 (3.1%) | 34 (1.5%) |
| $50,000 to $99,999 | 28 (2.1%) | 15 (0.7%) |
| $100,000 to $299,999 | 309 (22.8%) | 573 (25.5%) |
| $300,000 to $499,999 | 471 (34.8%) | 714 (31.7%) |
| $500,000 to $749,999 | 410 (30.3%) | 680 (30.2%) |
| $750,000 to $999,999 | 79 (5.8%) | 202 (9.0%) |
| $1,000,000 or more | 15 (1.1%) | 32 (1.4%) |
| Total | 1,354 (100.0%) | 2,250 (100.0%) |
Household Income by Mortgage Status in Rochester
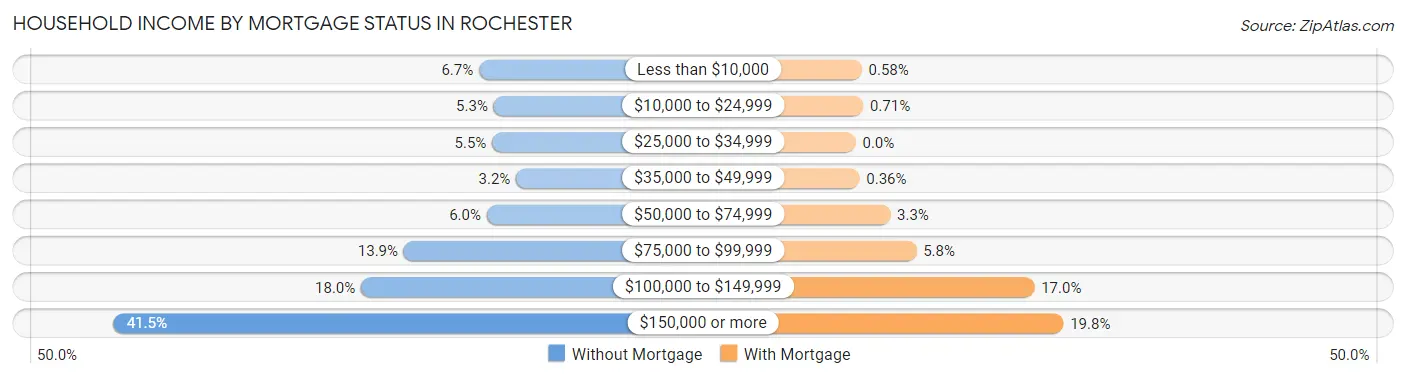
| Household Income | Without Mortgage | With Mortgage |
| Less than $10,000 | 91 (6.7%) | 13 (0.6%) |
| $10,000 to $24,999 | 72 (5.3%) | 16 (0.7%) |
| $25,000 to $34,999 | 74 (5.5%) | 0 (0.0%) |
| $35,000 to $49,999 | 43 (3.2%) | 8 (0.4%) |
| $50,000 to $74,999 | 81 (6.0%) | 74 (3.3%) |
| $75,000 to $99,999 | 188 (13.9%) | 130 (5.8%) |
| $100,000 to $149,999 | 243 (17.9%) | 383 (17.0%) |
| $150,000 or more | 562 (41.5%) | 445 (19.8%) |
| Total | 1,354 (100.0%) | 2,250 (100.0%) |
Property Value to Household Income Ratio in Rochester
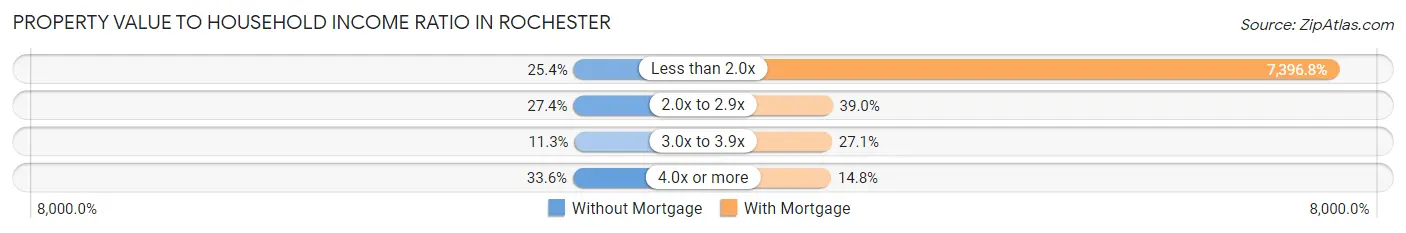
| Value-to-Income Ratio | Without Mortgage | With Mortgage |
| Less than 2.0x | 344 (25.4%) | 166,429 (7,396.8%) |
| 2.0x to 2.9x | 371 (27.4%) | 877 (39.0%) |
| 3.0x to 3.9x | 153 (11.3%) | 609 (27.1%) |
| 4.0x or more | 455 (33.6%) | 332 (14.8%) |
| Total | 1,354 (100.0%) | 2,250 (100.0%) |
Real Estate Taxes by Mortgage Status in Rochester
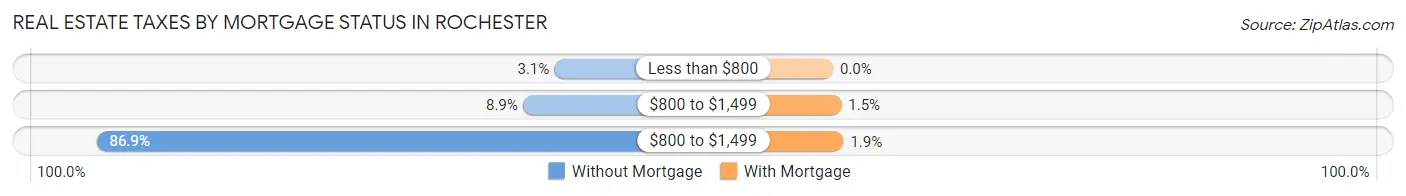
| Property Taxes | Without Mortgage | With Mortgage |
| Less than $800 | 42 (3.1%) | 0 (0.0%) |
| $800 to $1,499 | 120 (8.9%) | 34 (1.5%) |
| $800 to $1,499 | 1,176 (86.9%) | 43 (1.9%) |
| Total | 1,354 (100.0%) | 2,250 (100.0%) |
Health & Disability in Rochester
Health Insurance Coverage by Age in Rochester
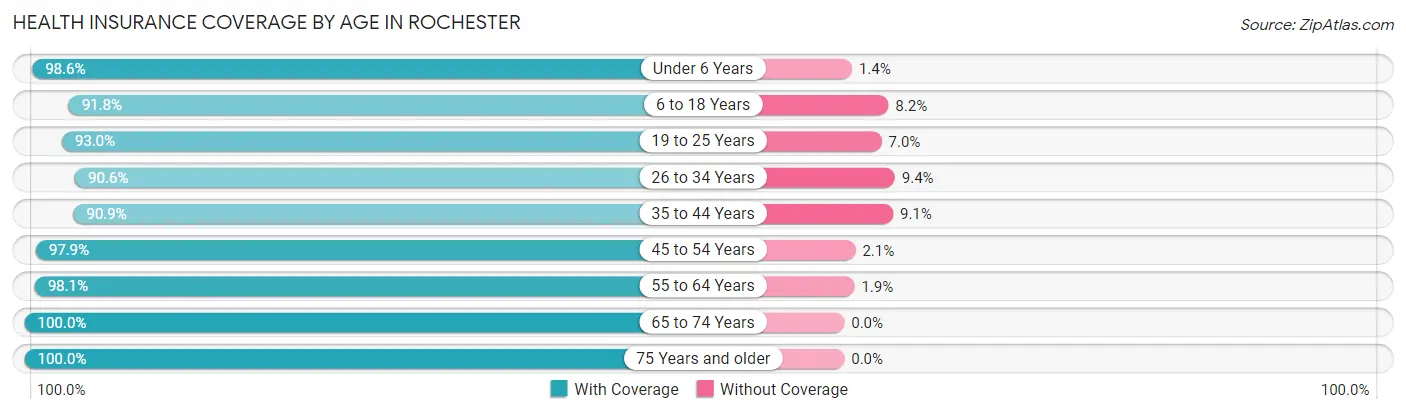
| Age Bracket | With Coverage | Without Coverage |
| Under 6 Years | 893 (98.6%) | 13 (1.4%) |
| 6 to 18 Years | 1,939 (91.8%) | 174 (8.2%) |
| 19 to 25 Years | 1,109 (93.0%) | 83 (7.0%) |
| 26 to 34 Years | 1,375 (90.6%) | 143 (9.4%) |
| 35 to 44 Years | 1,480 (90.9%) | 148 (9.1%) |
| 45 to 54 Years | 1,917 (97.9%) | 41 (2.1%) |
| 55 to 64 Years | 1,753 (98.1%) | 34 (1.9%) |
| 65 to 74 Years | 1,055 (100.0%) | 0 (0.0%) |
| 75 Years and older | 749 (100.0%) | 0 (0.0%) |
| Total | 12,270 (95.1%) | 636 (4.9%) |
Health Insurance Coverage by Citizenship Status in Rochester
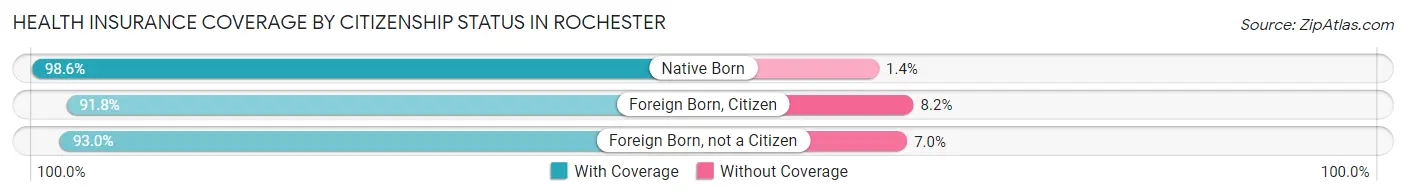
| Citizenship Status | With Coverage | Without Coverage |
| Native Born | 893 (98.6%) | 13 (1.4%) |
| Foreign Born, Citizen | 1,939 (91.8%) | 174 (8.2%) |
| Foreign Born, not a Citizen | 1,109 (93.0%) | 83 (7.0%) |
Health Insurance Coverage by Household Income in Rochester
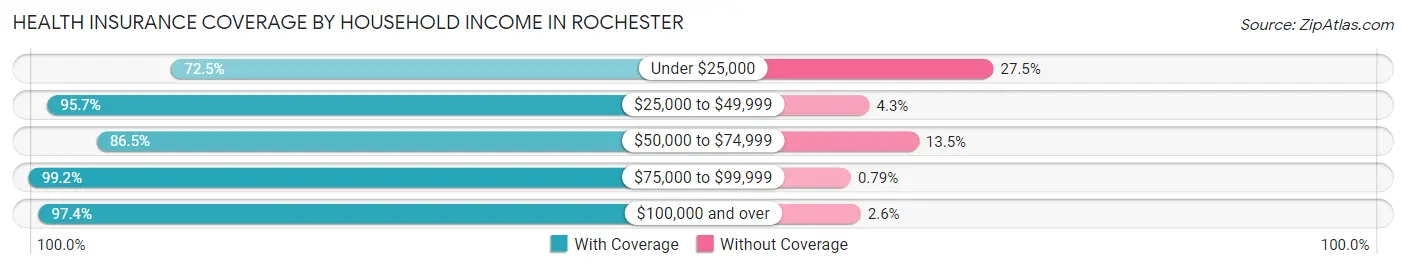
| Household Income | With Coverage | Without Coverage |
| Under $25,000 | 543 (72.5%) | 206 (27.5%) |
| $25,000 to $49,999 | 942 (95.7%) | 42 (4.3%) |
| $50,000 to $74,999 | 1,024 (86.5%) | 160 (13.5%) |
| $75,000 to $99,999 | 1,874 (99.2%) | 15 (0.8%) |
| $100,000 and over | 7,887 (97.4%) | 213 (2.6%) |
Public vs Private Health Insurance Coverage by Age in Rochester
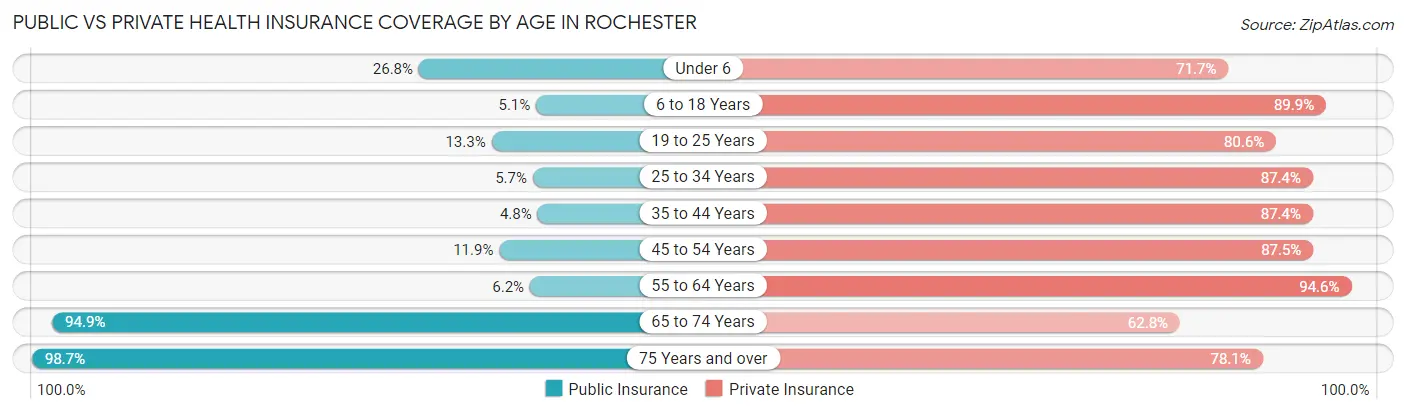
| Age Bracket | Public Insurance | Private Insurance |
| Under 6 | 243 (26.8%) | 650 (71.7%) |
| 6 to 18 Years | 107 (5.1%) | 1,899 (89.9%) |
| 19 to 25 Years | 159 (13.3%) | 961 (80.6%) |
| 25 to 34 Years | 86 (5.7%) | 1,327 (87.4%) |
| 35 to 44 Years | 78 (4.8%) | 1,423 (87.4%) |
| 45 to 54 Years | 233 (11.9%) | 1,713 (87.5%) |
| 55 to 64 Years | 111 (6.2%) | 1,690 (94.6%) |
| 65 to 74 Years | 1,001 (94.9%) | 662 (62.7%) |
| 75 Years and over | 739 (98.7%) | 585 (78.1%) |
| Total | 2,757 (21.4%) | 10,910 (84.5%) |
Disability Status by Sex by Age in Rochester
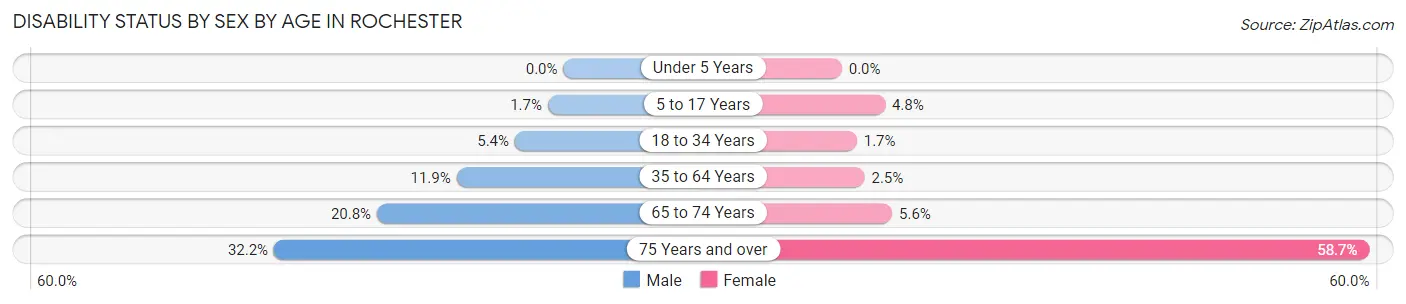
| Age Bracket | Male | Female |
| Under 5 Years | 0 (0.0%) | 0 (0.0%) |
| 5 to 17 Years | 19 (1.7%) | 49 (4.8%) |
| 18 to 34 Years | 82 (5.4%) | 22 (1.7%) |
| 35 to 64 Years | 295 (11.9%) | 73 (2.5%) |
| 65 to 74 Years | 104 (20.8%) | 31 (5.6%) |
| 75 Years and over | 68 (32.2%) | 316 (58.7%) |
Disability Class by Sex by Age in Rochester
Disability Class: Hearing Difficulty
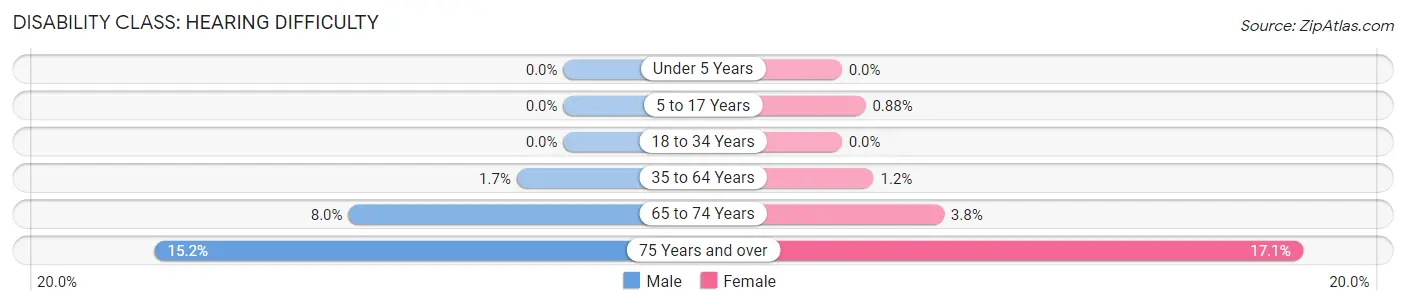
| Age Bracket | Male | Female |
| Under 5 Years | 0 (0.0%) | 0 (0.0%) |
| 5 to 17 Years | 0 (0.0%) | 9 (0.9%) |
| 18 to 34 Years | 0 (0.0%) | 0 (0.0%) |
| 35 to 64 Years | 43 (1.7%) | 34 (1.2%) |
| 65 to 74 Years | 40 (8.0%) | 21 (3.8%) |
| 75 Years and over | 32 (15.2%) | 92 (17.1%) |
Disability Class: Vision Difficulty
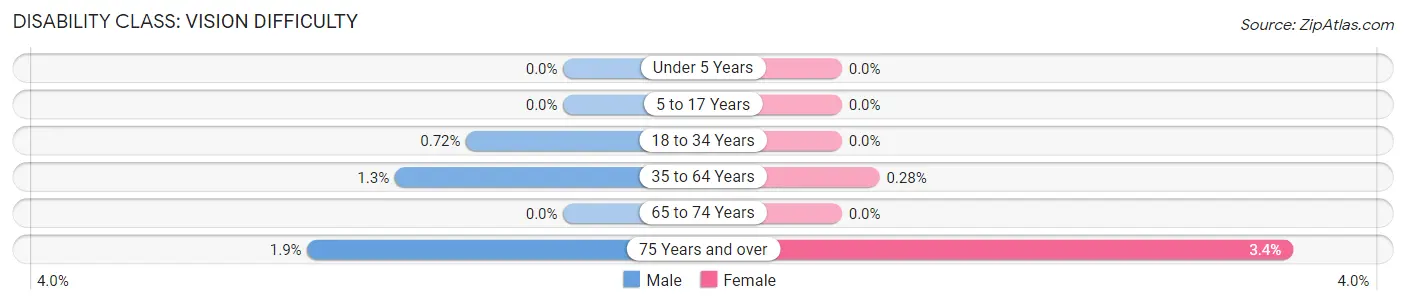
| Age Bracket | Male | Female |
| Under 5 Years | 0 (0.0%) | 0 (0.0%) |
| 5 to 17 Years | 0 (0.0%) | 0 (0.0%) |
| 18 to 34 Years | 11 (0.7%) | 0 (0.0%) |
| 35 to 64 Years | 31 (1.3%) | 8 (0.3%) |
| 65 to 74 Years | 0 (0.0%) | 0 (0.0%) |
| 75 Years and over | 4 (1.9%) | 18 (3.4%) |
Disability Class: Cognitive Difficulty
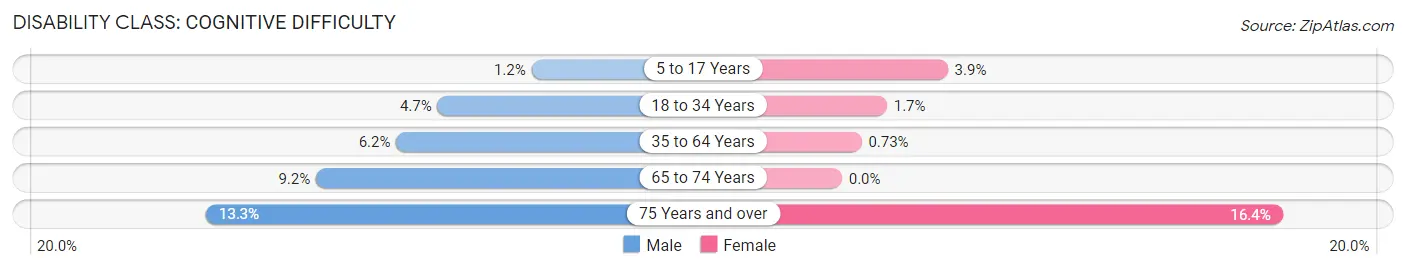
| Age Bracket | Male | Female |
| 5 to 17 Years | 13 (1.2%) | 40 (3.9%) |
| 18 to 34 Years | 71 (4.7%) | 22 (1.7%) |
| 35 to 64 Years | 154 (6.2%) | 21 (0.7%) |
| 65 to 74 Years | 46 (9.2%) | 0 (0.0%) |
| 75 Years and over | 28 (13.3%) | 88 (16.4%) |
Disability Class: Ambulatory Difficulty
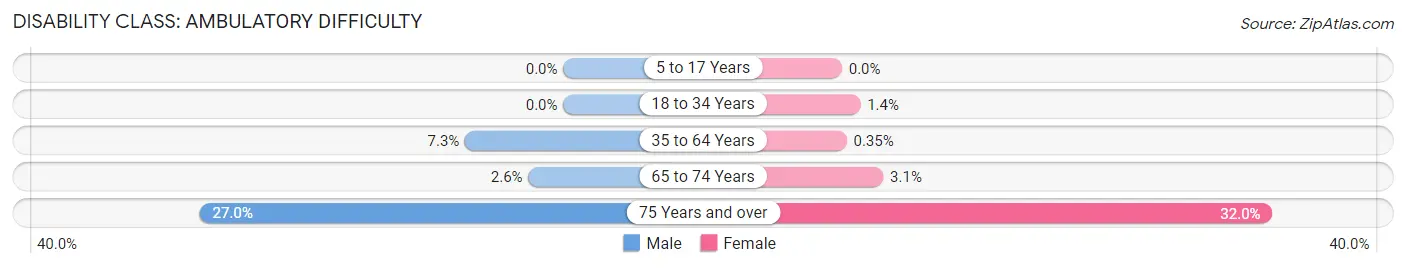
| Age Bracket | Male | Female |
| 5 to 17 Years | 0 (0.0%) | 0 (0.0%) |
| 18 to 34 Years | 0 (0.0%) | 18 (1.4%) |
| 35 to 64 Years | 181 (7.3%) | 10 (0.4%) |
| 65 to 74 Years | 13 (2.6%) | 17 (3.1%) |
| 75 Years and over | 57 (27.0%) | 172 (32.0%) |
Disability Class: Self-Care Difficulty
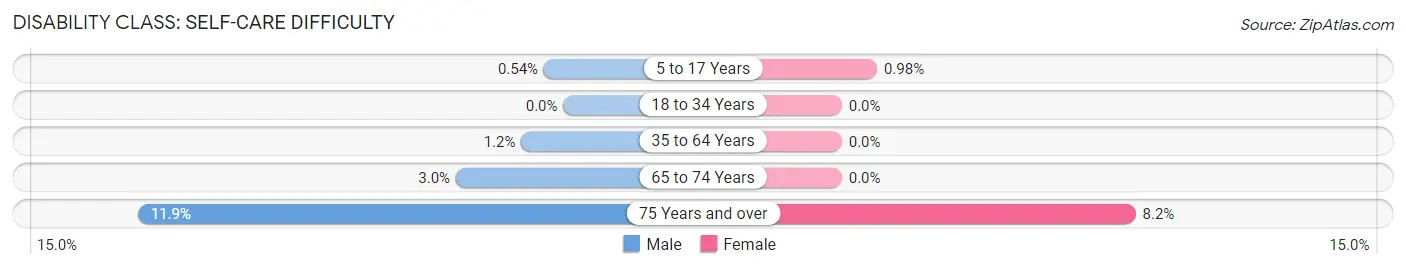
| Age Bracket | Male | Female |
| 5 to 17 Years | 6 (0.5%) | 10 (1.0%) |
| 18 to 34 Years | 0 (0.0%) | 0 (0.0%) |
| 35 to 64 Years | 29 (1.2%) | 0 (0.0%) |
| 65 to 74 Years | 15 (3.0%) | 0 (0.0%) |
| 75 Years and over | 25 (11.8%) | 44 (8.2%) |
Technology Access in Rochester
Computing Device Access in Rochester
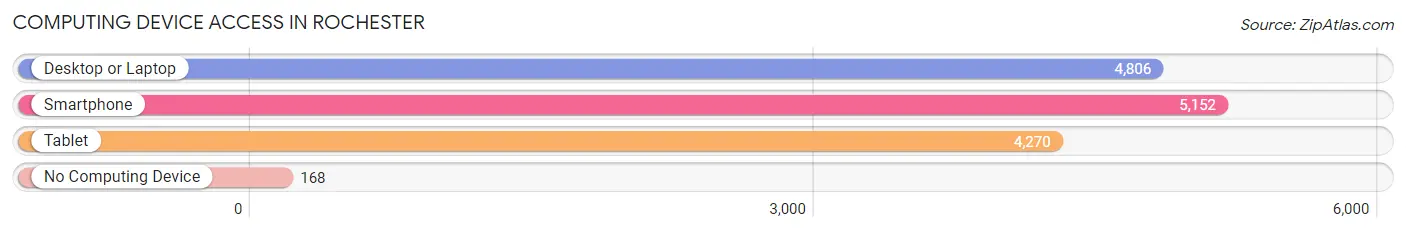
| Device Type | # Households | % Households |
| Desktop or Laptop | 4,806 | 87.5% |
| Smartphone | 5,152 | 93.7% |
| Tablet | 4,270 | 77.7% |
| No Computing Device | 168 | 3.1% |
| Total | 5,496 | 100.0% |
Internet Access in Rochester
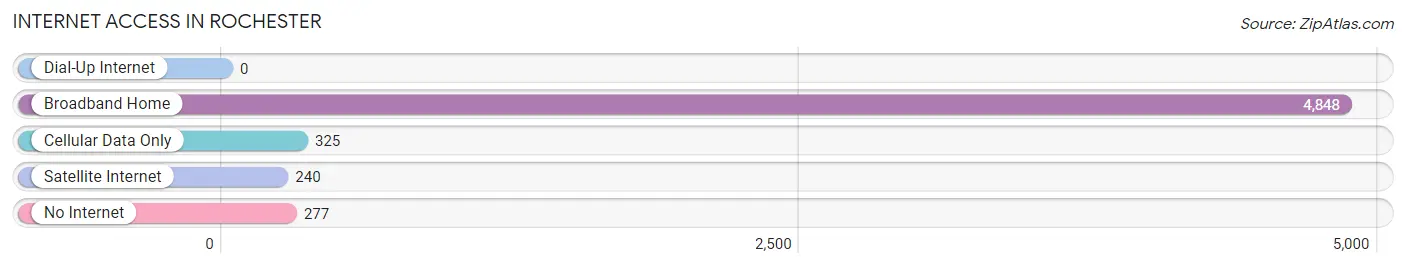
| Internet Type | # Households | % Households |
| Dial-Up Internet | 0 | 0.0% |
| Broadband Home | 4,848 | 88.2% |
| Cellular Data Only | 325 | 5.9% |
| Satellite Internet | 240 | 4.4% |
| No Internet | 277 | 5.0% |
| Total | 5,496 | 100.0% |
Rochester Summary
Rochester, Michigan is a city located in Oakland County, Michigan, United States. It is a suburb of Detroit and is part of the Metro Detroit area. The city is situated on the northern edge of the county, along the Clinton River. As of the 2010 census, the city had a population of 12,711.
History
Rochester was first settled in 1817 by James Graham, a veteran of the War of 1812. He purchased land from the government and built a log cabin on the banks of the Clinton River. The area was originally known as Graham’s Corners, but was later renamed Rochester in 1837. The name was chosen in honor of Rochester, New York, which was the hometown of many of the early settlers.
In 1848, the first post office was established in Rochester. The city was incorporated in 1869 and was officially recognized as a village in 1873. The village was reincorporated as a city in 1955.
Geography
Rochester is located at 42°41'N 83°10'W (42.68, -83.17). According to the United States Census Bureau, the city has a total area of 4.2 square miles (10.8 km2), all land.
The city is situated on the northern edge of Oakland County, along the Clinton River. It is bordered by the cities of Auburn Hills to the north, Troy to the east, and Rochester Hills to the south.
Economy
Rochester’s economy is largely based on the service industry. The city is home to several large employers, including St. John Providence Health System, Rochester College, and Oakland University.
The city is also home to several small businesses, including restaurants, retail stores, and professional services. The city’s downtown area is home to several unique shops and restaurants.
Demographics
As of the 2010 census, there were 12,711 people, 5,093 households, and 3,072 families residing in the city. The population density was 3,039.2 people per square mile (1,174.2/km2). There were 5,541 housing units at an average density of 1,323.2 per square mile (510.7/km2). The racial makeup of the city was 87.2% White, 5.3% African American, 0.3% Native American, 3.2% Asian, 0.1% Pacific Islander, 1.3% from other races, and 2.7% from two or more races. Hispanic or Latino of any race were 4.2% of the population.
There were 5,093 households, out of which 28.2% had children under the age of 18 living with them, 44.2% were married couples living together, 11.7% had a female householder with no husband present, and 39.3% were non-families. 32.2% of all households were made up of individuals, and 8.7% had someone living alone who was 65 years of age or older. The average household size was 2.39 and the average family size was 3.06.
In the city, the population was spread out, with 22.7% under the age of 18, 14.2% from 18 to 24, 28.3% from 25 to 44, 22.7% from 45 to 64, and 12.1% who were 65 years of age or older. The median age was 34 years. For every 100 females, there were 92.2 males. For every 100 females age 18 and over, there were 88.7 males.
The median income for a household in the city was $50,945, and the median income for a family was $63,945. Males had a median income of $45,945 versus $35,945 for females. The per capita income for the city was $25,945. About 4.2% of families and 7.2% of the population were below the poverty line, including 8.2% of those under age 18 and 5.2% of those age 65 or over.
Common Questions
What is Per Capita Income in Rochester?
Per Capita income in Rochester is $66,022.
What is the Median Family Income in Rochester?
Median Family Income in Rochester is $173,299.
What is the Median Household income in Rochester?
Median Household Income in Rochester is $102,838.
What is Income or Wage Gap in Rochester?
Income or Wage Gap in Rochester is 33.9%.
Women in Rochester earn 66.1 cents for every dollar earned by a man.
What is Inequality or Gini Index in Rochester?
Inequality or Gini Index in Rochester is 0.47.
What is the Total Population of Rochester?
Total Population of Rochester is 12,978.
What is the Total Male Population of Rochester?
Total Male Population of Rochester is 6,199.
What is the Total Female Population of Rochester?
Total Female Population of Rochester is 6,779.
What is the Ratio of Males per 100 Females in Rochester?
There are 91.44 Males per 100 Females in Rochester.
What is the Ratio of Females per 100 Males in Rochester?
There are 109.36 Females per 100 Males in Rochester.
What is the Median Population Age in Rochester?
Median Population Age in Rochester is 40.0 Years.
What is the Average Family Size in Rochester
Average Family Size in Rochester is 3.0 People.
What is the Average Household Size in Rochester
Average Household Size in Rochester is 2.4 People.
How Large is the Labor Force in Rochester?
There are 6,948 People in the Labor Forcein in Rochester.
What is the Percentage of People in the Labor Force in Rochester?
66.6% of People are in the Labor Force in Rochester.
What is the Unemployment Rate in Rochester?
Unemployment Rate in Rochester is 4.0%.