Grand Beach, MI Map & Demographics
Grand Beach Map
Grand Beach Overview
$79,777
PER CAPITA INCOME
$165,250
AVG FAMILY INCOME
$101,875
AVG HOUSEHOLD INCOME
0.50
INEQUALITY / GINI INDEX
377
TOTAL POPULATION
204
MALE POPULATION
173
FEMALE POPULATION
117.92
MALES / 100 FEMALES
84.80
FEMALES / 100 MALES
64.8
MEDIAN AGE
2.5
AVG FAMILY SIZE
1.8
AVG HOUSEHOLD SIZE
122
LABOR FORCE [ PEOPLE ]
34.9%
PERCENT IN LABOR FORCE
2.5%
UNEMPLOYMENT RATE
Grand Beach Area Codes
Income in Grand Beach
Income Overview in Grand Beach
Per Capita Income in Grand Beach is $79,777, while median incomes of families and households are $165,250 and $101,875 respectively.
| Characteristic | Number | Measure |
| Per Capita Income | 377 | $79,777 |
| Median Family Income | 115 | $165,250 |
| Mean Family Income | 115 | $206,183 |
| Median Household Income | 209 | $101,875 |
| Mean Household Income | 209 | $141,386 |
| Income Deficit | 115 | $0 |
| Wage / Income Gap (%) | 377 | 0.00% |
| Wage / Income Gap ($) | 377 | 100.00¢ per $1 |
| Gini / Inequality Index | 377 | 0.50 |
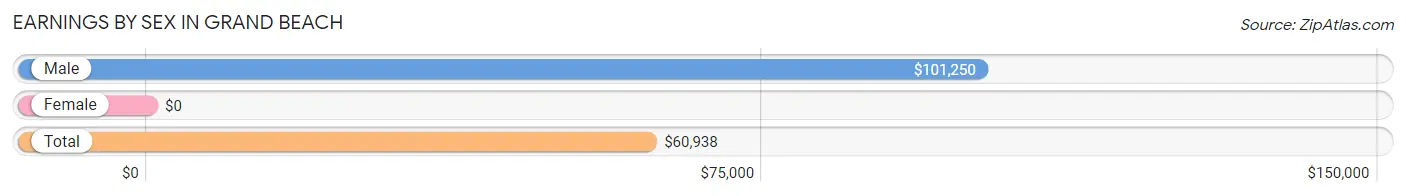
Earnings by Sex in Grand Beach
| Sex | Number | Average Earnings |
| Male | 85 (59.4%) | $101,250 |
| Female | 58 (40.6%) | $0 |
| Total | 143 (100.0%) | $60,938 |
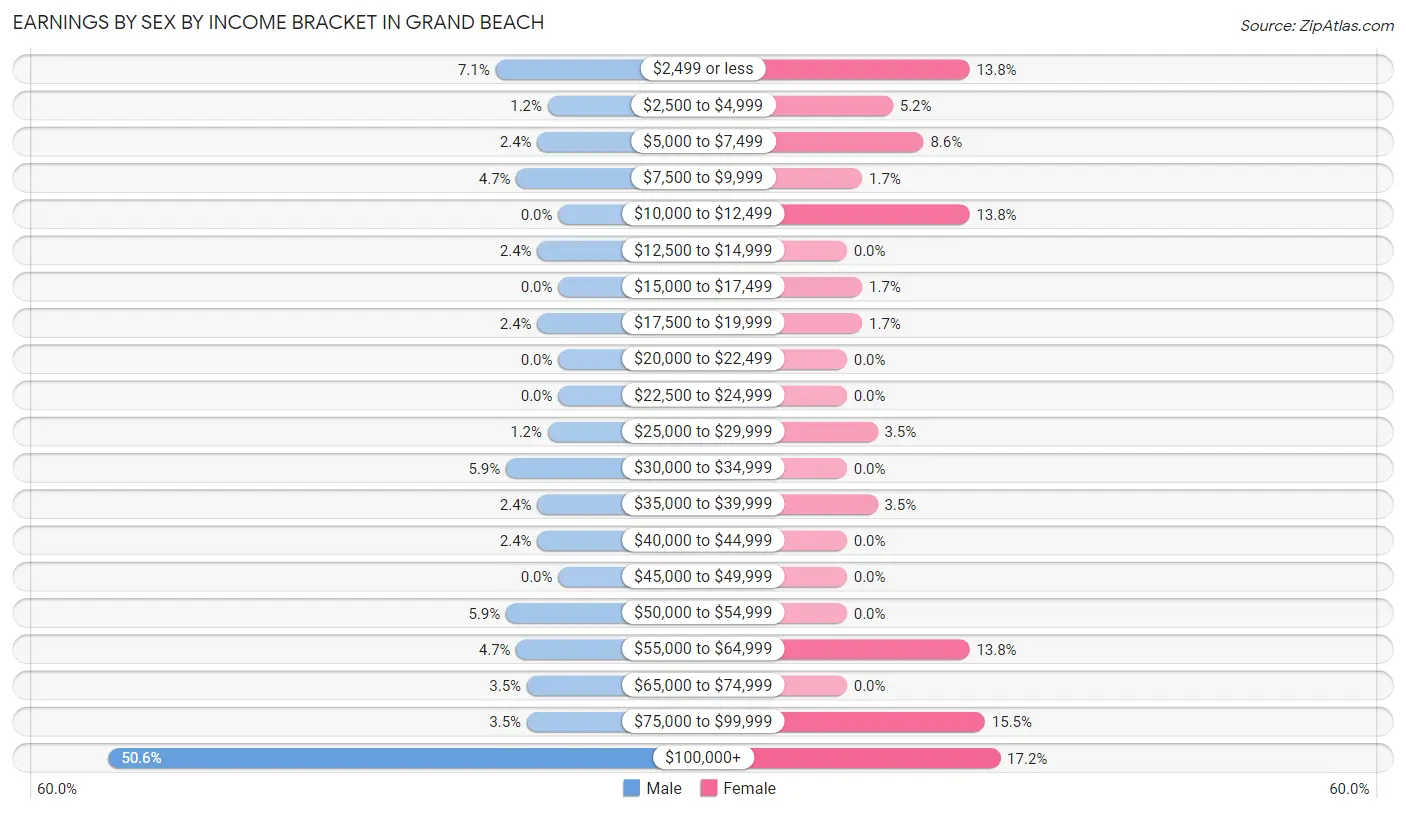
Earnings by Sex by Income Bracket in Grand Beach
The most common earnings brackets in Grand Beach are $100,000+ for men (43 | 50.6%) and $100,000+ for women (10 | 17.2%).
| Income | Male | Female |
| $2,499 or less | 6 (7.1%) | 8 (13.8%) |
| $2,500 to $4,999 | 1 (1.2%) | 3 (5.2%) |
| $5,000 to $7,499 | 2 (2.4%) | 5 (8.6%) |
| $7,500 to $9,999 | 4 (4.7%) | 1 (1.7%) |
| $10,000 to $12,499 | 0 (0.0%) | 8 (13.8%) |
| $12,500 to $14,999 | 2 (2.4%) | 0 (0.0%) |
| $15,000 to $17,499 | 0 (0.0%) | 1 (1.7%) |
| $17,500 to $19,999 | 2 (2.4%) | 1 (1.7%) |
| $20,000 to $22,499 | 0 (0.0%) | 0 (0.0%) |
| $22,500 to $24,999 | 0 (0.0%) | 0 (0.0%) |
| $25,000 to $29,999 | 1 (1.2%) | 2 (3.5%) |
| $30,000 to $34,999 | 5 (5.9%) | 0 (0.0%) |
| $35,000 to $39,999 | 2 (2.4%) | 2 (3.5%) |
| $40,000 to $44,999 | 2 (2.4%) | 0 (0.0%) |
| $45,000 to $49,999 | 0 (0.0%) | 0 (0.0%) |
| $50,000 to $54,999 | 5 (5.9%) | 0 (0.0%) |
| $55,000 to $64,999 | 4 (4.7%) | 8 (13.8%) |
| $65,000 to $74,999 | 3 (3.5%) | 0 (0.0%) |
| $75,000 to $99,999 | 3 (3.5%) | 9 (15.5%) |
| $100,000+ | 43 (50.6%) | 10 (17.2%) |
| Total | 85 (100.0%) | 58 (100.0%) |
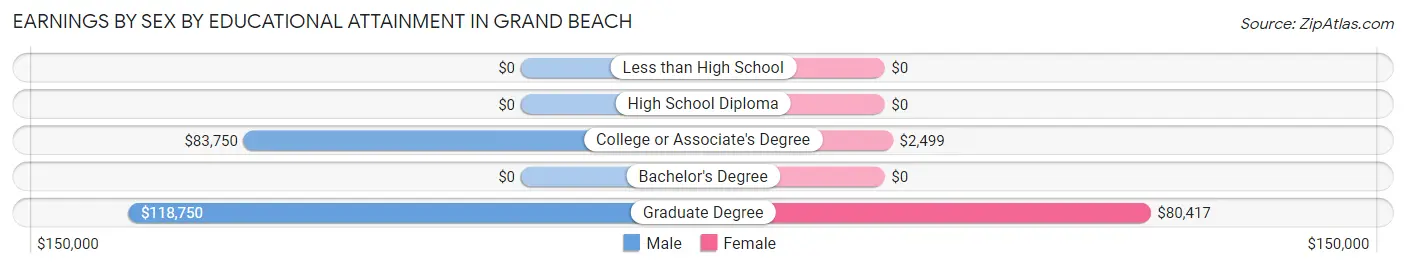
Earnings by Sex by Educational Attainment in Grand Beach
| Educational Attainment | Male Income | Female Income |
| Less than High School | - | - |
| High School Diploma | - | - |
| College or Associate's Degree | $83,750 | $2,499 |
| Bachelor's Degree | - | - |
| Graduate Degree | $118,750 | $80,417 |
| Total | $106,250 | $0 |
Family Income in Grand Beach
Family Income Brackets in Grand Beach
According to the Grand Beach family income data, there are 44 families falling into the $200,000+ income range, which is the most common income bracket and makes up 38.3% of all families.
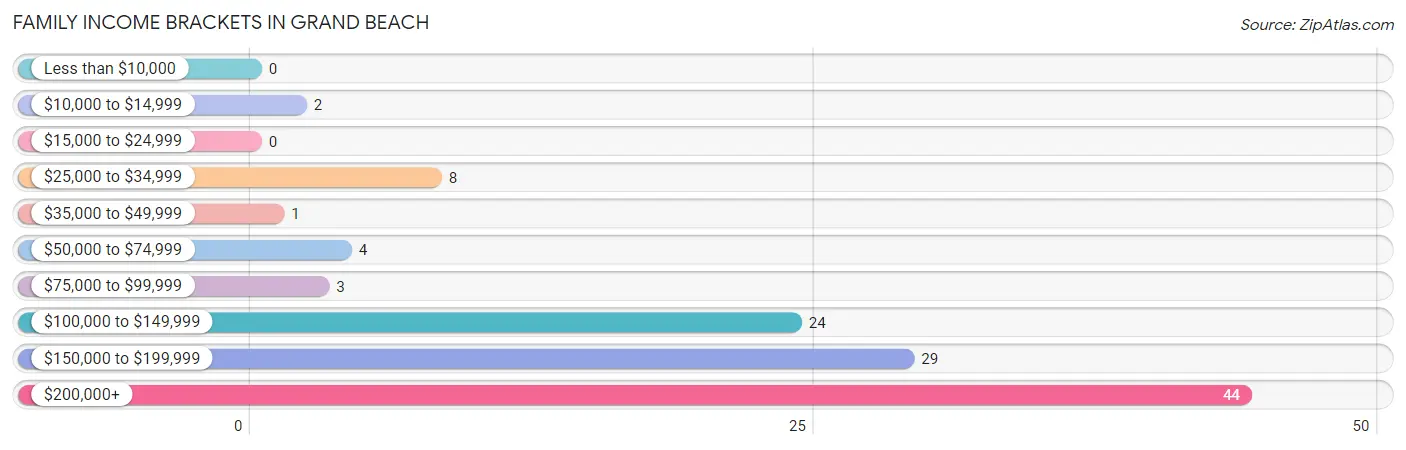
| Income Bracket | # Families | % Families |
| Less than $10,000 | 0 | 0.0% |
| $10,000 to $14,999 | 2 | 1.7% |
| $15,000 to $24,999 | 0 | 0.0% |
| $25,000 to $34,999 | 8 | 7.0% |
| $35,000 to $49,999 | 1 | 0.9% |
| $50,000 to $74,999 | 4 | 3.5% |
| $75,000 to $99,999 | 3 | 2.6% |
| $100,000 to $149,999 | 24 | 20.9% |
| $150,000 to $199,999 | 29 | 25.2% |
| $200,000+ | 44 | 38.3% |
Family Income by Famaliy Size in Grand Beach
3-person families (16 | 13.9%) account for the highest median family income in Grand Beach with $250,001 per family, while 3-person families (16 | 13.9%) have the highest median income of $83,334 per family member.
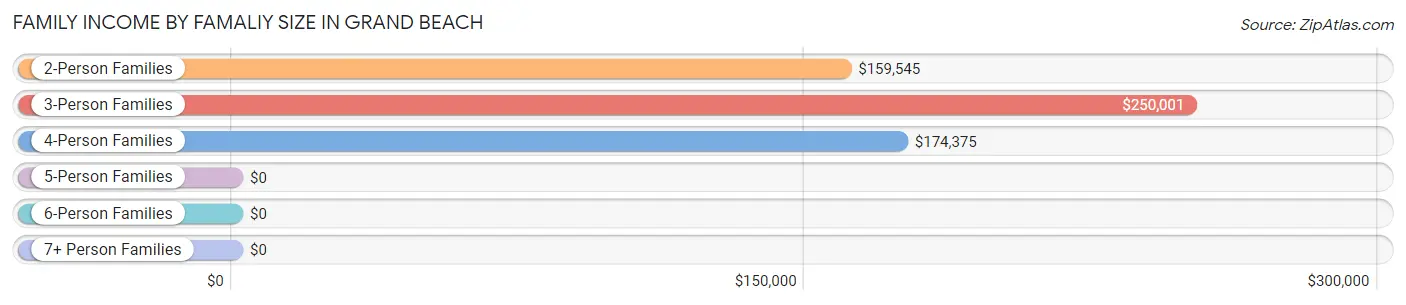
| Income Bracket | # Families | Median Income |
| 2-Person Families | 82 (71.3%) | $159,545 |
| 3-Person Families | 16 (13.9%) | $250,001 |
| 4-Person Families | 13 (11.3%) | $174,375 |
| 5-Person Families | 3 (2.6%) | $0 |
| 6-Person Families | 0 (0.0%) | $0 |
| 7+ Person Families | 1 (0.9%) | $0 |
| Total | 115 (100.0%) | $165,250 |
Family Income by Number of Earners in Grand Beach
The median family income in Grand Beach is $165,250, with families comprising 3+ earners (5) having the highest median family income of $238,750, while families with no earners (28) have the lowest median family income of $130,000, accounting for 4.3% and 24.3% of families, respectively.
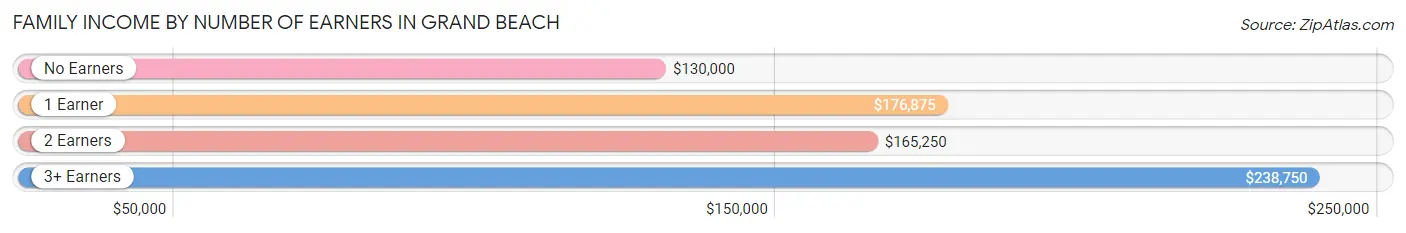
| Number of Earners | # Families | Median Income |
| No Earners | 28 (24.3%) | $130,000 |
| 1 Earner | 53 (46.1%) | $176,875 |
| 2 Earners | 29 (25.2%) | $165,250 |
| 3+ Earners | 5 (4.3%) | $238,750 |
| Total | 115 (100.0%) | $165,250 |
Household Income in Grand Beach
Household Income Brackets in Grand Beach
With 48 households falling in the category, the $200,000+ income range is the most frequent in Grand Beach, accounting for 23.0% of all households.
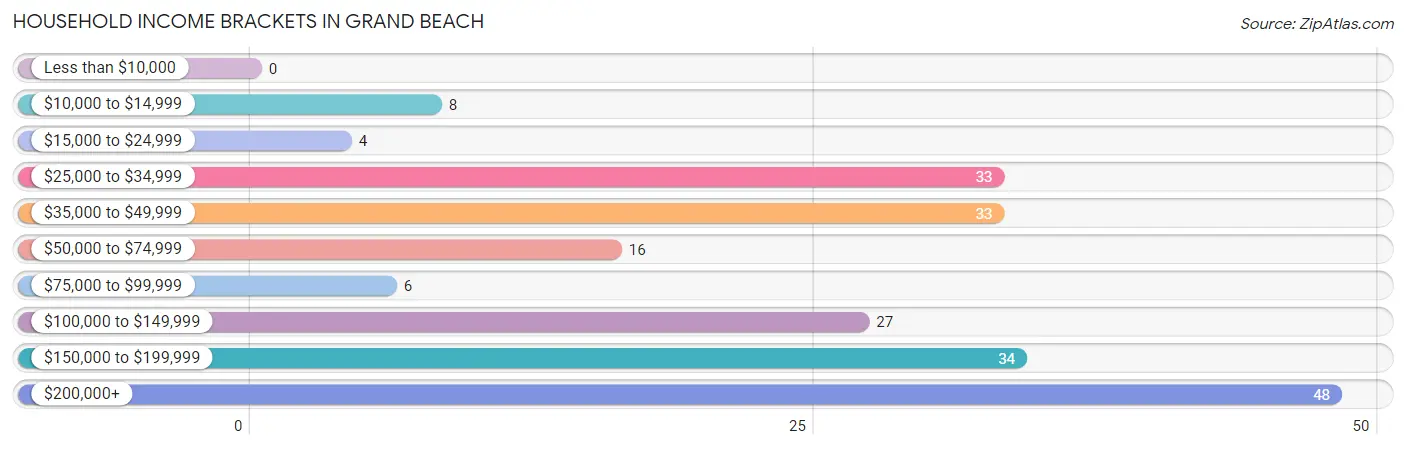
| Income Bracket | # Households | % Households |
| Less than $10,000 | 0 | 0.0% |
| $10,000 to $14,999 | 8 | 3.8% |
| $15,000 to $24,999 | 4 | 1.9% |
| $25,000 to $34,999 | 33 | 15.8% |
| $35,000 to $49,999 | 33 | 15.8% |
| $50,000 to $74,999 | 16 | 7.7% |
| $75,000 to $99,999 | 6 | 2.9% |
| $100,000 to $149,999 | 27 | 12.9% |
| $150,000 to $199,999 | 34 | 16.3% |
| $200,000+ | 48 | 23.0% |
Household Income by Householder Age in Grand Beach
The median household income in Grand Beach is $101,875, with the highest median household income of $121,250 found in the 45 to 64 years age bracket for the primary householder. A total of 66 households (31.6%) fall into this category.
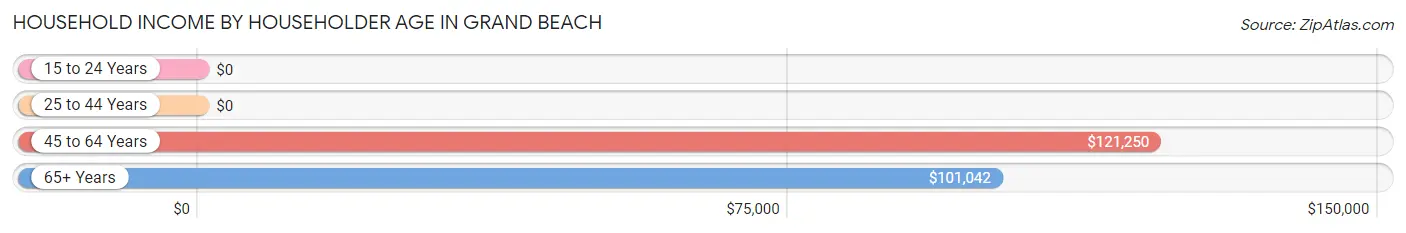
| Income Bracket | # Households | Median Income |
| 15 to 24 Years | 0 (0.0%) | $0 |
| 25 to 44 Years | 8 (3.8%) | $0 |
| 45 to 64 Years | 66 (31.6%) | $121,250 |
| 65+ Years | 135 (64.6%) | $101,042 |
| Total | 209 (100.0%) | $101,875 |
Poverty in Grand Beach
Income Below Poverty by Sex and Age in Grand Beach
With 1.0% poverty level for males and 2.3% for females among the residents of Grand Beach, 18 to 24 year old males and 75 year old and over females are the most vulnerable to poverty, with 1 males (100.0%) and 2 females (6.5%) in their respective age groups living below the poverty level.
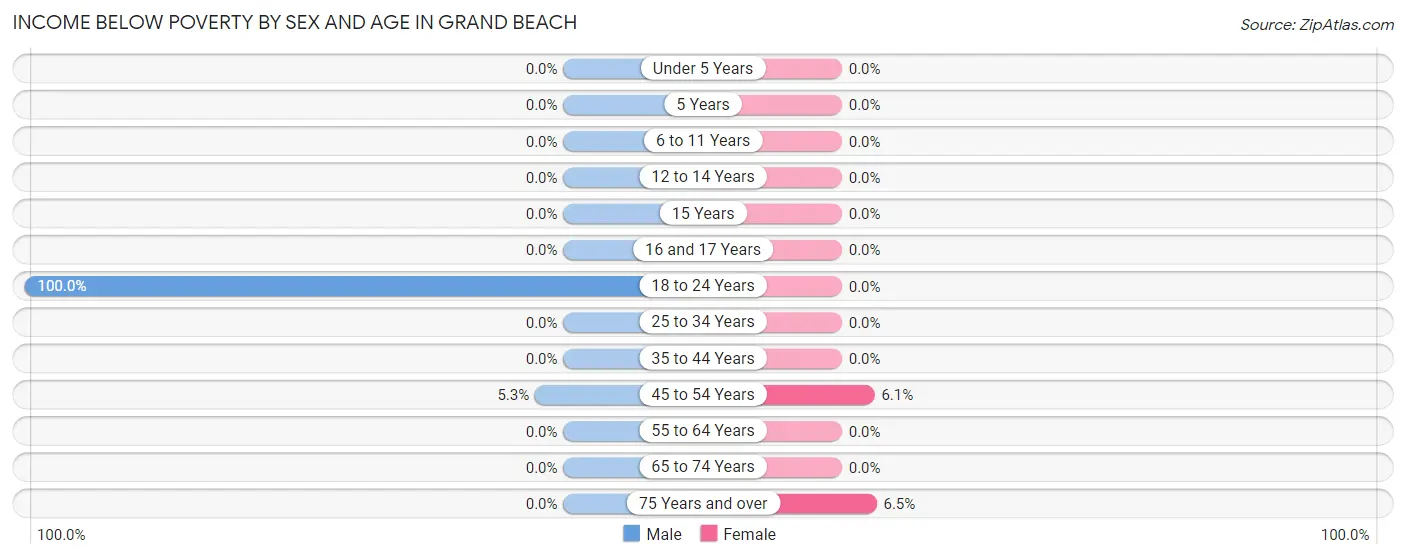
| Age Bracket | Male | Female |
| Under 5 Years | 0 (0.0%) | 0 (0.0%) |
| 5 Years | 0 (0.0%) | 0 (0.0%) |
| 6 to 11 Years | 0 (0.0%) | 0 (0.0%) |
| 12 to 14 Years | 0 (0.0%) | 0 (0.0%) |
| 15 Years | 0 (0.0%) | 0 (0.0%) |
| 16 and 17 Years | 0 (0.0%) | 0 (0.0%) |
| 18 to 24 Years | 1 (100.0%) | 0 (0.0%) |
| 25 to 34 Years | 0 (0.0%) | 0 (0.0%) |
| 35 to 44 Years | 0 (0.0%) | 0 (0.0%) |
| 45 to 54 Years | 1 (5.3%) | 2 (6.1%) |
| 55 to 64 Years | 0 (0.0%) | 0 (0.0%) |
| 65 to 74 Years | 0 (0.0%) | 0 (0.0%) |
| 75 Years and over | 0 (0.0%) | 2 (6.5%) |
| Total | 2 (1.0%) | 4 (2.3%) |
Income Above Poverty by Sex and Age in Grand Beach
According to the poverty statistics in Grand Beach, males aged 6 to 11 years and females aged 6 to 11 years are the age groups that are most secure financially, with 100.0% of males and 100.0% of females in these age groups living above the poverty line.
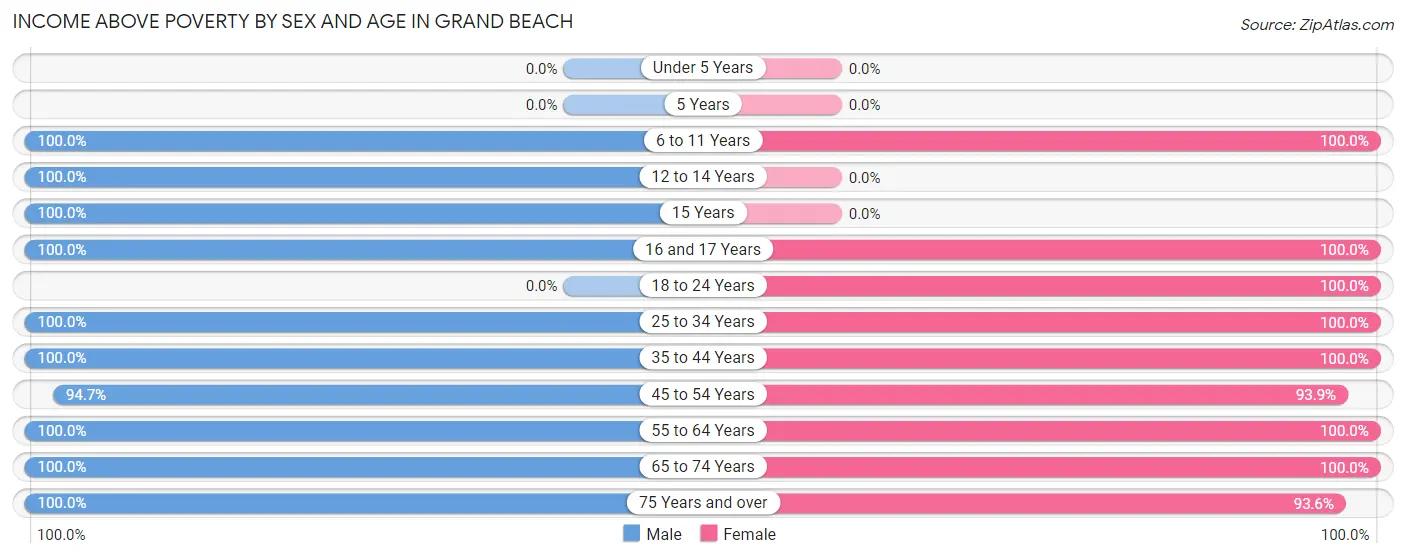
| Age Bracket | Male | Female |
| Under 5 Years | 0 (0.0%) | 0 (0.0%) |
| 5 Years | 0 (0.0%) | 0 (0.0%) |
| 6 to 11 Years | 16 (100.0%) | 7 (100.0%) |
| 12 to 14 Years | 3 (100.0%) | 0 (0.0%) |
| 15 Years | 1 (100.0%) | 0 (0.0%) |
| 16 and 17 Years | 2 (100.0%) | 3 (100.0%) |
| 18 to 24 Years | 0 (0.0%) | 6 (100.0%) |
| 25 to 34 Years | 11 (100.0%) | 3 (100.0%) |
| 35 to 44 Years | 13 (100.0%) | 13 (100.0%) |
| 45 to 54 Years | 18 (94.7%) | 31 (93.9%) |
| 55 to 64 Years | 29 (100.0%) | 30 (100.0%) |
| 65 to 74 Years | 82 (100.0%) | 47 (100.0%) |
| 75 Years and over | 27 (100.0%) | 29 (93.5%) |
| Total | 202 (99.0%) | 169 (97.7%) |
Income Below Poverty Among Married-Couple Families in Grand Beach
The poverty statistics for married-couple families in Grand Beach show that 1.9% or 2 of the total 107 families live below the poverty line. Families with no children have the highest poverty rate of 2.1%, comprising of 2 families. On the other hand, families with 1 or 2 children have the lowest poverty rate of 0.0%, which includes 0 families.
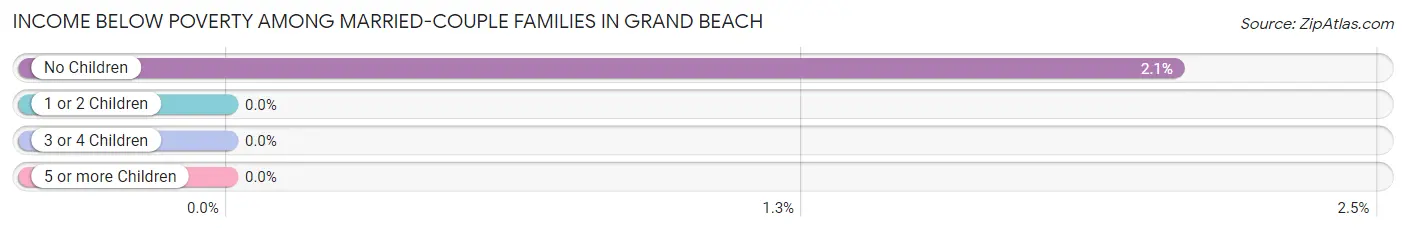
| Children | Above Poverty | Below Poverty |
| No Children | 95 (97.9%) | 2 (2.1%) |
| 1 or 2 Children | 7 (100.0%) | 0 (0.0%) |
| 3 or 4 Children | 2 (100.0%) | 0 (0.0%) |
| 5 or more Children | 1 (100.0%) | 0 (0.0%) |
| Total | 105 (98.1%) | 2 (1.9%) |
Income Below Poverty Among Single-Parent Households in Grand Beach
| Children | Single Father | Single Mother |
| No Children | 0 (0.0%) | 0 (0.0%) |
| 1 or 2 Children | 0 (0.0%) | 0 (0.0%) |
| 3 or 4 Children | 0 (0.0%) | 0 (0.0%) |
| 5 or more Children | 0 (0.0%) | 0 (0.0%) |
| Total | 0 (0.0%) | 0 (0.0%) |
Income Below Poverty Among Married-Couple vs Single-Parent Households in Grand Beach
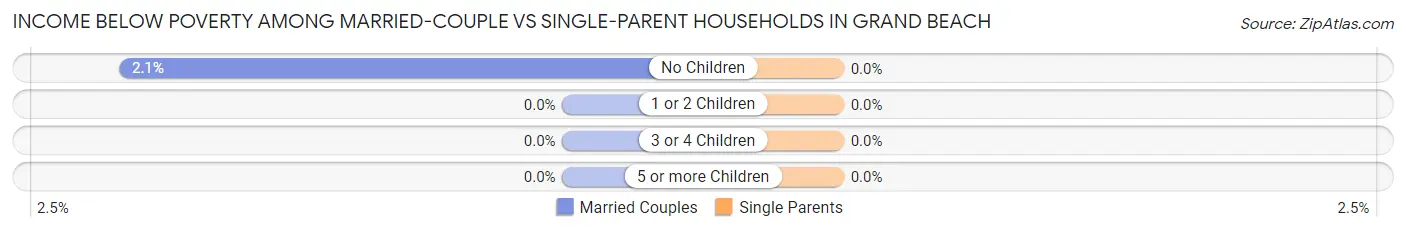
| Children | Married-Couple Families | Single-Parent Households |
| No Children | 2 (2.1%) | 0 (0.0%) |
| 1 or 2 Children | 0 (0.0%) | 0 (0.0%) |
| 3 or 4 Children | 0 (0.0%) | 0 (0.0%) |
| 5 or more Children | 0 (0.0%) | 0 (0.0%) |
| Total | 2 (1.9%) | 0 (0.0%) |
Race in Grand Beach
The most populous races in Grand Beach are White / Caucasian (343 | 91.0%), Two or more Races (34 | 9.0%), and Hispanic or Latino (19 | 5.0%).
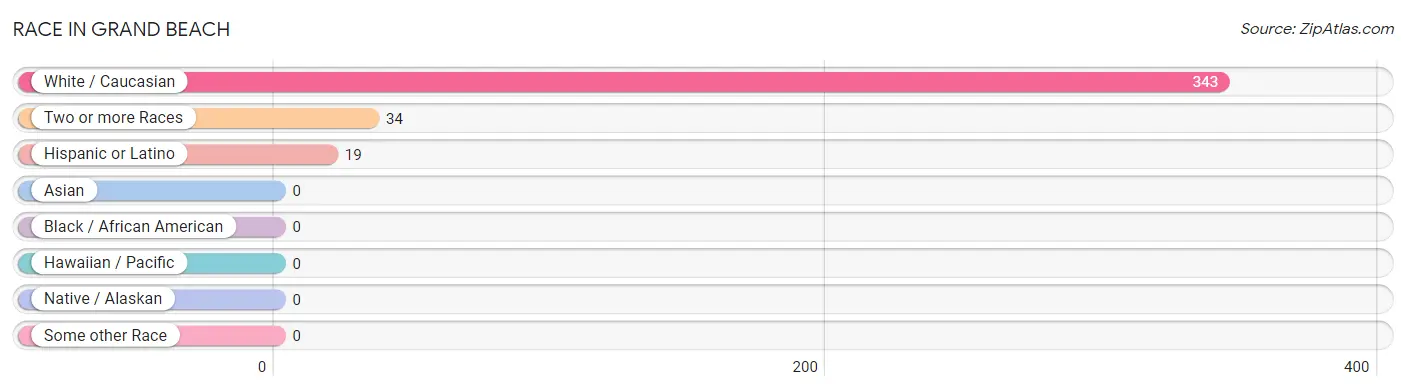
| Race | # Population | % Population |
| Asian | 0 | 0.0% |
| Black / African American | 0 | 0.0% |
| Hawaiian / Pacific | 0 | 0.0% |
| Hispanic or Latino | 19 | 5.0% |
| Native / Alaskan | 0 | 0.0% |
| White / Caucasian | 343 | 91.0% |
| Two or more Races | 34 | 9.0% |
| Some other Race | 0 | 0.0% |
| Total | 377 | 100.0% |
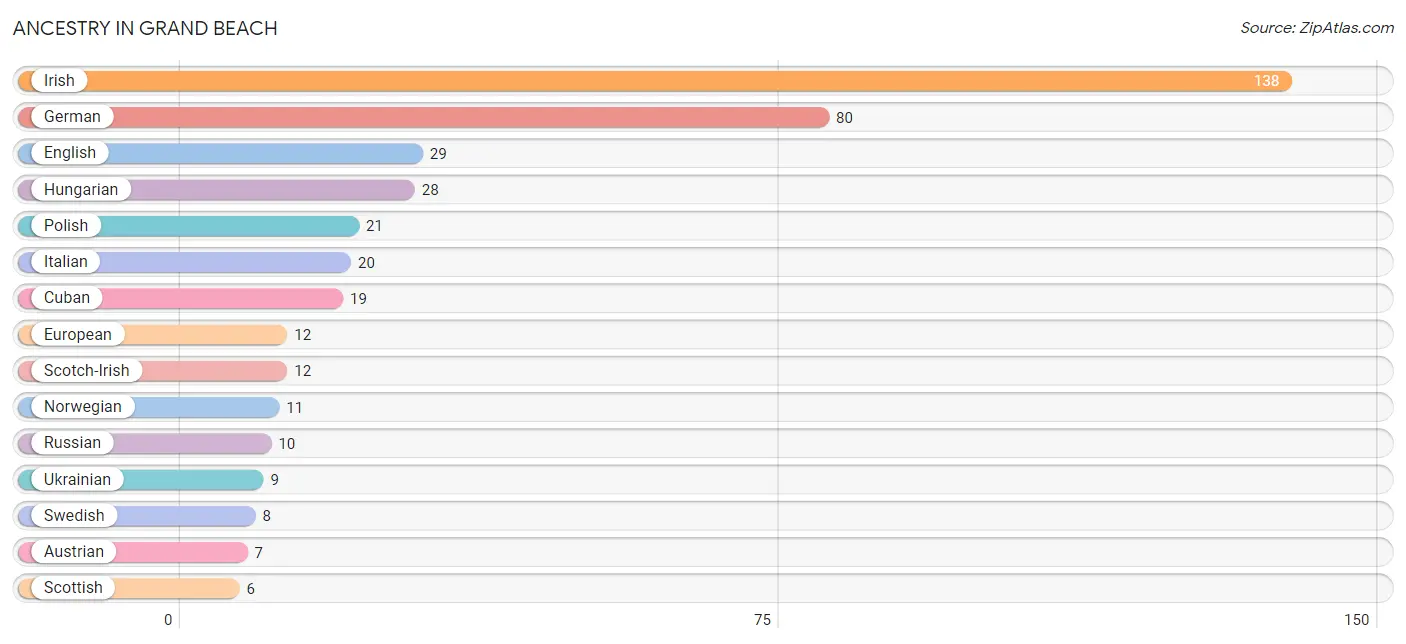
Ancestry in Grand Beach
The most populous ancestries reported in Grand Beach are Irish (138 | 36.6%), German (80 | 21.2%), English (29 | 7.7%), Hungarian (28 | 7.4%), and Polish (21 | 5.6%), together accounting for 78.5% of all Grand Beach residents.
| Ancestry | # Population | % Population |
| American | 4 | 1.1% |
| Austrian | 7 | 1.9% |
| Cuban | 19 | 5.0% |
| Czechoslovakian | 1 | 0.3% |
| Dutch | 1 | 0.3% |
| Eastern European | 4 | 1.1% |
| English | 29 | 7.7% |
| European | 12 | 3.2% |
| Finnish | 1 | 0.3% |
| French | 5 | 1.3% |
| German | 80 | 21.2% |
| Greek | 3 | 0.8% |
| Hungarian | 28 | 7.4% |
| Irish | 138 | 36.6% |
| Italian | 20 | 5.3% |
| Korean | 5 | 1.3% |
| Northern European | 2 | 0.5% |
| Norwegian | 11 | 2.9% |
| Polish | 21 | 5.6% |
| Romanian | 3 | 0.8% |
| Russian | 10 | 2.6% |
| Scandinavian | 2 | 0.5% |
| Scotch-Irish | 12 | 3.2% |
| Scottish | 6 | 1.6% |
| Slovak | 3 | 0.8% |
| Swedish | 8 | 2.1% |
| Swiss | 4 | 1.1% |
| Ukrainian | 9 | 2.4% |
| Welsh | 1 | 0.3% | View All 29 Rows |
Immigrants in Grand Beach
The most numerous immigrant groups reported in Grand Beach came from Europe (3 | 0.8%), Czechoslovakia (2 | 0.5%), Eastern Europe (2 | 0.5%), Italy (1 | 0.3%), and Oceania (1 | 0.3%), together accounting for 2.4% of all Grand Beach residents.
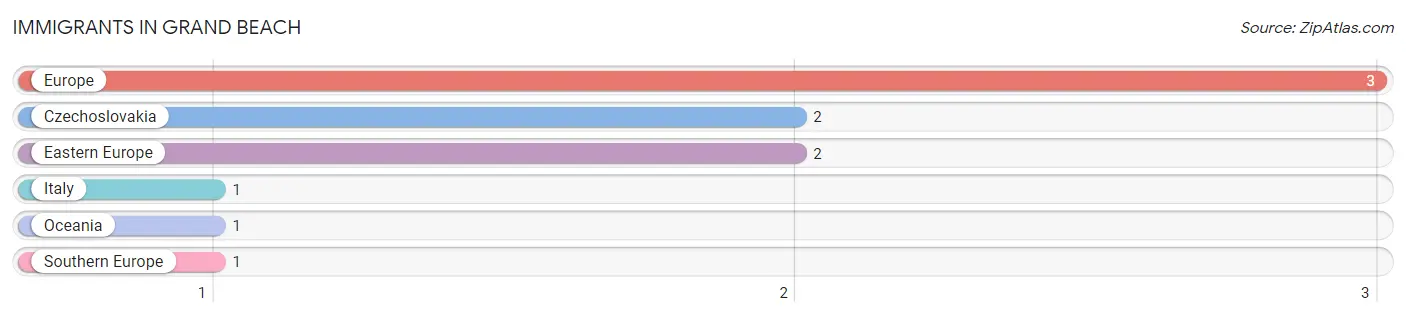
| Immigration Origin | # Population | % Population |
| Czechoslovakia | 2 | 0.5% |
| Eastern Europe | 2 | 0.5% |
| Europe | 3 | 0.8% |
| Italy | 1 | 0.3% |
| Oceania | 1 | 0.3% |
| Southern Europe | 1 | 0.3% | View All 6 Rows |
Sex and Age in Grand Beach
Sex and Age in Grand Beach
The most populous age groups in Grand Beach are 70 to 74 Years (58 | 28.4%) for men and 70 to 74 Years (29 | 16.8%) for women.
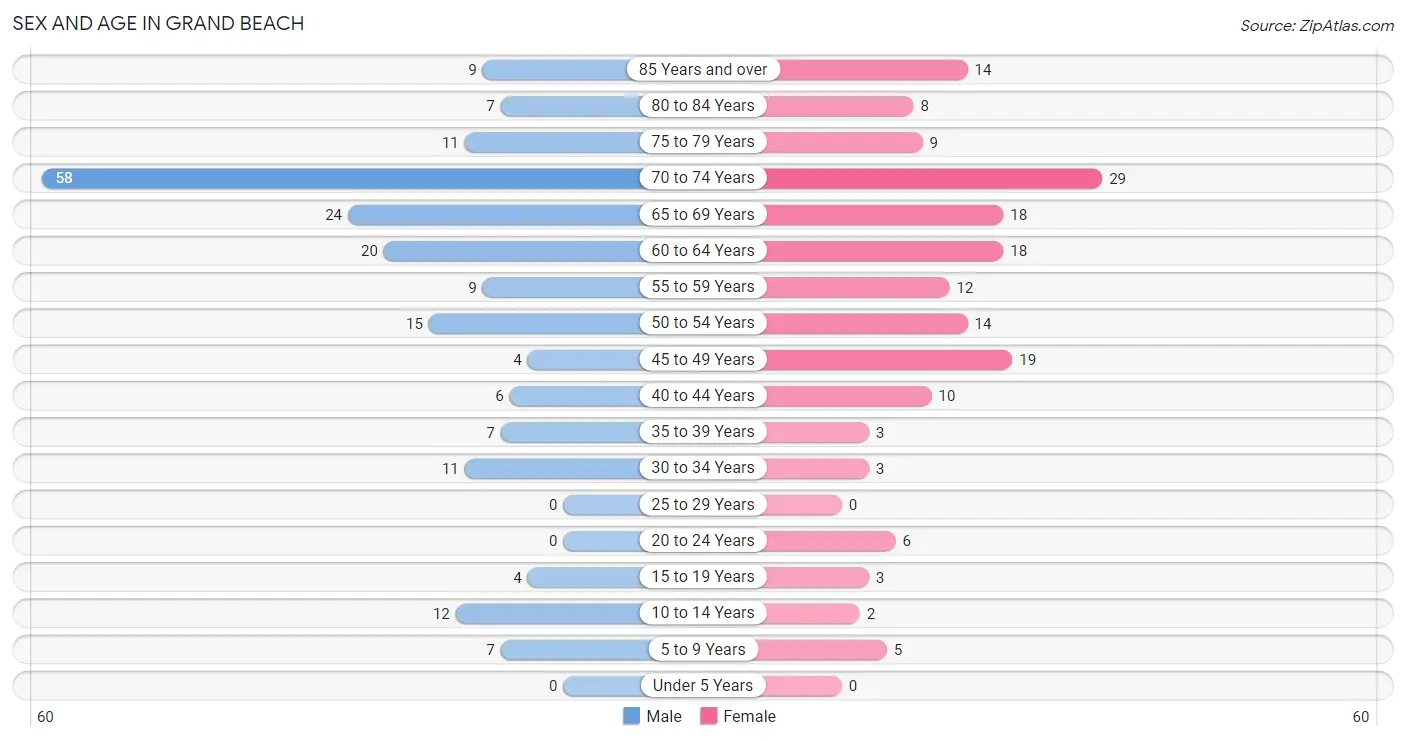
| Age Bracket | Male | Female |
| Under 5 Years | 0 (0.0%) | 0 (0.0%) |
| 5 to 9 Years | 7 (3.4%) | 5 (2.9%) |
| 10 to 14 Years | 12 (5.9%) | 2 (1.2%) |
| 15 to 19 Years | 4 (2.0%) | 3 (1.7%) |
| 20 to 24 Years | 0 (0.0%) | 6 (3.5%) |
| 25 to 29 Years | 0 (0.0%) | 0 (0.0%) |
| 30 to 34 Years | 11 (5.4%) | 3 (1.7%) |
| 35 to 39 Years | 7 (3.4%) | 3 (1.7%) |
| 40 to 44 Years | 6 (2.9%) | 10 (5.8%) |
| 45 to 49 Years | 4 (2.0%) | 19 (11.0%) |
| 50 to 54 Years | 15 (7.3%) | 14 (8.1%) |
| 55 to 59 Years | 9 (4.4%) | 12 (6.9%) |
| 60 to 64 Years | 20 (9.8%) | 18 (10.4%) |
| 65 to 69 Years | 24 (11.8%) | 18 (10.4%) |
| 70 to 74 Years | 58 (28.4%) | 29 (16.8%) |
| 75 to 79 Years | 11 (5.4%) | 9 (5.2%) |
| 80 to 84 Years | 7 (3.4%) | 8 (4.6%) |
| 85 Years and over | 9 (4.4%) | 14 (8.1%) |
| Total | 204 (100.0%) | 173 (100.0%) |
Families and Households in Grand Beach
Median Family Size in Grand Beach
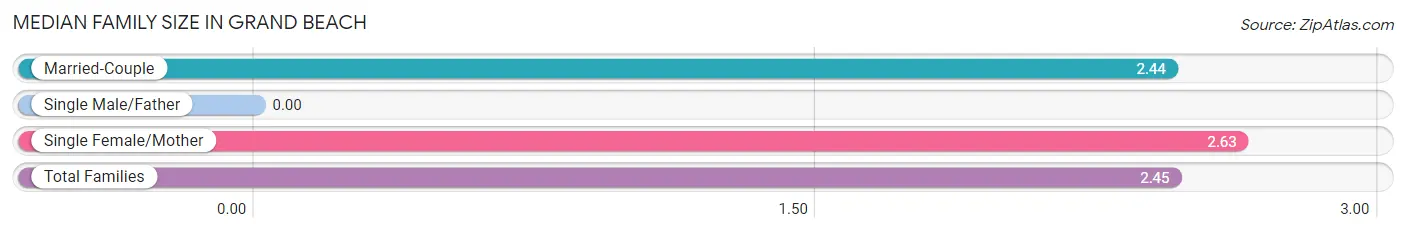
| Family Type | # Families | Family Size |
| Married-Couple | 107 (93.0%) | 2.44 |
| Single Male/Father | 0 (0.0%) | - |
| Single Female/Mother | 8 (7.0%) | 2.63 |
| Total Families | 115 (100.0%) | 2.45 |
Median Household Size in Grand Beach
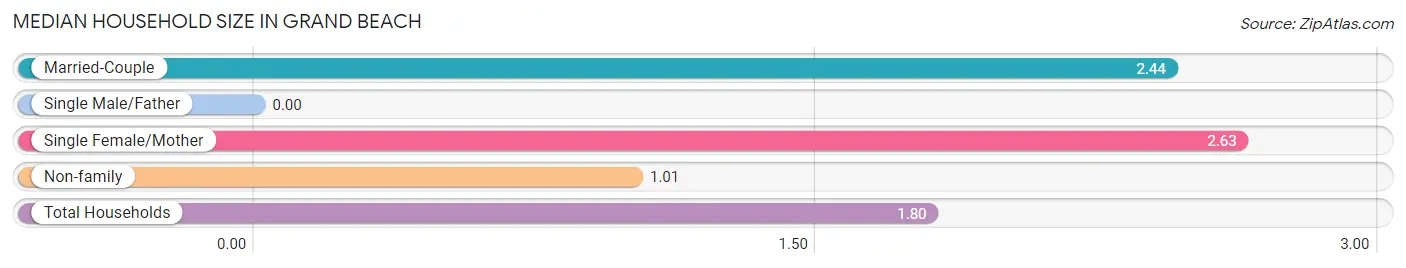
| Household Type | # Households | Household Size |
| Married-Couple | 107 (51.2%) | 2.44 |
| Single Male/Father | 0 (0.0%) | - |
| Single Female/Mother | 8 (3.8%) | 2.63 |
| Non-family | 94 (45.0%) | 1.01 |
| Total Households | 209 (100.0%) | 1.80 |
Household Size by Marriage Status in Grand Beach
Out of a total of 209 households in Grand Beach, 115 (55.0%) are family households, while 94 (45.0%) are nonfamily households. The most numerous type of family households are 2-person households, comprising 82, and the most common type of nonfamily households are 1-person households, comprising 93.
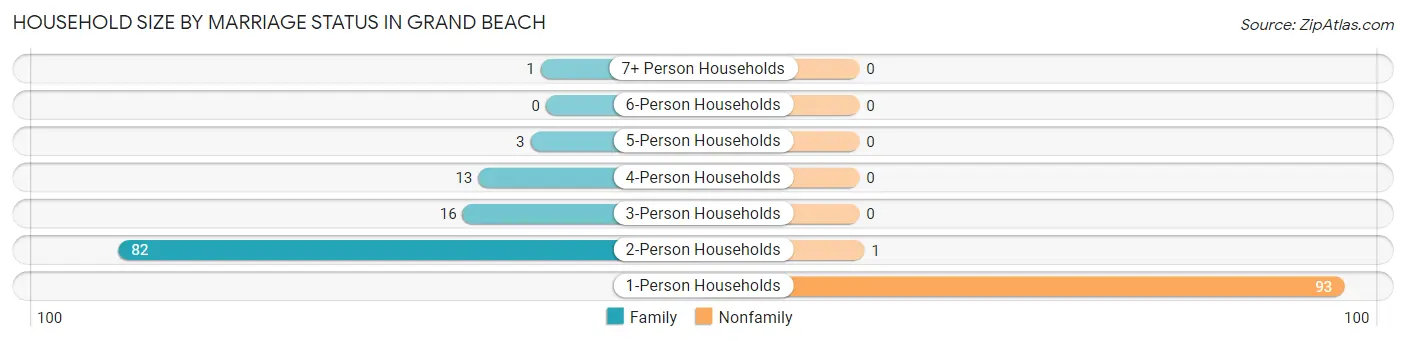
| Household Size | Family Households | Nonfamily Households |
| 1-Person Households | - | 93 (44.5%) |
| 2-Person Households | 82 (39.2%) | 1 (0.5%) |
| 3-Person Households | 16 (7.7%) | 0 (0.0%) |
| 4-Person Households | 13 (6.2%) | 0 (0.0%) |
| 5-Person Households | 3 (1.4%) | 0 (0.0%) |
| 6-Person Households | 0 (0.0%) | 0 (0.0%) |
| 7+ Person Households | 1 (0.5%) | 0 (0.0%) |
| Total | 115 (55.0%) | 94 (45.0%) |
Female Fertility in Grand Beach
Fertility by Age in Grand Beach
| Age Bracket | Women with Births | Births / 1,000 Women |
| 15 to 19 years | 0 (0.0%) | 0.0 |
| 20 to 34 years | 0 (0.0%) | 0.0 |
| 35 to 50 years | 0 (0.0%) | 0.0 |
| Total | 0 (0.0%) | 0.0 |
Fertility by Age by Marriage Status in Grand Beach
| Age Bracket | Married | Unmarried |
| 15 to 19 years | 0 (0.0%) | 0 (0.0%) |
| 20 to 34 years | 0 (0.0%) | 0 (0.0%) |
| 35 to 50 years | 0 (0.0%) | 0 (0.0%) |
| Total | 0 (0.0%) | 0 (0.0%) |
Fertility by Education in Grand Beach
| Educational Attainment | Women with Births | Births / 1,000 Women |
| Less than High School | 0 (0.0%) | 0.0 |
| High School Diploma | 0 (0.0%) | 0.0 |
| College or Associate's Degree | 0 (0.0%) | 0.0 |
| Bachelor's Degree | 0 (0.0%) | 0.0 |
| Graduate Degree | 0 (0.0%) | 0.0 |
| Total | 0 (0.0%) | 0.0 |
Fertility by Education by Marriage Status in Grand Beach
| Educational Attainment | Married | Unmarried |
| Less than High School | 0 (0.0%) | 0 (0.0%) |
| High School Diploma | 0 (0.0%) | 0 (0.0%) |
| College or Associate's Degree | 0 (0.0%) | 0 (0.0%) |
| Bachelor's Degree | 0 (0.0%) | 0 (0.0%) |
| Graduate Degree | 0 (0.0%) | 0 (0.0%) |
| Total | 0 (0.0%) | 0 (0.0%) |
Employment Characteristics in Grand Beach
Employment by Class of Employer in Grand Beach
Among the 118 employed individuals in Grand Beach, private company employees (65 | 55.1%), self-employed (incorporated) (26 | 22.0%), and not-for-profit organizations (13 | 11.0%) make up the most common classes of employment.
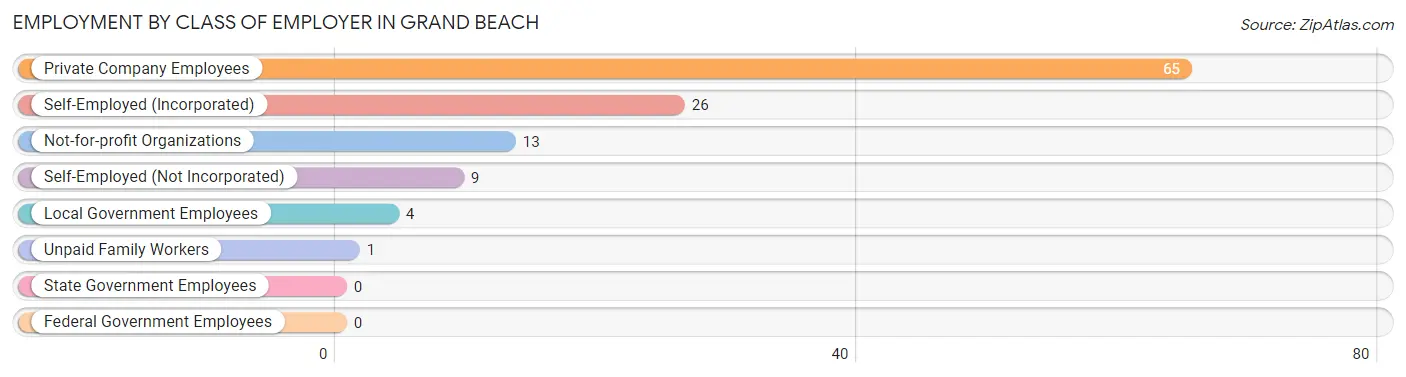
| Employer Class | # Employees | % Employees |
| Private Company Employees | 65 | 55.1% |
| Self-Employed (Incorporated) | 26 | 22.0% |
| Self-Employed (Not Incorporated) | 9 | 7.6% |
| Not-for-profit Organizations | 13 | 11.0% |
| Local Government Employees | 4 | 3.4% |
| State Government Employees | 0 | 0.0% |
| Federal Government Employees | 0 | 0.0% |
| Unpaid Family Workers | 1 | 0.9% |
| Total | 118 | 100.0% |
Employment Status by Age in Grand Beach
According to the labor force statistics for Grand Beach, out of the total population over 16 years of age (350), 34.9% or 122 individuals are in the labor force, with 2.5% or 3 of them unemployed. The age group with the highest labor force participation rate is 30 to 34 years, with 85.7% or 12 individuals in the labor force. Within the labor force, the 55 to 59 years age range has the highest percentage of unemployed individuals, with 10.0% or 1 of them being unemployed.
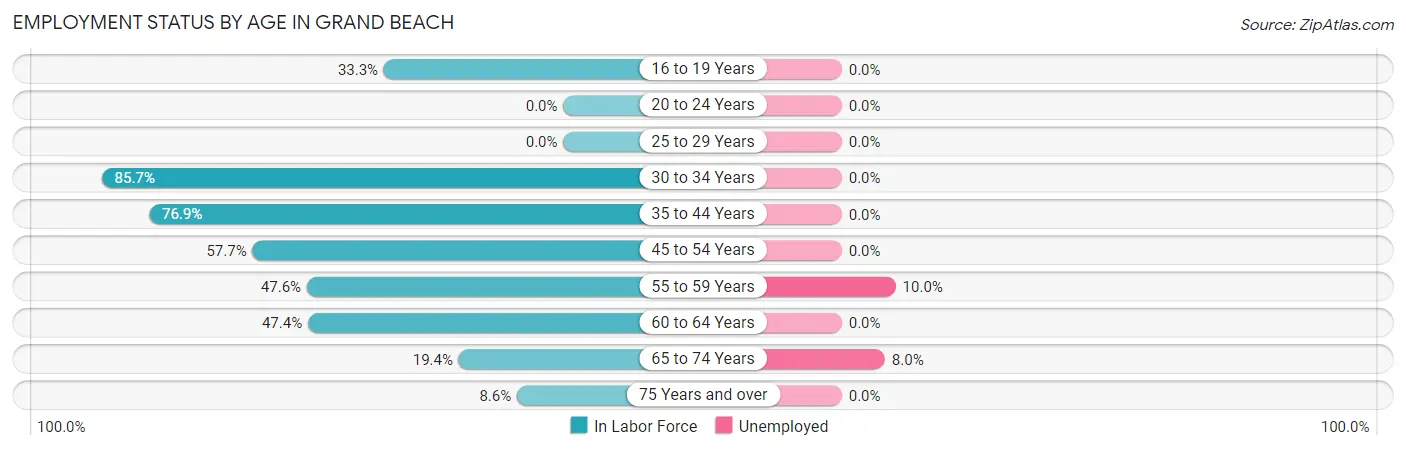
| Age Bracket | In Labor Force | Unemployed |
| 16 to 19 Years | 2 (33.3%) | 0 (0.0%) |
| 20 to 24 Years | 0 (0.0%) | 0 (0.0%) |
| 25 to 29 Years | 0 (0.0%) | 0 (0.0%) |
| 30 to 34 Years | 12 (85.7%) | 0 (0.0%) |
| 35 to 44 Years | 20 (76.9%) | 0 (0.0%) |
| 45 to 54 Years | 30 (57.7%) | 0 (0.0%) |
| 55 to 59 Years | 10 (47.6%) | 1 (10.0%) |
| 60 to 64 Years | 18 (47.4%) | 0 (0.0%) |
| 65 to 74 Years | 25 (19.4%) | 2 (8.0%) |
| 75 Years and over | 5 (8.6%) | 0 (0.0%) |
| Total | 122 (34.9%) | 3 (2.5%) |
Employment Status by Educational Attainment in Grand Beach
According to labor force statistics for Grand Beach, 59.6% of individuals (90) out of the total population between 25 and 64 years of age (151) are in the labor force, with 1.1% or 1 of them being unemployed. The group with the highest labor force participation rate are those with the educational attainment of high school diploma, with 71.4% or 5 individuals in the labor force. Within the labor force, individuals with bachelor's degree or higher education have the highest percentage of unemployment, with 1.3% or 1 of them being unemployed.
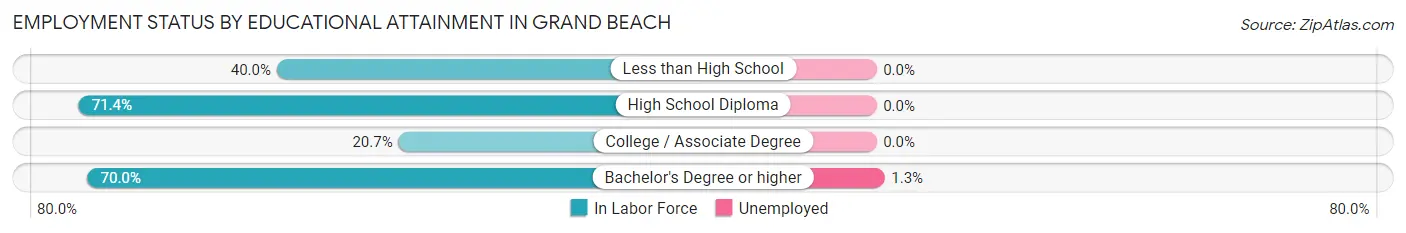
| Educational Attainment | In Labor Force | Unemployed |
| Less than High School | 2 (40.0%) | 0 (0.0%) |
| High School Diploma | 5 (71.4%) | 0 (0.0%) |
| College / Associate Degree | 6 (20.7%) | 0 (0.0%) |
| Bachelor's Degree or higher | 77 (70.0%) | 1 (1.3%) |
| Total | 90 (59.6%) | 2 (1.1%) |
Employment Occupations by Sex in Grand Beach
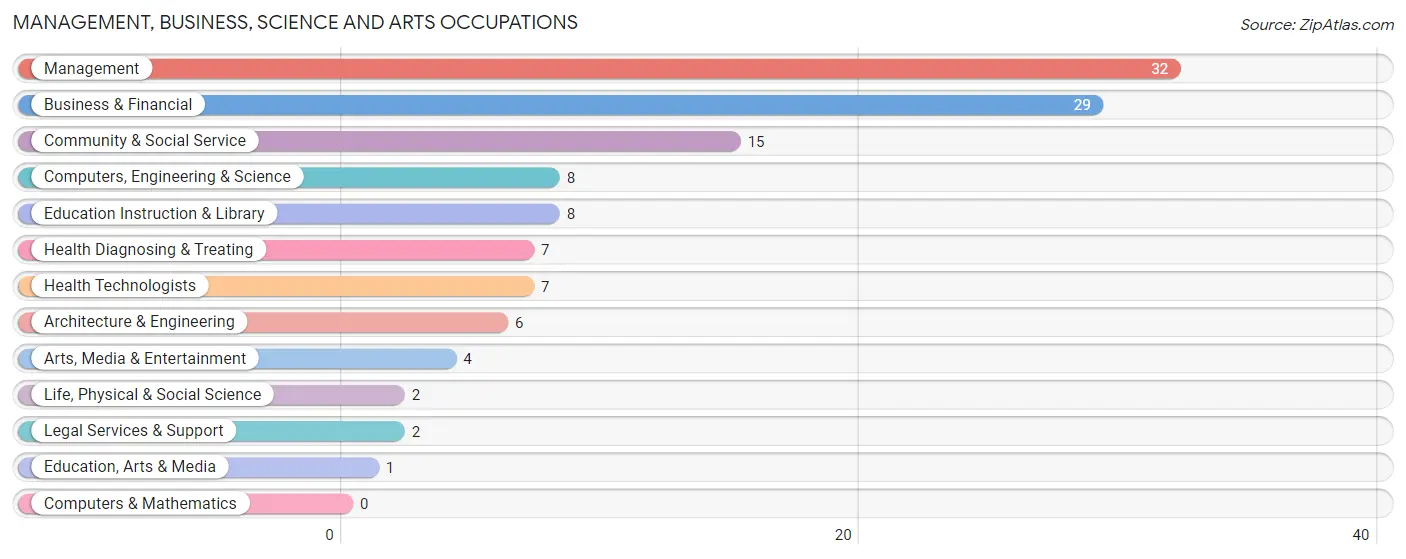
Management, Business, Science and Arts Occupations
The most common Management, Business, Science and Arts occupations in Grand Beach are Management (32 | 26.9%), Business & Financial (29 | 24.4%), Community & Social Service (15 | 12.6%), Computers, Engineering & Science (8 | 6.7%), and Education Instruction & Library (8 | 6.7%).
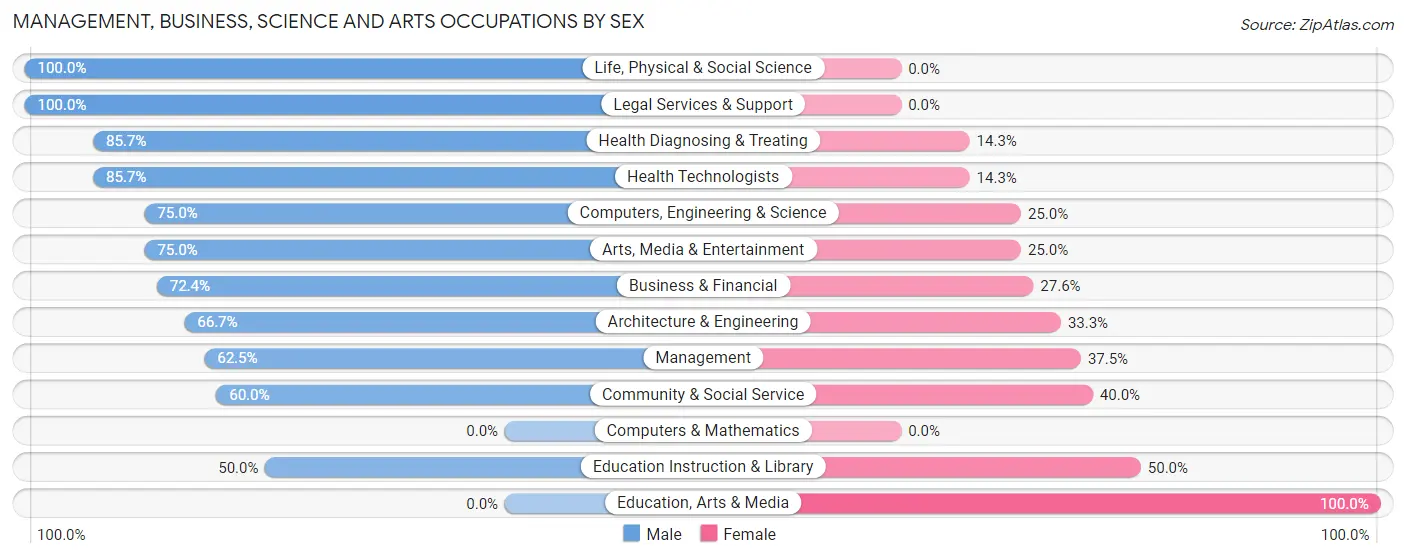
Management, Business, Science and Arts Occupations by Sex
Within the Management, Business, Science and Arts occupations in Grand Beach, the most male-oriented occupations are Life, Physical & Social Science (100.0%), Legal Services & Support (100.0%), and Health Diagnosing & Treating (85.7%), while the most female-oriented occupations are Education, Arts & Media (100.0%), Education Instruction & Library (50.0%), and Community & Social Service (40.0%).
| Occupation | Male | Female |
| Management | 20 (62.5%) | 12 (37.5%) |
| Business & Financial | 21 (72.4%) | 8 (27.6%) |
| Computers, Engineering & Science | 6 (75.0%) | 2 (25.0%) |
| Computers & Mathematics | 0 (0.0%) | 0 (0.0%) |
| Architecture & Engineering | 4 (66.7%) | 2 (33.3%) |
| Life, Physical & Social Science | 2 (100.0%) | 0 (0.0%) |
| Community & Social Service | 9 (60.0%) | 6 (40.0%) |
| Education, Arts & Media | 0 (0.0%) | 1 (100.0%) |
| Legal Services & Support | 2 (100.0%) | 0 (0.0%) |
| Education Instruction & Library | 4 (50.0%) | 4 (50.0%) |
| Arts, Media & Entertainment | 3 (75.0%) | 1 (25.0%) |
| Health Diagnosing & Treating | 6 (85.7%) | 1 (14.3%) |
| Health Technologists | 6 (85.7%) | 1 (14.3%) |
| Total (Category) | 62 (68.1%) | 29 (31.9%) |
| Total (Overall) | 80 (67.2%) | 39 (32.8%) |
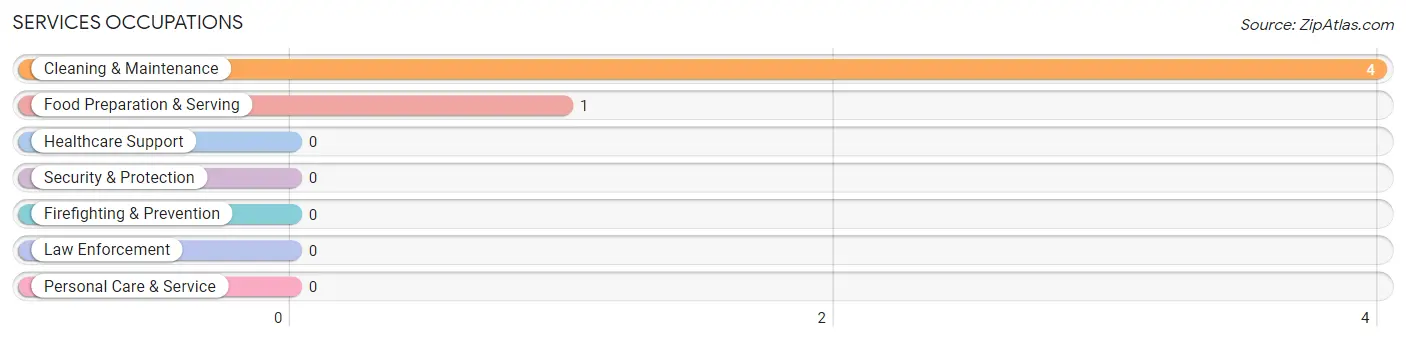
Services Occupations
The most common Services occupations in Grand Beach are Cleaning & Maintenance (4 | 3.4%), and Food Preparation & Serving (1 | 0.8%).
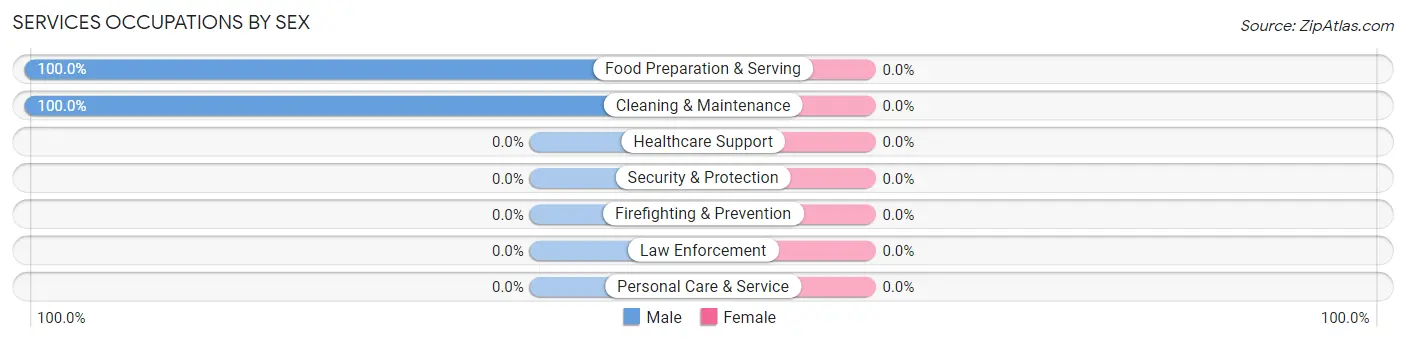
Services Occupations by Sex
| Occupation | Male | Female |
| Healthcare Support | 0 (0.0%) | 0 (0.0%) |
| Security & Protection | 0 (0.0%) | 0 (0.0%) |
| Firefighting & Prevention | 0 (0.0%) | 0 (0.0%) |
| Law Enforcement | 0 (0.0%) | 0 (0.0%) |
| Food Preparation & Serving | 1 (100.0%) | 0 (0.0%) |
| Cleaning & Maintenance | 4 (100.0%) | 0 (0.0%) |
| Personal Care & Service | 0 (0.0%) | 0 (0.0%) |
| Total (Category) | 5 (100.0%) | 0 (0.0%) |
| Total (Overall) | 80 (67.2%) | 39 (32.8%) |
Sales and Office Occupations
The most common Sales and Office occupations in Grand Beach are Sales & Related (13 | 10.9%), and Office & Administration (2 | 1.7%).
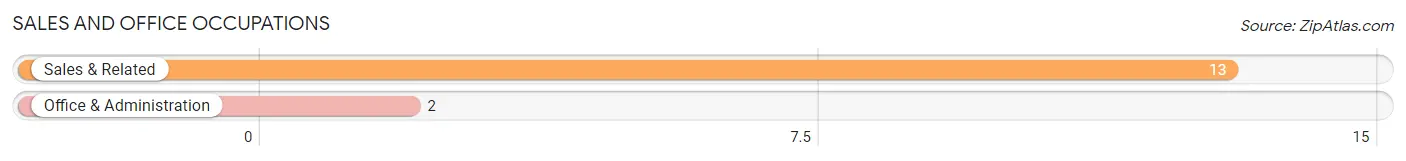
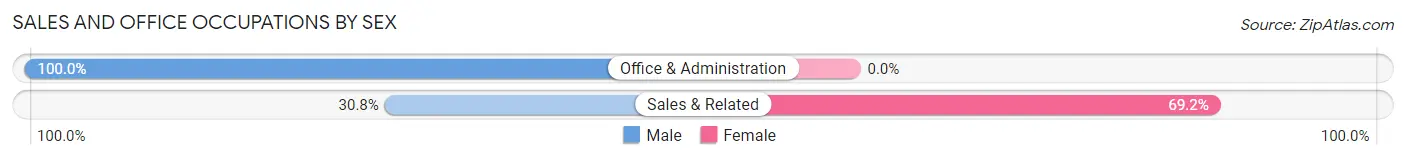
Sales and Office Occupations by Sex
| Occupation | Male | Female |
| Sales & Related | 4 (30.8%) | 9 (69.2%) |
| Office & Administration | 2 (100.0%) | 0 (0.0%) |
| Total (Category) | 6 (40.0%) | 9 (60.0%) |
| Total (Overall) | 80 (67.2%) | 39 (32.8%) |
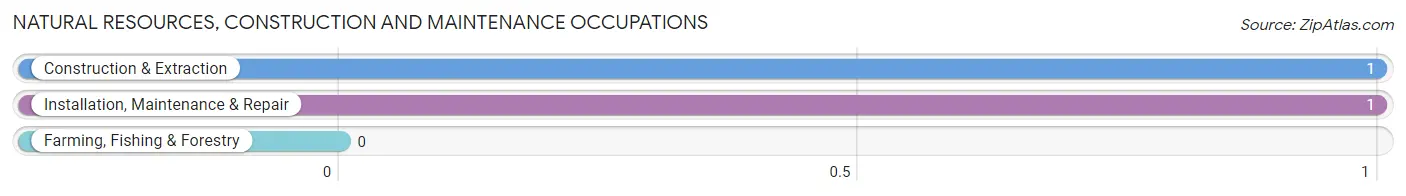
Natural Resources, Construction and Maintenance Occupations
The most common Natural Resources, Construction and Maintenance occupations in Grand Beach are Construction & Extraction (1 | 0.8%), and Installation, Maintenance & Repair (1 | 0.8%).
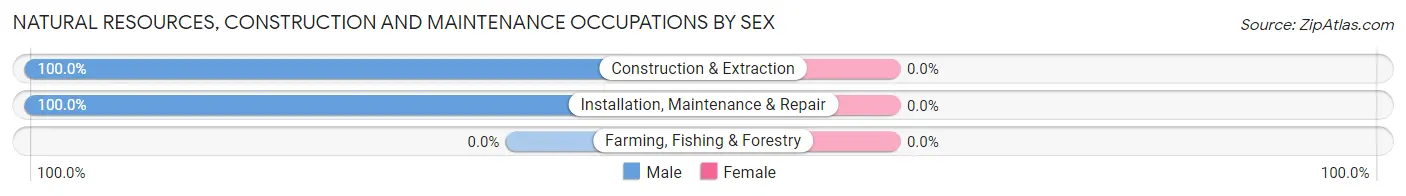
Natural Resources, Construction and Maintenance Occupations by Sex
| Occupation | Male | Female |
| Farming, Fishing & Forestry | 0 (0.0%) | 0 (0.0%) |
| Construction & Extraction | 1 (100.0%) | 0 (0.0%) |
| Installation, Maintenance & Repair | 1 (100.0%) | 0 (0.0%) |
| Total (Category) | 2 (100.0%) | 0 (0.0%) |
| Total (Overall) | 80 (67.2%) | 39 (32.8%) |
Production, Transportation and Moving Occupations
The most common Production, Transportation and Moving occupations in Grand Beach are , and Production (6 | 5.0%).
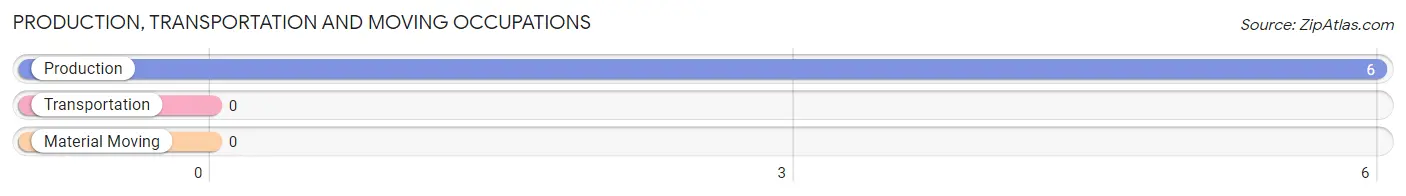
Production, Transportation and Moving Occupations by Sex
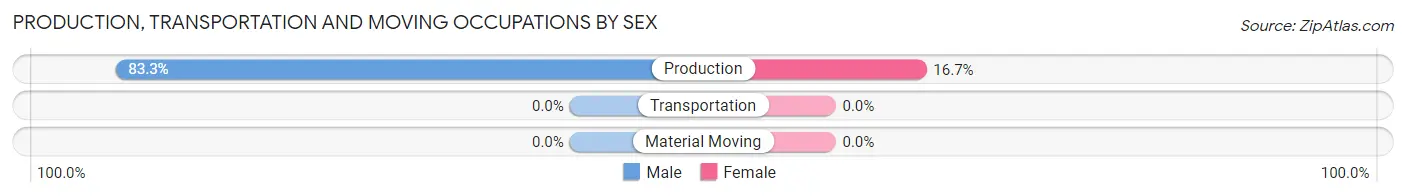
| Occupation | Male | Female |
| Production | 5 (83.3%) | 1 (16.7%) |
| Transportation | 0 (0.0%) | 0 (0.0%) |
| Material Moving | 0 (0.0%) | 0 (0.0%) |
| Total (Category) | 5 (83.3%) | 1 (16.7%) |
| Total (Overall) | 80 (67.2%) | 39 (32.8%) |
Employment Industries by Sex in Grand Beach
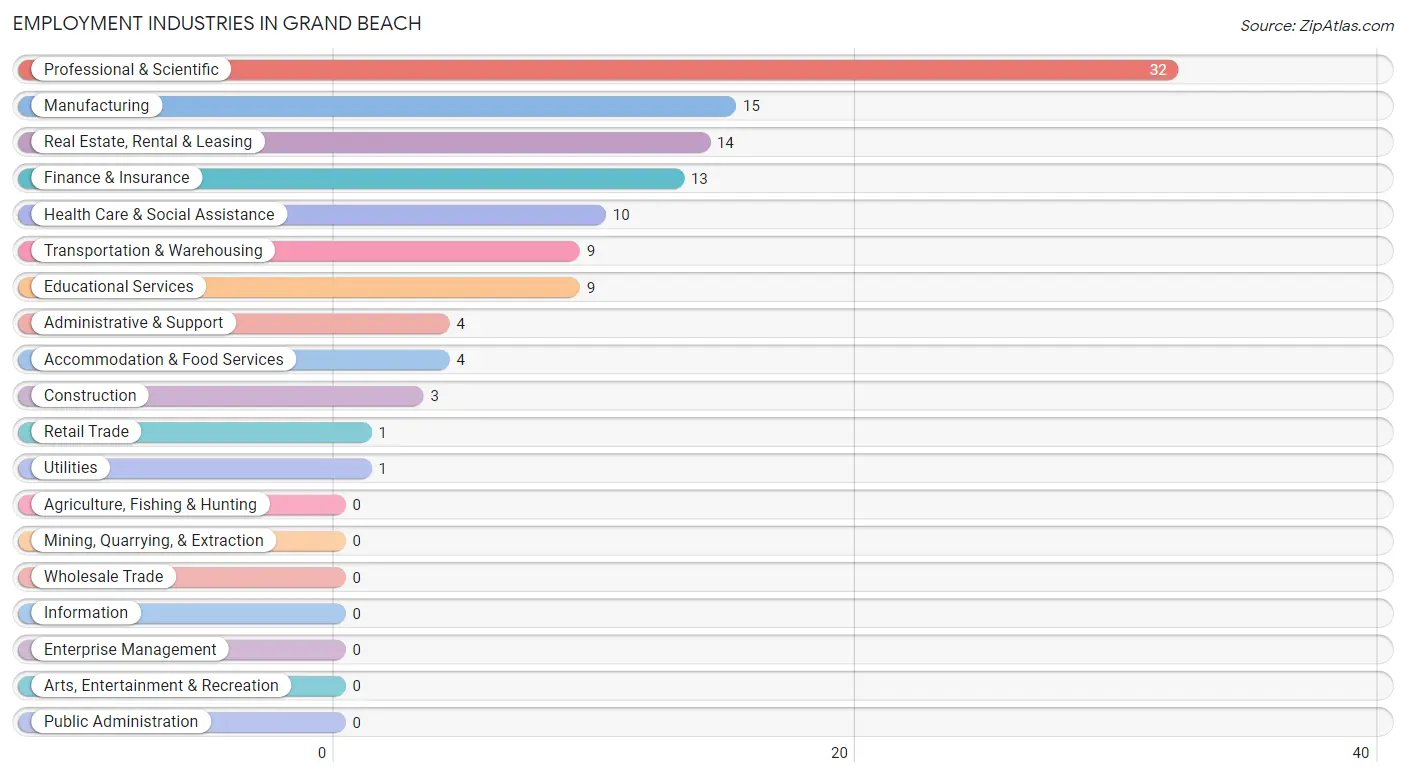
Employment Industries in Grand Beach
The major employment industries in Grand Beach include Professional & Scientific (32 | 26.9%), Manufacturing (15 | 12.6%), Real Estate, Rental & Leasing (14 | 11.8%), Finance & Insurance (13 | 10.9%), and Health Care & Social Assistance (10 | 8.4%).
Employment Industries by Sex in Grand Beach
The Grand Beach industries that see more men than women are Construction (100.0%), Transportation & Warehousing (100.0%), and Utilities (100.0%), whereas the industries that tend to have a higher number of women are Retail Trade (100.0%), Real Estate, Rental & Leasing (100.0%), and Educational Services (66.7%).
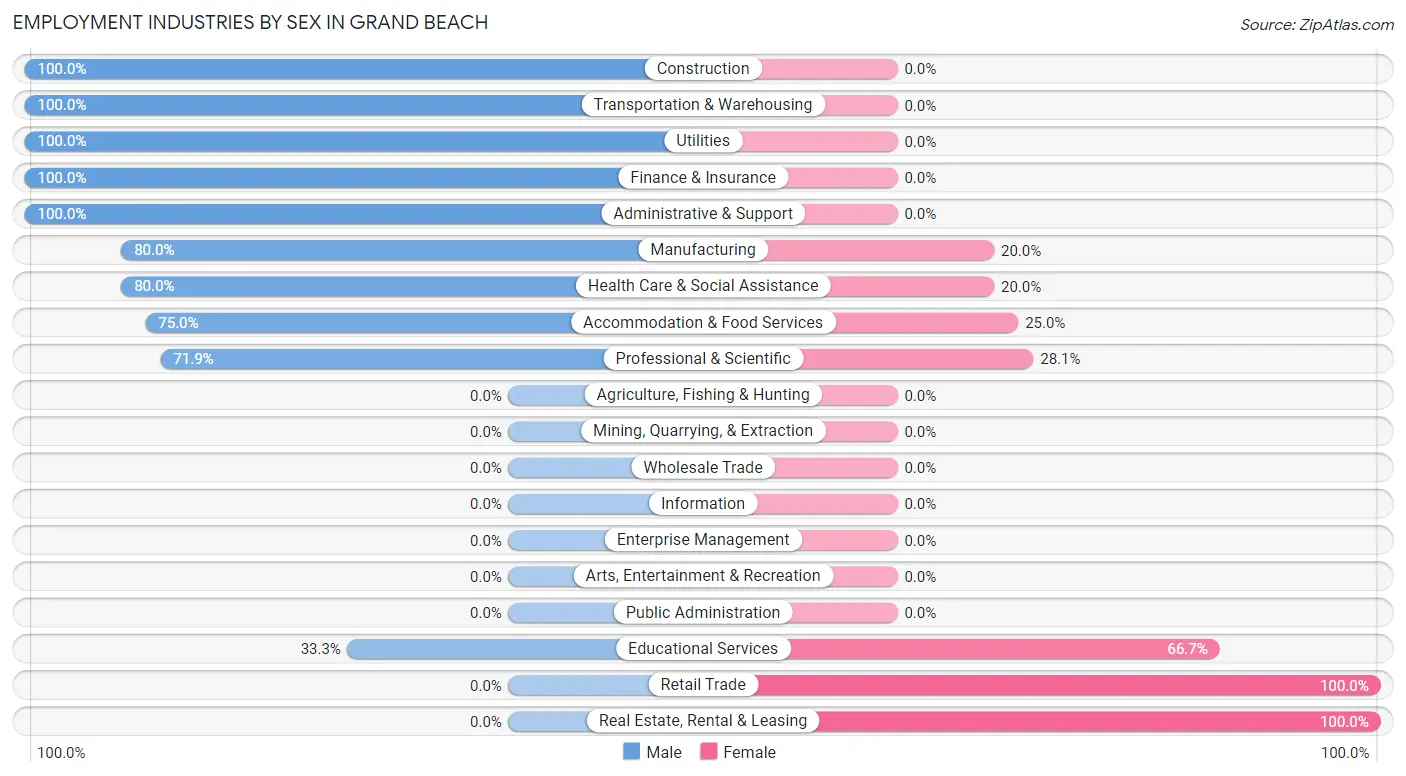
| Industry | Male | Female |
| Agriculture, Fishing & Hunting | 0 (0.0%) | 0 (0.0%) |
| Mining, Quarrying, & Extraction | 0 (0.0%) | 0 (0.0%) |
| Construction | 3 (100.0%) | 0 (0.0%) |
| Manufacturing | 12 (80.0%) | 3 (20.0%) |
| Wholesale Trade | 0 (0.0%) | 0 (0.0%) |
| Retail Trade | 0 (0.0%) | 1 (100.0%) |
| Transportation & Warehousing | 9 (100.0%) | 0 (0.0%) |
| Utilities | 1 (100.0%) | 0 (0.0%) |
| Information | 0 (0.0%) | 0 (0.0%) |
| Finance & Insurance | 13 (100.0%) | 0 (0.0%) |
| Real Estate, Rental & Leasing | 0 (0.0%) | 14 (100.0%) |
| Professional & Scientific | 23 (71.9%) | 9 (28.1%) |
| Enterprise Management | 0 (0.0%) | 0 (0.0%) |
| Administrative & Support | 4 (100.0%) | 0 (0.0%) |
| Educational Services | 3 (33.3%) | 6 (66.7%) |
| Health Care & Social Assistance | 8 (80.0%) | 2 (20.0%) |
| Arts, Entertainment & Recreation | 0 (0.0%) | 0 (0.0%) |
| Accommodation & Food Services | 3 (75.0%) | 1 (25.0%) |
| Public Administration | 0 (0.0%) | 0 (0.0%) |
| Total | 80 (67.2%) | 39 (32.8%) |
Education in Grand Beach
School Enrollment in Grand Beach
The most common levels of schooling among the 41 students in Grand Beach are elementary school (13 | 31.7%), middle school (11 | 26.8%), and college / undergraduate (7 | 17.1%).
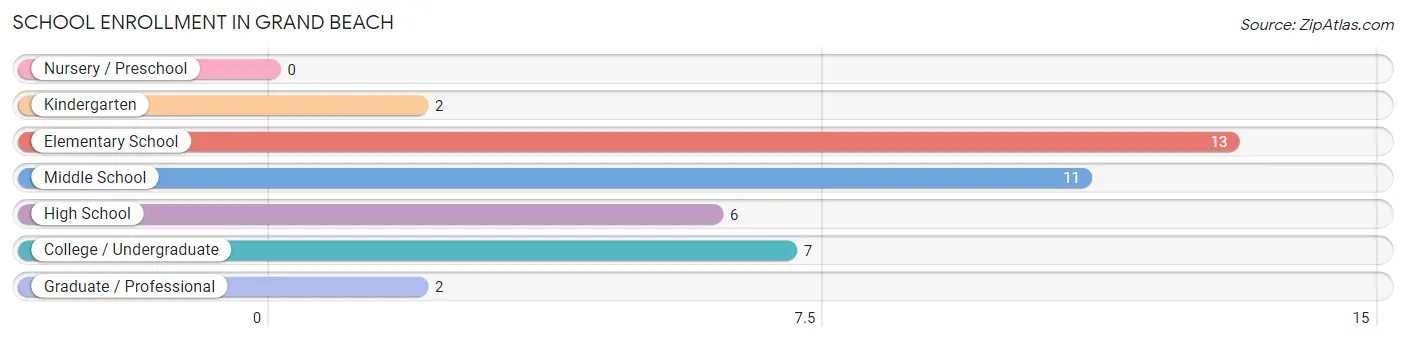
| School Level | # Students | % Students |
| Nursery / Preschool | 0 | 0.0% |
| Kindergarten | 2 | 4.9% |
| Elementary School | 13 | 31.7% |
| Middle School | 11 | 26.8% |
| High School | 6 | 14.6% |
| College / Undergraduate | 7 | 17.1% |
| Graduate / Professional | 2 | 4.9% |
| Total | 41 | 100.0% |
School Enrollment by Age by Funding Source in Grand Beach
Out of a total of 41 students who are enrolled in schools in Grand Beach, 23 (56.1%) attend a private institution, while the remaining 18 (43.9%) are enrolled in public schools. The age group of 18 to 19 year olds has the highest likelihood of being enrolled in private schools, with 1 (100.0% in the age bracket) enrolled. Conversely, the age group of 15 to 17 year olds has the lowest likelihood of being enrolled in a private school, with 4 (66.7% in the age bracket) attending a public institution.
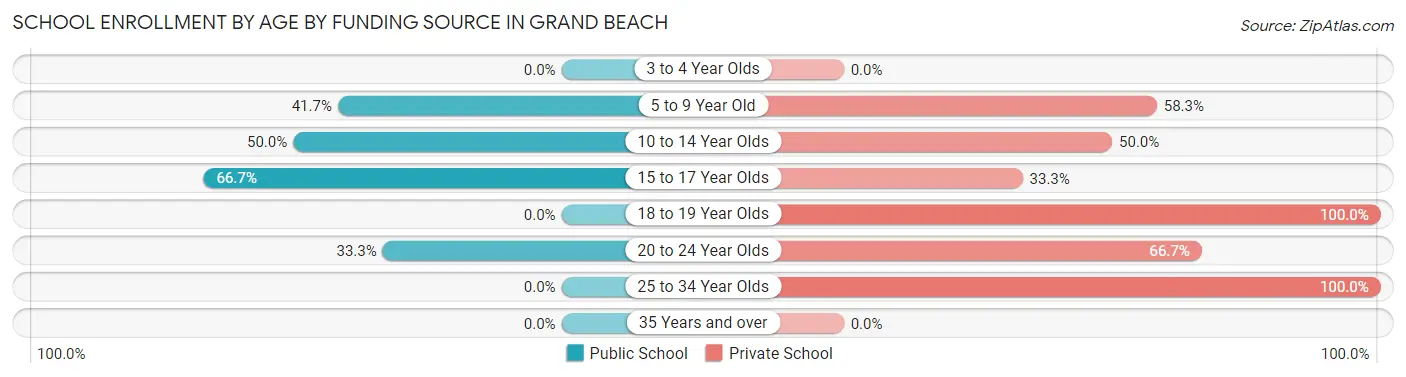
| Age Bracket | Public School | Private School |
| 3 to 4 Year Olds | 0 (0.0%) | 0 (0.0%) |
| 5 to 9 Year Old | 5 (41.7%) | 7 (58.3%) |
| 10 to 14 Year Olds | 7 (50.0%) | 7 (50.0%) |
| 15 to 17 Year Olds | 4 (66.7%) | 2 (33.3%) |
| 18 to 19 Year Olds | 0 (0.0%) | 1 (100.0%) |
| 20 to 24 Year Olds | 2 (33.3%) | 4 (66.7%) |
| 25 to 34 Year Olds | 0 (0.0%) | 2 (100.0%) |
| 35 Years and over | 0 (0.0%) | 0 (0.0%) |
| Total | 18 (43.9%) | 23 (56.1%) |
Educational Attainment by Field of Study in Grand Beach
Business (54 | 20.8%), psychology (42 | 16.2%), social sciences (27 | 10.4%), literature & languages (26 | 10.0%), and liberal arts & history (23 | 8.8%) are the most common fields of study among 260 individuals in Grand Beach who have obtained a bachelor's degree or higher.
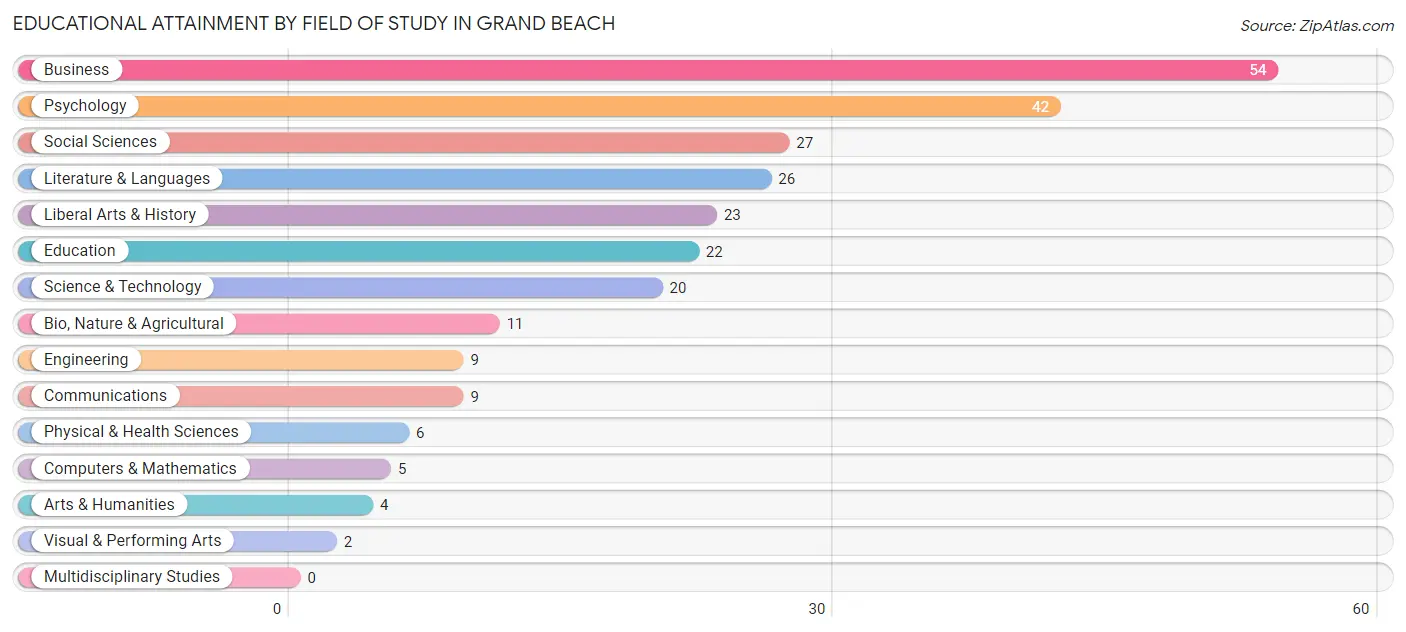
| Field of Study | # Graduates | % Graduates |
| Computers & Mathematics | 5 | 1.9% |
| Bio, Nature & Agricultural | 11 | 4.2% |
| Physical & Health Sciences | 6 | 2.3% |
| Psychology | 42 | 16.2% |
| Social Sciences | 27 | 10.4% |
| Engineering | 9 | 3.5% |
| Multidisciplinary Studies | 0 | 0.0% |
| Science & Technology | 20 | 7.7% |
| Business | 54 | 20.8% |
| Education | 22 | 8.5% |
| Literature & Languages | 26 | 10.0% |
| Liberal Arts & History | 23 | 8.8% |
| Visual & Performing Arts | 2 | 0.8% |
| Communications | 9 | 3.5% |
| Arts & Humanities | 4 | 1.5% |
| Total | 260 | 100.0% |
Transportation & Commute in Grand Beach
Vehicle Availability by Sex in Grand Beach
The most prevalent vehicle ownership categories in Grand Beach are males with 2 vehicles (36, accounting for 45.6%) and females with 2 vehicles (21, making up 92.3%).
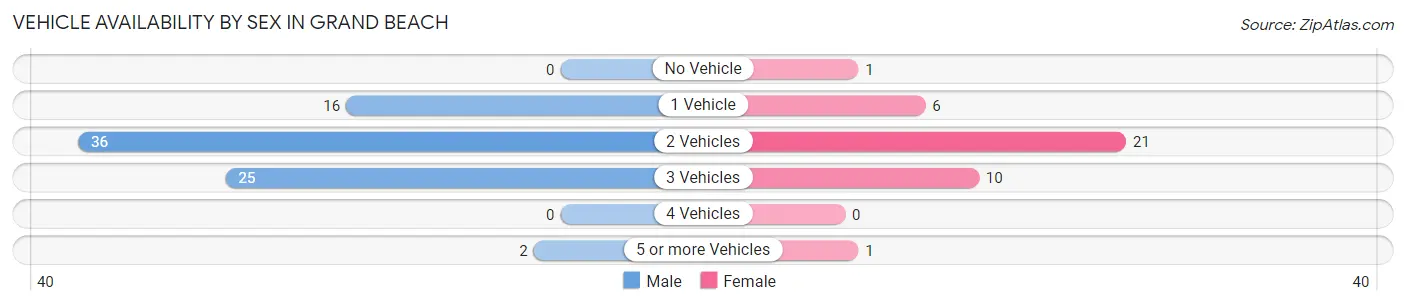
| Vehicles Available | Male | Female |
| No Vehicle | 0 (0.0%) | 1 (2.6%) |
| 1 Vehicle | 16 (20.3%) | 6 (15.4%) |
| 2 Vehicles | 36 (45.6%) | 21 (53.8%) |
| 3 Vehicles | 25 (31.7%) | 10 (25.6%) |
| 4 Vehicles | 0 (0.0%) | 0 (0.0%) |
| 5 or more Vehicles | 2 (2.5%) | 1 (2.6%) |
| Total | 79 (100.0%) | 39 (100.0%) |
Commute Time in Grand Beach
The most frequently occuring commute durations in Grand Beach are 10 to 14 minutes (16 commuters, 23.5%), 45 to 59 minutes (13 commuters, 19.1%), and 15 to 19 minutes (12 commuters, 17.6%).
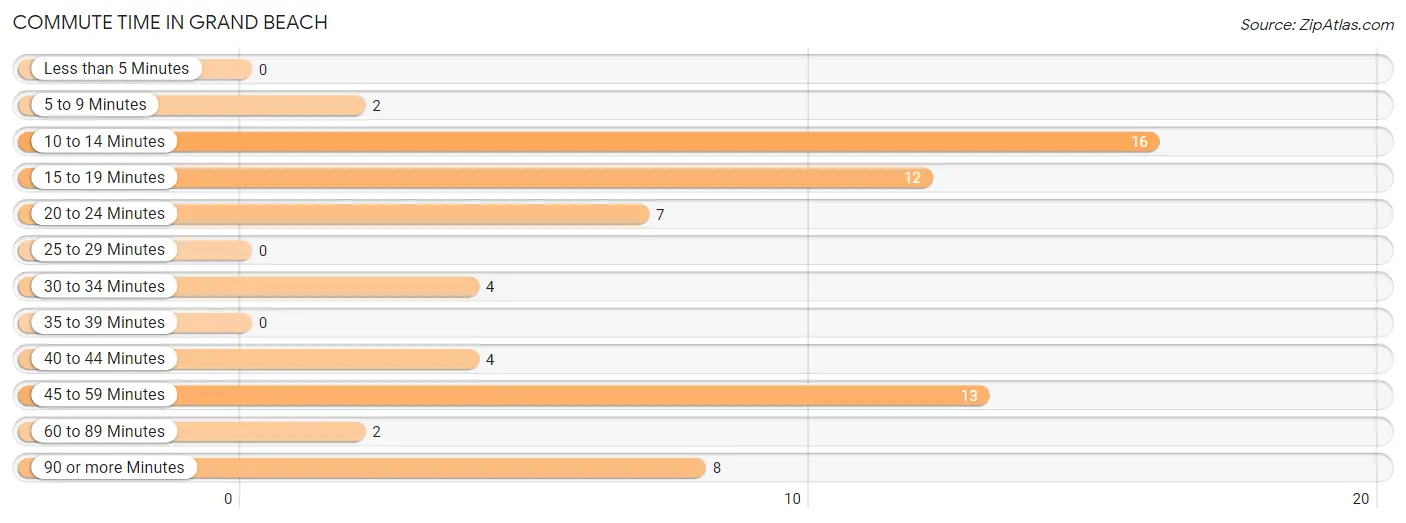
| Commute Time | # Commuters | % Commuters |
| Less than 5 Minutes | 0 | 0.0% |
| 5 to 9 Minutes | 2 | 2.9% |
| 10 to 14 Minutes | 16 | 23.5% |
| 15 to 19 Minutes | 12 | 17.6% |
| 20 to 24 Minutes | 7 | 10.3% |
| 25 to 29 Minutes | 0 | 0.0% |
| 30 to 34 Minutes | 4 | 5.9% |
| 35 to 39 Minutes | 0 | 0.0% |
| 40 to 44 Minutes | 4 | 5.9% |
| 45 to 59 Minutes | 13 | 19.1% |
| 60 to 89 Minutes | 2 | 2.9% |
| 90 or more Minutes | 8 | 11.8% |
Commute Time by Sex in Grand Beach
The most common commute times in Grand Beach are 15 to 19 minutes (12 commuters, 24.0%) for males and 10 to 14 minutes (7 commuters, 38.9%) for females.
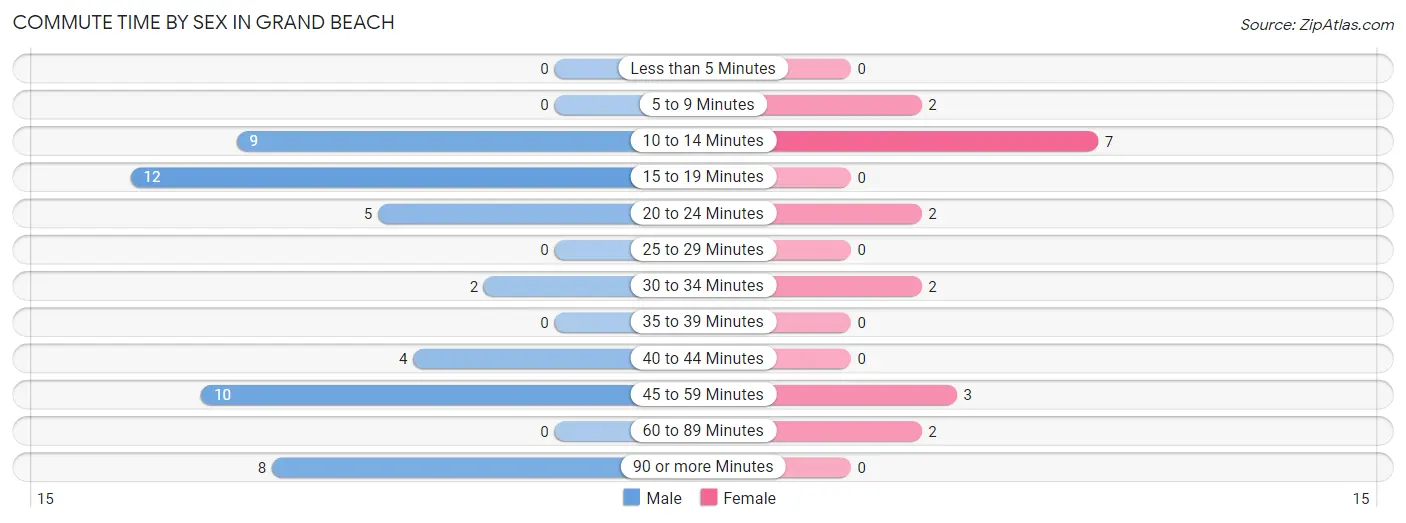
| Commute Time | Male | Female |
| Less than 5 Minutes | 0 (0.0%) | 0 (0.0%) |
| 5 to 9 Minutes | 0 (0.0%) | 2 (11.1%) |
| 10 to 14 Minutes | 9 (18.0%) | 7 (38.9%) |
| 15 to 19 Minutes | 12 (24.0%) | 0 (0.0%) |
| 20 to 24 Minutes | 5 (10.0%) | 2 (11.1%) |
| 25 to 29 Minutes | 0 (0.0%) | 0 (0.0%) |
| 30 to 34 Minutes | 2 (4.0%) | 2 (11.1%) |
| 35 to 39 Minutes | 0 (0.0%) | 0 (0.0%) |
| 40 to 44 Minutes | 4 (8.0%) | 0 (0.0%) |
| 45 to 59 Minutes | 10 (20.0%) | 3 (16.7%) |
| 60 to 89 Minutes | 0 (0.0%) | 2 (11.1%) |
| 90 or more Minutes | 8 (16.0%) | 0 (0.0%) |
Time of Departure to Work by Sex in Grand Beach
The most frequent times of departure to work in Grand Beach are 8:00 AM to 8:29 AM (19, 38.0%) for males and 7:00 AM to 7:29 AM (5, 27.8%) for females.
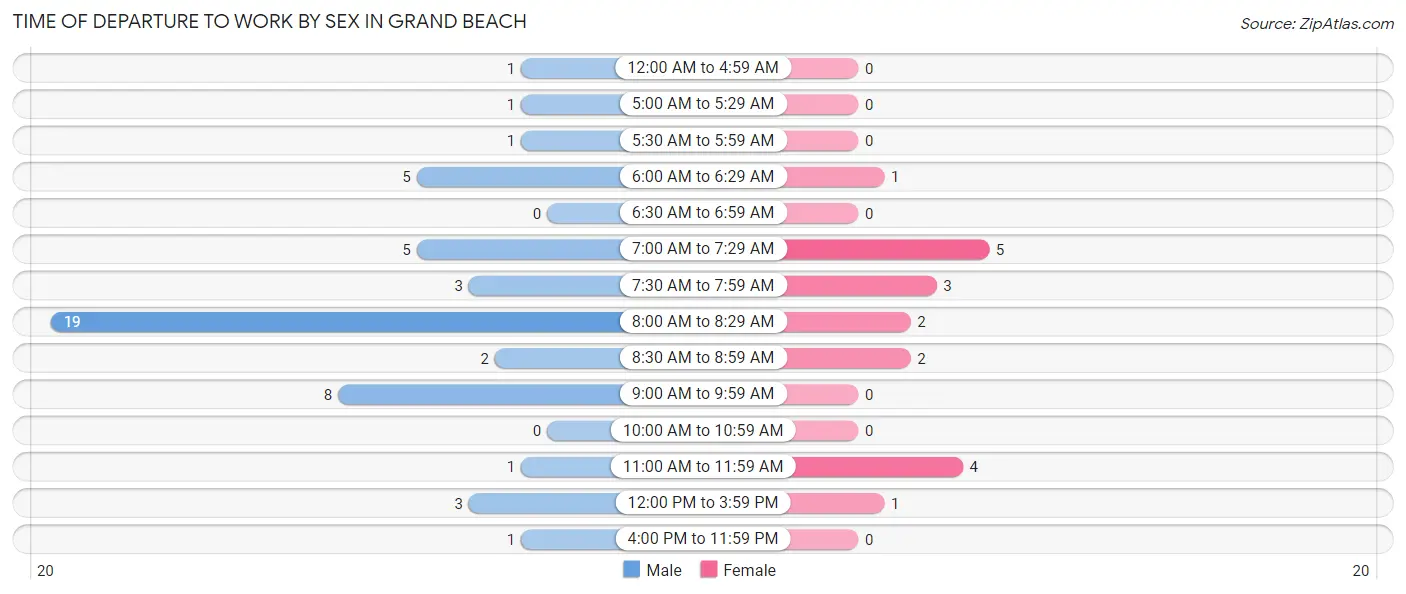
| Time of Departure | Male | Female |
| 12:00 AM to 4:59 AM | 1 (2.0%) | 0 (0.0%) |
| 5:00 AM to 5:29 AM | 1 (2.0%) | 0 (0.0%) |
| 5:30 AM to 5:59 AM | 1 (2.0%) | 0 (0.0%) |
| 6:00 AM to 6:29 AM | 5 (10.0%) | 1 (5.6%) |
| 6:30 AM to 6:59 AM | 0 (0.0%) | 0 (0.0%) |
| 7:00 AM to 7:29 AM | 5 (10.0%) | 5 (27.8%) |
| 7:30 AM to 7:59 AM | 3 (6.0%) | 3 (16.7%) |
| 8:00 AM to 8:29 AM | 19 (38.0%) | 2 (11.1%) |
| 8:30 AM to 8:59 AM | 2 (4.0%) | 2 (11.1%) |
| 9:00 AM to 9:59 AM | 8 (16.0%) | 0 (0.0%) |
| 10:00 AM to 10:59 AM | 0 (0.0%) | 0 (0.0%) |
| 11:00 AM to 11:59 AM | 1 (2.0%) | 4 (22.2%) |
| 12:00 PM to 3:59 PM | 3 (6.0%) | 1 (5.6%) |
| 4:00 PM to 11:59 PM | 1 (2.0%) | 0 (0.0%) |
| Total | 50 (100.0%) | 18 (100.0%) |
Housing Occupancy in Grand Beach
Occupancy by Ownership in Grand Beach
Of the total 209 dwellings in Grand Beach, owner-occupied units account for 206 (98.6%), while renter-occupied units make up 3 (1.4%).
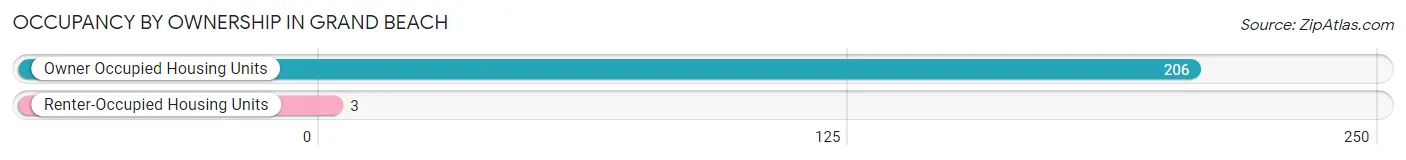
| Occupancy | # Housing Units | % Housing Units |
| Owner Occupied Housing Units | 206 | 98.6% |
| Renter-Occupied Housing Units | 3 | 1.4% |
| Total Occupied Housing Units | 209 | 100.0% |
Occupancy by Household Size in Grand Beach
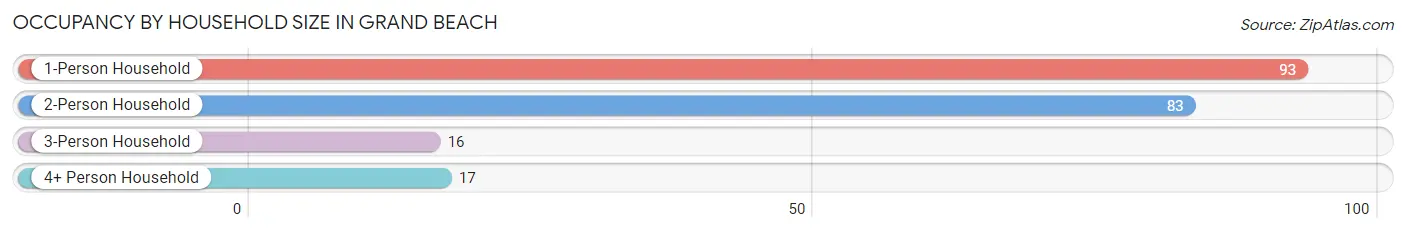
| Household Size | # Housing Units | % Housing Units |
| 1-Person Household | 93 | 44.5% |
| 2-Person Household | 83 | 39.7% |
| 3-Person Household | 16 | 7.7% |
| 4+ Person Household | 17 | 8.1% |
| Total Housing Units | 209 | 100.0% |
Occupancy by Ownership by Household Size in Grand Beach
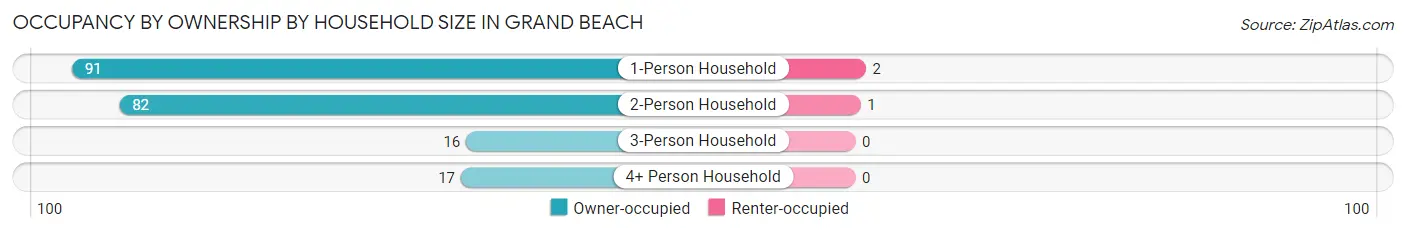
| Household Size | Owner-occupied | Renter-occupied |
| 1-Person Household | 91 (97.9%) | 2 (2.1%) |
| 2-Person Household | 82 (98.8%) | 1 (1.2%) |
| 3-Person Household | 16 (100.0%) | 0 (0.0%) |
| 4+ Person Household | 17 (100.0%) | 0 (0.0%) |
| Total Housing Units | 206 (98.6%) | 3 (1.4%) |
Occupancy by Educational Attainment in Grand Beach
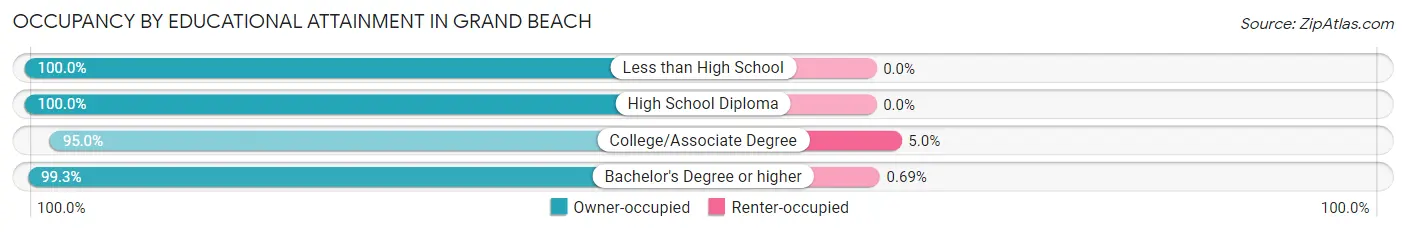
| Household Size | Owner-occupied | Renter-occupied |
| Less than High School | 2 (100.0%) | 0 (0.0%) |
| High School Diploma | 23 (100.0%) | 0 (0.0%) |
| College/Associate Degree | 38 (95.0%) | 2 (5.0%) |
| Bachelor's Degree or higher | 143 (99.3%) | 1 (0.7%) |
Occupancy by Age of Householder in Grand Beach
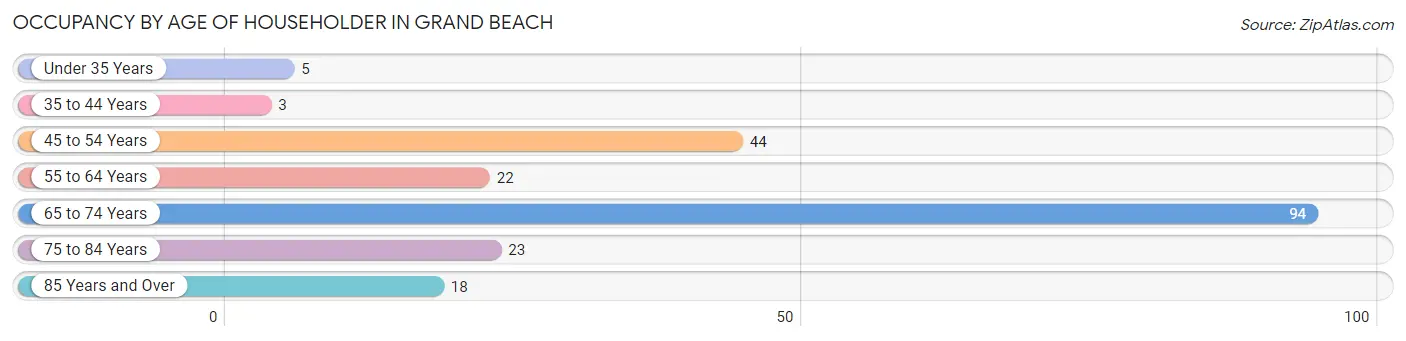
| Age Bracket | # Households | % Households |
| Under 35 Years | 5 | 2.4% |
| 35 to 44 Years | 3 | 1.4% |
| 45 to 54 Years | 44 | 21.0% |
| 55 to 64 Years | 22 | 10.5% |
| 65 to 74 Years | 94 | 45.0% |
| 75 to 84 Years | 23 | 11.0% |
| 85 Years and Over | 18 | 8.6% |
| Total | 209 | 100.0% |
Housing Finances in Grand Beach
Median Income by Occupancy in Grand Beach
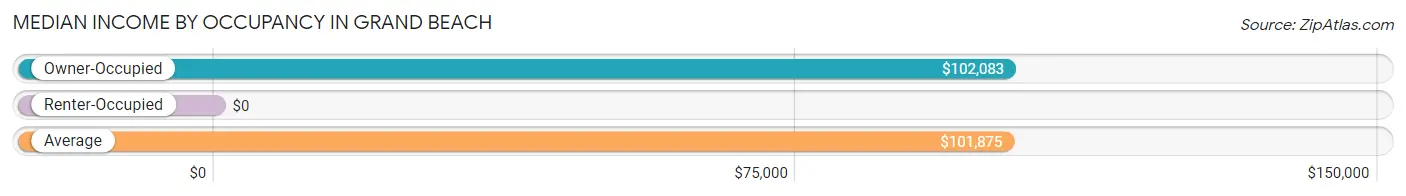
| Occupancy Type | # Households | Median Income |
| Owner-Occupied | 206 (98.6%) | $102,083 |
| Renter-Occupied | 3 (1.4%) | $0 |
| Average | 209 (100.0%) | $101,875 |
Occupancy by Householder Income Bracket in Grand Beach
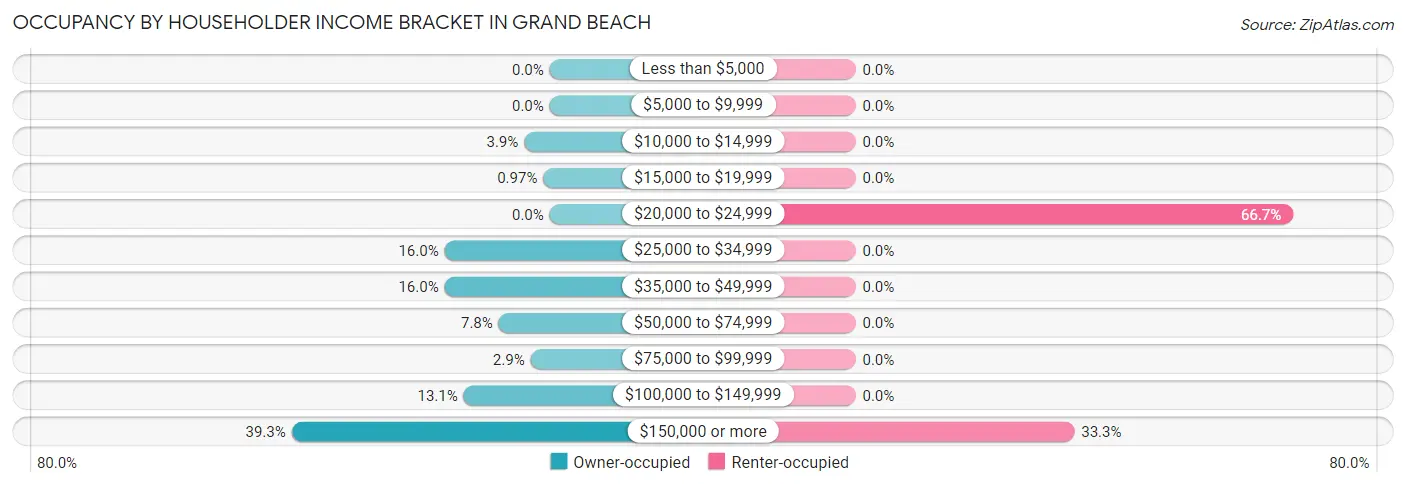
| Income Bracket | Owner-occupied | Renter-occupied |
| Less than $5,000 | 0 (0.0%) | 0 (0.0%) |
| $5,000 to $9,999 | 0 (0.0%) | 0 (0.0%) |
| $10,000 to $14,999 | 8 (3.9%) | 0 (0.0%) |
| $15,000 to $19,999 | 2 (1.0%) | 0 (0.0%) |
| $20,000 to $24,999 | 0 (0.0%) | 2 (66.7%) |
| $25,000 to $34,999 | 33 (16.0%) | 0 (0.0%) |
| $35,000 to $49,999 | 33 (16.0%) | 0 (0.0%) |
| $50,000 to $74,999 | 16 (7.8%) | 0 (0.0%) |
| $75,000 to $99,999 | 6 (2.9%) | 0 (0.0%) |
| $100,000 to $149,999 | 27 (13.1%) | 0 (0.0%) |
| $150,000 or more | 81 (39.3%) | 1 (33.3%) |
| Total | 206 (100.0%) | 3 (100.0%) |
Monthly Housing Cost Tiers in Grand Beach
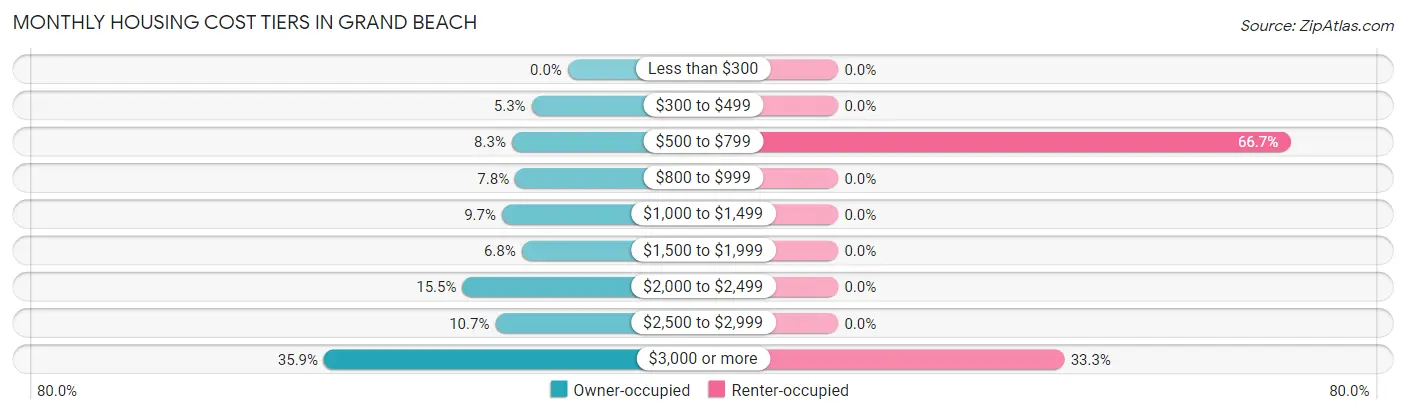
| Monthly Cost | Owner-occupied | Renter-occupied |
| Less than $300 | 0 (0.0%) | 0 (0.0%) |
| $300 to $499 | 11 (5.3%) | 0 (0.0%) |
| $500 to $799 | 17 (8.3%) | 2 (66.7%) |
| $800 to $999 | 16 (7.8%) | 0 (0.0%) |
| $1,000 to $1,499 | 20 (9.7%) | 0 (0.0%) |
| $1,500 to $1,999 | 14 (6.8%) | 0 (0.0%) |
| $2,000 to $2,499 | 32 (15.5%) | 0 (0.0%) |
| $2,500 to $2,999 | 22 (10.7%) | 0 (0.0%) |
| $3,000 or more | 74 (35.9%) | 1 (33.3%) |
| Total | 206 (100.0%) | 3 (100.0%) |
Physical Housing Characteristics in Grand Beach
Housing Structures in Grand Beach
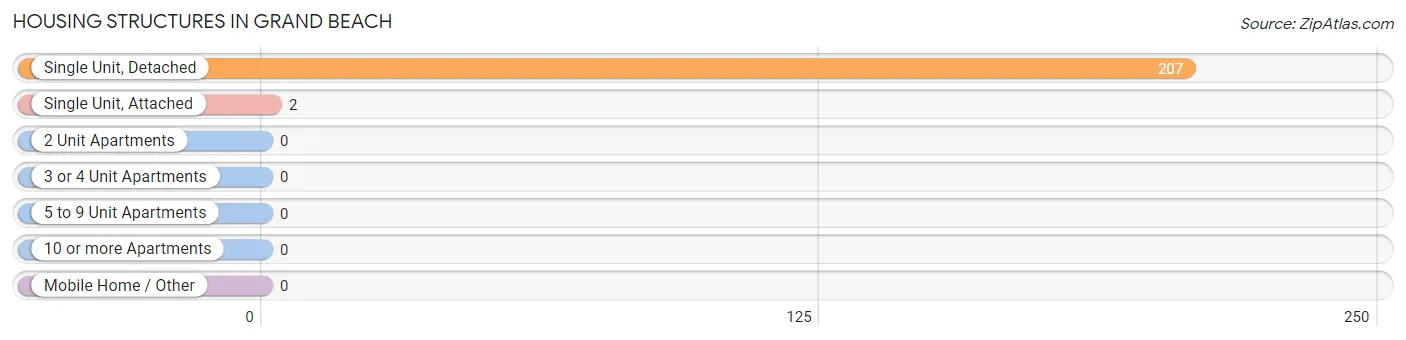
| Structure Type | # Housing Units | % Housing Units |
| Single Unit, Detached | 207 | 99.0% |
| Single Unit, Attached | 2 | 1.0% |
| 2 Unit Apartments | 0 | 0.0% |
| 3 or 4 Unit Apartments | 0 | 0.0% |
| 5 to 9 Unit Apartments | 0 | 0.0% |
| 10 or more Apartments | 0 | 0.0% |
| Mobile Home / Other | 0 | 0.0% |
| Total | 209 | 100.0% |
Housing Structures by Occupancy in Grand Beach
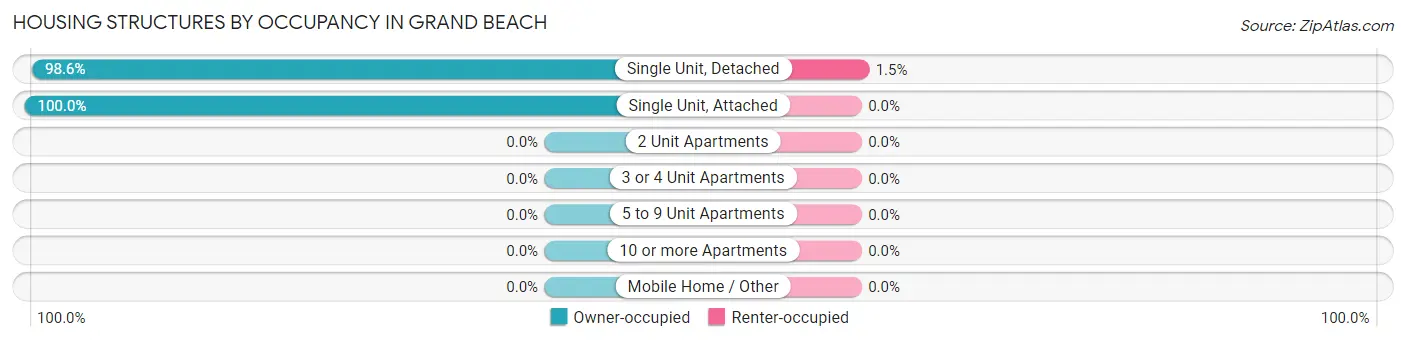
| Structure Type | Owner-occupied | Renter-occupied |
| Single Unit, Detached | 204 (98.6%) | 3 (1.5%) |
| Single Unit, Attached | 2 (100.0%) | 0 (0.0%) |
| 2 Unit Apartments | 0 (0.0%) | 0 (0.0%) |
| 3 or 4 Unit Apartments | 0 (0.0%) | 0 (0.0%) |
| 5 to 9 Unit Apartments | 0 (0.0%) | 0 (0.0%) |
| 10 or more Apartments | 0 (0.0%) | 0 (0.0%) |
| Mobile Home / Other | 0 (0.0%) | 0 (0.0%) |
| Total | 206 (98.6%) | 3 (1.4%) |
Housing Structures by Number of Rooms in Grand Beach
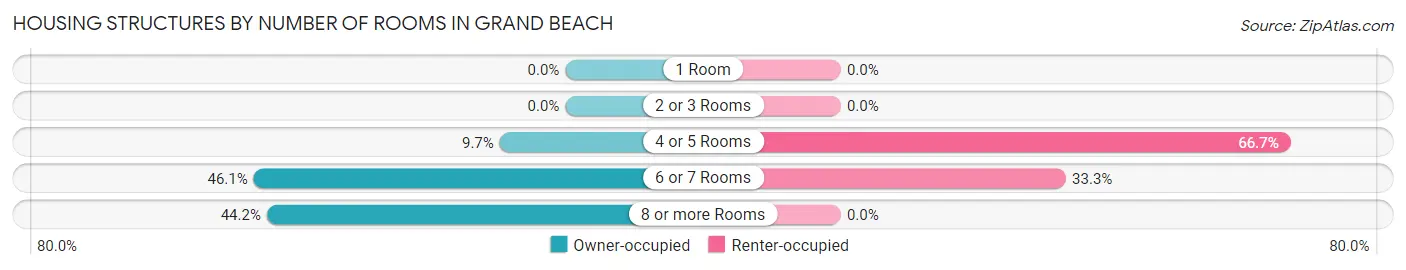
| Number of Rooms | Owner-occupied | Renter-occupied |
| 1 Room | 0 (0.0%) | 0 (0.0%) |
| 2 or 3 Rooms | 0 (0.0%) | 0 (0.0%) |
| 4 or 5 Rooms | 20 (9.7%) | 2 (66.7%) |
| 6 or 7 Rooms | 95 (46.1%) | 1 (33.3%) |
| 8 or more Rooms | 91 (44.2%) | 0 (0.0%) |
| Total | 206 (100.0%) | 3 (100.0%) |
Housing Structure by Heating Type in Grand Beach
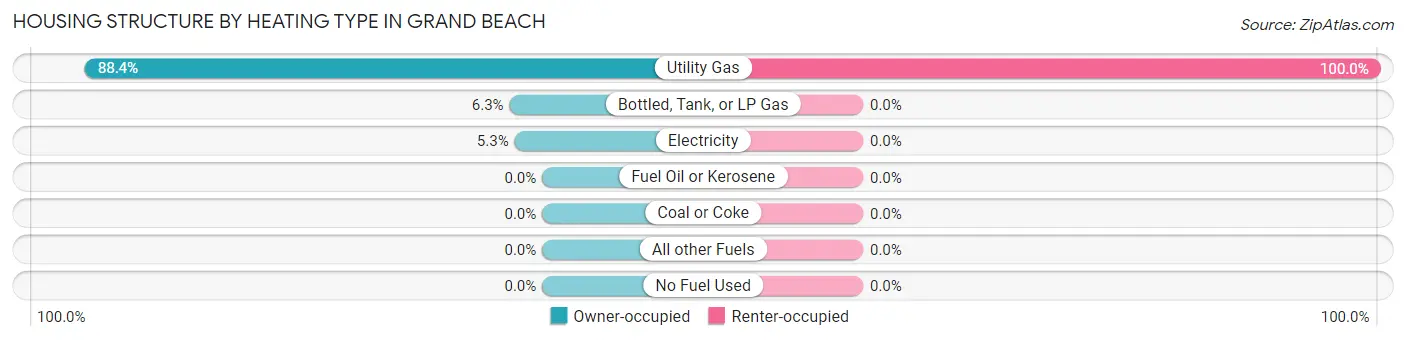
| Heating Type | Owner-occupied | Renter-occupied |
| Utility Gas | 182 (88.3%) | 3 (100.0%) |
| Bottled, Tank, or LP Gas | 13 (6.3%) | 0 (0.0%) |
| Electricity | 11 (5.3%) | 0 (0.0%) |
| Fuel Oil or Kerosene | 0 (0.0%) | 0 (0.0%) |
| Coal or Coke | 0 (0.0%) | 0 (0.0%) |
| All other Fuels | 0 (0.0%) | 0 (0.0%) |
| No Fuel Used | 0 (0.0%) | 0 (0.0%) |
| Total | 206 (100.0%) | 3 (100.0%) |
Household Vehicle Usage in Grand Beach
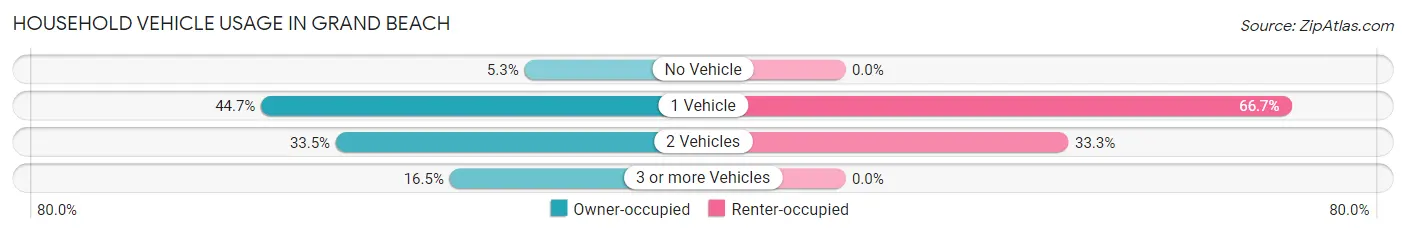
| Vehicles per Household | Owner-occupied | Renter-occupied |
| No Vehicle | 11 (5.3%) | 0 (0.0%) |
| 1 Vehicle | 92 (44.7%) | 2 (66.7%) |
| 2 Vehicles | 69 (33.5%) | 1 (33.3%) |
| 3 or more Vehicles | 34 (16.5%) | 0 (0.0%) |
| Total | 206 (100.0%) | 3 (100.0%) |
Real Estate & Mortgages in Grand Beach
Real Estate and Mortgage Overview in Grand Beach
| Characteristic | Without Mortgage | With Mortgage |
| Housing Units | 106 | 100 |
| Median Property Value | $911,800 | $1,041,700 |
| Median Household Income | $88,750 | $45 |
| Monthly Housing Costs | $1,425 | $72 |
| Real Estate Taxes | $10,001 | $0 |
Property Value by Mortgage Status in Grand Beach
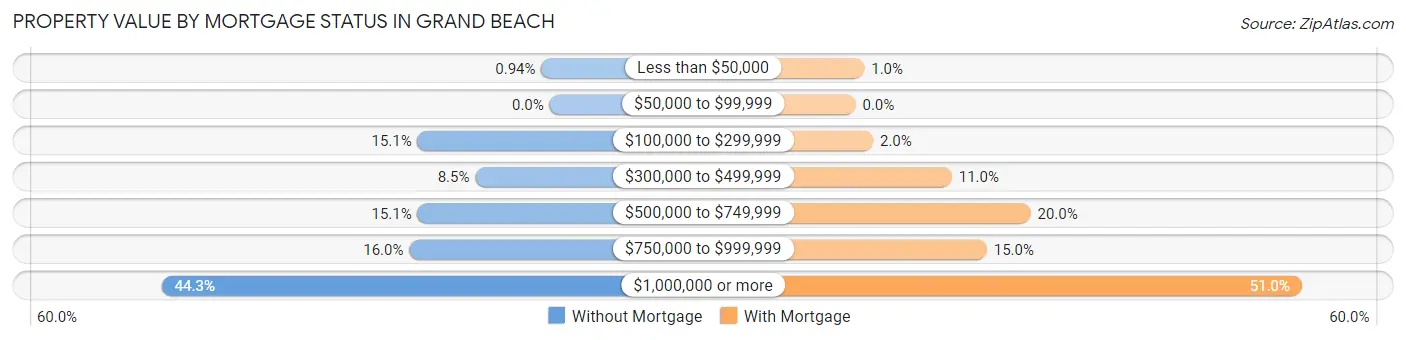
| Property Value | Without Mortgage | With Mortgage |
| Less than $50,000 | 1 (0.9%) | 1 (1.0%) |
| $50,000 to $99,999 | 0 (0.0%) | 0 (0.0%) |
| $100,000 to $299,999 | 16 (15.1%) | 2 (2.0%) |
| $300,000 to $499,999 | 9 (8.5%) | 11 (11.0%) |
| $500,000 to $749,999 | 16 (15.1%) | 20 (20.0%) |
| $750,000 to $999,999 | 17 (16.0%) | 15 (15.0%) |
| $1,000,000 or more | 47 (44.3%) | 51 (51.0%) |
| Total | 106 (100.0%) | 100 (100.0%) |
Household Income by Mortgage Status in Grand Beach
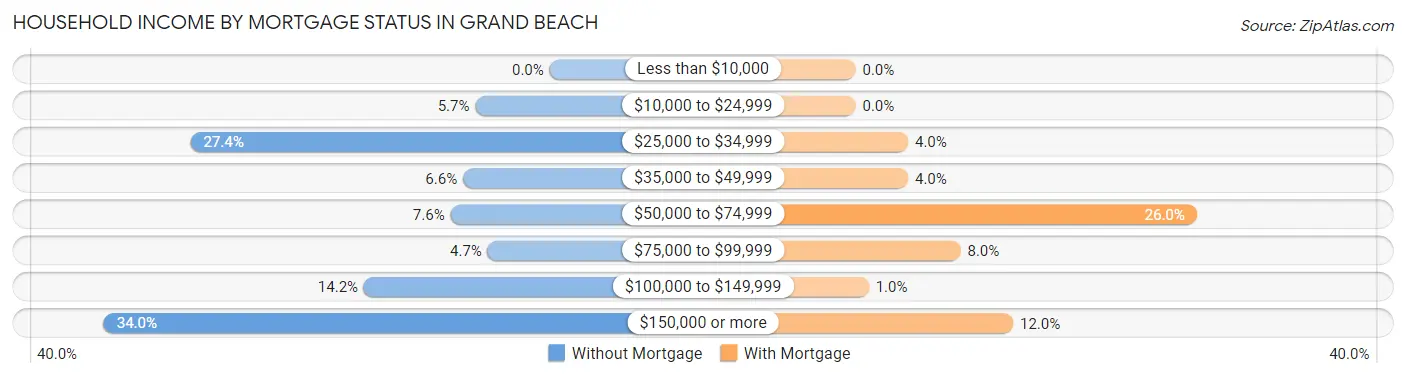
| Household Income | Without Mortgage | With Mortgage |
| Less than $10,000 | 0 (0.0%) | 0 (0.0%) |
| $10,000 to $24,999 | 6 (5.7%) | 0 (0.0%) |
| $25,000 to $34,999 | 29 (27.4%) | 4 (4.0%) |
| $35,000 to $49,999 | 7 (6.6%) | 4 (4.0%) |
| $50,000 to $74,999 | 8 (7.5%) | 26 (26.0%) |
| $75,000 to $99,999 | 5 (4.7%) | 8 (8.0%) |
| $100,000 to $149,999 | 15 (14.1%) | 1 (1.0%) |
| $150,000 or more | 36 (34.0%) | 12 (12.0%) |
| Total | 106 (100.0%) | 100 (100.0%) |
Property Value to Household Income Ratio in Grand Beach
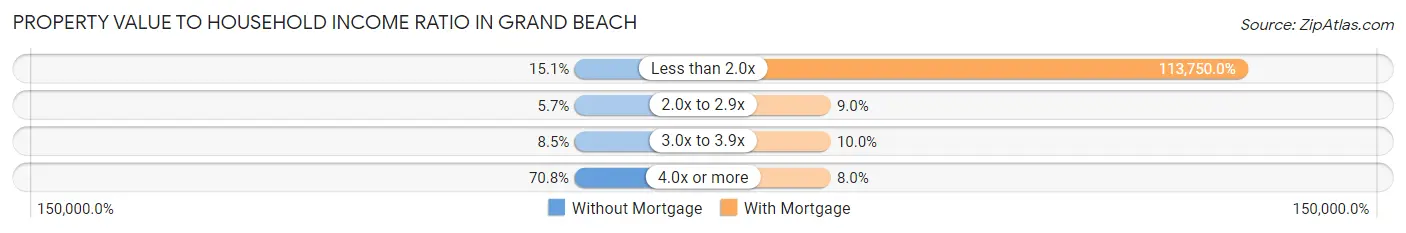
| Value-to-Income Ratio | Without Mortgage | With Mortgage |
| Less than 2.0x | 16 (15.1%) | 113,750 (113,750.0%) |
| 2.0x to 2.9x | 6 (5.7%) | 9 (9.0%) |
| 3.0x to 3.9x | 9 (8.5%) | 10 (10.0%) |
| 4.0x or more | 75 (70.8%) | 8 (8.0%) |
| Total | 106 (100.0%) | 100 (100.0%) |
Real Estate Taxes by Mortgage Status in Grand Beach
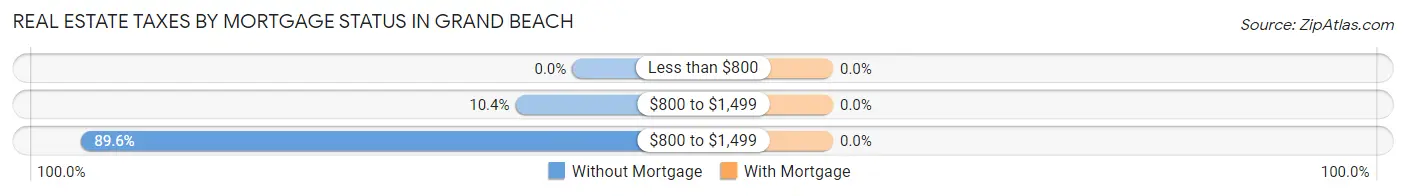
| Property Taxes | Without Mortgage | With Mortgage |
| Less than $800 | 0 (0.0%) | 0 (0.0%) |
| $800 to $1,499 | 11 (10.4%) | 0 (0.0%) |
| $800 to $1,499 | 95 (89.6%) | 0 (0.0%) |
| Total | 106 (100.0%) | 100 (100.0%) |
Health & Disability in Grand Beach
Health Insurance Coverage by Age in Grand Beach
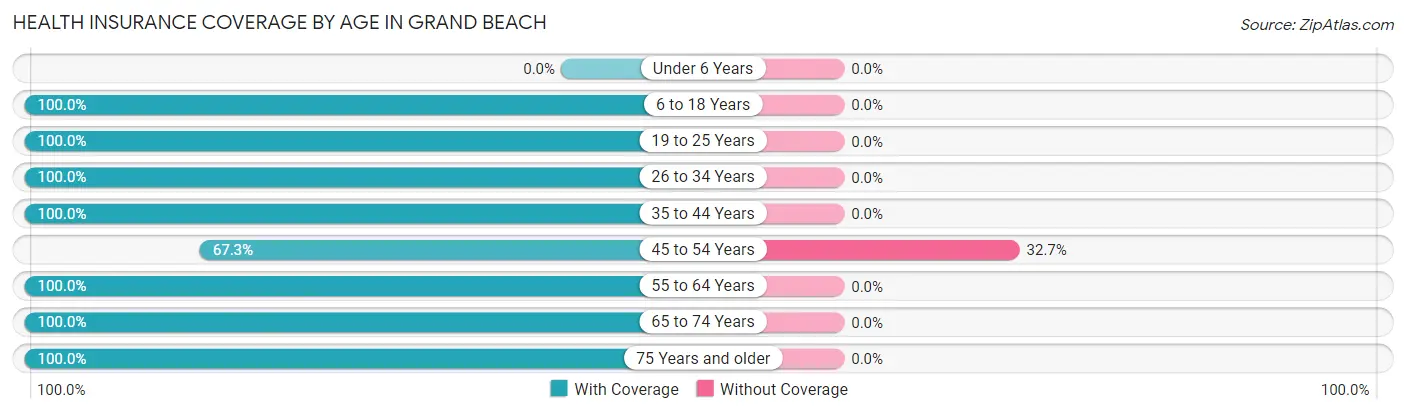
| Age Bracket | With Coverage | Without Coverage |
| Under 6 Years | 0 (0.0%) | 0 (0.0%) |
| 6 to 18 Years | 32 (100.0%) | 0 (0.0%) |
| 19 to 25 Years | 7 (100.0%) | 0 (0.0%) |
| 26 to 34 Years | 14 (100.0%) | 0 (0.0%) |
| 35 to 44 Years | 26 (100.0%) | 0 (0.0%) |
| 45 to 54 Years | 35 (67.3%) | 17 (32.7%) |
| 55 to 64 Years | 59 (100.0%) | 0 (0.0%) |
| 65 to 74 Years | 129 (100.0%) | 0 (0.0%) |
| 75 Years and older | 58 (100.0%) | 0 (0.0%) |
| Total | 360 (95.5%) | 17 (4.5%) |
Health Insurance Coverage by Citizenship Status in Grand Beach
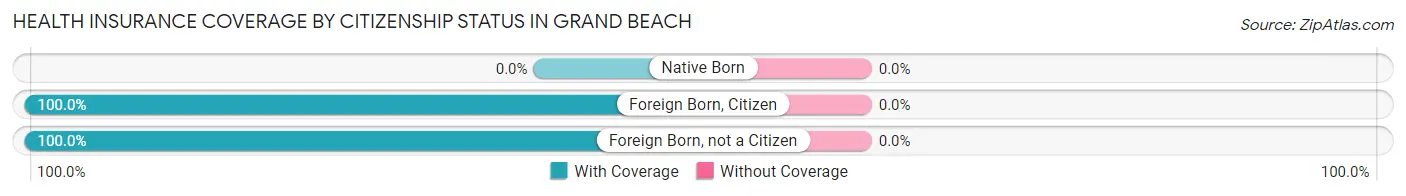
| Citizenship Status | With Coverage | Without Coverage |
| Native Born | 0 (0.0%) | 0 (0.0%) |
| Foreign Born, Citizen | 32 (100.0%) | 0 (0.0%) |
| Foreign Born, not a Citizen | 7 (100.0%) | 0 (0.0%) |
Health Insurance Coverage by Household Income in Grand Beach
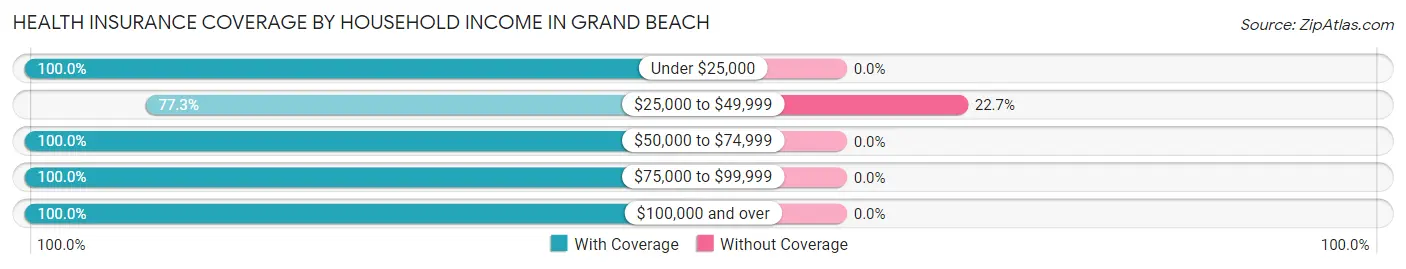
| Household Income | With Coverage | Without Coverage |
| Under $25,000 | 14 (100.0%) | 0 (0.0%) |
| $25,000 to $49,999 | 58 (77.3%) | 17 (22.7%) |
| $50,000 to $74,999 | 23 (100.0%) | 0 (0.0%) |
| $75,000 to $99,999 | 9 (100.0%) | 0 (0.0%) |
| $100,000 and over | 256 (100.0%) | 0 (0.0%) |
Public vs Private Health Insurance Coverage by Age in Grand Beach
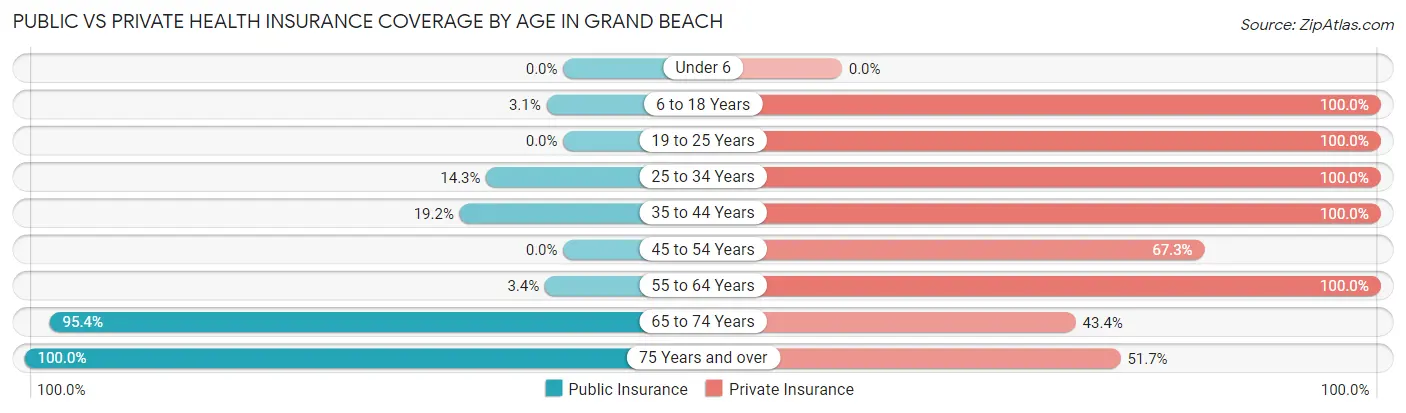
| Age Bracket | Public Insurance | Private Insurance |
| Under 6 | 0 (0.0%) | 0 (0.0%) |
| 6 to 18 Years | 1 (3.1%) | 32 (100.0%) |
| 19 to 25 Years | 0 (0.0%) | 7 (100.0%) |
| 25 to 34 Years | 2 (14.3%) | 14 (100.0%) |
| 35 to 44 Years | 5 (19.2%) | 26 (100.0%) |
| 45 to 54 Years | 0 (0.0%) | 35 (67.3%) |
| 55 to 64 Years | 2 (3.4%) | 59 (100.0%) |
| 65 to 74 Years | 123 (95.4%) | 56 (43.4%) |
| 75 Years and over | 58 (100.0%) | 30 (51.7%) |
| Total | 191 (50.7%) | 259 (68.7%) |
Disability Status by Sex by Age in Grand Beach
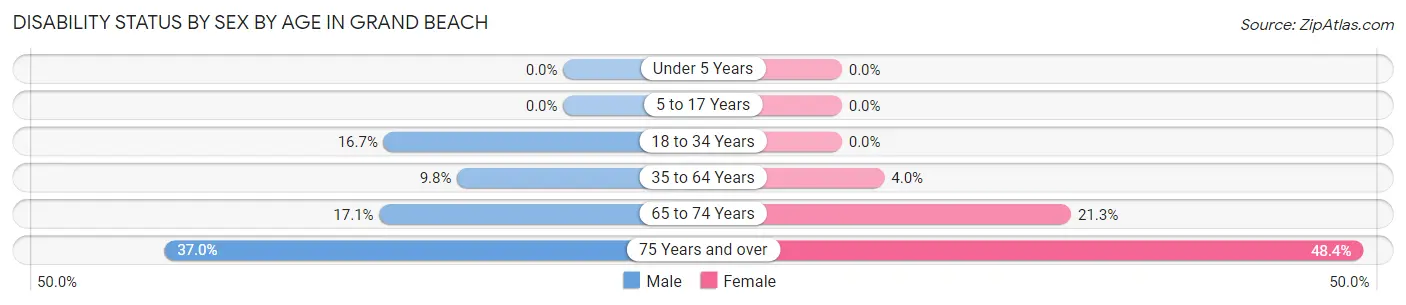
| Age Bracket | Male | Female |
| Under 5 Years | 0 (0.0%) | 0 (0.0%) |
| 5 to 17 Years | 0 (0.0%) | 0 (0.0%) |
| 18 to 34 Years | 2 (16.7%) | 0 (0.0%) |
| 35 to 64 Years | 6 (9.8%) | 3 (4.0%) |
| 65 to 74 Years | 14 (17.1%) | 10 (21.3%) |
| 75 Years and over | 10 (37.0%) | 15 (48.4%) |
Disability Class by Sex by Age in Grand Beach
Disability Class: Hearing Difficulty
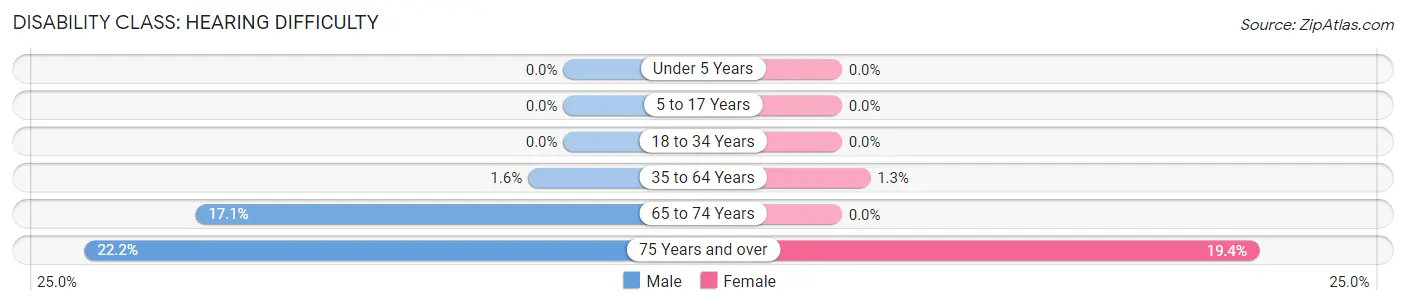
| Age Bracket | Male | Female |
| Under 5 Years | 0 (0.0%) | 0 (0.0%) |
| 5 to 17 Years | 0 (0.0%) | 0 (0.0%) |
| 18 to 34 Years | 0 (0.0%) | 0 (0.0%) |
| 35 to 64 Years | 1 (1.6%) | 1 (1.3%) |
| 65 to 74 Years | 14 (17.1%) | 0 (0.0%) |
| 75 Years and over | 6 (22.2%) | 6 (19.4%) |
Disability Class: Vision Difficulty
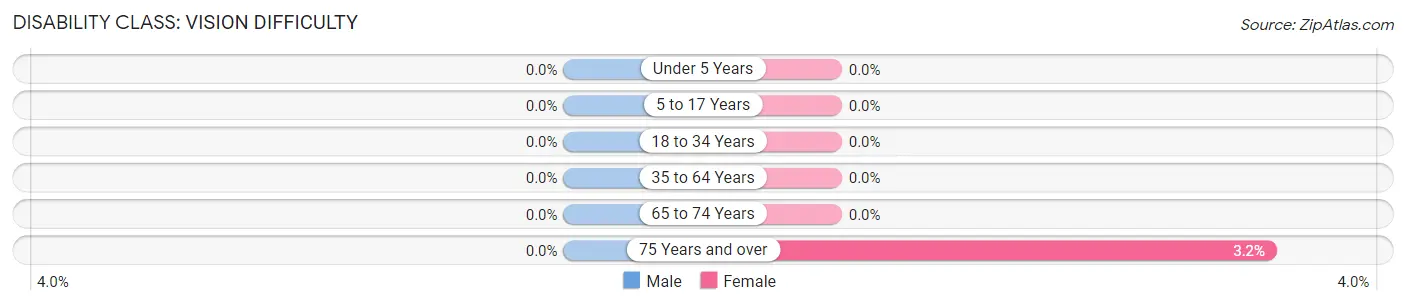
| Age Bracket | Male | Female |
| Under 5 Years | 0 (0.0%) | 0 (0.0%) |
| 5 to 17 Years | 0 (0.0%) | 0 (0.0%) |
| 18 to 34 Years | 0 (0.0%) | 0 (0.0%) |
| 35 to 64 Years | 0 (0.0%) | 0 (0.0%) |
| 65 to 74 Years | 0 (0.0%) | 0 (0.0%) |
| 75 Years and over | 0 (0.0%) | 1 (3.2%) |
Disability Class: Cognitive Difficulty
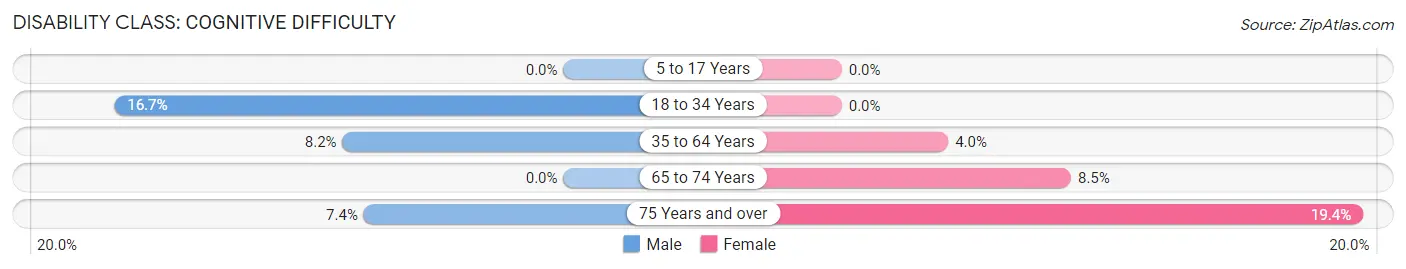
| Age Bracket | Male | Female |
| 5 to 17 Years | 0 (0.0%) | 0 (0.0%) |
| 18 to 34 Years | 2 (16.7%) | 0 (0.0%) |
| 35 to 64 Years | 5 (8.2%) | 3 (4.0%) |
| 65 to 74 Years | 0 (0.0%) | 4 (8.5%) |
| 75 Years and over | 2 (7.4%) | 6 (19.4%) |
Disability Class: Ambulatory Difficulty
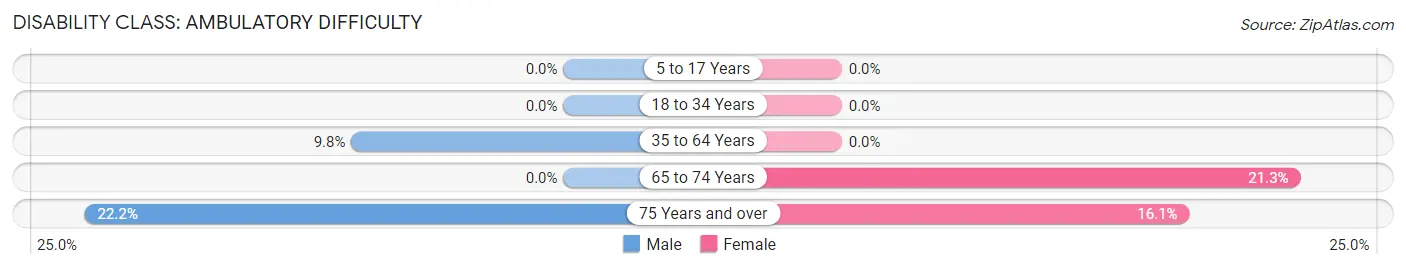
| Age Bracket | Male | Female |
| 5 to 17 Years | 0 (0.0%) | 0 (0.0%) |
| 18 to 34 Years | 0 (0.0%) | 0 (0.0%) |
| 35 to 64 Years | 6 (9.8%) | 0 (0.0%) |
| 65 to 74 Years | 0 (0.0%) | 10 (21.3%) |
| 75 Years and over | 6 (22.2%) | 5 (16.1%) |
Disability Class: Self-Care Difficulty
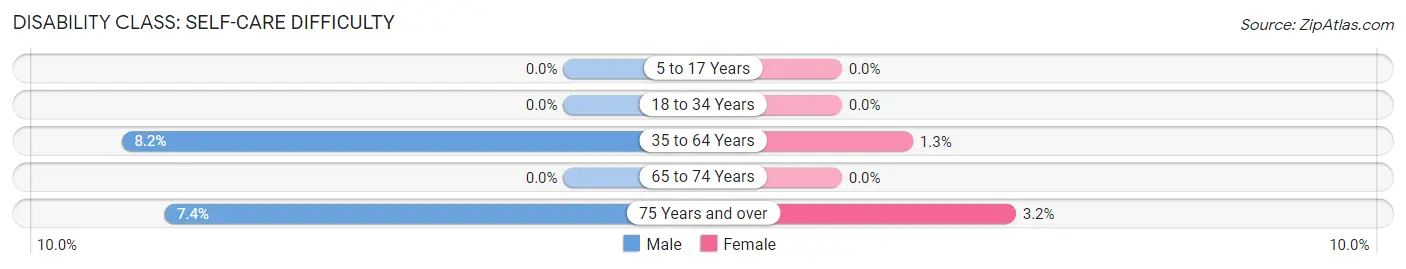
| Age Bracket | Male | Female |
| 5 to 17 Years | 0 (0.0%) | 0 (0.0%) |
| 18 to 34 Years | 0 (0.0%) | 0 (0.0%) |
| 35 to 64 Years | 5 (8.2%) | 1 (1.3%) |
| 65 to 74 Years | 0 (0.0%) | 0 (0.0%) |
| 75 Years and over | 2 (7.4%) | 1 (3.2%) |
Technology Access in Grand Beach
Computing Device Access in Grand Beach
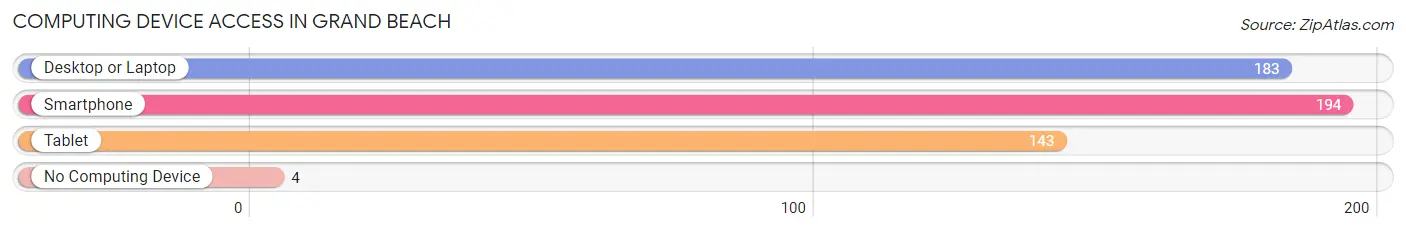
| Device Type | # Households | % Households |
| Desktop or Laptop | 183 | 87.6% |
| Smartphone | 194 | 92.8% |
| Tablet | 143 | 68.4% |
| No Computing Device | 4 | 1.9% |
| Total | 209 | 100.0% |
Internet Access in Grand Beach
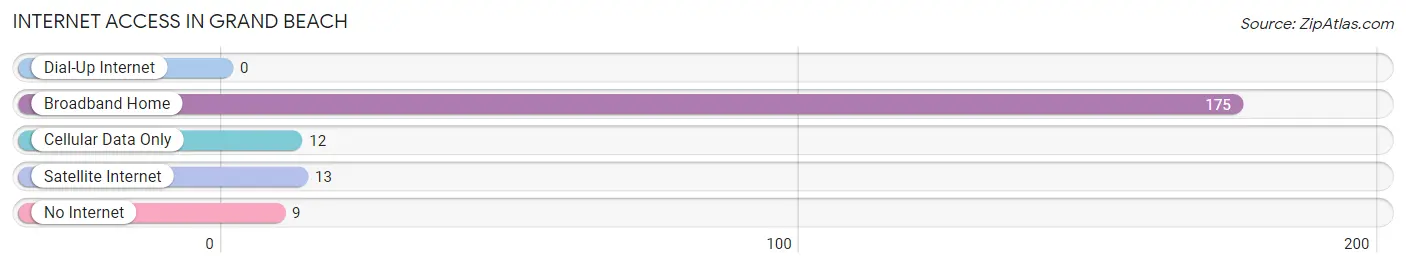
| Internet Type | # Households | % Households |
| Dial-Up Internet | 0 | 0.0% |
| Broadband Home | 175 | 83.7% |
| Cellular Data Only | 12 | 5.7% |
| Satellite Internet | 13 | 6.2% |
| No Internet | 9 | 4.3% |
| Total | 209 | 100.0% |
Grand Beach Summary
Geography
Grand Beach is a small village located in Berrien County, Michigan, United States. It is situated on the eastern shore of Lake Michigan, approximately 25 miles north of the Indiana border. The village is bordered by the townships of Chikaming and Three Oaks. Grand Beach is a popular summer destination for tourists and locals alike, offering a variety of activities and attractions.
The village is situated on a sandy beach, which is the main attraction of the area. The beach is lined with a boardwalk, which is a popular spot for walking, biking, and rollerblading. The beach is also home to a variety of water sports, including swimming, boating, and fishing.
The village is surrounded by a variety of natural features, including forests, wetlands, and dunes. The nearby Warren Dunes State Park is a popular destination for hiking, camping, and other outdoor activities. The park is also home to a variety of wildlife, including deer, foxes, and coyotes.
History
Grand Beach was first settled in the late 1800s by a group of settlers from Indiana. The village was originally known as Grand Beach Station, and was a stop on the Michigan Central Railroad. The village was officially incorporated in 1906.
In the early 1900s, Grand Beach was a popular summer destination for wealthy Chicagoans. The village was home to several grand hotels, including the Grand Beach Hotel and the Grand Beach Casino. The village was also home to a variety of other attractions, including a dance hall, a roller coaster, and a carousel.
In the 1950s, the village began to decline in popularity as a summer destination. The hotels and other attractions closed, and the village became a quiet residential community.
Economy
The economy of Grand Beach is largely based on tourism. The village is home to a variety of hotels, restaurants, and other businesses that cater to tourists. The village is also home to a variety of shops and galleries that sell local art and crafts.
The village is also home to a variety of businesses that provide services to the local community. These businesses include medical offices, banks, and other professional services.
Demographics
As of the 2010 census, the population of Grand Beach was 1,072. The racial makeup of the village was 97.2% White, 0.7% African American, 0.3% Native American, 0.3% Asian, 0.1% Pacific Islander, 0.3% from other races, and 1.2% from two or more races. Hispanic or Latino of any race were 1.7% of the population.
The median household income in Grand Beach was $50,938, and the median family income was $60,000. The per capita income for the village was $25,938. About 8.3% of families and 10.2% of the population were below the poverty line, including 14.3% of those under age 18 and 4.2% of those age 65 or over.
Common Questions
What is Per Capita Income in Grand Beach?
Per Capita income in Grand Beach is $79,777.
What is the Median Family Income in Grand Beach?
Median Family Income in Grand Beach is $165,250.
What is the Median Household income in Grand Beach?
Median Household Income in Grand Beach is $101,875.
What is Inequality or Gini Index in Grand Beach?
Inequality or Gini Index in Grand Beach is 0.50.
What is the Total Population of Grand Beach?
Total Population of Grand Beach is 377.
What is the Total Male Population of Grand Beach?
Total Male Population of Grand Beach is 204.
What is the Total Female Population of Grand Beach?
Total Female Population of Grand Beach is 173.
What is the Ratio of Males per 100 Females in Grand Beach?
There are 117.92 Males per 100 Females in Grand Beach.
What is the Ratio of Females per 100 Males in Grand Beach?
There are 84.80 Females per 100 Males in Grand Beach.
What is the Median Population Age in Grand Beach?
Median Population Age in Grand Beach is 64.8 Years.
What is the Average Family Size in Grand Beach
Average Family Size in Grand Beach is 2.5 People.
What is the Average Household Size in Grand Beach
Average Household Size in Grand Beach is 1.8 People.
How Large is the Labor Force in Grand Beach?
There are 122 People in the Labor Forcein in Grand Beach.
What is the Percentage of People in the Labor Force in Grand Beach?
34.9% of People are in the Labor Force in Grand Beach.
What is the Unemployment Rate in Grand Beach?
Unemployment Rate in Grand Beach is 2.5%.