St James, MI Map & Demographics
St James Map
St James Overview
$35,665
PER CAPITA INCOME
$78,036
AVG FAMILY INCOME
$62,750
AVG HOUSEHOLD INCOME
66.3%
WAGE / INCOME GAP [ % ]
33.7¢/ $1
WAGE / INCOME GAP [ $ ]
0.47
INEQUALITY / GINI INDEX
226
TOTAL POPULATION
80
MALE POPULATION
146
FEMALE POPULATION
54.79
MALES / 100 FEMALES
182.50
FEMALES / 100 MALES
59.3
MEDIAN AGE
2.9
AVG FAMILY SIZE
2.3
AVG HOUSEHOLD SIZE
76
LABOR FORCE [ PEOPLE ]
45.2%
PERCENT IN LABOR FORCE
21.1%
UNEMPLOYMENT RATE
Income in St James
Income Overview in St James
Per Capita Income in St James is $35,665, while median incomes of families and households are $78,036 and $62,750 respectively.
| Characteristic | Number | Measure |
| Per Capita Income | 226 | $35,665 |
| Median Family Income | 61 | $78,036 |
| Mean Family Income | 61 | $105,652 |
| Median Household Income | 99 | $62,750 |
| Mean Household Income | 99 | $83,349 |
| Income Deficit | 61 | $0 |
| Wage / Income Gap (%) | 226 | 66.30% |
| Wage / Income Gap ($) | 226 | 33.70¢ per $1 |
| Gini / Inequality Index | 226 | 0.47 |
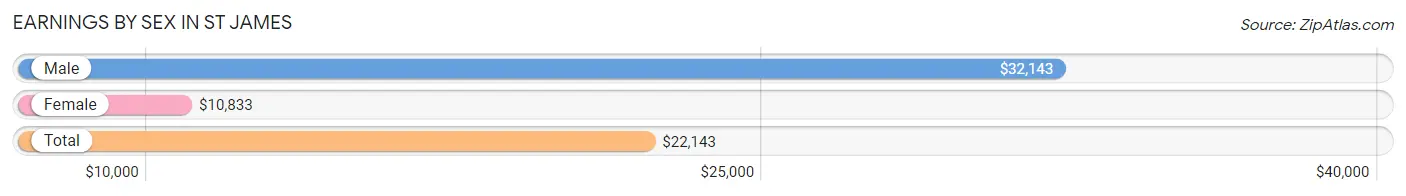
Earnings by Sex in St James
Average Earnings in St James are $22,143, $32,143 for men and $10,833 for women, a difference of 66.3%.
| Sex | Number | Average Earnings |
| Male | 50 (58.1%) | $32,143 |
| Female | 36 (41.9%) | $10,833 |
| Total | 86 (100.0%) | $22,143 |
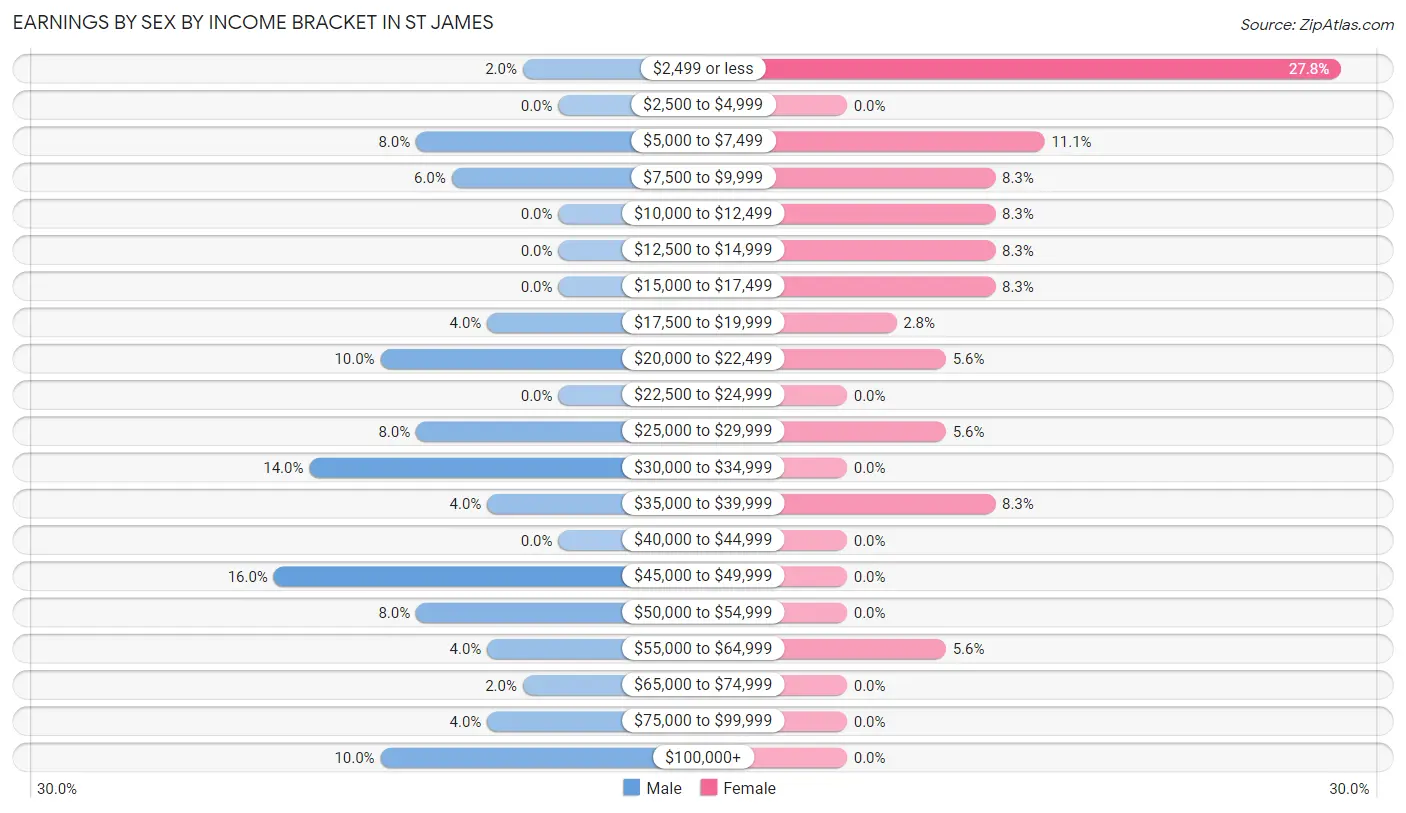
Earnings by Sex by Income Bracket in St James
The most common earnings brackets in St James are $45,000 to $49,999 for men (8 | 16.0%) and $2,499 or less for women (10 | 27.8%).
| Income | Male | Female |
| $2,499 or less | 1 (2.0%) | 10 (27.8%) |
| $2,500 to $4,999 | 0 (0.0%) | 0 (0.0%) |
| $5,000 to $7,499 | 4 (8.0%) | 4 (11.1%) |
| $7,500 to $9,999 | 3 (6.0%) | 3 (8.3%) |
| $10,000 to $12,499 | 0 (0.0%) | 3 (8.3%) |
| $12,500 to $14,999 | 0 (0.0%) | 3 (8.3%) |
| $15,000 to $17,499 | 0 (0.0%) | 3 (8.3%) |
| $17,500 to $19,999 | 2 (4.0%) | 1 (2.8%) |
| $20,000 to $22,499 | 5 (10.0%) | 2 (5.6%) |
| $22,500 to $24,999 | 0 (0.0%) | 0 (0.0%) |
| $25,000 to $29,999 | 4 (8.0%) | 2 (5.6%) |
| $30,000 to $34,999 | 7 (14.0%) | 0 (0.0%) |
| $35,000 to $39,999 | 2 (4.0%) | 3 (8.3%) |
| $40,000 to $44,999 | 0 (0.0%) | 0 (0.0%) |
| $45,000 to $49,999 | 8 (16.0%) | 0 (0.0%) |
| $50,000 to $54,999 | 4 (8.0%) | 0 (0.0%) |
| $55,000 to $64,999 | 2 (4.0%) | 2 (5.6%) |
| $65,000 to $74,999 | 1 (2.0%) | 0 (0.0%) |
| $75,000 to $99,999 | 2 (4.0%) | 0 (0.0%) |
| $100,000+ | 5 (10.0%) | 0 (0.0%) |
| Total | 50 (100.0%) | 36 (100.0%) |
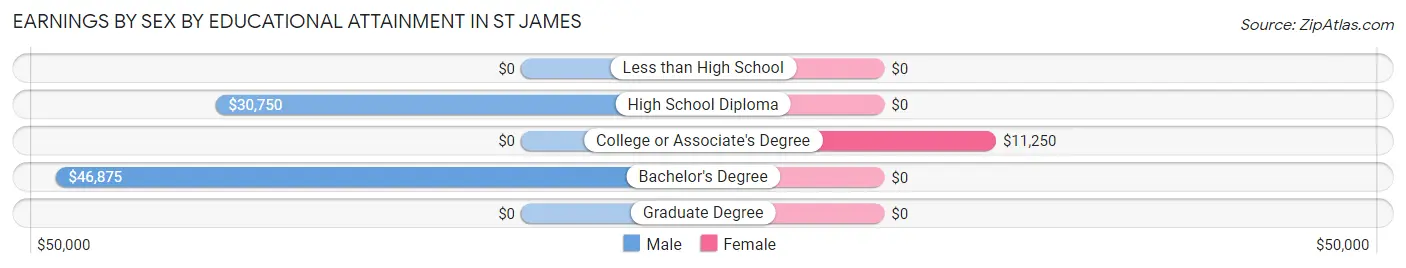
Earnings by Sex by Educational Attainment in St James
Average earnings in St James are $36,250 for men and $11,250 for women, a difference of 69.0%. Men with an educational attainment of bachelor's degree enjoy the highest average annual earnings of $46,875, while those with high school diploma education earn the least with $30,750. Women with an educational attainment of college or associate's degree earn the most with the average annual earnings of $11,250, while those with college or associate's degree education have the smallest earnings of $11,250.
| Educational Attainment | Male Income | Female Income |
| Less than High School | - | - |
| High School Diploma | $30,750 | $0 |
| College or Associate's Degree | - | - |
| Bachelor's Degree | $46,875 | $0 |
| Graduate Degree | - | - |
| Total | $36,250 | $11,250 |
Family Income in St James
Family Income Brackets in St James
According to the St James family income data, there are 14 families falling into the $50,000 to $74,999 income range, which is the most common income bracket and makes up 23.0% of all families.
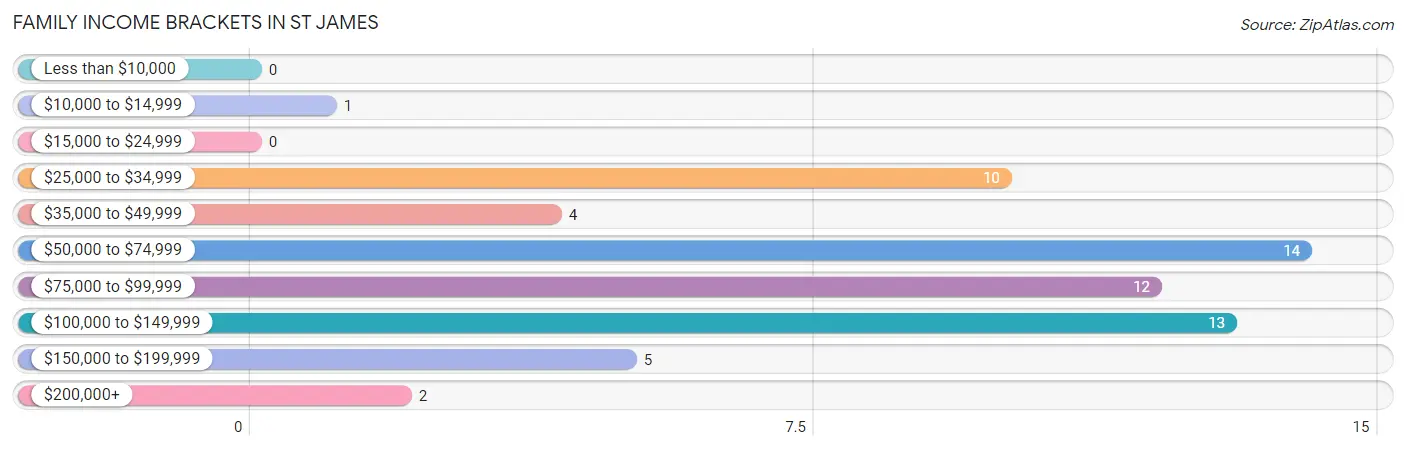
| Income Bracket | # Families | % Families |
| Less than $10,000 | 0 | 0.0% |
| $10,000 to $14,999 | 1 | 1.6% |
| $15,000 to $24,999 | 0 | 0.0% |
| $25,000 to $34,999 | 10 | 16.4% |
| $35,000 to $49,999 | 4 | 6.6% |
| $50,000 to $74,999 | 14 | 23.0% |
| $75,000 to $99,999 | 12 | 19.7% |
| $100,000 to $149,999 | 13 | 21.3% |
| $150,000 to $199,999 | 5 | 8.2% |
| $200,000+ | 2 | 3.3% |
Family Income by Famaliy Size in St James
2-person families (43 | 70.5%) account for the highest median family income in St James with $77,679 per family, while 2-person families (43 | 70.5%) have the highest median income of $38,840 per family member.
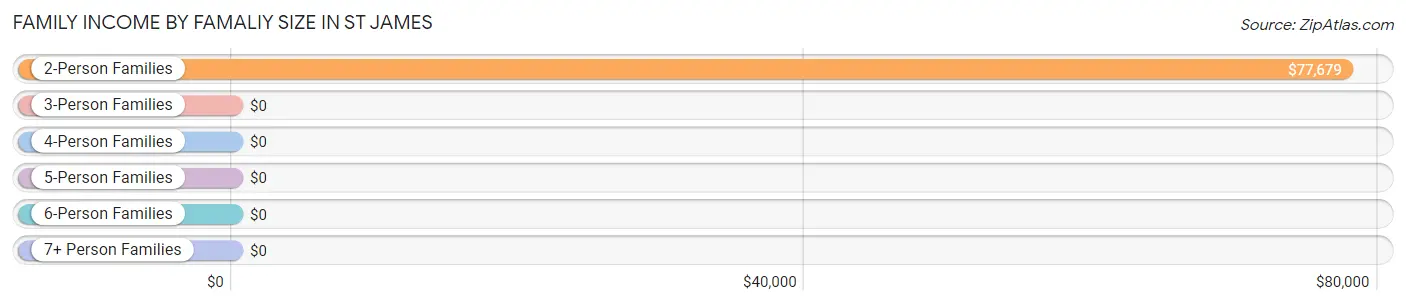
| Income Bracket | # Families | Median Income |
| 2-Person Families | 43 (70.5%) | $77,679 |
| 3-Person Families | 8 (13.1%) | $0 |
| 4-Person Families | 3 (4.9%) | $0 |
| 5-Person Families | 6 (9.8%) | $0 |
| 6-Person Families | 1 (1.6%) | $0 |
| 7+ Person Families | 0 (0.0%) | $0 |
| Total | 61 (100.0%) | $78,036 |
Family Income by Number of Earners in St James
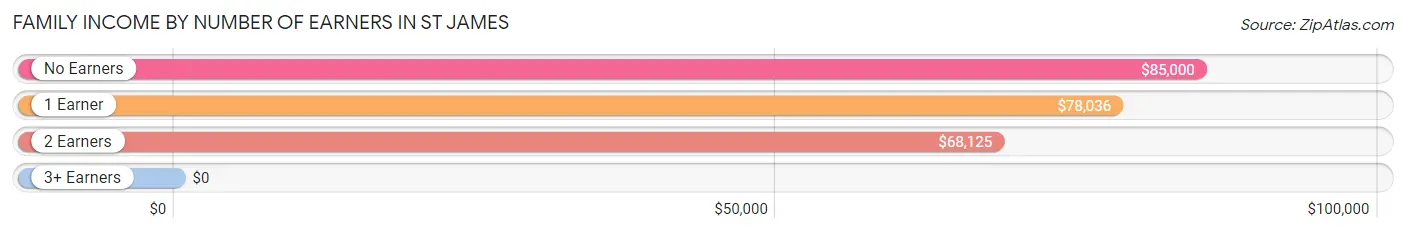
| Number of Earners | # Families | Median Income |
| No Earners | 18 (29.5%) | $85,000 |
| 1 Earner | 31 (50.8%) | $78,036 |
| 2 Earners | 9 (14.7%) | $68,125 |
| 3+ Earners | 3 (4.9%) | $0 |
| Total | 61 (100.0%) | $78,036 |
Household Income in St James
Household Income Brackets in St James
With 20 households falling in the category, the $50,000 to $74,999 income range is the most frequent in St James, accounting for 20.2% of all households. In contrast, only 1 households (1.0%) fall into the $10,000 to $14,999 income bracket, making it the least populous group.
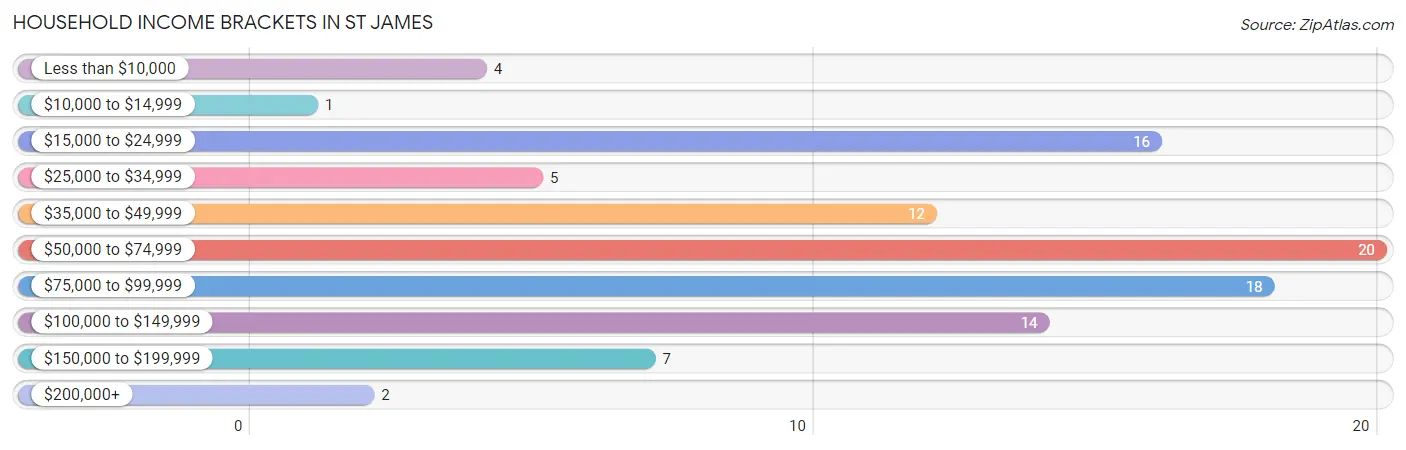
| Income Bracket | # Households | % Households |
| Less than $10,000 | 4 | 4.0% |
| $10,000 to $14,999 | 1 | 1.0% |
| $15,000 to $24,999 | 16 | 16.2% |
| $25,000 to $34,999 | 5 | 5.1% |
| $35,000 to $49,999 | 12 | 12.1% |
| $50,000 to $74,999 | 20 | 20.2% |
| $75,000 to $99,999 | 18 | 18.2% |
| $100,000 to $149,999 | 14 | 14.1% |
| $150,000 to $199,999 | 7 | 7.1% |
| $200,000+ | 2 | 2.0% |
Household Income by Householder Age in St James
The median household income in St James is $62,750, with the highest median household income of $68,750 found in the 45 to 64 years age bracket for the primary householder. A total of 38 households (38.4%) fall into this category.
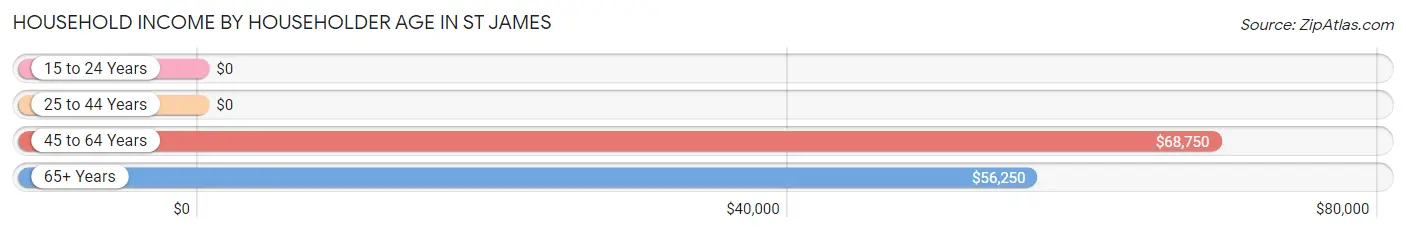
| Income Bracket | # Households | Median Income |
| 15 to 24 Years | 0 (0.0%) | $0 |
| 25 to 44 Years | 2 (2.0%) | $0 |
| 45 to 64 Years | 38 (38.4%) | $68,750 |
| 65+ Years | 59 (59.6%) | $56,250 |
| Total | 99 (100.0%) | $62,750 |
Poverty in St James
Income Below Poverty by Sex and Age in St James
With 5.0% poverty level for males and 6.2% for females among the residents of St James, 25 to 34 year old males and 45 to 54 year old females are the most vulnerable to poverty, with 1 males (33.3%) and 3 females (33.3%) in their respective age groups living below the poverty level.
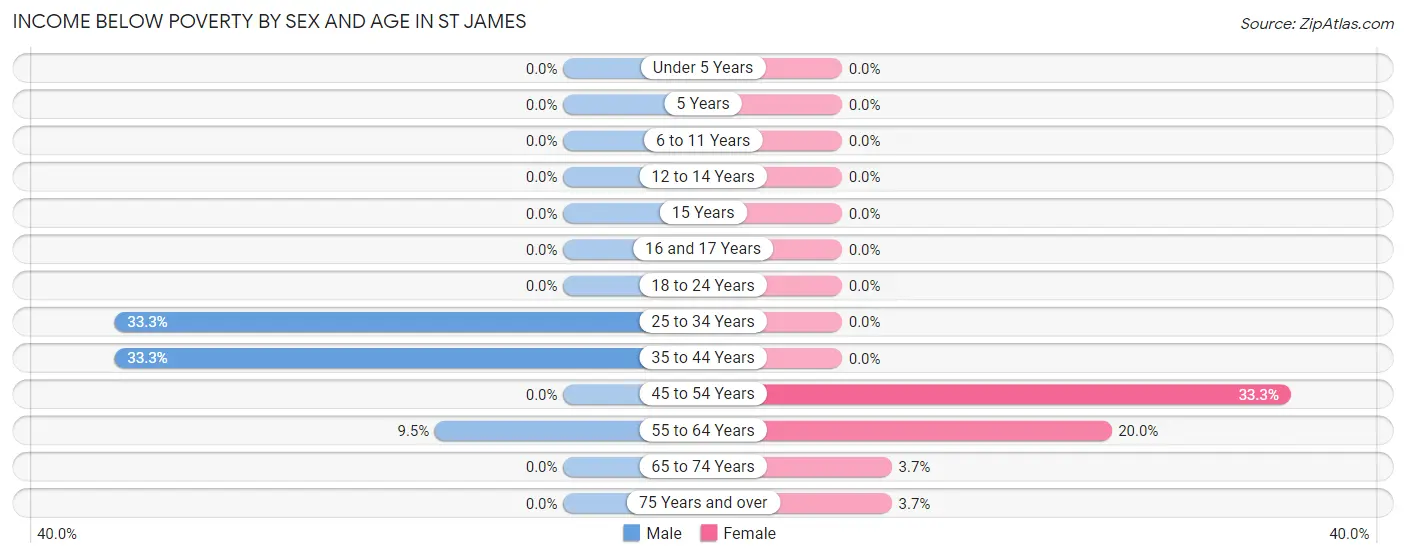
| Age Bracket | Male | Female |
| Under 5 Years | 0 (0.0%) | 0 (0.0%) |
| 5 Years | 0 (0.0%) | 0 (0.0%) |
| 6 to 11 Years | 0 (0.0%) | 0 (0.0%) |
| 12 to 14 Years | 0 (0.0%) | 0 (0.0%) |
| 15 Years | 0 (0.0%) | 0 (0.0%) |
| 16 and 17 Years | 0 (0.0%) | 0 (0.0%) |
| 18 to 24 Years | 0 (0.0%) | 0 (0.0%) |
| 25 to 34 Years | 1 (33.3%) | 0 (0.0%) |
| 35 to 44 Years | 1 (33.3%) | 0 (0.0%) |
| 45 to 54 Years | 0 (0.0%) | 3 (33.3%) |
| 55 to 64 Years | 2 (9.5%) | 4 (20.0%) |
| 65 to 74 Years | 0 (0.0%) | 1 (3.7%) |
| 75 Years and over | 0 (0.0%) | 1 (3.7%) |
| Total | 4 (5.0%) | 9 (6.2%) |
Income Above Poverty by Sex and Age in St James
According to the poverty statistics in St James, males aged under 5 years and females aged under 5 years are the age groups that are most secure financially, with 100.0% of males and 100.0% of females in these age groups living above the poverty line.
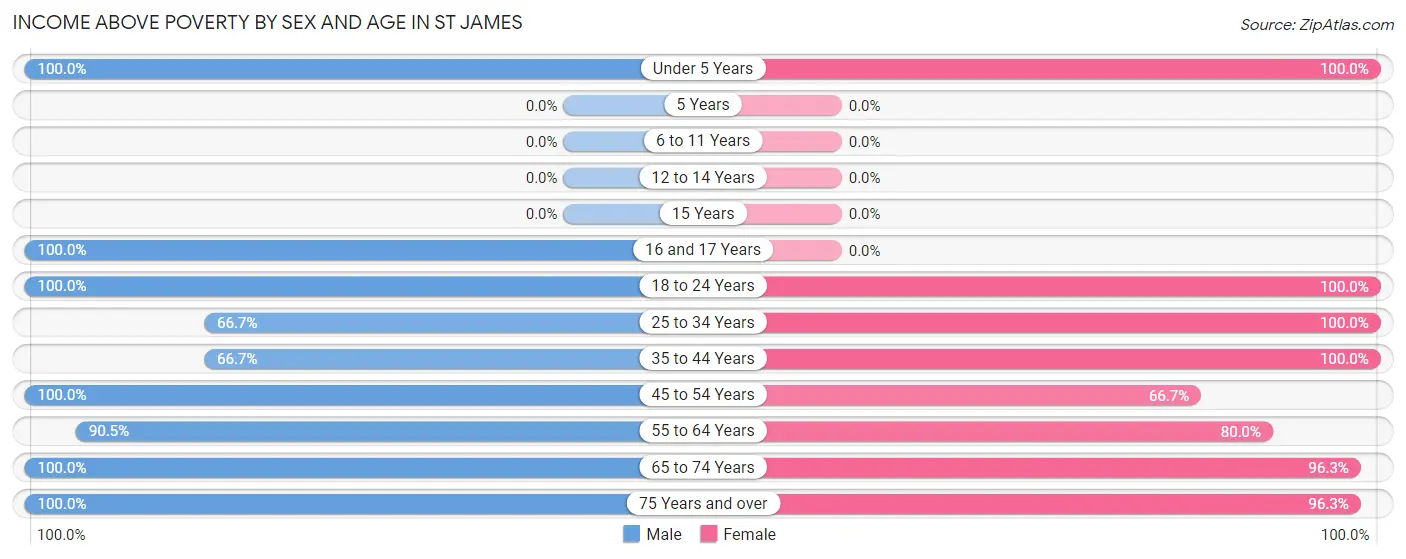
| Age Bracket | Male | Female |
| Under 5 Years | 5 (100.0%) | 52 (100.0%) |
| 5 Years | 0 (0.0%) | 0 (0.0%) |
| 6 to 11 Years | 0 (0.0%) | 0 (0.0%) |
| 12 to 14 Years | 0 (0.0%) | 0 (0.0%) |
| 15 Years | 0 (0.0%) | 0 (0.0%) |
| 16 and 17 Years | 3 (100.0%) | 0 (0.0%) |
| 18 to 24 Years | 3 (100.0%) | 1 (100.0%) |
| 25 to 34 Years | 2 (66.7%) | 1 (100.0%) |
| 35 to 44 Years | 2 (66.7%) | 8 (100.0%) |
| 45 to 54 Years | 9 (100.0%) | 6 (66.7%) |
| 55 to 64 Years | 19 (90.5%) | 16 (80.0%) |
| 65 to 74 Years | 12 (100.0%) | 26 (96.3%) |
| 75 Years and over | 21 (100.0%) | 26 (96.3%) |
| Total | 76 (95.0%) | 136 (93.8%) |
Income Below Poverty Among Married-Couple Families in St James
The poverty statistics for married-couple families in St James show that 2.6% or 1 of the total 39 families live below the poverty line. Families with no children have the highest poverty rate of 3.2%, comprising of 1 families. On the other hand, families with 1 or 2 children have the lowest poverty rate of 0.0%, which includes 0 families.
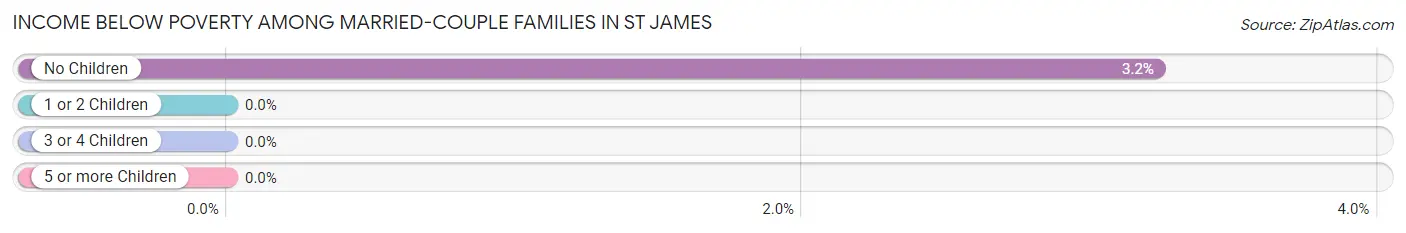
| Children | Above Poverty | Below Poverty |
| No Children | 30 (96.8%) | 1 (3.2%) |
| 1 or 2 Children | 2 (100.0%) | 0 (0.0%) |
| 3 or 4 Children | 6 (100.0%) | 0 (0.0%) |
| 5 or more Children | 0 (0.0%) | 0 (0.0%) |
| Total | 38 (97.4%) | 1 (2.6%) |
Income Below Poverty Among Single-Parent Households in St James
| Children | Single Father | Single Mother |
| No Children | 0 (0.0%) | 0 (0.0%) |
| 1 or 2 Children | 0 (0.0%) | 0 (0.0%) |
| 3 or 4 Children | 0 (0.0%) | 0 (0.0%) |
| 5 or more Children | 0 (0.0%) | 0 (0.0%) |
| Total | 0 (0.0%) | 0 (0.0%) |
Income Below Poverty Among Married-Couple vs Single-Parent Households in St James
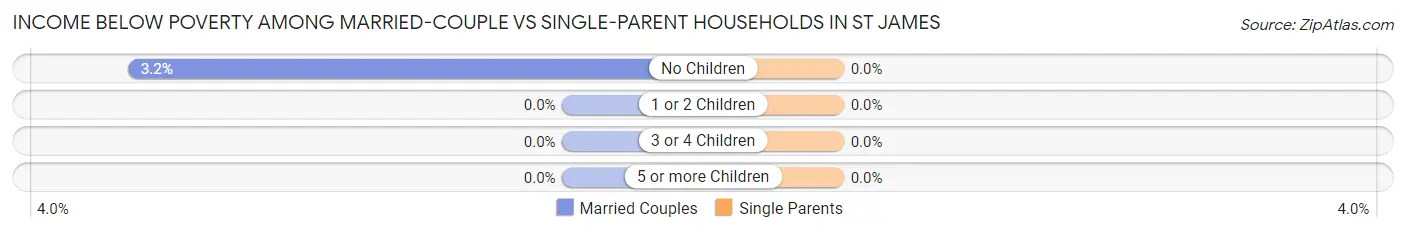
| Children | Married-Couple Families | Single-Parent Households |
| No Children | 1 (3.2%) | 0 (0.0%) |
| 1 or 2 Children | 0 (0.0%) | 0 (0.0%) |
| 3 or 4 Children | 0 (0.0%) | 0 (0.0%) |
| 5 or more Children | 0 (0.0%) | 0 (0.0%) |
| Total | 1 (2.6%) | 0 (0.0%) |
Race in St James
The most populous races in St James are White / Caucasian (213 | 94.3%), Two or more Races (10 | 4.4%), and Asian (2 | 0.9%).
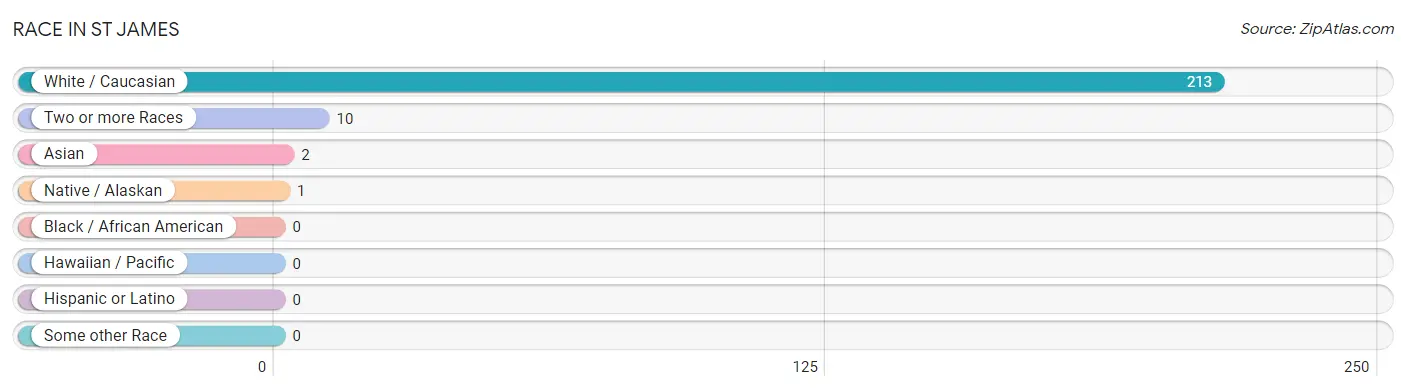
| Race | # Population | % Population |
| Asian | 2 | 0.9% |
| Black / African American | 0 | 0.0% |
| Hawaiian / Pacific | 0 | 0.0% |
| Hispanic or Latino | 0 | 0.0% |
| Native / Alaskan | 1 | 0.4% |
| White / Caucasian | 213 | 94.3% |
| Two or more Races | 10 | 4.4% |
| Some other Race | 0 | 0.0% |
| Total | 226 | 100.0% |
Ancestry in St James
The most populous ancestries reported in St James are Irish (73 | 32.3%), English (44 | 19.5%), German (23 | 10.2%), American (14 | 6.2%), and Swedish (11 | 4.9%), together accounting for 73.0% of all St James residents.
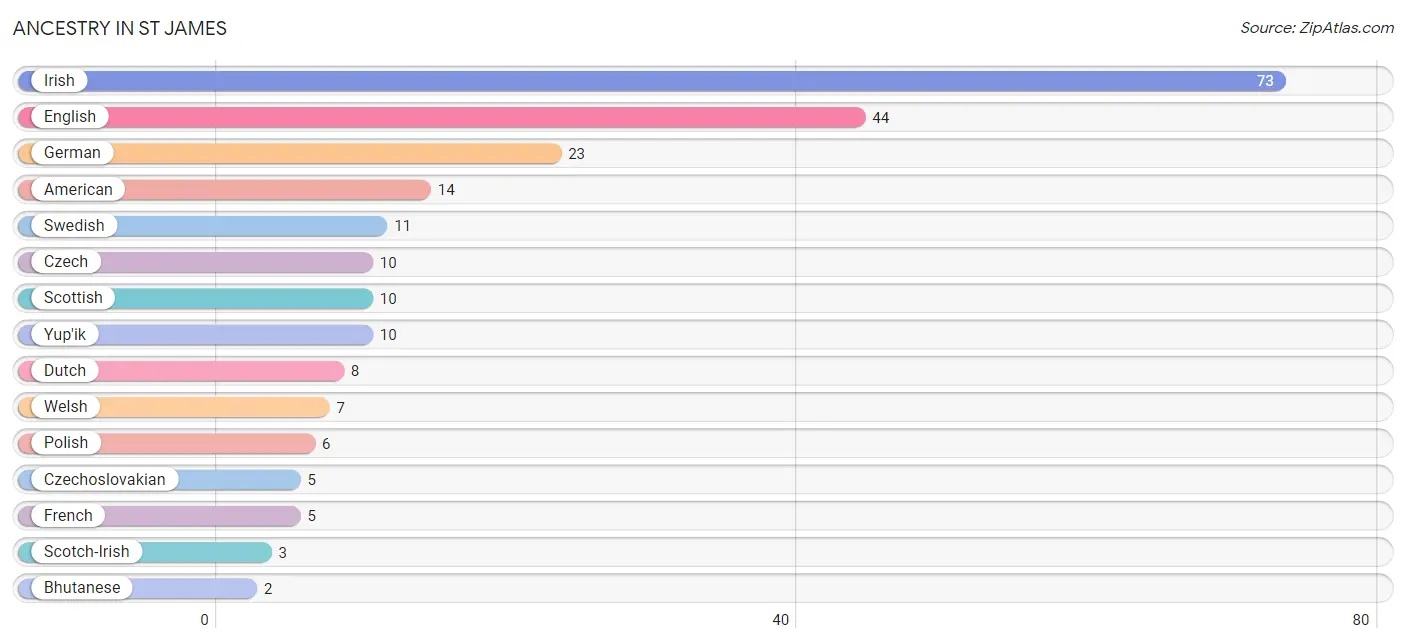
| Ancestry | # Population | % Population |
| American | 14 | 6.2% |
| Bhutanese | 2 | 0.9% |
| Czech | 10 | 4.4% |
| Czechoslovakian | 5 | 2.2% |
| Dutch | 8 | 3.5% |
| English | 44 | 19.5% |
| European | 1 | 0.4% |
| French | 5 | 2.2% |
| French Canadian | 2 | 0.9% |
| German | 23 | 10.2% |
| Irish | 73 | 32.3% |
| Italian | 2 | 0.9% |
| Norwegian | 2 | 0.9% |
| Polish | 6 | 2.6% |
| Russian | 1 | 0.4% |
| Scotch-Irish | 3 | 1.3% |
| Scottish | 10 | 4.4% |
| Swedish | 11 | 4.9% |
| Welsh | 7 | 3.1% |
| Yup'ik | 10 | 4.4% | View All 20 Rows |
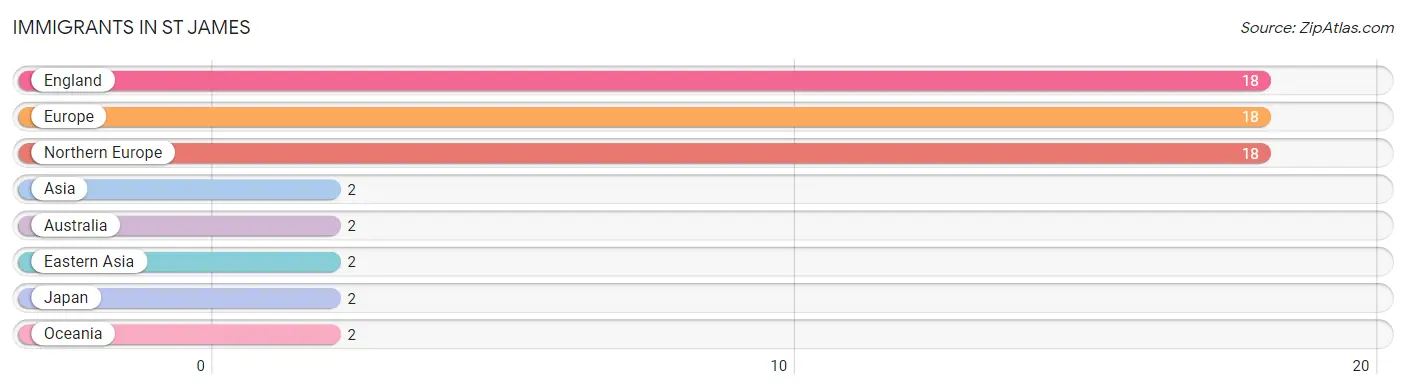
Immigrants in St James
The most numerous immigrant groups reported in St James came from England (18 | 8.0%), Europe (18 | 8.0%), Northern Europe (18 | 8.0%), Asia (2 | 0.9%), and Australia (2 | 0.9%), together accounting for 25.6% of all St James residents.
| Immigration Origin | # Population | % Population |
| Asia | 2 | 0.9% |
| Australia | 2 | 0.9% |
| Eastern Asia | 2 | 0.9% |
| England | 18 | 8.0% |
| Europe | 18 | 8.0% |
| Japan | 2 | 0.9% |
| Northern Europe | 18 | 8.0% |
| Oceania | 2 | 0.9% | View All 8 Rows |
Sex and Age in St James
Sex and Age in St James
The most populous age groups in St James are 60 to 64 Years (13 | 16.3%) for men and Under 5 Years (53 | 36.3%) for women.
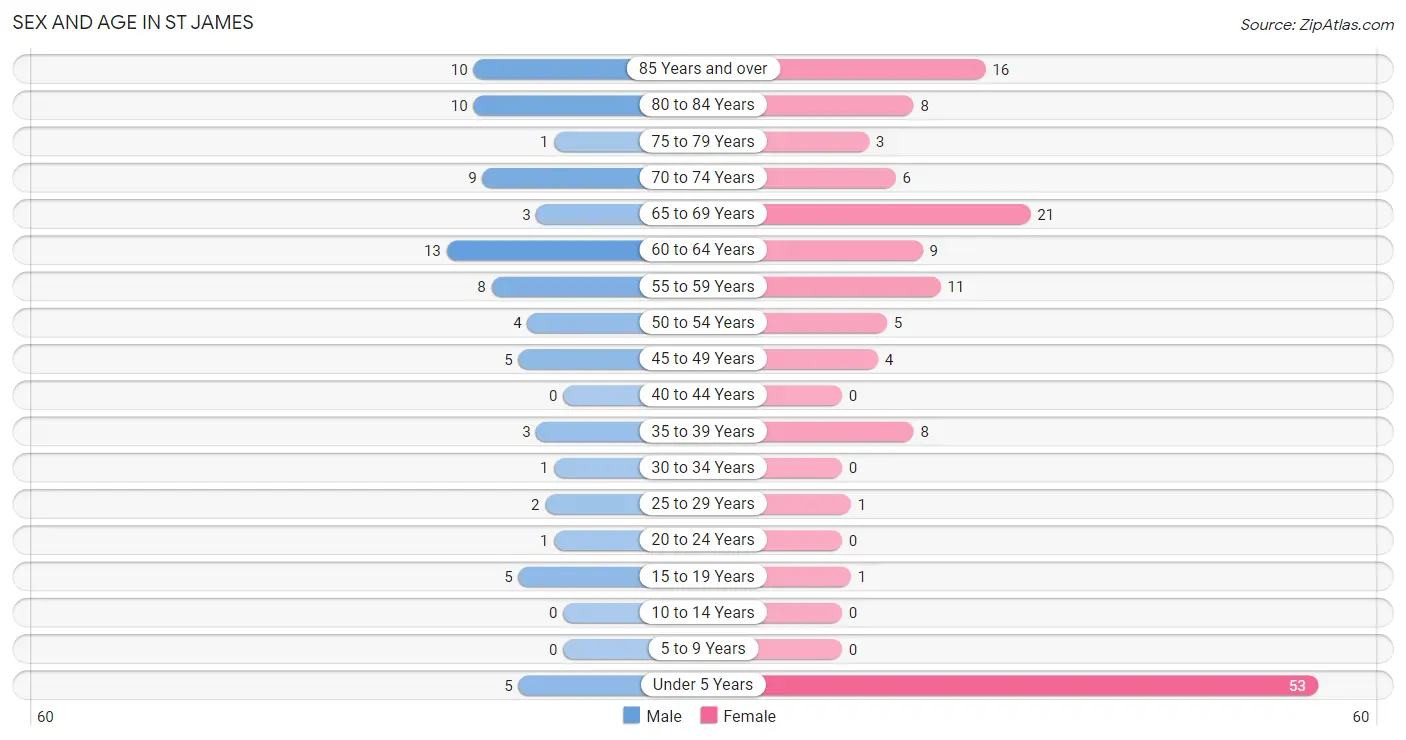
| Age Bracket | Male | Female |
| Under 5 Years | 5 (6.2%) | 53 (36.3%) |
| 5 to 9 Years | 0 (0.0%) | 0 (0.0%) |
| 10 to 14 Years | 0 (0.0%) | 0 (0.0%) |
| 15 to 19 Years | 5 (6.2%) | 1 (0.7%) |
| 20 to 24 Years | 1 (1.3%) | 0 (0.0%) |
| 25 to 29 Years | 2 (2.5%) | 1 (0.7%) |
| 30 to 34 Years | 1 (1.3%) | 0 (0.0%) |
| 35 to 39 Years | 3 (3.7%) | 8 (5.5%) |
| 40 to 44 Years | 0 (0.0%) | 0 (0.0%) |
| 45 to 49 Years | 5 (6.2%) | 4 (2.7%) |
| 50 to 54 Years | 4 (5.0%) | 5 (3.4%) |
| 55 to 59 Years | 8 (10.0%) | 11 (7.5%) |
| 60 to 64 Years | 13 (16.3%) | 9 (6.2%) |
| 65 to 69 Years | 3 (3.7%) | 21 (14.4%) |
| 70 to 74 Years | 9 (11.3%) | 6 (4.1%) |
| 75 to 79 Years | 1 (1.3%) | 3 (2.1%) |
| 80 to 84 Years | 10 (12.5%) | 8 (5.5%) |
| 85 Years and over | 10 (12.5%) | 16 (11.0%) |
| Total | 80 (100.0%) | 146 (100.0%) |
Families and Households in St James
Median Family Size in St James
The median family size in St James is 2.90 persons per family, with married-couple families (39 | 63.9%) accounting for the largest median family size of 3.41 persons per family. On the other hand, single male/father families (11 | 18.0%) represent the smallest median family size with 1.73 persons per family.
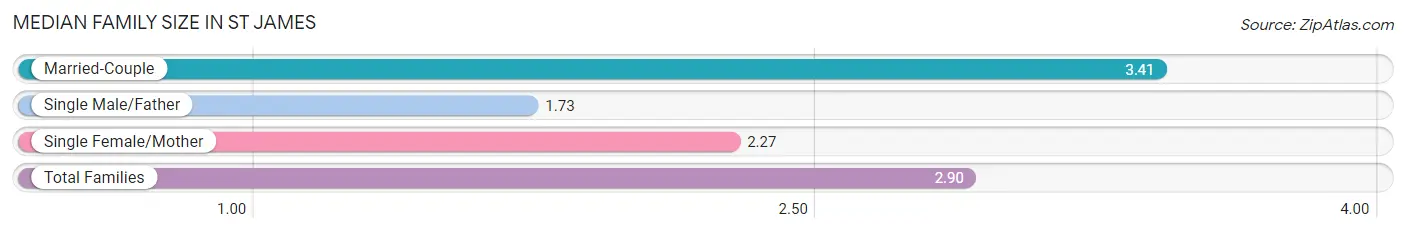
| Family Type | # Families | Family Size |
| Married-Couple | 39 (63.9%) | 3.41 |
| Single Male/Father | 11 (18.0%) | 1.73 |
| Single Female/Mother | 11 (18.0%) | 2.27 |
| Total Families | 61 (100.0%) | 2.90 |
Median Household Size in St James
The median household size in St James is 2.28 persons per household, with married-couple households (39 | 39.4%) accounting for the largest median household size of 3.44 persons per household. non-family households (38 | 38.4%) represent the smallest median household size with 1.11 persons per household.
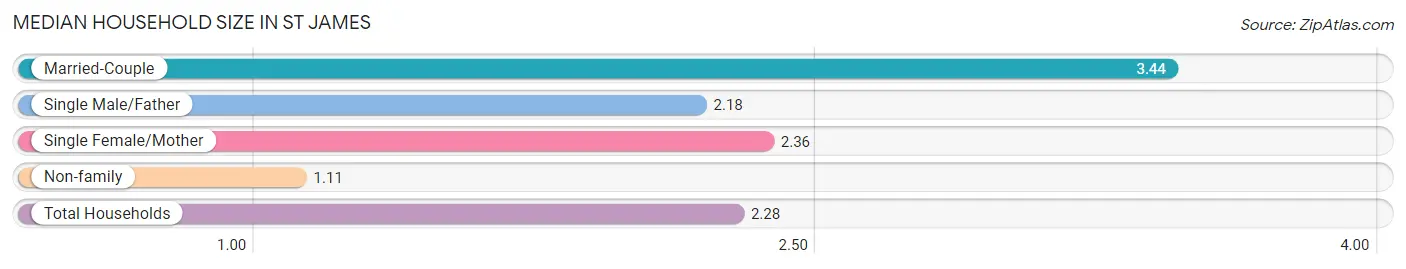
| Household Type | # Households | Household Size |
| Married-Couple | 39 (39.4%) | 3.44 |
| Single Male/Father | 11 (11.1%) | 2.18 |
| Single Female/Mother | 11 (11.1%) | 2.36 |
| Non-family | 38 (38.4%) | 1.11 |
| Total Households | 99 (100.0%) | 2.28 |
Household Size by Marriage Status in St James
Out of a total of 99 households in St James, 61 (61.6%) are family households, while 38 (38.4%) are nonfamily households. The most numerous type of family households are 2-person households, comprising 41, and the most common type of nonfamily households are 1-person households, comprising 33.
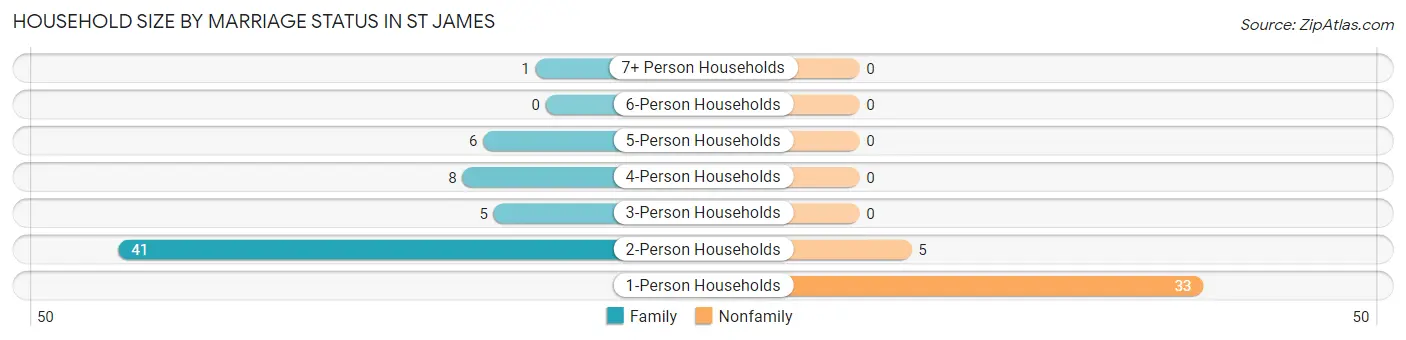
| Household Size | Family Households | Nonfamily Households |
| 1-Person Households | - | 33 (33.3%) |
| 2-Person Households | 41 (41.4%) | 5 (5.1%) |
| 3-Person Households | 5 (5.1%) | 0 (0.0%) |
| 4-Person Households | 8 (8.1%) | 0 (0.0%) |
| 5-Person Households | 6 (6.1%) | 0 (0.0%) |
| 6-Person Households | 0 (0.0%) | 0 (0.0%) |
| 7+ Person Households | 1 (1.0%) | 0 (0.0%) |
| Total | 61 (61.6%) | 38 (38.4%) |
Female Fertility in St James
Fertility by Age in St James
Average fertility rate in St James is 105.0 births per 1,000 women. Women in the age bracket of 35 to 50 years have the highest fertility rate with 118.0 births per 1,000 women. Women in the age bracket of 35 to 50 years acount for 100.0% of all women with births.
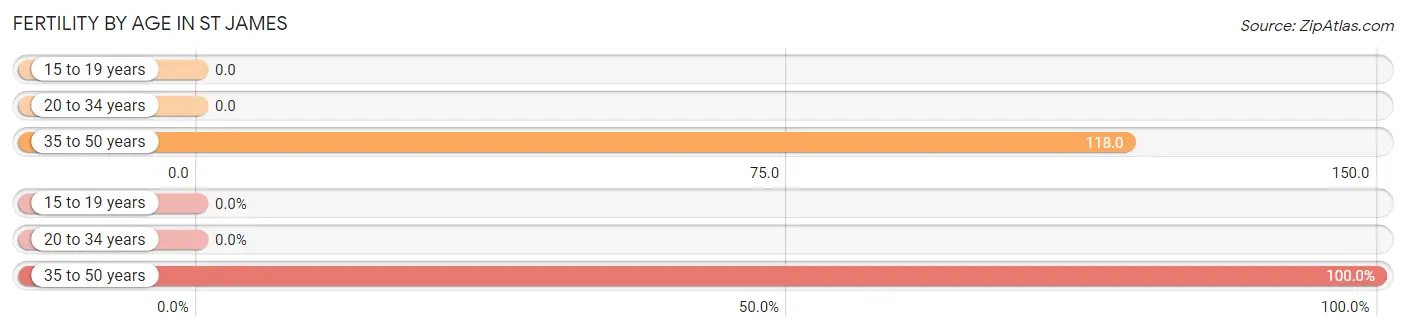
| Age Bracket | Women with Births | Births / 1,000 Women |
| 15 to 19 years | 0 (0.0%) | 0.0 |
| 20 to 34 years | 0 (0.0%) | 0.0 |
| 35 to 50 years | 2 (100.0%) | 118.0 |
| Total | 2 (100.0%) | 105.0 |
Fertility by Age by Marriage Status in St James
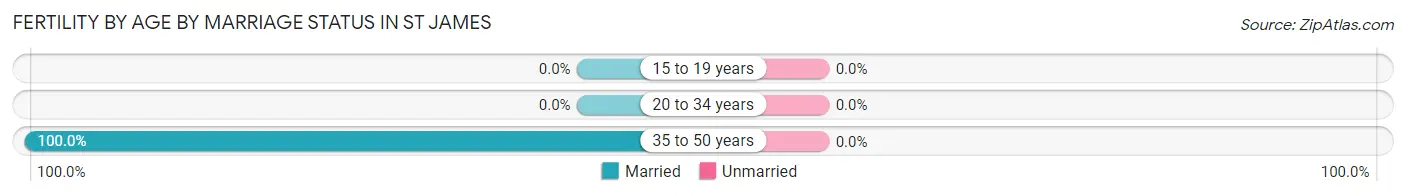
| Age Bracket | Married | Unmarried |
| 15 to 19 years | 0 (0.0%) | 0 (0.0%) |
| 20 to 34 years | 0 (0.0%) | 0 (0.0%) |
| 35 to 50 years | 2 (100.0%) | 0 (0.0%) |
| Total | 2 (100.0%) | 0 (0.0%) |
Fertility by Education in St James
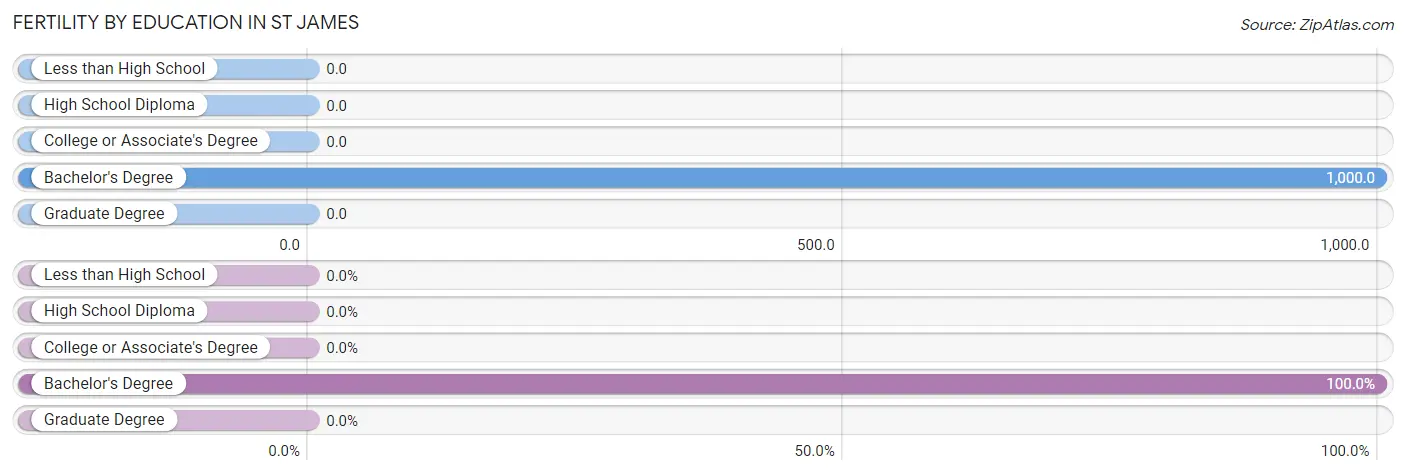
| Educational Attainment | Women with Births | Births / 1,000 Women |
| Less than High School | 0 (0.0%) | 0.0 |
| High School Diploma | 0 (0.0%) | 0.0 |
| College or Associate's Degree | 0 (0.0%) | 0.0 |
| Bachelor's Degree | 2 (100.0%) | 1,000.0 |
| Graduate Degree | 0 (0.0%) | 0.0 |
| Total | 2 (100.0%) | 105.0 |
Fertility by Education by Marriage Status in St James
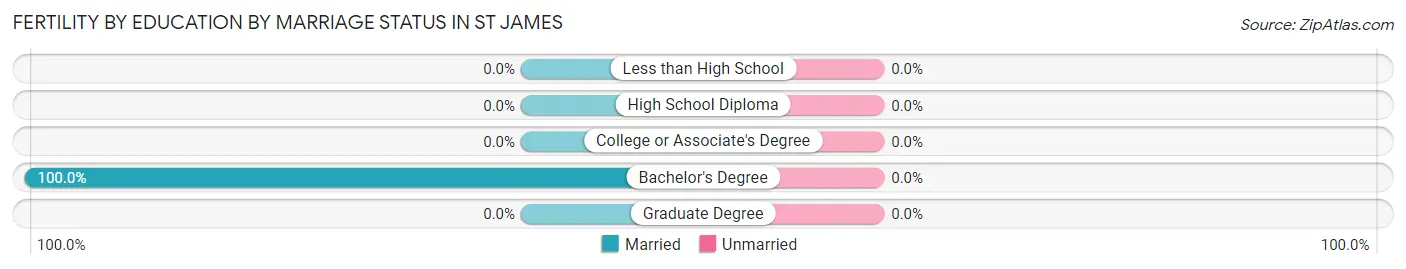
| Educational Attainment | Married | Unmarried |
| Less than High School | 0 (0.0%) | 0 (0.0%) |
| High School Diploma | 0 (0.0%) | 0 (0.0%) |
| College or Associate's Degree | 0 (0.0%) | 0 (0.0%) |
| Bachelor's Degree | 2 (100.0%) | 0 (0.0%) |
| Graduate Degree | 0 (0.0%) | 0 (0.0%) |
| Total | 2 (100.0%) | 0 (0.0%) |
Employment Characteristics in St James
Employment by Class of Employer in St James
Among the 60 employed individuals in St James, self-employed (incorporated) (25 | 41.7%), private company employees (21 | 35.0%), and not-for-profit organizations (11 | 18.3%) make up the most common classes of employment.
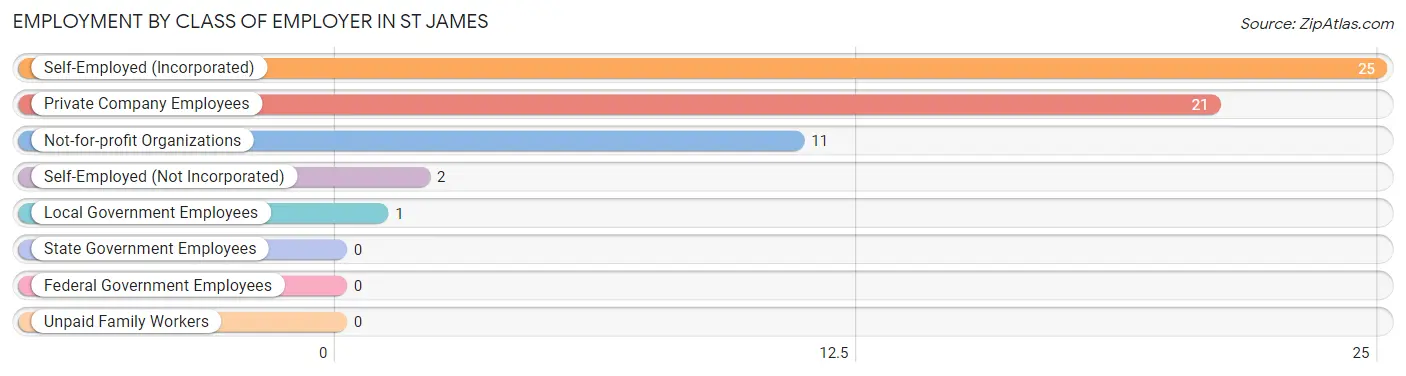
| Employer Class | # Employees | % Employees |
| Private Company Employees | 21 | 35.0% |
| Self-Employed (Incorporated) | 25 | 41.7% |
| Self-Employed (Not Incorporated) | 2 | 3.3% |
| Not-for-profit Organizations | 11 | 18.3% |
| Local Government Employees | 1 | 1.7% |
| State Government Employees | 0 | 0.0% |
| Federal Government Employees | 0 | 0.0% |
| Unpaid Family Workers | 0 | 0.0% |
| Total | 60 | 100.0% |
Employment Status by Age in St James
According to the labor force statistics for St James, out of the total population over 16 years of age (168), 45.2% or 76 individuals are in the labor force, with 21.1% or 16 of them unemployed. The age group with the highest labor force participation rate is 20 to 24 years, with 100.0% or 1 individuals in the labor force. Within the labor force, the 20 to 24 years age range has the highest percentage of unemployed individuals, with 100.0% or 1 of them being unemployed.
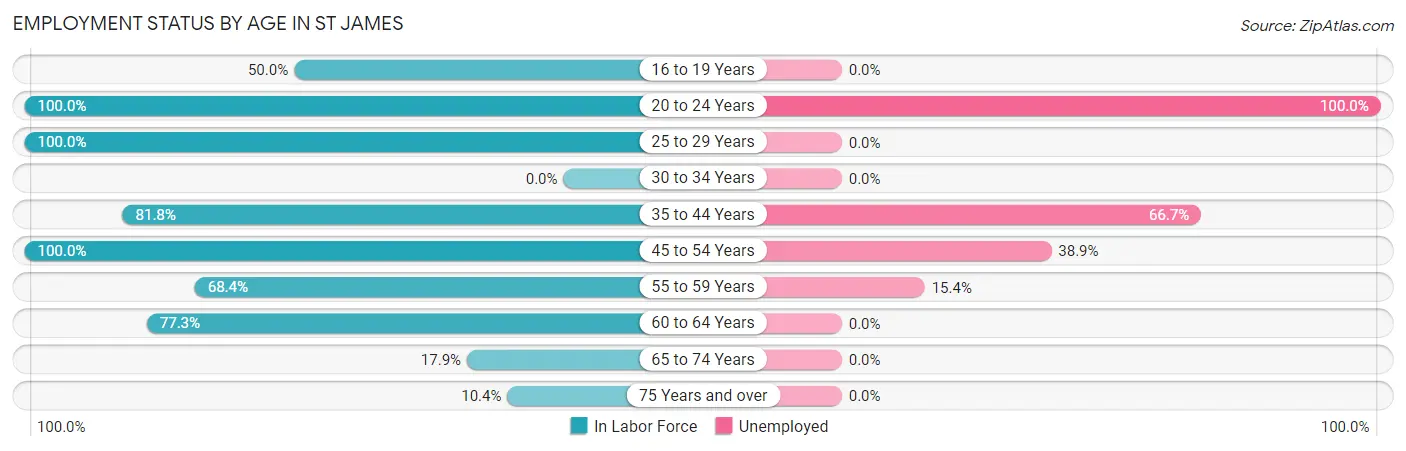
| Age Bracket | In Labor Force | Unemployed |
| 16 to 19 Years | 3 (50.0%) | 0 (0.0%) |
| 20 to 24 Years | 1 (100.0%) | 1 (100.0%) |
| 25 to 29 Years | 3 (100.0%) | 0 (0.0%) |
| 30 to 34 Years | 0 (0.0%) | 0 (0.0%) |
| 35 to 44 Years | 9 (81.8%) | 6 (66.7%) |
| 45 to 54 Years | 18 (100.0%) | 7 (38.9%) |
| 55 to 59 Years | 13 (68.4%) | 2 (15.4%) |
| 60 to 64 Years | 17 (77.3%) | 0 (0.0%) |
| 65 to 74 Years | 7 (17.9%) | 0 (0.0%) |
| 75 Years and over | 5 (10.4%) | 0 (0.0%) |
| Total | 76 (45.2%) | 16 (21.1%) |
Employment Status by Educational Attainment in St James
According to labor force statistics for St James, 81.1% of individuals (60) out of the total population between 25 and 64 years of age (74) are in the labor force, with 25.0% or 15 of them being unemployed. The group with the highest labor force participation rate are those with the educational attainment of college / associate degree, with 96.7% or 29 individuals in the labor force. Within the labor force, individuals with college / associate degree education have the highest percentage of unemployment, with 31.0% or 9 of them being unemployed.
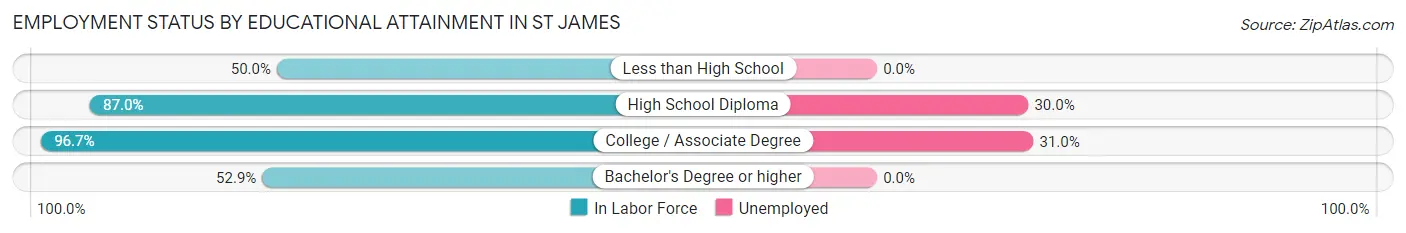
| Educational Attainment | In Labor Force | Unemployed |
| Less than High School | 2 (50.0%) | 0 (0.0%) |
| High School Diploma | 20 (87.0%) | 7 (30.0%) |
| College / Associate Degree | 29 (96.7%) | 9 (31.0%) |
| Bachelor's Degree or higher | 9 (52.9%) | 0 (0.0%) |
| Total | 60 (81.1%) | 18 (25.0%) |
Employment Occupations by Sex in St James
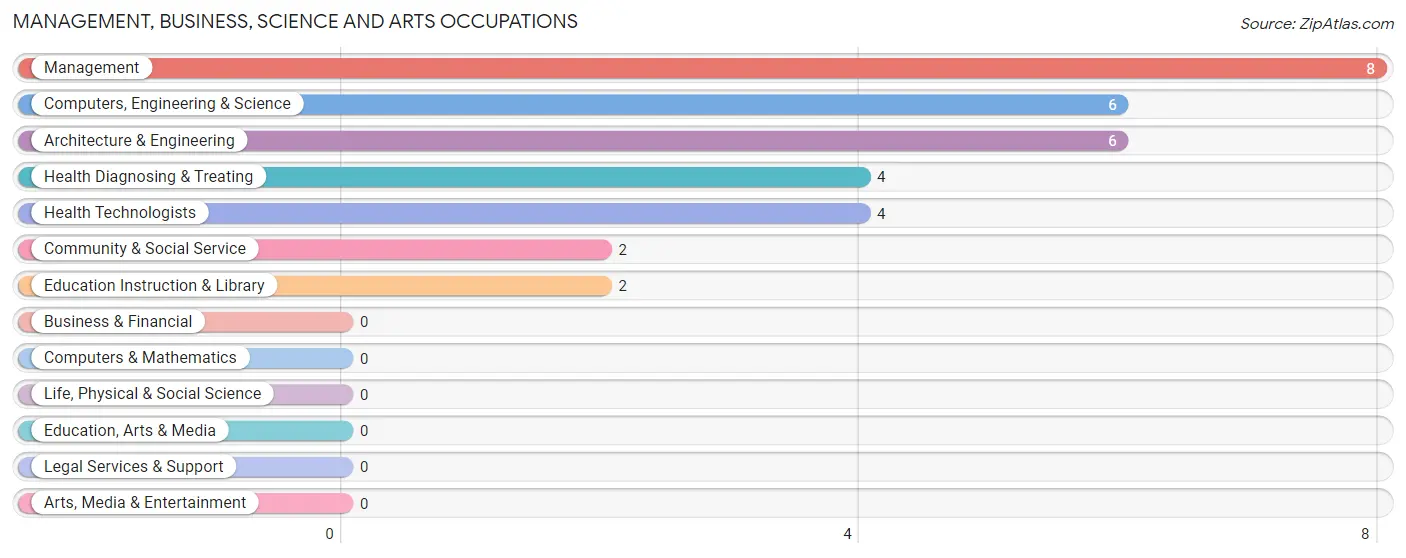
Management, Business, Science and Arts Occupations
The most common Management, Business, Science and Arts occupations in St James are Management (8 | 13.3%), Computers, Engineering & Science (6 | 10.0%), Architecture & Engineering (6 | 10.0%), Health Diagnosing & Treating (4 | 6.7%), and Health Technologists (4 | 6.7%).
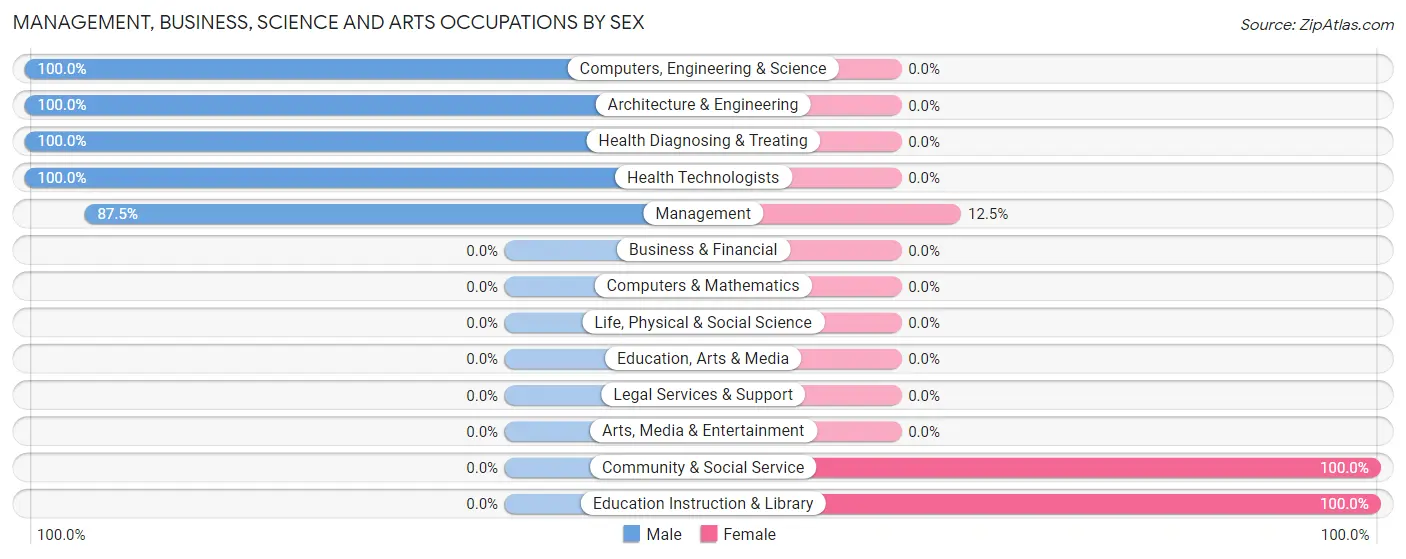
Management, Business, Science and Arts Occupations by Sex
Within the Management, Business, Science and Arts occupations in St James, the most male-oriented occupations are Computers, Engineering & Science (100.0%), Architecture & Engineering (100.0%), and Health Diagnosing & Treating (100.0%), while the most female-oriented occupations are Community & Social Service (100.0%), Education Instruction & Library (100.0%), and Management (12.5%).
| Occupation | Male | Female |
| Management | 7 (87.5%) | 1 (12.5%) |
| Business & Financial | 0 (0.0%) | 0 (0.0%) |
| Computers, Engineering & Science | 6 (100.0%) | 0 (0.0%) |
| Computers & Mathematics | 0 (0.0%) | 0 (0.0%) |
| Architecture & Engineering | 6 (100.0%) | 0 (0.0%) |
| Life, Physical & Social Science | 0 (0.0%) | 0 (0.0%) |
| Community & Social Service | 0 (0.0%) | 2 (100.0%) |
| Education, Arts & Media | 0 (0.0%) | 0 (0.0%) |
| Legal Services & Support | 0 (0.0%) | 0 (0.0%) |
| Education Instruction & Library | 0 (0.0%) | 2 (100.0%) |
| Arts, Media & Entertainment | 0 (0.0%) | 0 (0.0%) |
| Health Diagnosing & Treating | 4 (100.0%) | 0 (0.0%) |
| Health Technologists | 4 (100.0%) | 0 (0.0%) |
| Total (Category) | 17 (85.0%) | 3 (15.0%) |
| Total (Overall) | 40 (66.7%) | 20 (33.3%) |
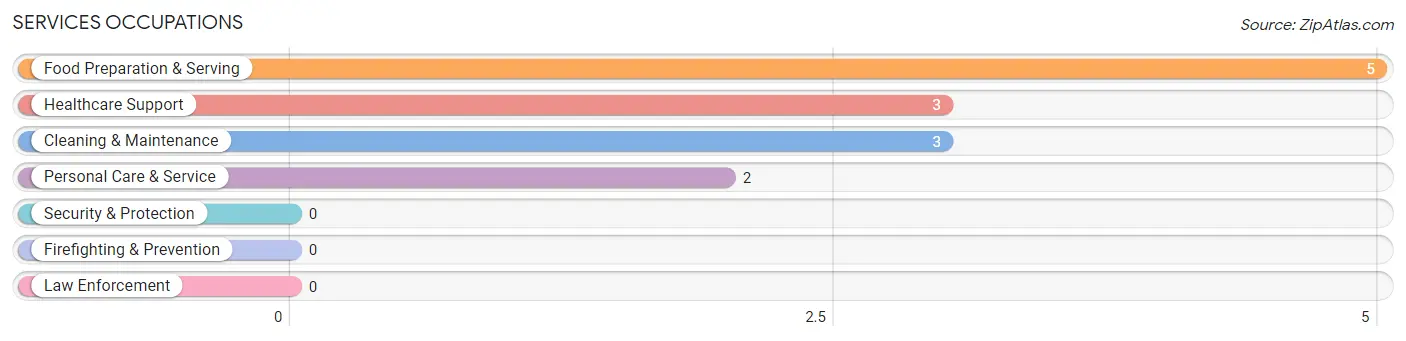
Services Occupations
The most common Services occupations in St James are Food Preparation & Serving (5 | 8.3%), Healthcare Support (3 | 5.0%), Cleaning & Maintenance (3 | 5.0%), and Personal Care & Service (2 | 3.3%).
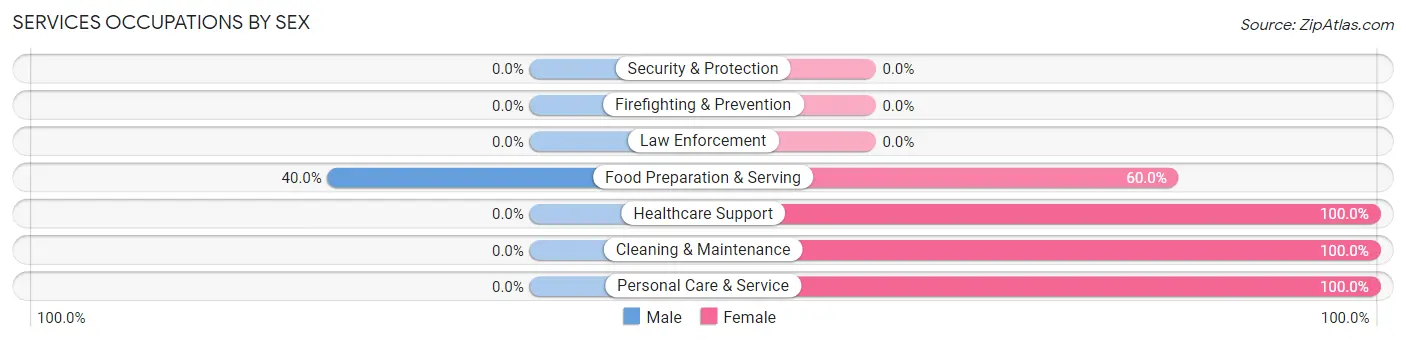
Services Occupations by Sex
| Occupation | Male | Female |
| Healthcare Support | 0 (0.0%) | 3 (100.0%) |
| Security & Protection | 0 (0.0%) | 0 (0.0%) |
| Firefighting & Prevention | 0 (0.0%) | 0 (0.0%) |
| Law Enforcement | 0 (0.0%) | 0 (0.0%) |
| Food Preparation & Serving | 2 (40.0%) | 3 (60.0%) |
| Cleaning & Maintenance | 0 (0.0%) | 3 (100.0%) |
| Personal Care & Service | 0 (0.0%) | 2 (100.0%) |
| Total (Category) | 2 (15.4%) | 11 (84.6%) |
| Total (Overall) | 40 (66.7%) | 20 (33.3%) |
Sales and Office Occupations
The most common Sales and Office occupations in St James are Sales & Related (10 | 16.7%), and Office & Administration (4 | 6.7%).
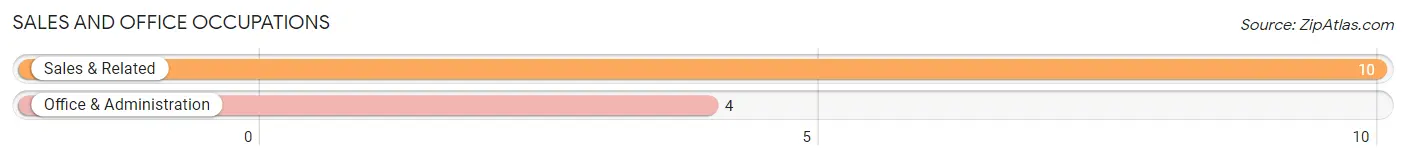
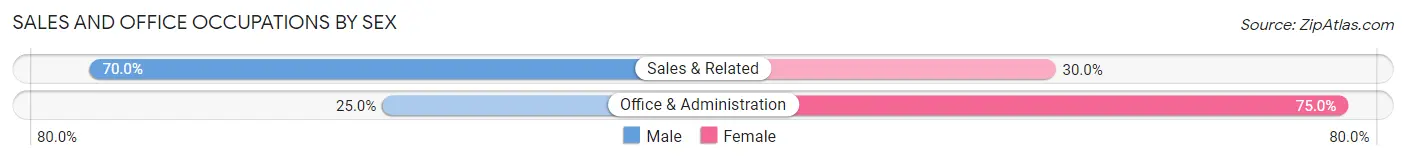
Sales and Office Occupations by Sex
| Occupation | Male | Female |
| Sales & Related | 7 (70.0%) | 3 (30.0%) |
| Office & Administration | 1 (25.0%) | 3 (75.0%) |
| Total (Category) | 8 (57.1%) | 6 (42.9%) |
| Total (Overall) | 40 (66.7%) | 20 (33.3%) |
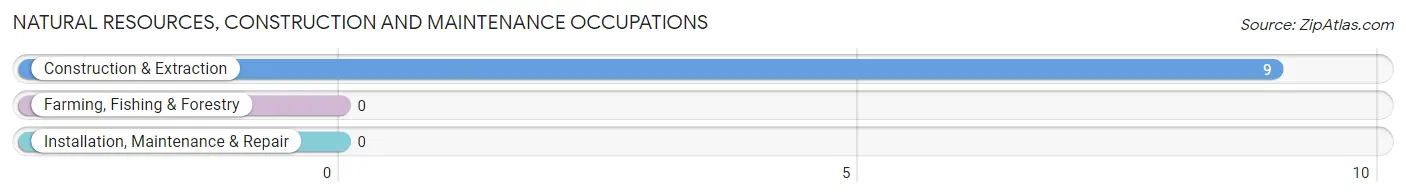
Natural Resources, Construction and Maintenance Occupations
The most common Natural Resources, Construction and Maintenance occupations in St James are , and Construction & Extraction (9 | 15.0%).
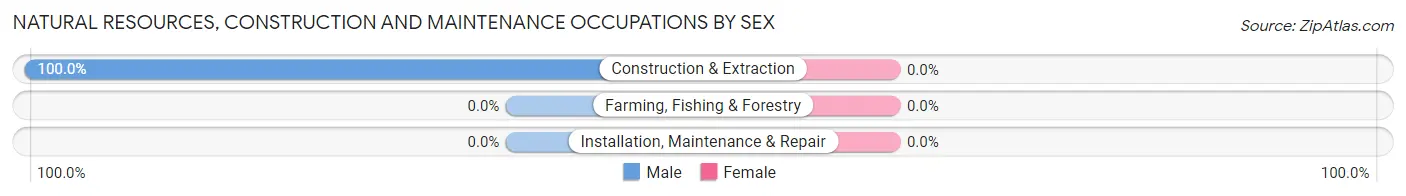
Natural Resources, Construction and Maintenance Occupations by Sex
| Occupation | Male | Female |
| Farming, Fishing & Forestry | 0 (0.0%) | 0 (0.0%) |
| Construction & Extraction | 9 (100.0%) | 0 (0.0%) |
| Installation, Maintenance & Repair | 0 (0.0%) | 0 (0.0%) |
| Total (Category) | 9 (100.0%) | 0 (0.0%) |
| Total (Overall) | 40 (66.7%) | 20 (33.3%) |
Production, Transportation and Moving Occupations
The most common Production, Transportation and Moving occupations in St James are Transportation (2 | 3.3%), and Material Moving (2 | 3.3%).
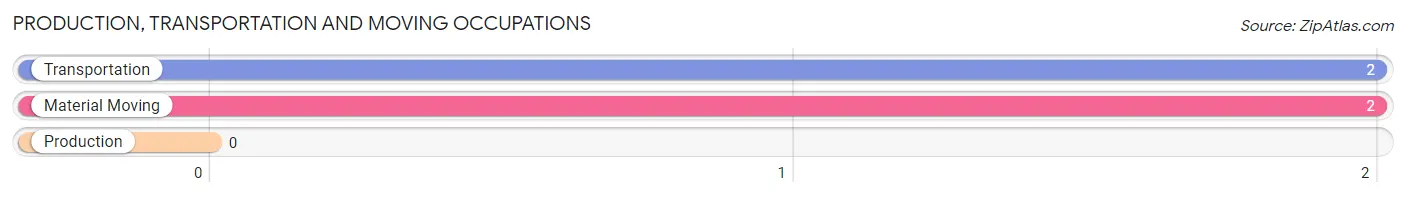
Production, Transportation and Moving Occupations by Sex
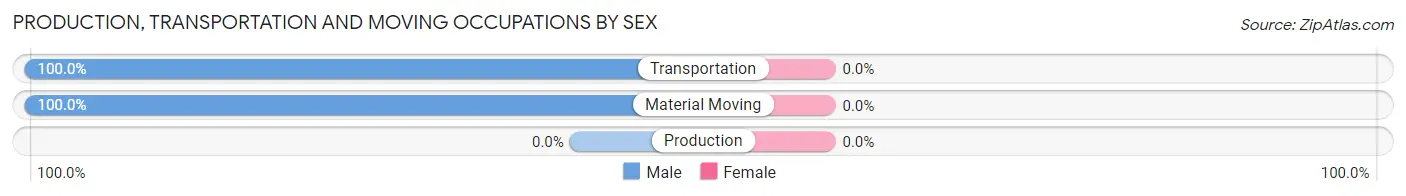
| Occupation | Male | Female |
| Production | 0 (0.0%) | 0 (0.0%) |
| Transportation | 2 (100.0%) | 0 (0.0%) |
| Material Moving | 2 (100.0%) | 0 (0.0%) |
| Total (Category) | 4 (100.0%) | 0 (0.0%) |
| Total (Overall) | 40 (66.7%) | 20 (33.3%) |
Employment Industries by Sex in St James
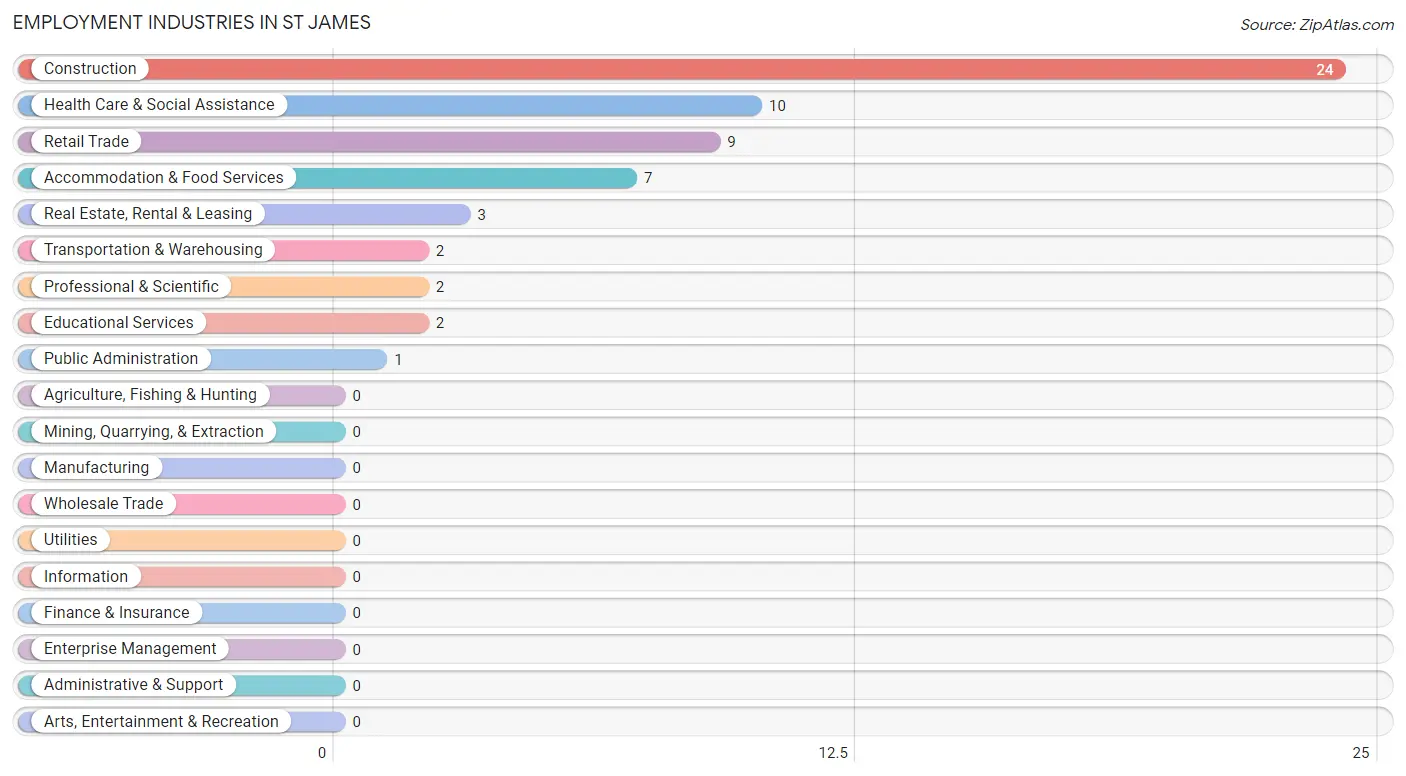
Employment Industries in St James
The major employment industries in St James include Construction (24 | 40.0%), Health Care & Social Assistance (10 | 16.7%), Retail Trade (9 | 15.0%), Accommodation & Food Services (7 | 11.7%), and Real Estate, Rental & Leasing (3 | 5.0%).
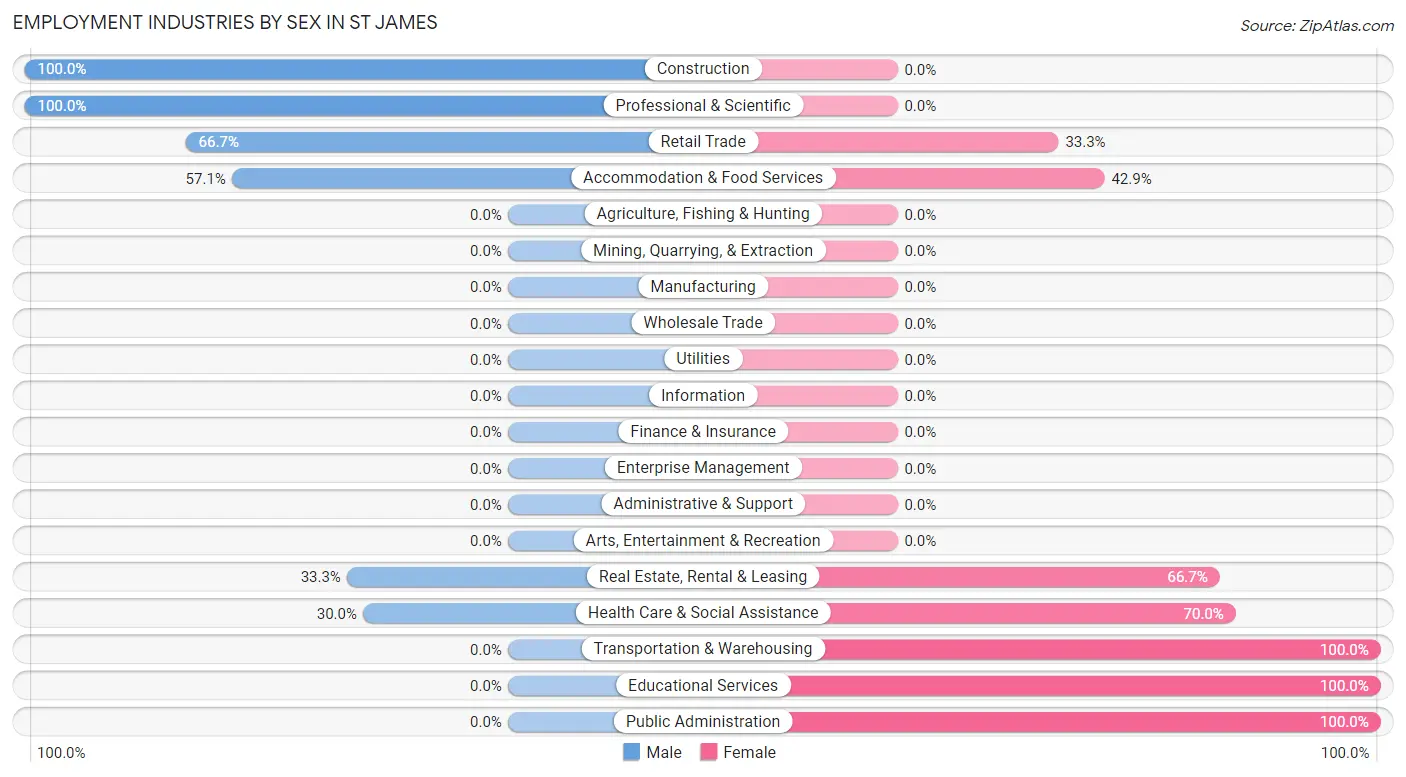
Employment Industries by Sex in St James
The St James industries that see more men than women are Construction (100.0%), Professional & Scientific (100.0%), and Retail Trade (66.7%), whereas the industries that tend to have a higher number of women are Transportation & Warehousing (100.0%), Educational Services (100.0%), and Public Administration (100.0%).
| Industry | Male | Female |
| Agriculture, Fishing & Hunting | 0 (0.0%) | 0 (0.0%) |
| Mining, Quarrying, & Extraction | 0 (0.0%) | 0 (0.0%) |
| Construction | 24 (100.0%) | 0 (0.0%) |
| Manufacturing | 0 (0.0%) | 0 (0.0%) |
| Wholesale Trade | 0 (0.0%) | 0 (0.0%) |
| Retail Trade | 6 (66.7%) | 3 (33.3%) |
| Transportation & Warehousing | 0 (0.0%) | 2 (100.0%) |
| Utilities | 0 (0.0%) | 0 (0.0%) |
| Information | 0 (0.0%) | 0 (0.0%) |
| Finance & Insurance | 0 (0.0%) | 0 (0.0%) |
| Real Estate, Rental & Leasing | 1 (33.3%) | 2 (66.7%) |
| Professional & Scientific | 2 (100.0%) | 0 (0.0%) |
| Enterprise Management | 0 (0.0%) | 0 (0.0%) |
| Administrative & Support | 0 (0.0%) | 0 (0.0%) |
| Educational Services | 0 (0.0%) | 2 (100.0%) |
| Health Care & Social Assistance | 3 (30.0%) | 7 (70.0%) |
| Arts, Entertainment & Recreation | 0 (0.0%) | 0 (0.0%) |
| Accommodation & Food Services | 4 (57.1%) | 3 (42.9%) |
| Public Administration | 0 (0.0%) | 1 (100.0%) |
| Total | 40 (66.7%) | 20 (33.3%) |
Education in St James
School Enrollment in St James
The most common levels of schooling among the 5 students in St James are high school (3 | 60.0%), nursery / preschool (1 | 20.0%), and graduate / professional (1 | 20.0%).
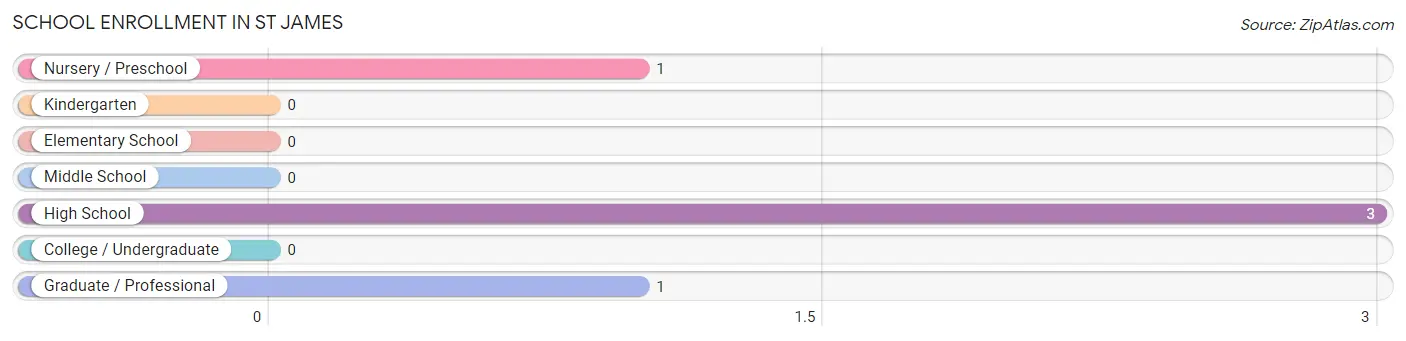
| School Level | # Students | % Students |
| Nursery / Preschool | 1 | 20.0% |
| Kindergarten | 0 | 0.0% |
| Elementary School | 0 | 0.0% |
| Middle School | 0 | 0.0% |
| High School | 3 | 60.0% |
| College / Undergraduate | 0 | 0.0% |
| Graduate / Professional | 1 | 20.0% |
| Total | 5 | 100.0% |
School Enrollment by Age by Funding Source in St James
Out of a total of 5 students who are enrolled in schools in St James, 1 (20.0%) attend a private institution, while the remaining 4 (80.0%) are enrolled in public schools. The age group of 35 years and over has the highest likelihood of being enrolled in private schools, with 1 (100.0% in the age bracket) enrolled. Conversely, the age group of 3 to 4 year olds has the lowest likelihood of being enrolled in a private school, with 1 (100.0% in the age bracket) attending a public institution.
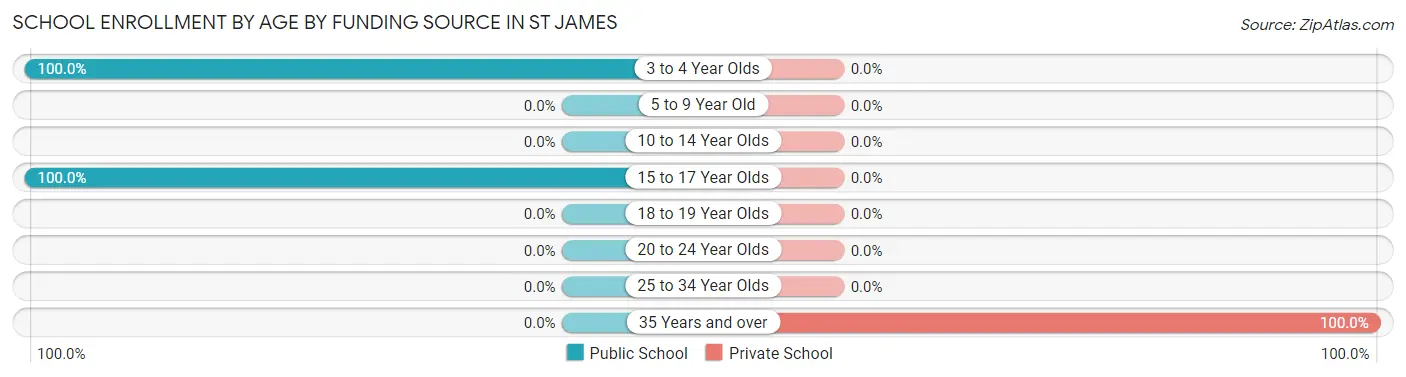
| Age Bracket | Public School | Private School |
| 3 to 4 Year Olds | 1 (100.0%) | 0 (0.0%) |
| 5 to 9 Year Old | 0 (0.0%) | 0 (0.0%) |
| 10 to 14 Year Olds | 0 (0.0%) | 0 (0.0%) |
| 15 to 17 Year Olds | 3 (100.0%) | 0 (0.0%) |
| 18 to 19 Year Olds | 0 (0.0%) | 0 (0.0%) |
| 20 to 24 Year Olds | 0 (0.0%) | 0 (0.0%) |
| 25 to 34 Year Olds | 0 (0.0%) | 0 (0.0%) |
| 35 Years and over | 0 (0.0%) | 1 (100.0%) |
| Total | 4 (80.0%) | 1 (20.0%) |
Educational Attainment by Field of Study in St James
Education (18 | 30.0%), business (9 | 15.0%), visual & performing arts (9 | 15.0%), engineering (8 | 13.3%), and science & technology (7 | 11.7%) are the most common fields of study among 60 individuals in St James who have obtained a bachelor's degree or higher.
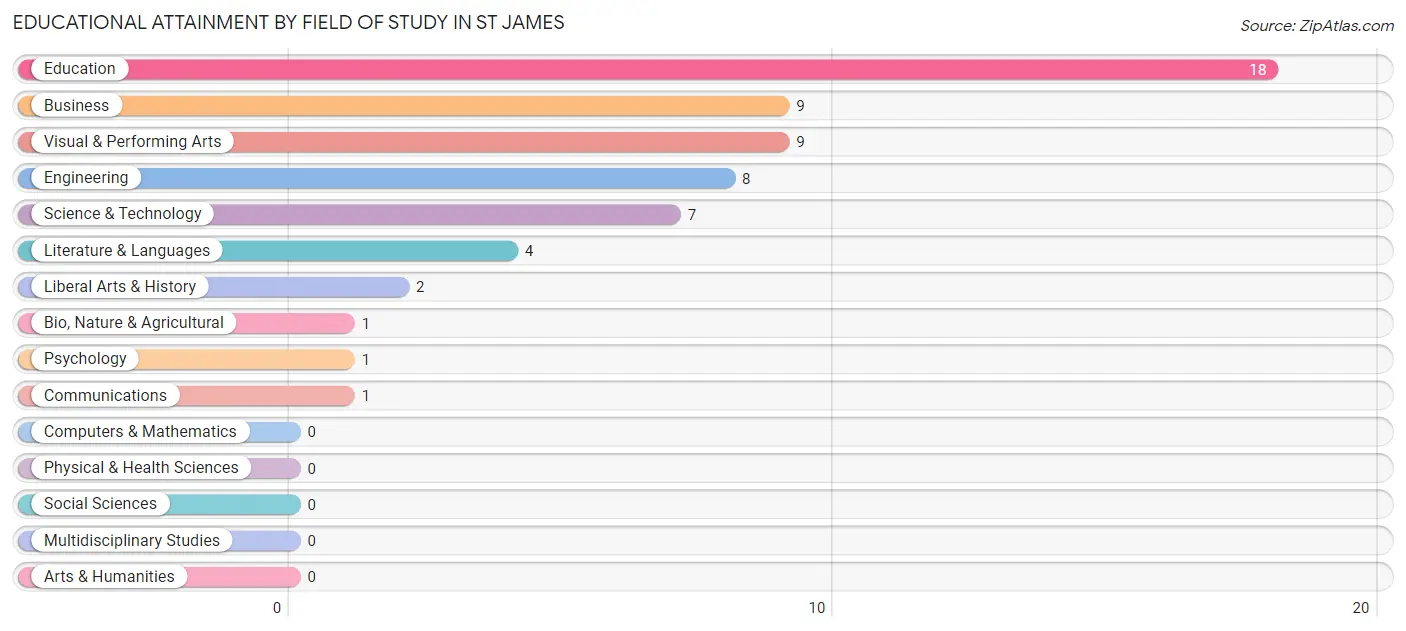
| Field of Study | # Graduates | % Graduates |
| Computers & Mathematics | 0 | 0.0% |
| Bio, Nature & Agricultural | 1 | 1.7% |
| Physical & Health Sciences | 0 | 0.0% |
| Psychology | 1 | 1.7% |
| Social Sciences | 0 | 0.0% |
| Engineering | 8 | 13.3% |
| Multidisciplinary Studies | 0 | 0.0% |
| Science & Technology | 7 | 11.7% |
| Business | 9 | 15.0% |
| Education | 18 | 30.0% |
| Literature & Languages | 4 | 6.7% |
| Liberal Arts & History | 2 | 3.3% |
| Visual & Performing Arts | 9 | 15.0% |
| Communications | 1 | 1.7% |
| Arts & Humanities | 0 | 0.0% |
| Total | 60 | 100.0% |
Transportation & Commute in St James
Vehicle Availability by Sex in St James
The most prevalent vehicle ownership categories in St James are males with 2 vehicles (20, accounting for 50.0%) and females with 2 vehicles (4, making up 100.0%).
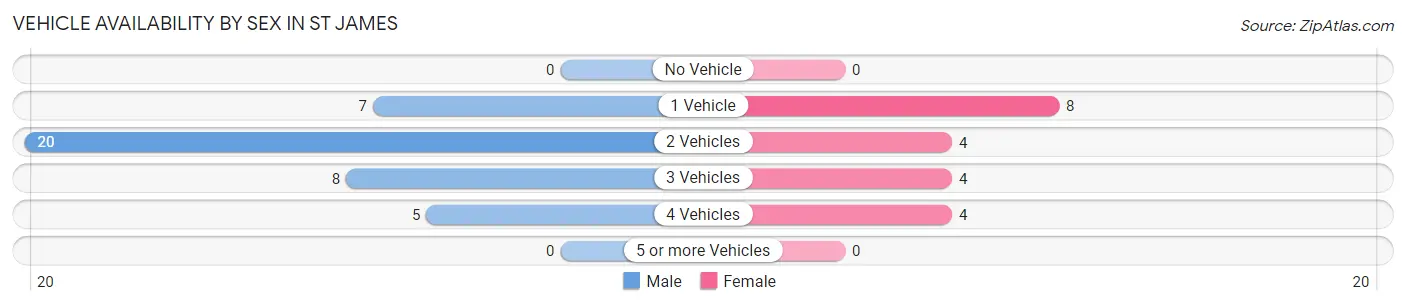
| Vehicles Available | Male | Female |
| No Vehicle | 0 (0.0%) | 0 (0.0%) |
| 1 Vehicle | 7 (17.5%) | 8 (40.0%) |
| 2 Vehicles | 20 (50.0%) | 4 (20.0%) |
| 3 Vehicles | 8 (20.0%) | 4 (20.0%) |
| 4 Vehicles | 5 (12.5%) | 4 (20.0%) |
| 5 or more Vehicles | 0 (0.0%) | 0 (0.0%) |
| Total | 40 (100.0%) | 20 (100.0%) |
Commute Time in St James
The most frequently occuring commute durations in St James are 5 to 9 minutes (18 commuters, 34.0%), 10 to 14 minutes (18 commuters, 34.0%), and less than 5 minutes (13 commuters, 24.5%).
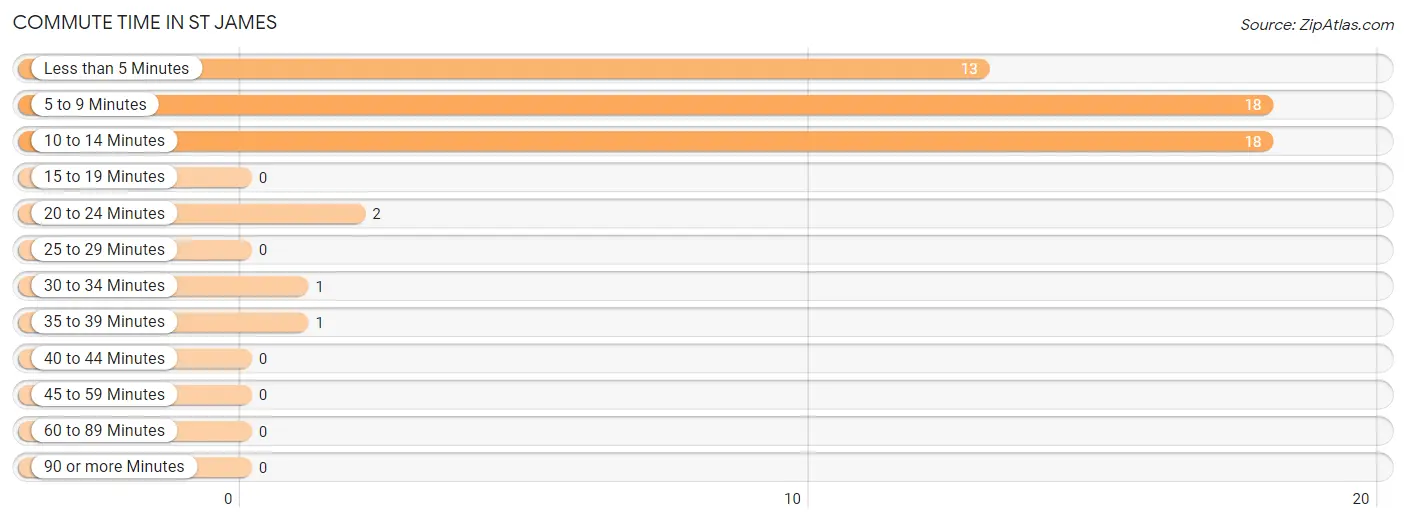
| Commute Time | # Commuters | % Commuters |
| Less than 5 Minutes | 13 | 24.5% |
| 5 to 9 Minutes | 18 | 34.0% |
| 10 to 14 Minutes | 18 | 34.0% |
| 15 to 19 Minutes | 0 | 0.0% |
| 20 to 24 Minutes | 2 | 3.8% |
| 25 to 29 Minutes | 0 | 0.0% |
| 30 to 34 Minutes | 1 | 1.9% |
| 35 to 39 Minutes | 1 | 1.9% |
| 40 to 44 Minutes | 0 | 0.0% |
| 45 to 59 Minutes | 0 | 0.0% |
| 60 to 89 Minutes | 0 | 0.0% |
| 90 or more Minutes | 0 | 0.0% |
Commute Time by Sex in St James
The most common commute times in St James are 5 to 9 minutes (12 commuters, 34.3%) for males and 5 to 9 minutes (6 commuters, 33.3%) for females.
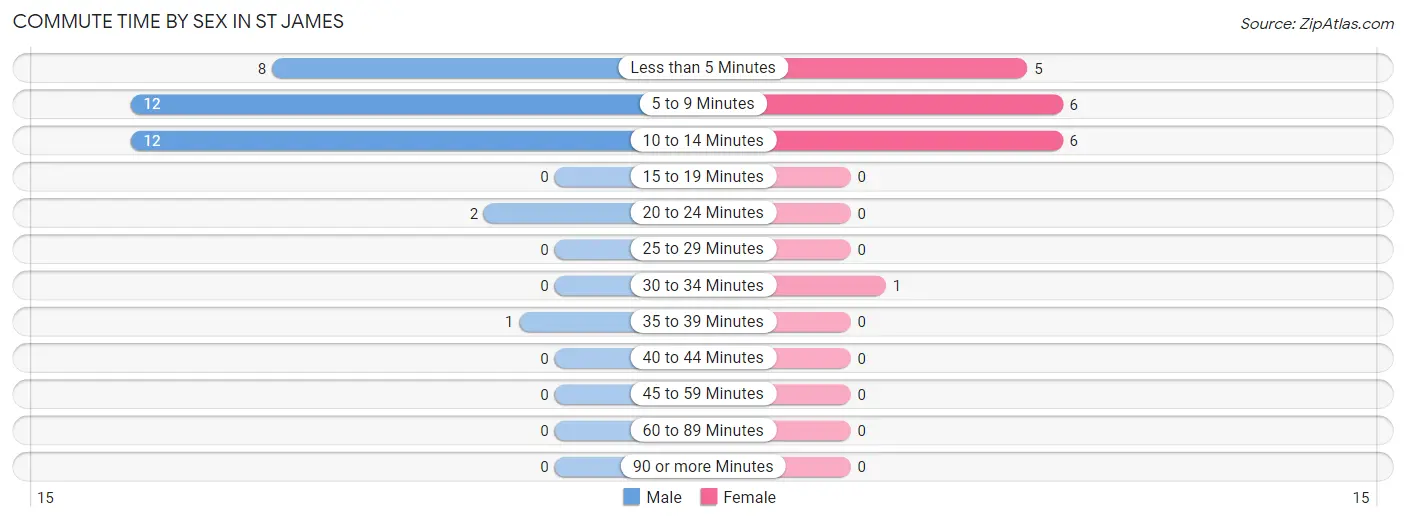
| Commute Time | Male | Female |
| Less than 5 Minutes | 8 (22.9%) | 5 (27.8%) |
| 5 to 9 Minutes | 12 (34.3%) | 6 (33.3%) |
| 10 to 14 Minutes | 12 (34.3%) | 6 (33.3%) |
| 15 to 19 Minutes | 0 (0.0%) | 0 (0.0%) |
| 20 to 24 Minutes | 2 (5.7%) | 0 (0.0%) |
| 25 to 29 Minutes | 0 (0.0%) | 0 (0.0%) |
| 30 to 34 Minutes | 0 (0.0%) | 1 (5.6%) |
| 35 to 39 Minutes | 1 (2.9%) | 0 (0.0%) |
| 40 to 44 Minutes | 0 (0.0%) | 0 (0.0%) |
| 45 to 59 Minutes | 0 (0.0%) | 0 (0.0%) |
| 60 to 89 Minutes | 0 (0.0%) | 0 (0.0%) |
| 90 or more Minutes | 0 (0.0%) | 0 (0.0%) |
Time of Departure to Work by Sex in St James
The most frequent times of departure to work in St James are 7:00 AM to 7:29 AM (10, 28.6%) for males and 10:00 AM to 10:59 AM (6, 33.3%) for females.
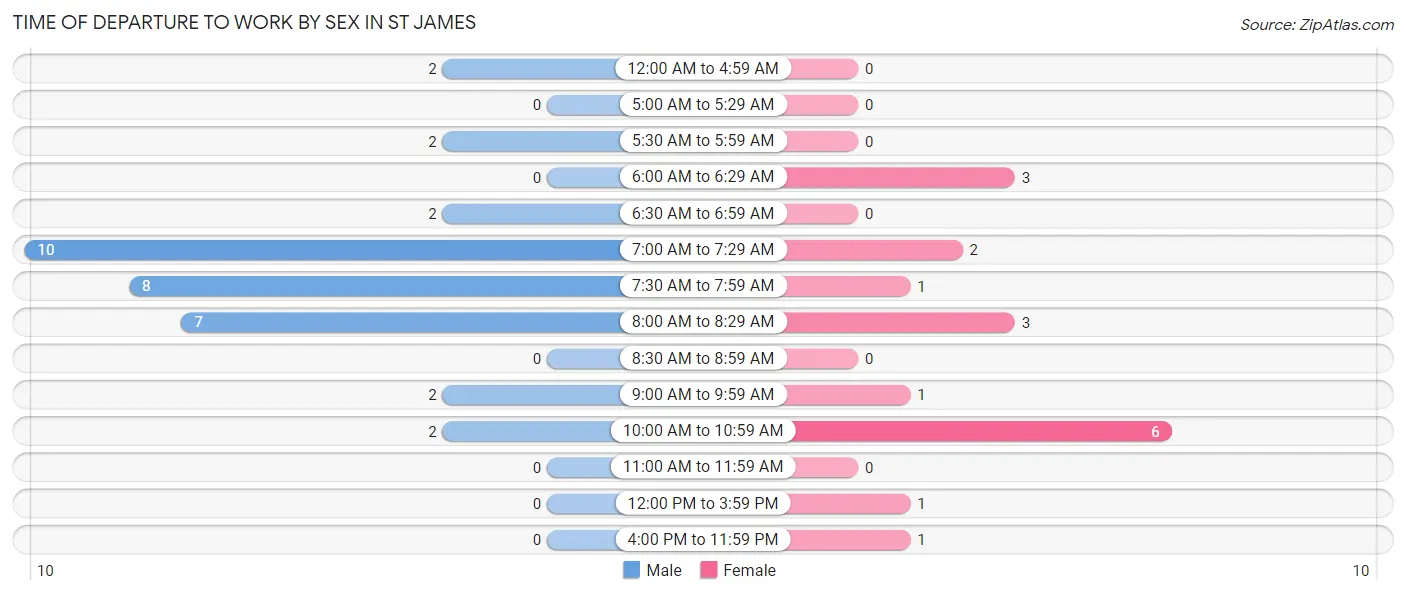
| Time of Departure | Male | Female |
| 12:00 AM to 4:59 AM | 2 (5.7%) | 0 (0.0%) |
| 5:00 AM to 5:29 AM | 0 (0.0%) | 0 (0.0%) |
| 5:30 AM to 5:59 AM | 2 (5.7%) | 0 (0.0%) |
| 6:00 AM to 6:29 AM | 0 (0.0%) | 3 (16.7%) |
| 6:30 AM to 6:59 AM | 2 (5.7%) | 0 (0.0%) |
| 7:00 AM to 7:29 AM | 10 (28.6%) | 2 (11.1%) |
| 7:30 AM to 7:59 AM | 8 (22.9%) | 1 (5.6%) |
| 8:00 AM to 8:29 AM | 7 (20.0%) | 3 (16.7%) |
| 8:30 AM to 8:59 AM | 0 (0.0%) | 0 (0.0%) |
| 9:00 AM to 9:59 AM | 2 (5.7%) | 1 (5.6%) |
| 10:00 AM to 10:59 AM | 2 (5.7%) | 6 (33.3%) |
| 11:00 AM to 11:59 AM | 0 (0.0%) | 0 (0.0%) |
| 12:00 PM to 3:59 PM | 0 (0.0%) | 1 (5.6%) |
| 4:00 PM to 11:59 PM | 0 (0.0%) | 1 (5.6%) |
| Total | 35 (100.0%) | 18 (100.0%) |
Housing Occupancy in St James
Occupancy by Ownership in St James
Of the total 99 dwellings in St James, owner-occupied units account for 87 (87.9%), while renter-occupied units make up 12 (12.1%).
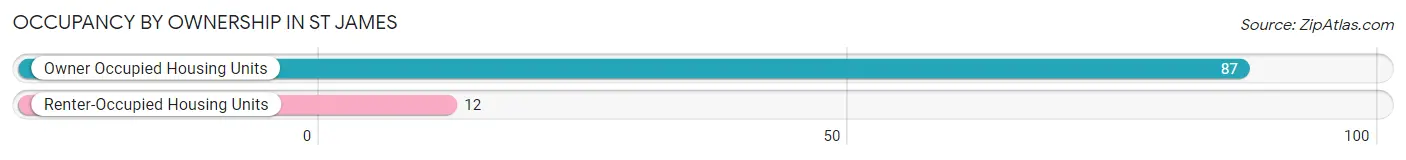
| Occupancy | # Housing Units | % Housing Units |
| Owner Occupied Housing Units | 87 | 87.9% |
| Renter-Occupied Housing Units | 12 | 12.1% |
| Total Occupied Housing Units | 99 | 100.0% |
Occupancy by Household Size in St James
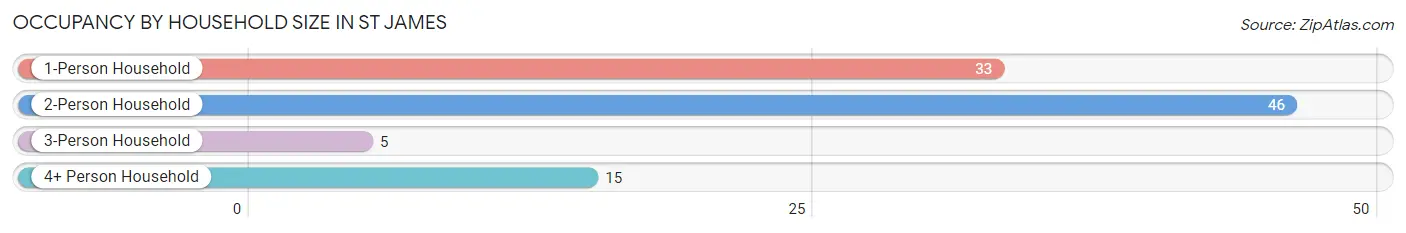
| Household Size | # Housing Units | % Housing Units |
| 1-Person Household | 33 | 33.3% |
| 2-Person Household | 46 | 46.5% |
| 3-Person Household | 5 | 5.1% |
| 4+ Person Household | 15 | 15.1% |
| Total Housing Units | 99 | 100.0% |
Occupancy by Ownership by Household Size in St James
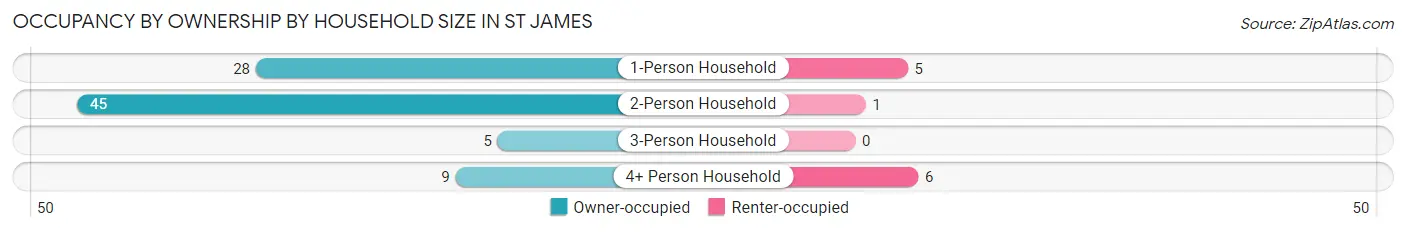
| Household Size | Owner-occupied | Renter-occupied |
| 1-Person Household | 28 (84.9%) | 5 (15.1%) |
| 2-Person Household | 45 (97.8%) | 1 (2.2%) |
| 3-Person Household | 5 (100.0%) | 0 (0.0%) |
| 4+ Person Household | 9 (60.0%) | 6 (40.0%) |
| Total Housing Units | 87 (87.9%) | 12 (12.1%) |
Occupancy by Educational Attainment in St James
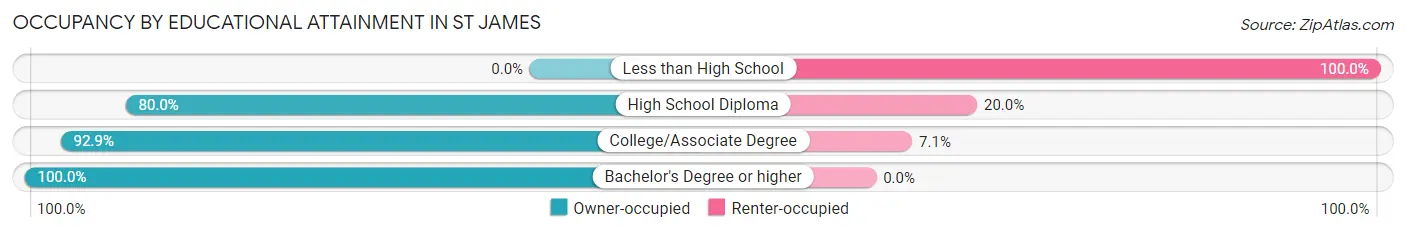
| Household Size | Owner-occupied | Renter-occupied |
| Less than High School | 0 (0.0%) | 4 (100.0%) |
| High School Diploma | 24 (80.0%) | 6 (20.0%) |
| College/Associate Degree | 26 (92.9%) | 2 (7.1%) |
| Bachelor's Degree or higher | 37 (100.0%) | 0 (0.0%) |
Occupancy by Age of Householder in St James
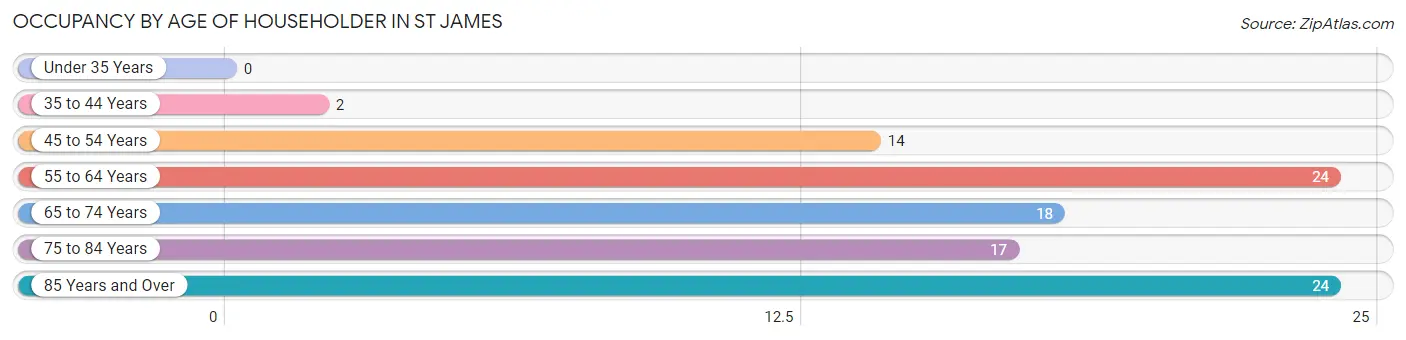
| Age Bracket | # Households | % Households |
| Under 35 Years | 0 | 0.0% |
| 35 to 44 Years | 2 | 2.0% |
| 45 to 54 Years | 14 | 14.1% |
| 55 to 64 Years | 24 | 24.2% |
| 65 to 74 Years | 18 | 18.2% |
| 75 to 84 Years | 17 | 17.2% |
| 85 Years and Over | 24 | 24.2% |
| Total | 99 | 100.0% |
Housing Finances in St James
Median Income by Occupancy in St James
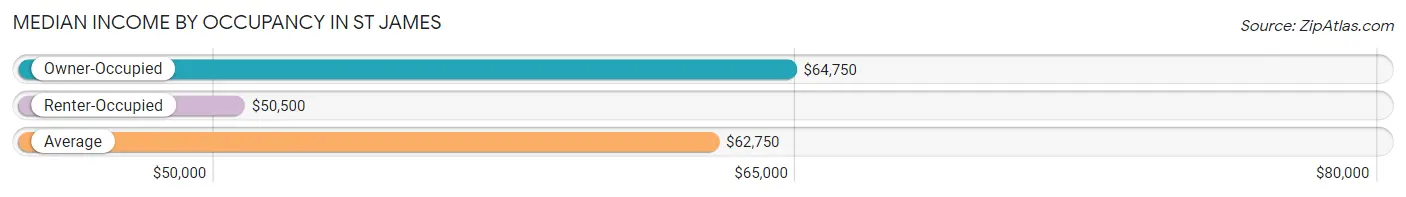
| Occupancy Type | # Households | Median Income |
| Owner-Occupied | 87 (87.9%) | $64,750 |
| Renter-Occupied | 12 (12.1%) | $50,500 |
| Average | 99 (100.0%) | $62,750 |
Occupancy by Householder Income Bracket in St James
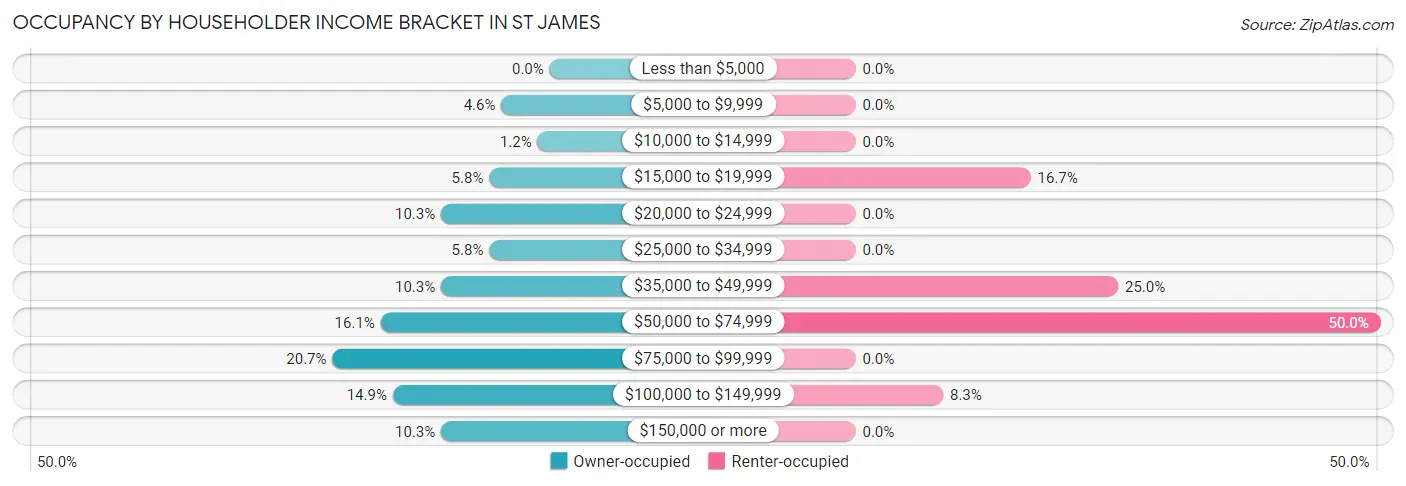
| Income Bracket | Owner-occupied | Renter-occupied |
| Less than $5,000 | 0 (0.0%) | 0 (0.0%) |
| $5,000 to $9,999 | 4 (4.6%) | 0 (0.0%) |
| $10,000 to $14,999 | 1 (1.1%) | 0 (0.0%) |
| $15,000 to $19,999 | 5 (5.8%) | 2 (16.7%) |
| $20,000 to $24,999 | 9 (10.3%) | 0 (0.0%) |
| $25,000 to $34,999 | 5 (5.8%) | 0 (0.0%) |
| $35,000 to $49,999 | 9 (10.3%) | 3 (25.0%) |
| $50,000 to $74,999 | 14 (16.1%) | 6 (50.0%) |
| $75,000 to $99,999 | 18 (20.7%) | 0 (0.0%) |
| $100,000 to $149,999 | 13 (14.9%) | 1 (8.3%) |
| $150,000 or more | 9 (10.3%) | 0 (0.0%) |
| Total | 87 (100.0%) | 12 (100.0%) |
Monthly Housing Cost Tiers in St James
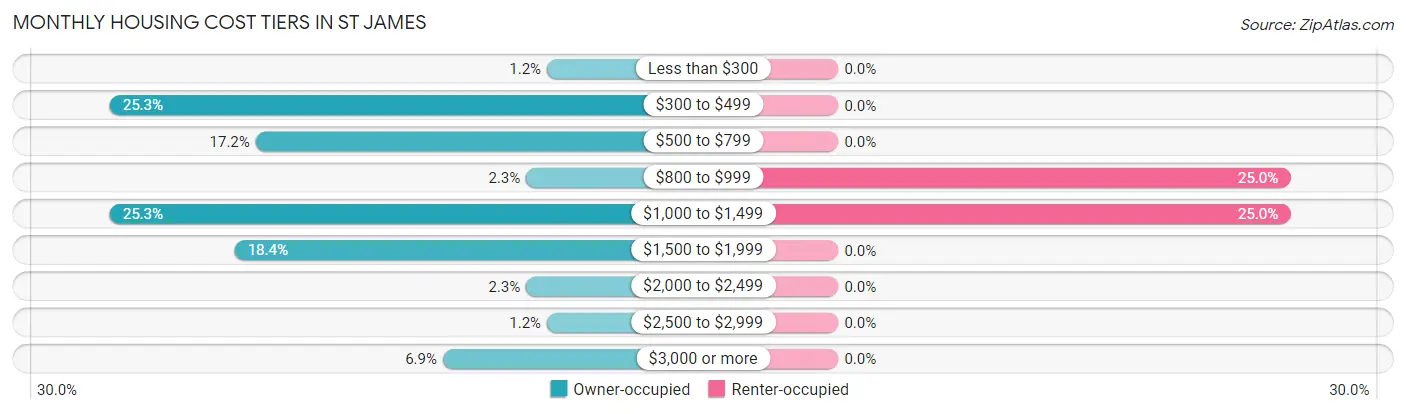
| Monthly Cost | Owner-occupied | Renter-occupied |
| Less than $300 | 1 (1.1%) | 0 (0.0%) |
| $300 to $499 | 22 (25.3%) | 0 (0.0%) |
| $500 to $799 | 15 (17.2%) | 0 (0.0%) |
| $800 to $999 | 2 (2.3%) | 3 (25.0%) |
| $1,000 to $1,499 | 22 (25.3%) | 3 (25.0%) |
| $1,500 to $1,999 | 16 (18.4%) | 0 (0.0%) |
| $2,000 to $2,499 | 2 (2.3%) | 0 (0.0%) |
| $2,500 to $2,999 | 1 (1.1%) | 0 (0.0%) |
| $3,000 or more | 6 (6.9%) | 0 (0.0%) |
| Total | 87 (100.0%) | 12 (100.0%) |
Physical Housing Characteristics in St James
Housing Structures in St James
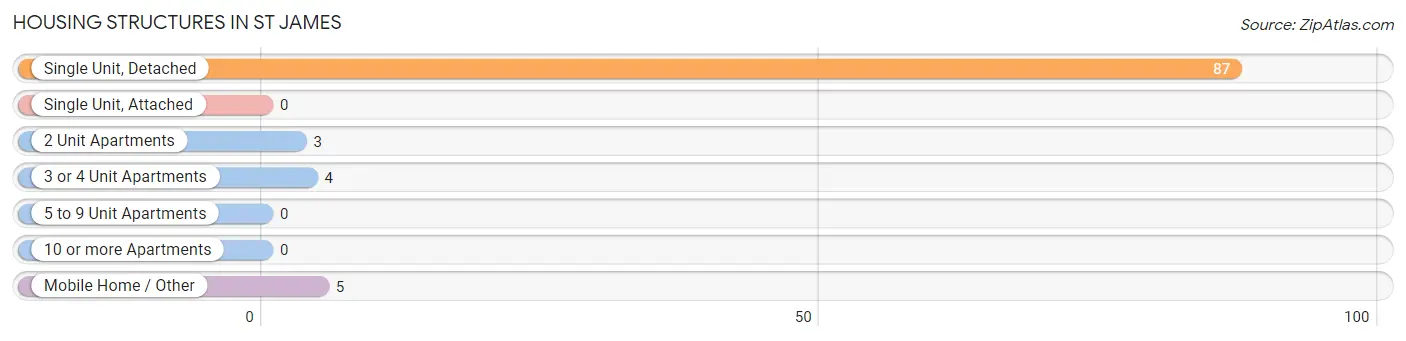
| Structure Type | # Housing Units | % Housing Units |
| Single Unit, Detached | 87 | 87.9% |
| Single Unit, Attached | 0 | 0.0% |
| 2 Unit Apartments | 3 | 3.0% |
| 3 or 4 Unit Apartments | 4 | 4.0% |
| 5 to 9 Unit Apartments | 0 | 0.0% |
| 10 or more Apartments | 0 | 0.0% |
| Mobile Home / Other | 5 | 5.1% |
| Total | 99 | 100.0% |
Housing Structures by Occupancy in St James
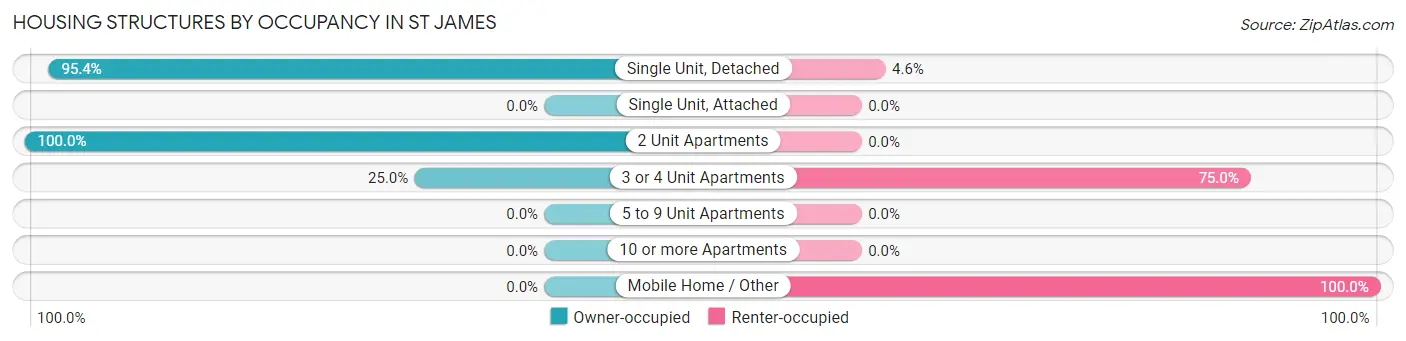
| Structure Type | Owner-occupied | Renter-occupied |
| Single Unit, Detached | 83 (95.4%) | 4 (4.6%) |
| Single Unit, Attached | 0 (0.0%) | 0 (0.0%) |
| 2 Unit Apartments | 3 (100.0%) | 0 (0.0%) |
| 3 or 4 Unit Apartments | 1 (25.0%) | 3 (75.0%) |
| 5 to 9 Unit Apartments | 0 (0.0%) | 0 (0.0%) |
| 10 or more Apartments | 0 (0.0%) | 0 (0.0%) |
| Mobile Home / Other | 0 (0.0%) | 5 (100.0%) |
| Total | 87 (87.9%) | 12 (12.1%) |
Housing Structures by Number of Rooms in St James
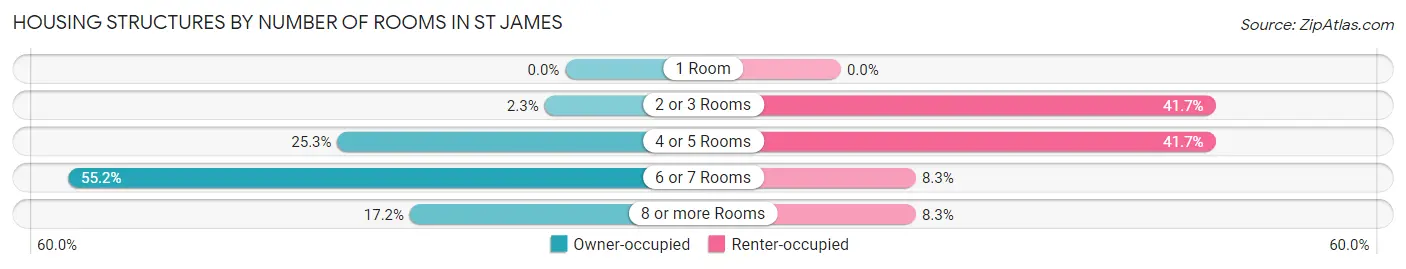
| Number of Rooms | Owner-occupied | Renter-occupied |
| 1 Room | 0 (0.0%) | 0 (0.0%) |
| 2 or 3 Rooms | 2 (2.3%) | 5 (41.7%) |
| 4 or 5 Rooms | 22 (25.3%) | 5 (41.7%) |
| 6 or 7 Rooms | 48 (55.2%) | 1 (8.3%) |
| 8 or more Rooms | 15 (17.2%) | 1 (8.3%) |
| Total | 87 (100.0%) | 12 (100.0%) |
Housing Structure by Heating Type in St James
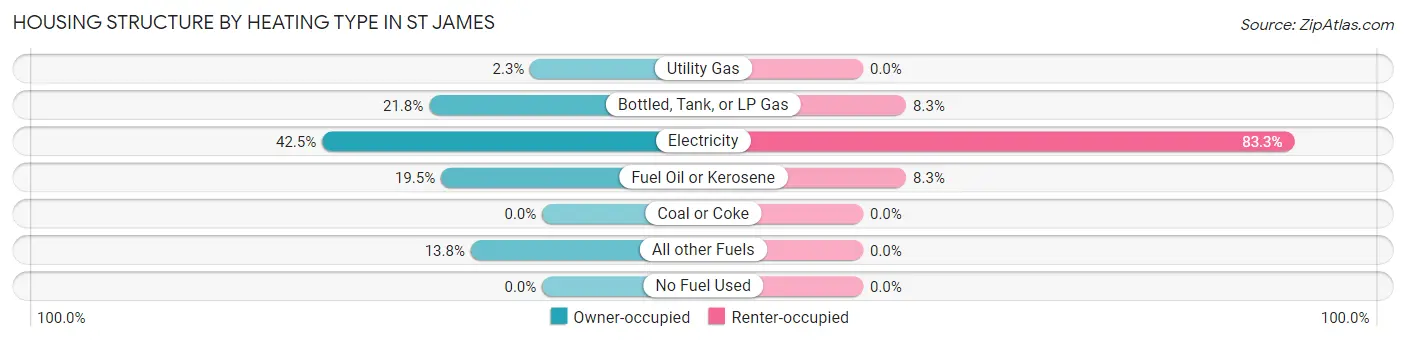
| Heating Type | Owner-occupied | Renter-occupied |
| Utility Gas | 2 (2.3%) | 0 (0.0%) |
| Bottled, Tank, or LP Gas | 19 (21.8%) | 1 (8.3%) |
| Electricity | 37 (42.5%) | 10 (83.3%) |
| Fuel Oil or Kerosene | 17 (19.5%) | 1 (8.3%) |
| Coal or Coke | 0 (0.0%) | 0 (0.0%) |
| All other Fuels | 12 (13.8%) | 0 (0.0%) |
| No Fuel Used | 0 (0.0%) | 0 (0.0%) |
| Total | 87 (100.0%) | 12 (100.0%) |
Household Vehicle Usage in St James
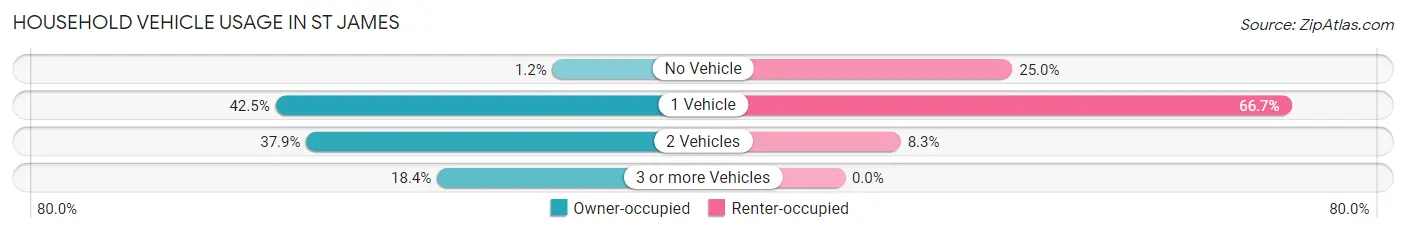
| Vehicles per Household | Owner-occupied | Renter-occupied |
| No Vehicle | 1 (1.1%) | 3 (25.0%) |
| 1 Vehicle | 37 (42.5%) | 8 (66.7%) |
| 2 Vehicles | 33 (37.9%) | 1 (8.3%) |
| 3 or more Vehicles | 16 (18.4%) | 0 (0.0%) |
| Total | 87 (100.0%) | 12 (100.0%) |
Real Estate & Mortgages in St James
Real Estate and Mortgage Overview in St James
| Characteristic | Without Mortgage | With Mortgage |
| Housing Units | 50 | 37 |
| Median Property Value | $266,700 | $262,500 |
| Median Household Income | $77,857 | $5 |
| Monthly Housing Costs | $650 | $6 |
| Real Estate Taxes | $3,667 | $0 |
Property Value by Mortgage Status in St James
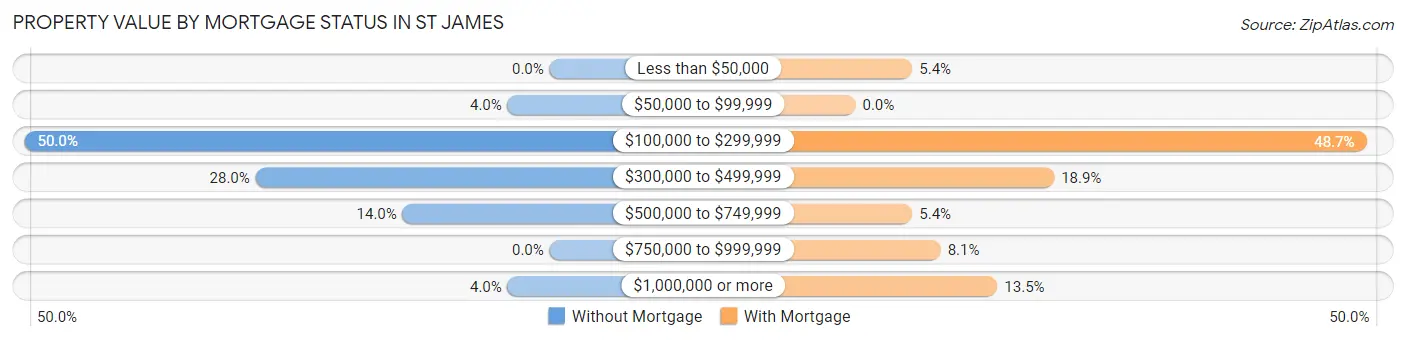
| Property Value | Without Mortgage | With Mortgage |
| Less than $50,000 | 0 (0.0%) | 2 (5.4%) |
| $50,000 to $99,999 | 2 (4.0%) | 0 (0.0%) |
| $100,000 to $299,999 | 25 (50.0%) | 18 (48.6%) |
| $300,000 to $499,999 | 14 (28.0%) | 7 (18.9%) |
| $500,000 to $749,999 | 7 (14.0%) | 2 (5.4%) |
| $750,000 to $999,999 | 0 (0.0%) | 3 (8.1%) |
| $1,000,000 or more | 2 (4.0%) | 5 (13.5%) |
| Total | 50 (100.0%) | 37 (100.0%) |
Household Income by Mortgage Status in St James
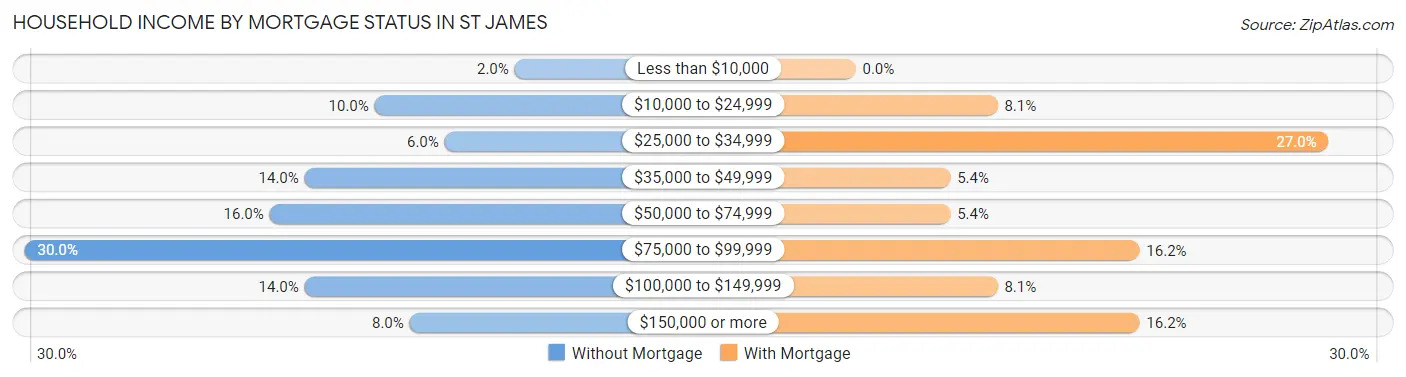
| Household Income | Without Mortgage | With Mortgage |
| Less than $10,000 | 1 (2.0%) | 0 (0.0%) |
| $10,000 to $24,999 | 5 (10.0%) | 3 (8.1%) |
| $25,000 to $34,999 | 3 (6.0%) | 10 (27.0%) |
| $35,000 to $49,999 | 7 (14.0%) | 2 (5.4%) |
| $50,000 to $74,999 | 8 (16.0%) | 2 (5.4%) |
| $75,000 to $99,999 | 15 (30.0%) | 6 (16.2%) |
| $100,000 to $149,999 | 7 (14.0%) | 3 (8.1%) |
| $150,000 or more | 4 (8.0%) | 6 (16.2%) |
| Total | 50 (100.0%) | 37 (100.0%) |
Property Value to Household Income Ratio in St James
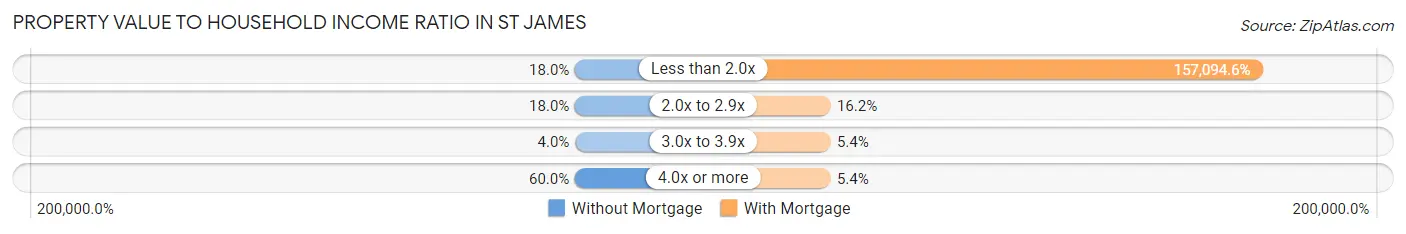
| Value-to-Income Ratio | Without Mortgage | With Mortgage |
| Less than 2.0x | 9 (18.0%) | 58,125 (157,094.6%) |
| 2.0x to 2.9x | 9 (18.0%) | 6 (16.2%) |
| 3.0x to 3.9x | 2 (4.0%) | 2 (5.4%) |
| 4.0x or more | 30 (60.0%) | 2 (5.4%) |
| Total | 50 (100.0%) | 37 (100.0%) |
Real Estate Taxes by Mortgage Status in St James

| Property Taxes | Without Mortgage | With Mortgage |
| Less than $800 | 3 (6.0%) | 0 (0.0%) |
| $800 to $1,499 | 3 (6.0%) | 2 (5.4%) |
| $800 to $1,499 | 44 (88.0%) | 9 (24.3%) |
| Total | 50 (100.0%) | 37 (100.0%) |
Health & Disability in St James
Health Insurance Coverage by Age in St James
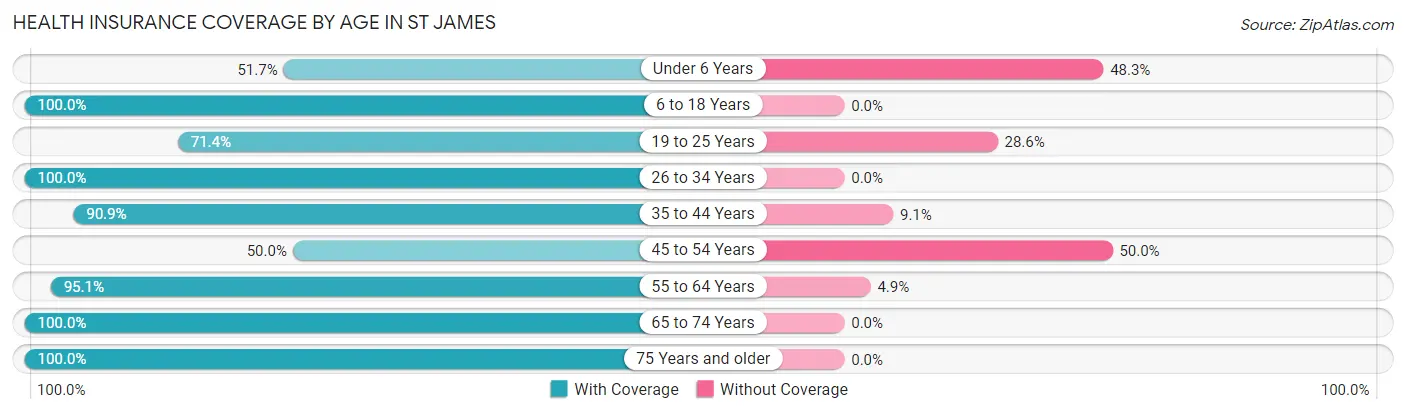
| Age Bracket | With Coverage | Without Coverage |
| Under 6 Years | 30 (51.7%) | 28 (48.3%) |
| 6 to 18 Years | 3 (100.0%) | 0 (0.0%) |
| 19 to 25 Years | 5 (71.4%) | 2 (28.6%) |
| 26 to 34 Years | 1 (100.0%) | 0 (0.0%) |
| 35 to 44 Years | 10 (90.9%) | 1 (9.1%) |
| 45 to 54 Years | 9 (50.0%) | 9 (50.0%) |
| 55 to 64 Years | 39 (95.1%) | 2 (4.9%) |
| 65 to 74 Years | 39 (100.0%) | 0 (0.0%) |
| 75 Years and older | 48 (100.0%) | 0 (0.0%) |
| Total | 184 (81.4%) | 42 (18.6%) |
Health Insurance Coverage by Citizenship Status in St James
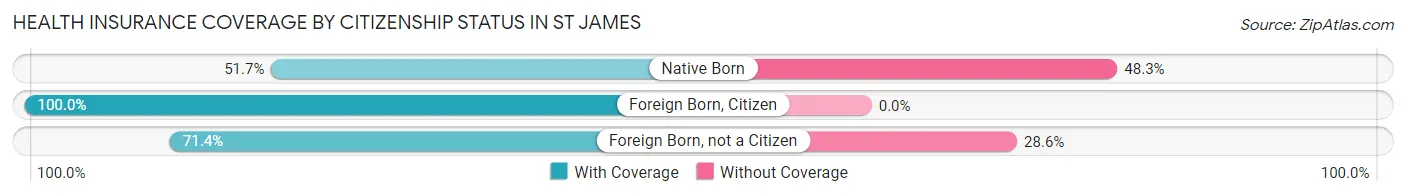
| Citizenship Status | With Coverage | Without Coverage |
| Native Born | 30 (51.7%) | 28 (48.3%) |
| Foreign Born, Citizen | 3 (100.0%) | 0 (0.0%) |
| Foreign Born, not a Citizen | 5 (71.4%) | 2 (28.6%) |
Health Insurance Coverage by Household Income in St James
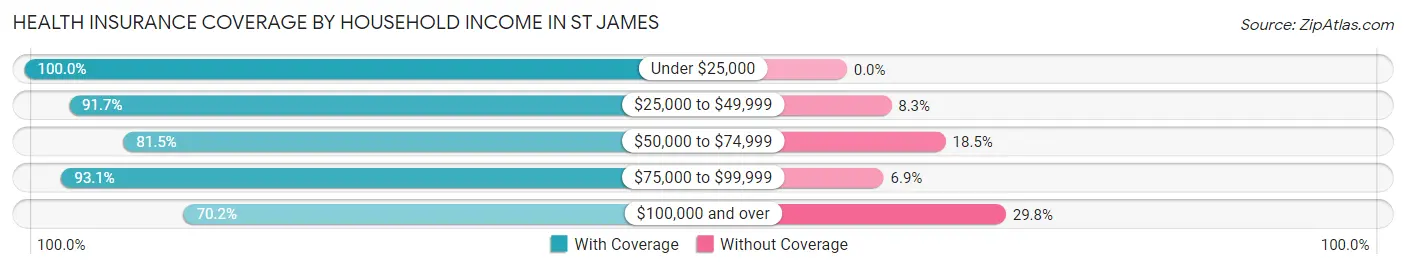
| Household Income | With Coverage | Without Coverage |
| Under $25,000 | 25 (100.0%) | 0 (0.0%) |
| $25,000 to $49,999 | 22 (91.7%) | 2 (8.3%) |
| $50,000 to $74,999 | 44 (81.5%) | 10 (18.5%) |
| $75,000 to $99,999 | 27 (93.1%) | 2 (6.9%) |
| $100,000 and over | 66 (70.2%) | 28 (29.8%) |
Public vs Private Health Insurance Coverage by Age in St James
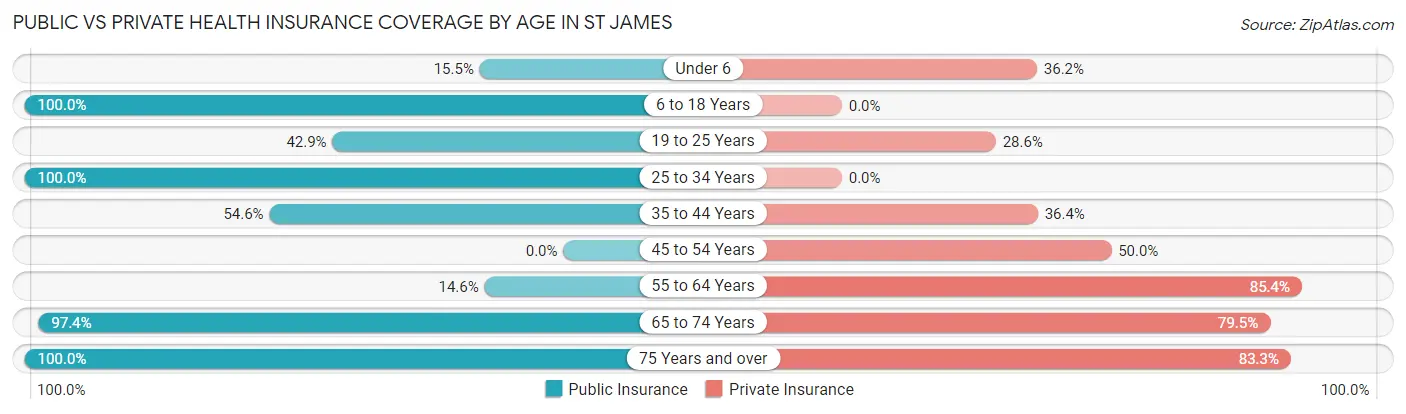
| Age Bracket | Public Insurance | Private Insurance |
| Under 6 | 9 (15.5%) | 21 (36.2%) |
| 6 to 18 Years | 3 (100.0%) | 0 (0.0%) |
| 19 to 25 Years | 3 (42.9%) | 2 (28.6%) |
| 25 to 34 Years | 1 (100.0%) | 0 (0.0%) |
| 35 to 44 Years | 6 (54.5%) | 4 (36.4%) |
| 45 to 54 Years | 0 (0.0%) | 9 (50.0%) |
| 55 to 64 Years | 6 (14.6%) | 35 (85.4%) |
| 65 to 74 Years | 38 (97.4%) | 31 (79.5%) |
| 75 Years and over | 48 (100.0%) | 40 (83.3%) |
| Total | 114 (50.4%) | 142 (62.8%) |
Disability Status by Sex by Age in St James
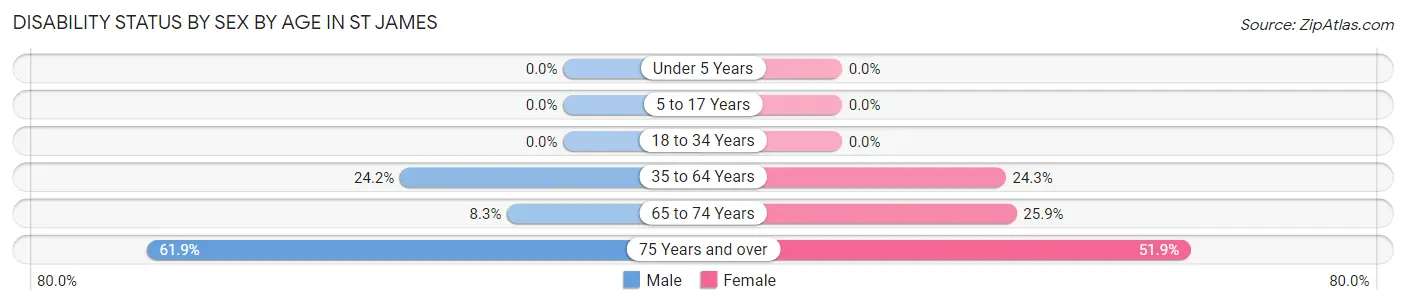
| Age Bracket | Male | Female |
| Under 5 Years | 0 (0.0%) | 0 (0.0%) |
| 5 to 17 Years | 0 (0.0%) | 0 (0.0%) |
| 18 to 34 Years | 0 (0.0%) | 0 (0.0%) |
| 35 to 64 Years | 8 (24.2%) | 9 (24.3%) |
| 65 to 74 Years | 1 (8.3%) | 7 (25.9%) |
| 75 Years and over | 13 (61.9%) | 14 (51.8%) |
Disability Class by Sex by Age in St James
Disability Class: Hearing Difficulty
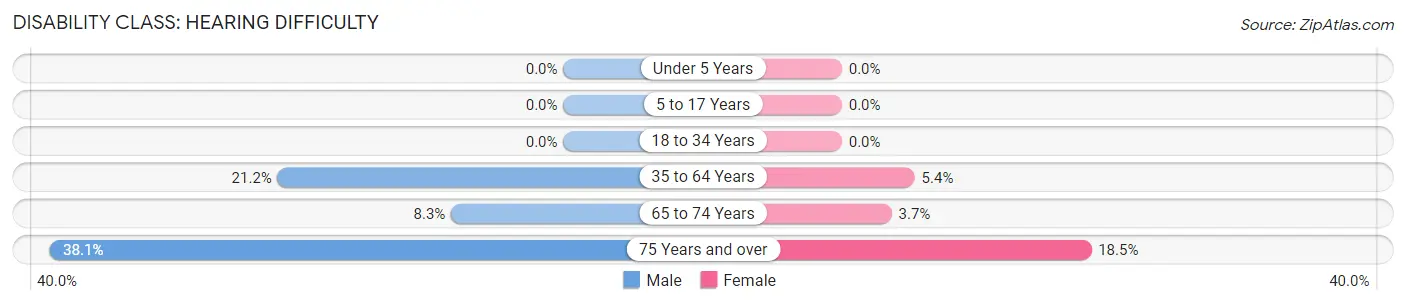
| Age Bracket | Male | Female |
| Under 5 Years | 0 (0.0%) | 0 (0.0%) |
| 5 to 17 Years | 0 (0.0%) | 0 (0.0%) |
| 18 to 34 Years | 0 (0.0%) | 0 (0.0%) |
| 35 to 64 Years | 7 (21.2%) | 2 (5.4%) |
| 65 to 74 Years | 1 (8.3%) | 1 (3.7%) |
| 75 Years and over | 8 (38.1%) | 5 (18.5%) |
Disability Class: Vision Difficulty
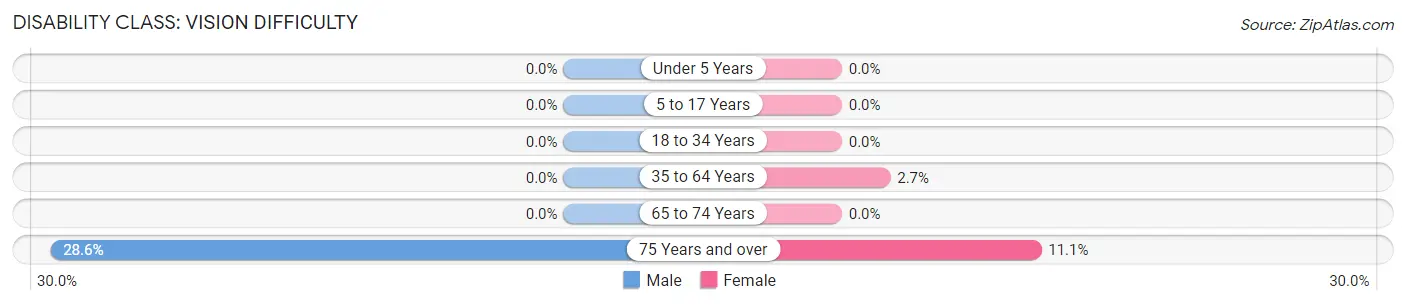
| Age Bracket | Male | Female |
| Under 5 Years | 0 (0.0%) | 0 (0.0%) |
| 5 to 17 Years | 0 (0.0%) | 0 (0.0%) |
| 18 to 34 Years | 0 (0.0%) | 0 (0.0%) |
| 35 to 64 Years | 0 (0.0%) | 1 (2.7%) |
| 65 to 74 Years | 0 (0.0%) | 0 (0.0%) |
| 75 Years and over | 6 (28.6%) | 3 (11.1%) |
Disability Class: Cognitive Difficulty
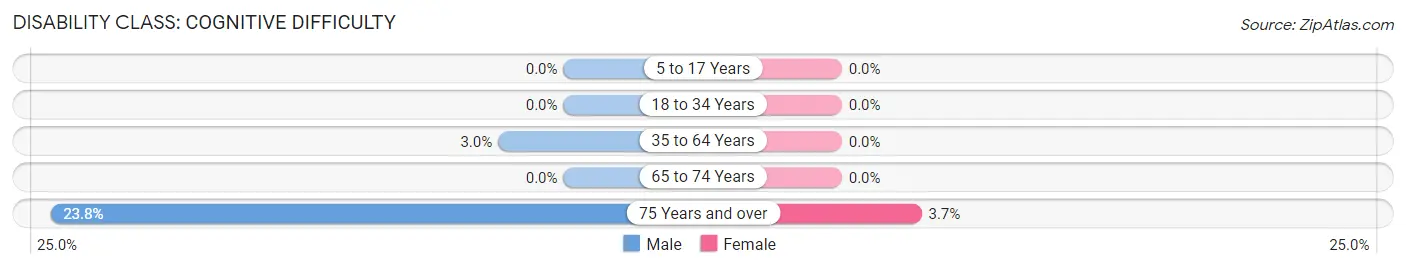
| Age Bracket | Male | Female |
| 5 to 17 Years | 0 (0.0%) | 0 (0.0%) |
| 18 to 34 Years | 0 (0.0%) | 0 (0.0%) |
| 35 to 64 Years | 1 (3.0%) | 0 (0.0%) |
| 65 to 74 Years | 0 (0.0%) | 0 (0.0%) |
| 75 Years and over | 5 (23.8%) | 1 (3.7%) |
Disability Class: Ambulatory Difficulty
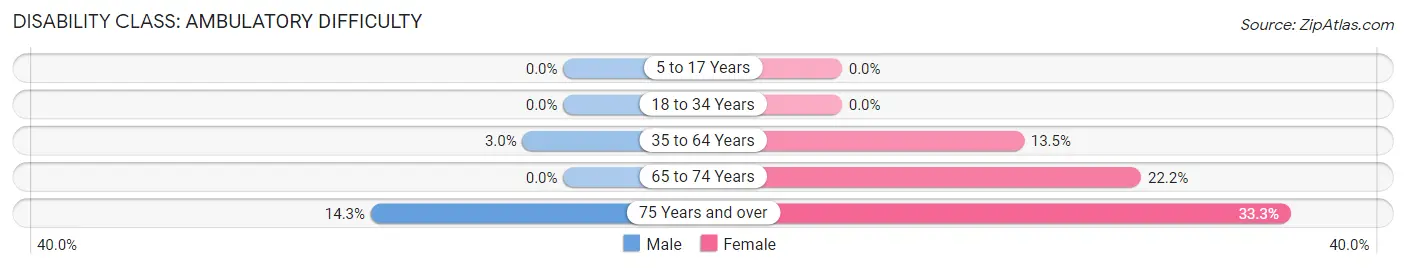
| Age Bracket | Male | Female |
| 5 to 17 Years | 0 (0.0%) | 0 (0.0%) |
| 18 to 34 Years | 0 (0.0%) | 0 (0.0%) |
| 35 to 64 Years | 1 (3.0%) | 5 (13.5%) |
| 65 to 74 Years | 0 (0.0%) | 6 (22.2%) |
| 75 Years and over | 3 (14.3%) | 9 (33.3%) |
Disability Class: Self-Care Difficulty
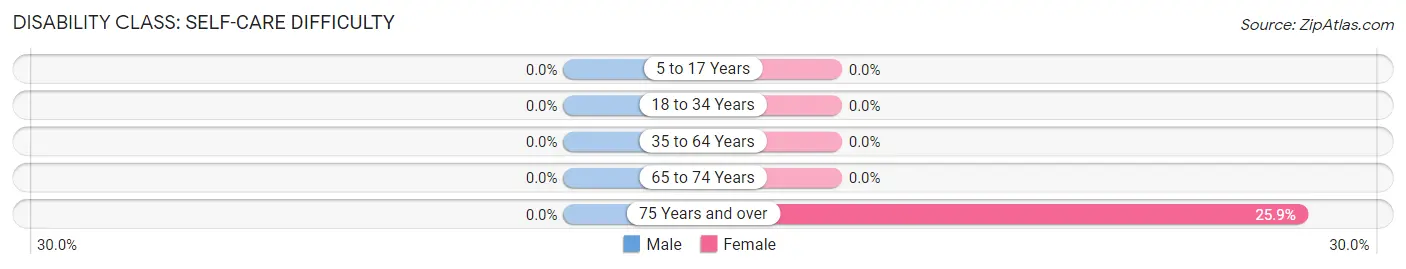
| Age Bracket | Male | Female |
| 5 to 17 Years | 0 (0.0%) | 0 (0.0%) |
| 18 to 34 Years | 0 (0.0%) | 0 (0.0%) |
| 35 to 64 Years | 0 (0.0%) | 0 (0.0%) |
| 65 to 74 Years | 0 (0.0%) | 0 (0.0%) |
| 75 Years and over | 0 (0.0%) | 7 (25.9%) |
Technology Access in St James
Computing Device Access in St James
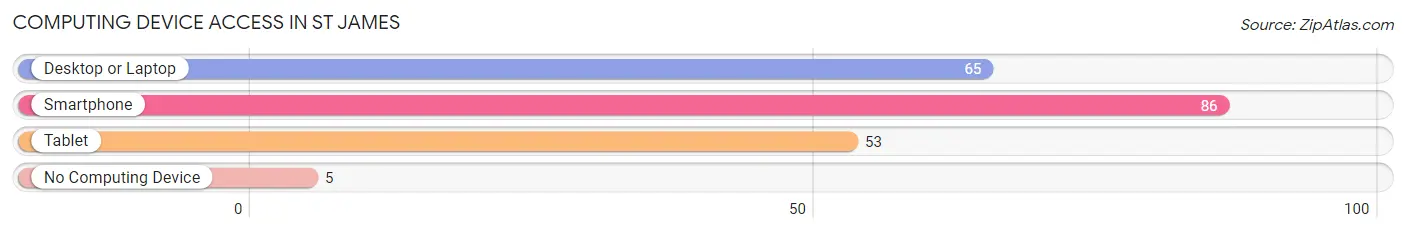
| Device Type | # Households | % Households |
| Desktop or Laptop | 65 | 65.7% |
| Smartphone | 86 | 86.9% |
| Tablet | 53 | 53.5% |
| No Computing Device | 5 | 5.1% |
| Total | 99 | 100.0% |
Internet Access in St James
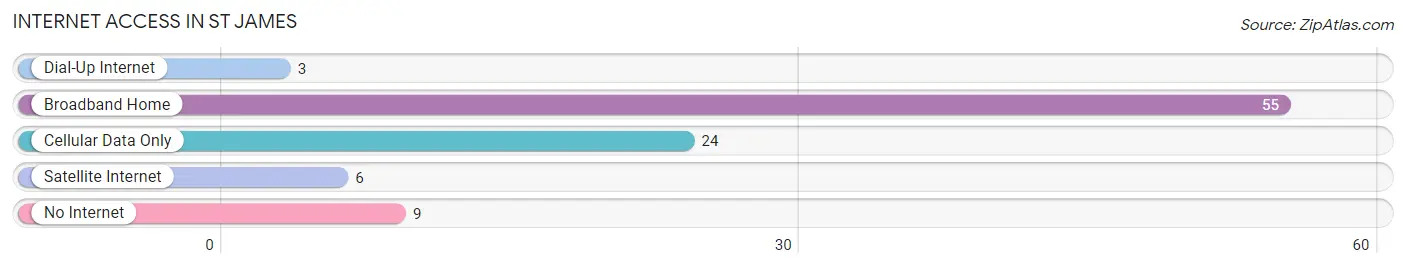
| Internet Type | # Households | % Households |
| Dial-Up Internet | 3 | 3.0% |
| Broadband Home | 55 | 55.6% |
| Cellular Data Only | 24 | 24.2% |
| Satellite Internet | 6 | 6.1% |
| No Internet | 9 | 9.1% |
| Total | 99 | 100.0% |
St James Summary
St. James is a small town located in the state of Michigan in the United States. It is situated in the southeastern corner of the state, near the border with Ohio. The town has a population of just over 1,000 people and is part of the larger St. Clair County.
History
St. James was first settled in 1837 by a group of settlers from New York. The town was originally known as “St. Jamesville” and was named after the patron saint of the settlers, St. James. The town was incorporated in 1845 and was the first town in St. Clair County to be incorporated.
The town grew slowly over the years, but it was not until the late 19th century that it began to experience significant growth. This was due to the development of the railroad, which allowed for the transportation of goods and people to and from the town. The railroad also allowed for the development of industry in the area, which further increased the population of the town.
Geography
St. James is located in the southeastern corner of Michigan, near the border with Ohio. The town is situated on the banks of the St. Clair River, which is a major waterway in the region. The town is surrounded by a number of small lakes, including Lake St. Clair, which is the largest lake in the area.
The town is located in a predominantly rural area, with the majority of the land being used for agricultural purposes. The town is also home to a number of small businesses, including a few restaurants and shops.
Economy
The economy of St. James is largely based on agriculture and tourism. The town is home to a number of small farms, which produce a variety of crops, including corn, soybeans, and wheat. The town is also home to a number of small businesses, including restaurants, shops, and other services.
The town is also home to a number of tourist attractions, including the St. Clair River, which is a popular destination for fishing and boating. The town is also home to a number of historic sites, including the St. James Church, which was built in 1845.
Demographics
As of the 2010 census, the population of St. James was 1,072. The town has a population that is predominantly white, with a small percentage of African Americans and Hispanics. The median household income in the town is $45,000, which is slightly lower than the national average.
The town has a relatively low crime rate, with the majority of crimes being property-related. The town is served by the St. Clair County Sheriff’s Office, which is responsible for law enforcement in the area.
Conclusion
St. James is a small town located in the southeastern corner of Michigan. The town has a population of just over 1,000 people and is part of the larger St. Clair County. The town has a predominantly rural economy, with the majority of the land being used for agricultural purposes. The town is also home to a number of small businesses, including restaurants, shops, and other services. The town has a population that is predominantly white, with a small percentage of African Americans and Hispanics. The town has a relatively low crime rate, with the majority of crimes being property-related.
Common Questions
What is Per Capita Income in St James?
Per Capita income in St James is $35,665.
What is the Median Family Income in St James?
Median Family Income in St James is $78,036.
What is the Median Household income in St James?
Median Household Income in St James is $62,750.
What is Income or Wage Gap in St James?
Income or Wage Gap in St James is 66.3%.
Women in St James earn 33.7 cents for every dollar earned by a man.
What is Inequality or Gini Index in St James?
Inequality or Gini Index in St James is 0.47.
What is the Total Population of St James?
Total Population of St James is 226.
What is the Total Male Population of St James?
Total Male Population of St James is 80.
What is the Total Female Population of St James?
Total Female Population of St James is 146.
What is the Ratio of Males per 100 Females in St James?
There are 54.79 Males per 100 Females in St James.
What is the Ratio of Females per 100 Males in St James?
There are 182.50 Females per 100 Males in St James.
What is the Median Population Age in St James?
Median Population Age in St James is 59.3 Years.
What is the Average Family Size in St James
Average Family Size in St James is 2.9 People.
What is the Average Household Size in St James
Average Household Size in St James is 2.3 People.
How Large is the Labor Force in St James?
There are 76 People in the Labor Forcein in St James.
What is the Percentage of People in the Labor Force in St James?
45.2% of People are in the Labor Force in St James.
What is the Unemployment Rate in St James?
Unemployment Rate in St James is 21.1%.