Cities with the Highest Percentage of Single Mothers in Michigan
RELATED REPORTS & OPTIONS
Most Single Mothers
Michigan
Compare Cities
Map of Cities with the Highest Percentage of Single Mothers in Michigan
0.00%
100.00%
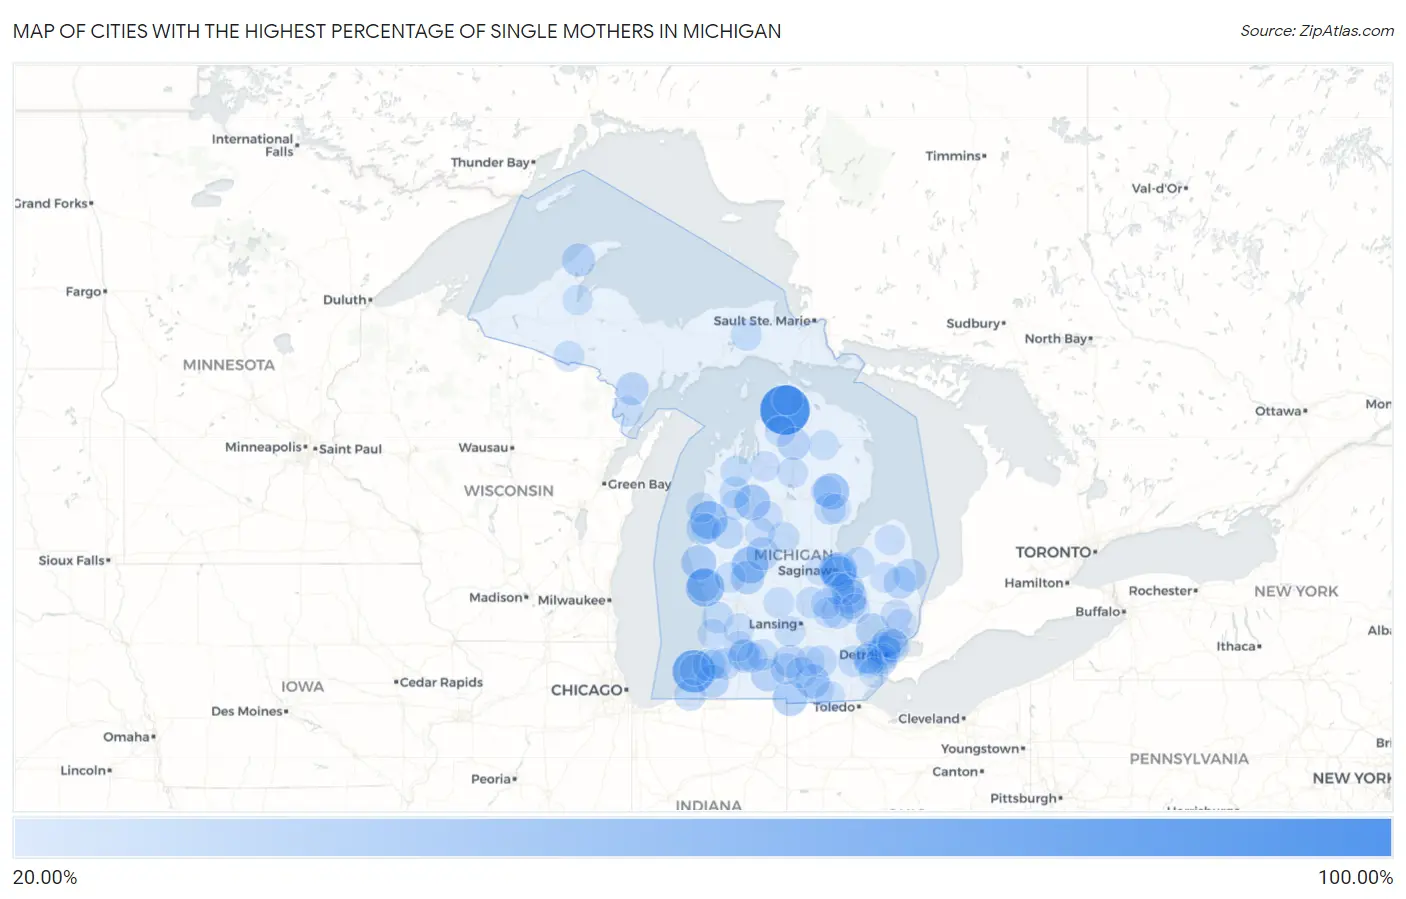
Cities with the Highest Percentage of Single Mothers in Michigan
| City | % Single Mothers | vs State | vs National | |
| 1. | Oden | 82.76% | 11.08% (+71.7)#1 | 11.49% (+71.3)#99 |
| 2. | Millers Lake | 76.92% | 11.08% (+65.8)#2 | 11.49% (+65.4)#121 |
| 3. | Paris | 61.54% | 11.08% (+50.5)#3 | 11.49% (+50.1)#231 |
| 4. | Benton Harbor | 60.11% | 11.08% (+49.0)#4 | 11.49% (+48.6)#248 |
| 5. | Muskegon Heights | 46.53% | 11.08% (+35.4)#5 | 11.49% (+35.0)#532 |
| 6. | Fountain | 44.74% | 11.08% (+33.7)#6 | 11.49% (+33.2)#595 |
| 7. | Morley | 41.30% | 11.08% (+30.2)#7 | 11.49% (+29.8)#770 |
| 8. | Buena Vista | 39.22% | 11.08% (+28.1)#8 | 11.49% (+27.7)#886 |
| 9. | Lupton | 38.57% | 11.08% (+27.5)#9 | 11.49% (+27.1)#926 |
| 10. | Haring | 37.88% | 11.08% (+26.8)#10 | 11.49% (+26.4)#981 |
| 11. | Bridgeport | 36.88% | 11.08% (+25.8)#11 | 11.49% (+25.4)#1,059 |
| 12. | Rothbury | 35.63% | 11.08% (+24.5)#12 | 11.49% (+24.1)#1,183 |
| 13. | Kincheloe | 35.23% | 11.08% (+24.1)#13 | 11.49% (+23.7)#1,229 |
| 14. | Camden | 34.97% | 11.08% (+23.9)#14 | 11.49% (+23.5)#1,259 |
| 15. | Beecher | 33.76% | 11.08% (+22.7)#15 | 11.49% (+22.3)#1,363 |
| 16. | Addison | 33.33% | 11.08% (+22.2)#16 | 11.49% (+21.8)#1,408 |
| 17. | Pierson | 32.14% | 11.08% (+21.1)#17 | 11.49% (+20.7)#1,602 |
| 18. | Pontiac | 31.89% | 11.08% (+20.8)#18 | 11.49% (+20.4)#1,638 |
| 19. | Inkster | 31.57% | 11.08% (+20.5)#19 | 11.49% (+20.1)#1,680 |
| 20. | Detroit | 31.16% | 11.08% (+20.1)#20 | 11.49% (+19.7)#1,742 |
| 21. | Flint | 30.92% | 11.08% (+19.8)#21 | 11.49% (+19.4)#1,786 |
| 22. | Calumet | 30.77% | 11.08% (+19.7)#22 | 11.49% (+19.3)#1,810 |
| 23. | Eastwood | 30.33% | 11.08% (+19.2)#23 | 11.49% (+18.8)#1,883 |
| 24. | Muskegon | 30.25% | 11.08% (+19.2)#24 | 11.49% (+18.8)#1,893 |
| 25. | Highland Park | 30.12% | 11.08% (+19.0)#25 | 11.49% (+18.6)#1,918 |
| 26. | Saginaw | 30.04% | 11.08% (+19.0)#26 | 11.49% (+18.6)#1,930 |
| 27. | Mecosta | 30.00% | 11.08% (+18.9)#27 | 11.49% (+18.5)#1,939 |
| 28. | Union City | 29.93% | 11.08% (+18.8)#28 | 11.49% (+18.4)#1,961 |
| 29. | Clio | 29.89% | 11.08% (+18.8)#29 | 11.49% (+18.4)#1,970 |
| 30. | Albion | 29.69% | 11.08% (+18.6)#30 | 11.49% (+18.2)#2,005 |
| 31. | Powers | 29.55% | 11.08% (+18.5)#31 | 11.49% (+18.1)#2,032 |
| 32. | Gaylord | 29.45% | 11.08% (+18.4)#32 | 11.49% (+18.0)#2,048 |
| 33. | Dowagiac | 29.32% | 11.08% (+18.2)#33 | 11.49% (+17.8)#2,068 |
| 34. | Hartford | 28.93% | 11.08% (+17.8)#34 | 11.49% (+17.4)#2,144 |
| 35. | Applegate | 28.81% | 11.08% (+17.7)#35 | 11.49% (+17.3)#2,172 |
| 36. | Gaines | 28.46% | 11.08% (+17.4)#36 | 11.49% (+17.0)#2,252 |
| 37. | Scottville | 28.41% | 11.08% (+17.3)#37 | 11.49% (+16.9)#2,260 |
| 38. | Peck | 28.12% | 11.08% (+17.0)#38 | 11.49% (+16.6)#2,319 |
| 39. | Harper Woods | 27.73% | 11.08% (+16.6)#39 | 11.49% (+16.2)#2,411 |
| 40. | Baldwin | 27.56% | 11.08% (+16.5)#40 | 11.49% (+16.1)#2,451 |
| 41. | Skidway Lake | 26.50% | 11.08% (+15.4)#41 | 11.49% (+15.0)#2,739 |
| 42. | Montrose | 26.34% | 11.08% (+15.3)#42 | 11.49% (+14.8)#2,778 |
| 43. | Grass Lake | 25.99% | 11.08% (+14.9)#43 | 11.49% (+14.5)#2,874 |
| 44. | Homer | 25.98% | 11.08% (+14.9)#44 | 11.49% (+14.5)#2,875 |
| 45. | Galien | 25.95% | 11.08% (+14.9)#45 | 11.49% (+14.5)#2,881 |
| 46. | Springfield | 25.86% | 11.08% (+14.8)#46 | 11.49% (+14.4)#2,904 |
| 47. | Paw Paw | 25.59% | 11.08% (+14.5)#47 | 11.49% (+14.1)#2,962 |
| 48. | Zeeland | 25.53% | 11.08% (+14.4)#48 | 11.49% (+14.0)#2,974 |
| 49. | Farwell | 25.12% | 11.08% (+14.0)#49 | 11.49% (+13.6)#3,090 |
| 50. | Ypsilanti | 25.12% | 11.08% (+14.0)#50 | 11.49% (+13.6)#3,092 |
| 51. | Fairgrove | 25.00% | 11.08% (+13.9)#51 | 11.49% (+13.5)#3,132 |
| 52. | Hanover | 25.00% | 11.08% (+13.9)#52 | 11.49% (+13.5)#3,136 |
| 53. | Mesick | 25.00% | 11.08% (+13.9)#53 | 11.49% (+13.5)#3,137 |
| 54. | Ovid | 24.80% | 11.08% (+13.7)#54 | 11.49% (+13.3)#3,213 |
| 55. | Benton Heights | 24.60% | 11.08% (+13.5)#55 | 11.49% (+13.1)#3,263 |
| 56. | Newberry | 24.44% | 11.08% (+13.4)#56 | 11.49% (+13.0)#3,309 |
| 57. | Parchment | 24.37% | 11.08% (+13.3)#57 | 11.49% (+12.9)#3,334 |
| 58. | Grawn | 24.32% | 11.08% (+13.2)#58 | 11.49% (+12.8)#3,351 |
| 59. | Armada | 23.74% | 11.08% (+12.7)#59 | 11.49% (+12.3)#3,539 |
| 60. | Wayland | 23.71% | 11.08% (+12.6)#60 | 11.49% (+12.2)#3,551 |
| 61. | Bancroft | 23.66% | 11.08% (+12.6)#61 | 11.49% (+12.2)#3,565 |
| 62. | Muir | 23.62% | 11.08% (+12.5)#62 | 11.49% (+12.1)#3,580 |
| 63. | Stephenson | 23.44% | 11.08% (+12.4)#63 | 11.49% (+12.0)#3,646 |
| 64. | Lawrence | 23.31% | 11.08% (+12.2)#64 | 11.49% (+11.8)#3,697 |
| 65. | Corunna | 23.27% | 11.08% (+12.2)#65 | 11.49% (+11.8)#3,712 |
| 66. | Grayling | 23.18% | 11.08% (+12.1)#66 | 11.49% (+11.7)#3,748 |
| 67. | Iron River | 23.11% | 11.08% (+12.0)#67 | 11.49% (+11.6)#3,766 |
| 68. | Potterville | 23.08% | 11.08% (+12.0)#68 | 11.49% (+11.6)#3,773 |
| 69. | Grant | 23.08% | 11.08% (+12.0)#69 | 11.49% (+11.6)#3,775 |
| 70. | Ecorse | 22.98% | 11.08% (+11.9)#70 | 11.49% (+11.5)#3,818 |
| 71. | Boyne Falls | 22.89% | 11.08% (+11.8)#71 | 11.49% (+11.4)#3,860 |
| 72. | Mears | 22.86% | 11.08% (+11.8)#72 | 11.49% (+11.4)#3,867 |
| 73. | Center Line | 22.85% | 11.08% (+11.8)#73 | 11.49% (+11.4)#3,875 |
| 74. | Clayton | 22.81% | 11.08% (+11.7)#74 | 11.49% (+11.3)#3,891 |
| 75. | Rose City | 22.73% | 11.08% (+11.6)#75 | 11.49% (+11.2)#3,917 |
| 76. | New Haven | 22.72% | 11.08% (+11.6)#76 | 11.49% (+11.2)#3,926 |
| 77. | Kalkaska | 22.70% | 11.08% (+11.6)#77 | 11.49% (+11.2)#3,938 |
| 78. | Marion | 22.67% | 11.08% (+11.6)#78 | 11.49% (+11.2)#3,948 |
| 79. | Marlette | 22.47% | 11.08% (+11.4)#79 | 11.49% (+11.0)#4,020 |
| 80. | Pellston | 22.43% | 11.08% (+11.3)#80 | 11.49% (+10.9)#4,037 |
| 81. | Baraga | 22.39% | 11.08% (+11.3)#81 | 11.49% (+10.9)#4,047 |
| 82. | Bad Axe | 22.34% | 11.08% (+11.3)#82 | 11.49% (+10.9)#4,067 |
| 83. | Oak Hill | 22.31% | 11.08% (+11.2)#83 | 11.49% (+10.8)#4,080 |
| 84. | River Rouge | 22.28% | 11.08% (+11.2)#84 | 11.49% (+10.8)#4,094 |
| 85. | Eastpointe | 22.27% | 11.08% (+11.2)#85 | 11.49% (+10.8)#4,098 |
| 86. | Galesburg | 22.24% | 11.08% (+11.2)#86 | 11.49% (+10.8)#4,105 |
| 87. | Evart | 22.22% | 11.08% (+11.1)#87 | 11.49% (+10.7)#4,111 |
| 88. | Custer | 22.22% | 11.08% (+11.1)#88 | 11.49% (+10.7)#4,121 |
| 89. | Fennville | 22.15% | 11.08% (+11.1)#89 | 11.49% (+10.7)#4,165 |
| 90. | Atlanta | 21.99% | 11.08% (+10.9)#90 | 11.49% (+10.5)#4,234 |
| 91. | Plainwell | 21.97% | 11.08% (+10.9)#91 | 11.49% (+10.5)#4,245 |
| 92. | Jackson | 21.92% | 11.08% (+10.8)#92 | 11.49% (+10.4)#4,262 |
| 93. | Grand Blanc | 21.81% | 11.08% (+10.7)#93 | 11.49% (+10.3)#4,324 |
| 94. | Romulus | 21.61% | 11.08% (+10.5)#94 | 11.49% (+10.1)#4,409 |
| 95. | Wayne | 21.60% | 11.08% (+10.5)#95 | 11.49% (+10.1)#4,414 |
| 96. | Hemlock | 21.60% | 11.08% (+10.5)#96 | 11.49% (+10.1)#4,415 |
| 97. | Jasper | 21.59% | 11.08% (+10.5)#97 | 11.49% (+10.1)#4,417 |
| 98. | Caberfae | 21.43% | 11.08% (+10.3)#98 | 11.49% (+9.94)#4,492 |
| 99. | Prescott | 21.35% | 11.08% (+10.3)#99 | 11.49% (+9.86)#4,521 |
| 100. | Flat Rock | 21.28% | 11.08% (+10.2)#100 | 11.49% (+9.79)#4,550 |
Common Questions
What are the Top 10 Cities with the Highest Percentage of Single Mothers in Michigan?
Top 10 Cities with the Highest Percentage of Single Mothers in Michigan are:
#1
82.76%
#2
60.11%
#3
46.53%
#4
44.74%
#5
41.30%
#6
39.22%
#7
38.57%
#8
37.88%
#9
36.88%
#10
35.63%
What city has the Highest Percentage of Single Mothers in Michigan?
Oden has the Highest Percentage of Single Mothers in Michigan with 82.76%.
What is the Percentage of Single Mothers in the State of Michigan?
Percentage of Single Mothers in Michigan is 11.08%.
What is the Percentage of Single Mothers in the United States?
Percentage of Single Mothers in the United States is 11.49%.