Cities with the Largest Assyrian / Chaldean / Syriac Community in Michigan
RELATED REPORTS & OPTIONS
Assyrian / Chaldean / Syriac
Michigan
Compare Cities
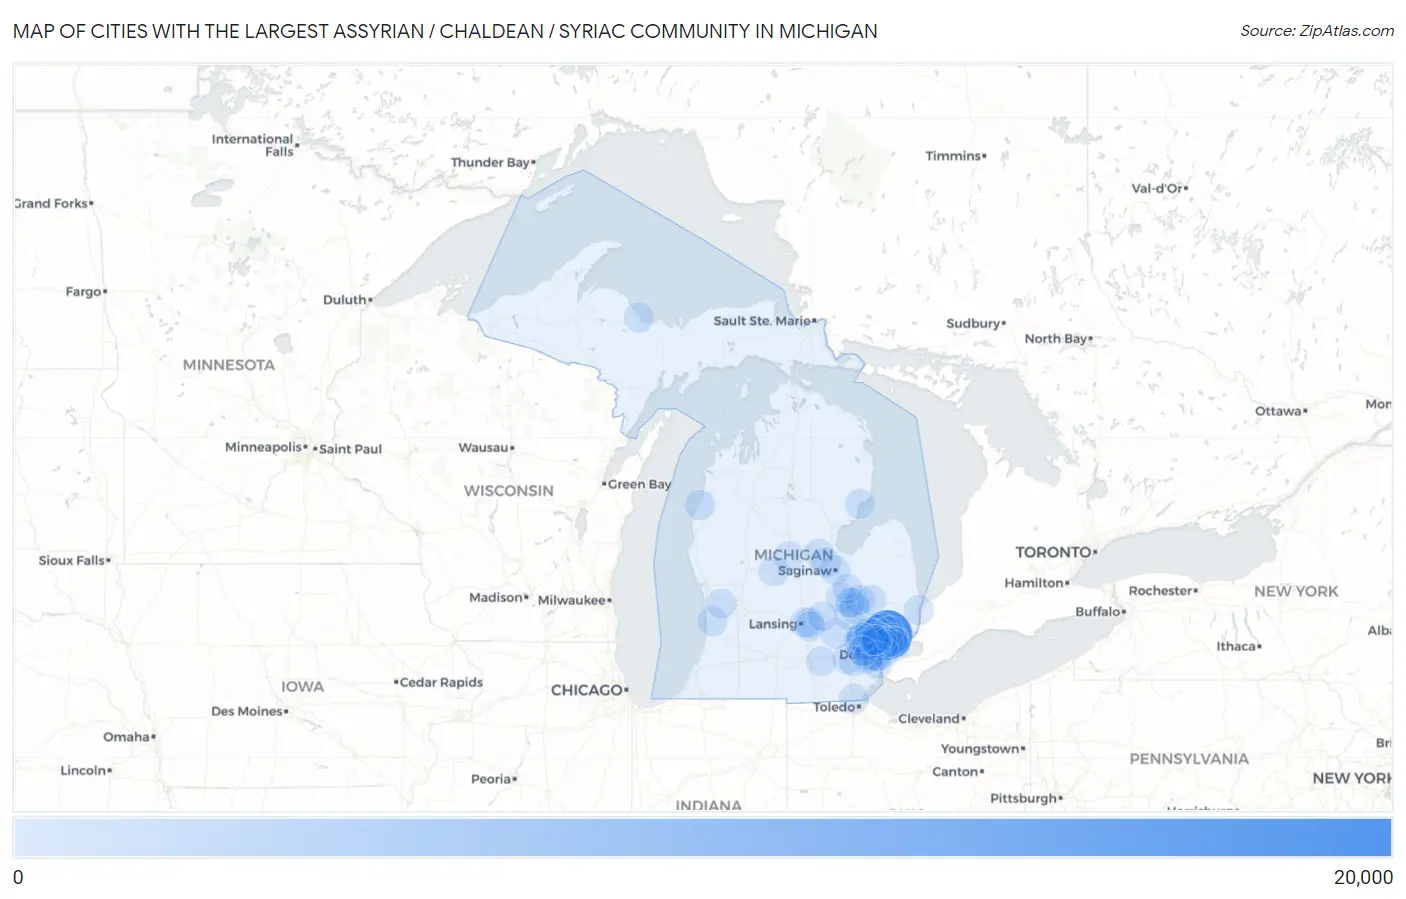
Map of Cities with the Largest Assyrian / Chaldean / Syriac Community in Michigan
0
20,000
Cities with the Largest Assyrian / Chaldean / Syriac Community in Michigan
| City | Assyrian / Chaldean / Syriac | vs State | vs National | |
| 1. | Sterling Heights | 15,378 | 42,050(36.57%)#1 | 96,423(15.95%)#1 |
| 2. | Warren | 2,593 | 42,050(6.17%)#2 | 96,423(2.69%)#7 |
| 3. | Farmington Hills | 1,821 | 42,050(4.33%)#3 | 96,423(1.89%)#9 |
| 4. | Rochester Hills | 1,018 | 42,050(2.42%)#4 | 96,423(1.06%)#12 |
| 5. | Novi | 955 | 42,050(2.27%)#5 | 96,423(0.99%)#14 |
| 6. | Troy | 714 | 42,050(1.70%)#6 | 96,423(0.74%)#17 |
| 7. | Madison Heights | 701 | 42,050(1.67%)#7 | 96,423(0.73%)#18 |
| 8. | Southfield | 473 | 42,050(1.12%)#8 | 96,423(0.49%)#26 |
| 9. | Fraser | 239 | 42,050(0.57%)#9 | 96,423(0.25%)#41 |
| 10. | Bloomfield Hills | 227 | 42,050(0.54%)#10 | 96,423(0.24%)#42 |
| 11. | Oak Park | 208 | 42,050(0.49%)#11 | 96,423(0.22%)#46 |
| 12. | Hazel Park | 173 | 42,050(0.41%)#12 | 96,423(0.18%)#54 |
| 13. | Royal Oak | 149 | 42,050(0.35%)#13 | 96,423(0.15%)#59 |
| 14. | Orchard Lake Village | 148 | 42,050(0.35%)#14 | 96,423(0.15%)#61 |
| 15. | Walled Lake | 137 | 42,050(0.33%)#15 | 96,423(0.14%)#67 |
| 16. | Manistee | 137 | 42,050(0.33%)#16 | 96,423(0.14%)#68 |
| 17. | Auburn Hills | 125 | 42,050(0.30%)#17 | 96,423(0.13%)#71 |
| 18. | Keego Harbor | 105 | 42,050(0.25%)#18 | 96,423(0.11%)#83 |
| 19. | Wixom | 98 | 42,050(0.23%)#19 | 96,423(0.10%)#89 |
| 20. | Grosse Pointe Woods | 98 | 42,050(0.23%)#20 | 96,423(0.10%)#90 |
| 21. | Ferndale | 94 | 42,050(0.22%)#21 | 96,423(0.10%)#94 |
| 22. | Utica | 94 | 42,050(0.22%)#22 | 96,423(0.10%)#95 |
| 23. | Ann Arbor | 88 | 42,050(0.21%)#23 | 96,423(0.09%)#101 |
| 24. | East Lansing | 77 | 42,050(0.18%)#24 | 96,423(0.08%)#112 |
| 25. | Marquette | 69 | 42,050(0.16%)#25 | 96,423(0.07%)#121 |
| 26. | Livonia | 68 | 42,050(0.16%)#26 | 96,423(0.07%)#123 |
| 27. | Westland | 65 | 42,050(0.15%)#27 | 96,423(0.07%)#126 |
| 28. | Howell | 64 | 42,050(0.15%)#28 | 96,423(0.07%)#129 |
| 29. | Roseville | 58 | 42,050(0.14%)#29 | 96,423(0.06%)#139 |
| 30. | Clawson | 57 | 42,050(0.14%)#30 | 96,423(0.06%)#143 |
| 31. | Detroit | 56 | 42,050(0.13%)#31 | 96,423(0.06%)#146 |
| 32. | Birmingham | 56 | 42,050(0.13%)#32 | 96,423(0.06%)#149 |
| 33. | Marysville | 51 | 42,050(0.12%)#33 | 96,423(0.05%)#160 |
| 34. | Garden City | 48 | 42,050(0.11%)#34 | 96,423(0.05%)#172 |
| 35. | Farmington | 48 | 42,050(0.11%)#35 | 96,423(0.05%)#173 |
| 36. | Sylvan Lake | 43 | 42,050(0.10%)#36 | 96,423(0.04%)#188 |
| 37. | Flushing | 38 | 42,050(0.09%)#37 | 96,423(0.04%)#203 |
| 38. | Dearborn Heights | 36 | 42,050(0.09%)#38 | 96,423(0.04%)#210 |
| 39. | Southgate | 31 | 42,050(0.07%)#39 | 96,423(0.03%)#233 |
| 40. | Wayne | 30 | 42,050(0.07%)#40 | 96,423(0.03%)#236 |
| 41. | Burton | 28 | 42,050(0.07%)#41 | 96,423(0.03%)#246 |
| 42. | Lambertville | 28 | 42,050(0.07%)#42 | 96,423(0.03%)#249 |
| 43. | Dearborn | 25 | 42,050(0.06%)#43 | 96,423(0.03%)#262 |
| 44. | Wolverine Lake | 24 | 42,050(0.06%)#44 | 96,423(0.02%)#273 |
| 45. | Center Line | 23 | 42,050(0.05%)#45 | 96,423(0.02%)#283 |
| 46. | Grand Blanc | 20 | 42,050(0.05%)#46 | 96,423(0.02%)#301 |
| 47. | St Clair Shores | 18 | 42,050(0.04%)#47 | 96,423(0.02%)#320 |
| 48. | Haslett | 17 | 42,050(0.04%)#48 | 96,423(0.02%)#335 |
| 49. | Mount Pleasant | 16 | 42,050(0.04%)#49 | 96,423(0.02%)#345 |
| 50. | Lathrup Village | 15 | 42,050(0.04%)#50 | 96,423(0.02%)#362 |
| 51. | Ypsilanti | 14 | 42,050(0.03%)#51 | 96,423(0.01%)#379 |
| 52. | Okemos | 12 | 42,050(0.03%)#52 | 96,423(0.01%)#410 |
| 53. | Freeland | 12 | 42,050(0.03%)#53 | 96,423(0.01%)#415 |
| 54. | Saginaw | 11 | 42,050(0.03%)#54 | 96,423(0.01%)#426 |
| 55. | Davison | 11 | 42,050(0.03%)#55 | 96,423(0.01%)#436 |
| 56. | Holland | 10 | 42,050(0.02%)#56 | 96,423(0.01%)#447 |
| 57. | Lake Fenton | 10 | 42,050(0.02%)#57 | 96,423(0.01%)#457 |
| 58. | Beverly Hills | 9 | 42,050(0.02%)#58 | 96,423(0.01%)#477 |
| 59. | Clio | 9 | 42,050(0.02%)#59 | 96,423(0.01%)#479 |
| 60. | Edmore | 9 | 42,050(0.02%)#60 | 96,423(0.01%)#480 |
| 61. | Flint | 8 | 42,050(0.02%)#61 | 96,423(0.01%)#491 |
| 62. | Tawas City | 8 | 42,050(0.02%)#62 | 96,423(0.01%)#509 |
| 63. | Bingham Farms | 7 | 42,050(0.02%)#63 | 96,423(0.01%)#529 |
| 64. | Lapeer | 6 | 42,050(0.01%)#64 | 96,423(0.01%)#542 |
| 65. | Allendale | 5 | 42,050(0.01%)#65 | 96,423(0.01%)#560 |
| 66. | Midland | 4 | 42,050(0.01%)#66 | 96,423(0.00%)#571 |
| 67. | Plymouth | 4 | 42,050(0.01%)#67 | 96,423(0.00%)#578 |
| 68. | Morrice | 3 | 42,050(0.01%)#68 | 96,423(0.00%)#593 |
| 69. | Grass Lake | 3 | 42,050(0.01%)#69 | 96,423(0.00%)#595 |
Common Questions
What are the Top 10 Cities with the Largest Assyrian / Chaldean / Syriac Community in Michigan?
Top 10 Cities with the Largest Assyrian / Chaldean / Syriac Community in Michigan are:
#1
15,378
#2
2,593
#3
1,821
#4
1,018
#5
955
#6
714
#7
701
#8
473
#9
239
#10
227
What city has the Largest Assyrian / Chaldean / Syriac Community in Michigan?
Sterling Heights has the Largest Assyrian / Chaldean / Syriac Community in Michigan with 15,378.
What is the Total Assyrian / Chaldean / Syriac Population in the State of Michigan?
Total Assyrian / Chaldean / Syriac Population in Michigan is 42,050.
What is the Total Assyrian / Chaldean / Syriac Population in the United States?
Total Assyrian / Chaldean / Syriac Population in the United States is 96,423.