Cities with the Highest Poverty Level Among Females Between Ages 18 and 24 in Michigan
RELATED REPORTS & OPTIONS
Highest Poverty | Female 18-24
Michigan
Compare Cities
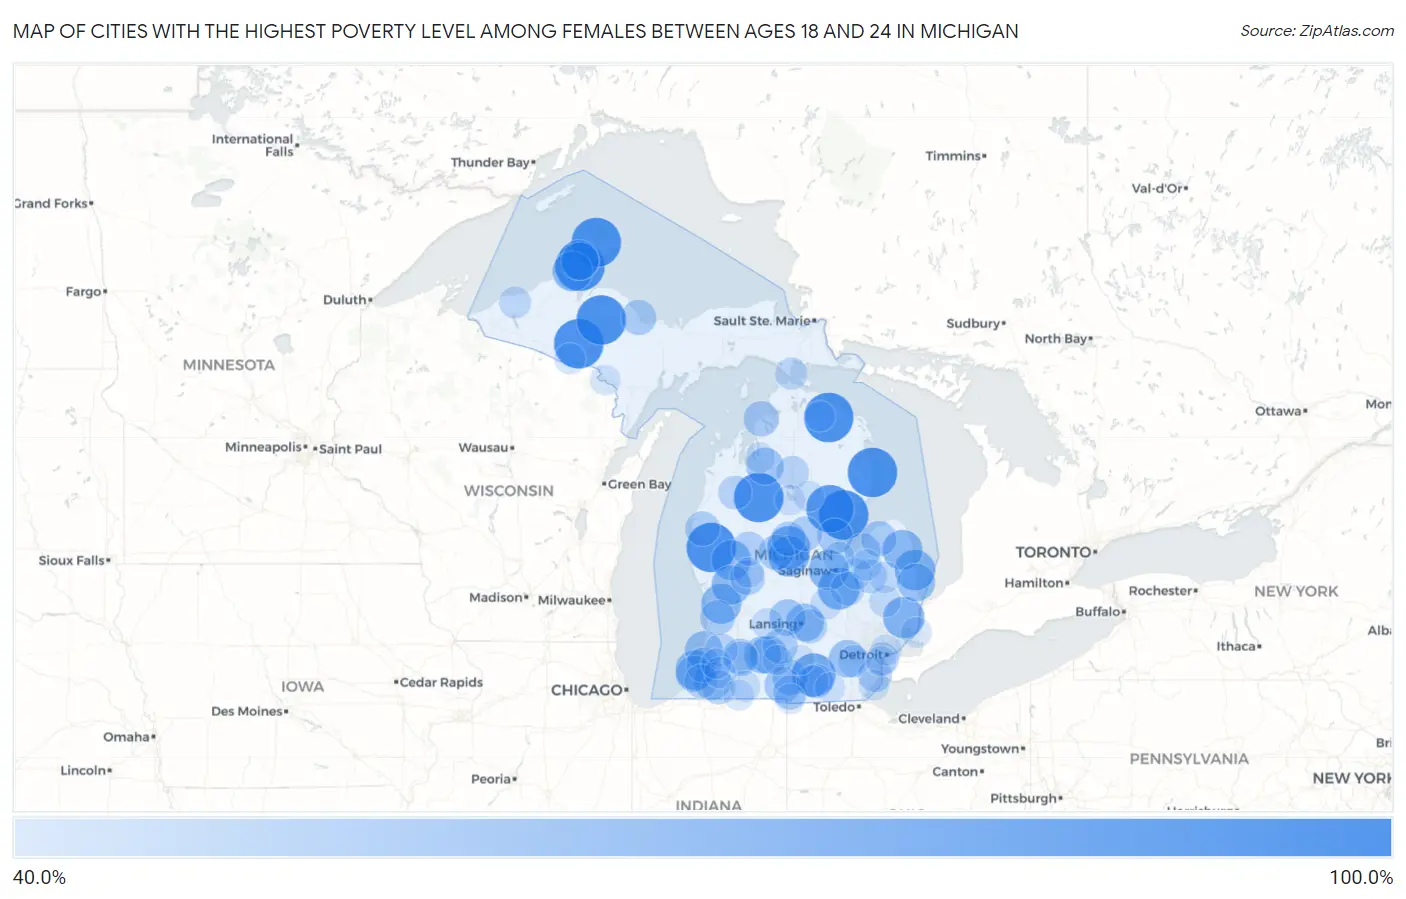
Map of Cities with the Highest Poverty Level Among Females Between Ages 18 and 24 in Michigan
0.0%
100.0%
Cities with the Highest Poverty Level Among Females Between Ages 18 and 24 in Michigan
| City | Female Poverty | vs State | vs National | |
| 1. | Hubbell | 100.0% | 23.3%(+76.7)#1 | 21.6%(+78.4)#260 |
| 2. | Harrisville | 100.0% | 23.3%(+76.7)#2 | 21.6%(+78.4)#380 |
| 3. | Winn | 100.0% | 23.3%(+76.7)#3 | 21.6%(+78.4)#583 |
| 4. | Amasa | 100.0% | 23.3%(+76.7)#4 | 21.6%(+78.4)#594 |
| 5. | Bruce Crossing | 100.0% | 23.3%(+76.7)#5 | 21.6%(+78.4)#595 |
| 6. | Michigamme | 100.0% | 23.3%(+76.7)#6 | 21.6%(+78.4)#640 |
| 7. | Twining | 100.0% | 23.3%(+76.7)#7 | 21.6%(+78.4)#646 |
| 8. | Walkerville | 100.0% | 23.3%(+76.7)#8 | 21.6%(+78.4)#661 |
| 9. | Jennings | 100.0% | 23.3%(+76.7)#9 | 21.6%(+78.4)#680 |
| 10. | Rockland | 100.0% | 23.3%(+76.7)#10 | 21.6%(+78.4)#697 |
| 11. | Millersburg | 100.0% | 23.3%(+76.7)#11 | 21.6%(+78.4)#745 |
| 12. | Eagle Harbor | 100.0% | 23.3%(+76.7)#12 | 21.6%(+78.4)#795 |
| 13. | Skidway Lake | 93.8% | 23.3%(+70.5)#13 | 21.6%(+72.2)#1,020 |
| 14. | Pittsford | 88.2% | 23.3%(+65.0)#14 | 21.6%(+66.6)#1,102 |
| 15. | Cement City | 81.2% | 23.3%(+58.0)#15 | 21.6%(+59.7)#1,254 |
| 16. | Rosebush | 79.3% | 23.3%(+56.1)#16 | 21.6%(+57.7)#1,318 |
| 17. | Montrose | 76.2% | 23.3%(+53.0)#17 | 21.6%(+54.7)#1,428 |
| 18. | Richmond | 75.0% | 23.3%(+51.7)#18 | 21.6%(+53.4)#1,462 |
| 19. | Mount Pleasant | 73.0% | 23.3%(+49.8)#19 | 21.6%(+51.4)#1,577 |
| 20. | Port Sanilac | 72.7% | 23.3%(+49.5)#20 | 21.6%(+51.1)#1,585 |
| 21. | Calumet | 71.9% | 23.3%(+48.7)#21 | 21.6%(+50.3)#1,631 |
| 22. | Minden City | 71.4% | 23.3%(+48.2)#22 | 21.6%(+49.8)#1,654 |
| 23. | Shields | 71.3% | 23.3%(+48.1)#23 | 21.6%(+49.7)#1,660 |
| 24. | Houghton | 70.9% | 23.3%(+47.7)#24 | 21.6%(+49.3)#1,669 |
| 25. | Allendale | 70.9% | 23.3%(+47.6)#25 | 21.6%(+49.3)#1,671 |
| 26. | White Cloud | 70.0% | 23.3%(+46.7)#26 | 21.6%(+48.4)#1,706 |
| 27. | Casnovia | 69.2% | 23.3%(+46.0)#27 | 21.6%(+47.6)#1,742 |
| 28. | Benton Heights | 68.9% | 23.3%(+45.7)#28 | 21.6%(+47.3)#1,756 |
| 29. | Brownlee Park | 64.4% | 23.3%(+41.2)#29 | 21.6%(+42.8)#2,033 |
| 30. | Lexington | 64.3% | 23.3%(+41.0)#30 | 21.6%(+42.7)#2,042 |
| 31. | South Haven | 64.0% | 23.3%(+40.7)#31 | 21.6%(+42.4)#2,055 |
| 32. | East Lansing | 64.0% | 23.3%(+40.7)#32 | 21.6%(+42.4)#2,059 |
| 33. | Laurium | 63.8% | 23.3%(+40.6)#33 | 21.6%(+42.2)#2,068 |
| 34. | Ann Arbor | 62.9% | 23.3%(+39.6)#34 | 21.6%(+41.3)#2,118 |
| 35. | Springfield | 62.9% | 23.3%(+39.6)#35 | 21.6%(+41.3)#2,119 |
| 36. | Kalkaska | 62.5% | 23.3%(+39.2)#36 | 21.6%(+40.9)#2,140 |
| 37. | Dowagiac | 62.2% | 23.3%(+38.9)#37 | 21.6%(+40.6)#2,182 |
| 38. | Eagle | 60.0% | 23.3%(+36.7)#38 | 21.6%(+38.4)#2,355 |
| 39. | Quincy | 59.6% | 23.3%(+36.4)#39 | 21.6%(+38.0)#2,367 |
| 40. | Fair Plain | 58.9% | 23.3%(+35.6)#40 | 21.6%(+37.3)#2,410 |
| 41. | Pinconning | 57.9% | 23.3%(+34.6)#41 | 21.6%(+36.3)#2,485 |
| 42. | Litchfield | 57.7% | 23.3%(+34.4)#42 | 21.6%(+36.1)#2,510 |
| 43. | Unionville | 57.7% | 23.3%(+34.4)#43 | 21.6%(+36.1)#2,512 |
| 44. | Elkton | 57.1% | 23.3%(+33.9)#44 | 21.6%(+35.5)#2,551 |
| 45. | Charlevoix | 56.8% | 23.3%(+33.6)#45 | 21.6%(+35.2)#2,593 |
| 46. | Lake Isabella | 56.4% | 23.3%(+33.2)#46 | 21.6%(+34.8)#2,617 |
| 47. | Olivet | 56.3% | 23.3%(+33.1)#47 | 21.6%(+34.7)#2,624 |
| 48. | Westwood | 56.3% | 23.3%(+33.1)#48 | 21.6%(+34.7)#2,625 |
| 49. | Marquette | 56.2% | 23.3%(+33.0)#49 | 21.6%(+34.6)#2,633 |
| 50. | Zeeland | 55.8% | 23.3%(+32.5)#50 | 21.6%(+34.2)#2,658 |
| 51. | Watervliet | 55.6% | 23.3%(+32.3)#51 | 21.6%(+34.0)#2,669 |
| 52. | Pierson | 55.6% | 23.3%(+32.3)#52 | 21.6%(+34.0)#2,701 |
| 53. | Scottville | 55.2% | 23.3%(+31.9)#53 | 21.6%(+33.6)#2,718 |
| 54. | Kalamazoo | 54.7% | 23.3%(+31.5)#54 | 21.6%(+33.1)#2,746 |
| 55. | Beaverton | 54.5% | 23.3%(+31.3)#55 | 21.6%(+32.9)#2,762 |
| 56. | Clare | 54.1% | 23.3%(+30.8)#56 | 21.6%(+32.5)#2,805 |
| 57. | Big Rapids | 53.7% | 23.3%(+30.4)#57 | 21.6%(+32.1)#2,856 |
| 58. | Okemos | 53.3% | 23.3%(+30.1)#58 | 21.6%(+31.7)#2,905 |
| 59. | Rockwood | 52.9% | 23.3%(+29.7)#59 | 21.6%(+31.3)#2,922 |
| 60. | Reading | 52.9% | 23.3%(+29.7)#60 | 21.6%(+31.3)#2,927 |
| 61. | Manitou Beach Devils Lake | 52.9% | 23.3%(+29.6)#61 | 21.6%(+31.3)#2,943 |
| 62. | Mayville | 52.5% | 23.3%(+29.2)#62 | 21.6%(+30.9)#2,984 |
| 63. | Cassopolis | 52.4% | 23.3%(+29.1)#63 | 21.6%(+30.8)#2,992 |
| 64. | Eau Claire | 52.4% | 23.3%(+29.1)#64 | 21.6%(+30.8)#2,994 |
| 65. | Clio | 52.2% | 23.3%(+28.9)#65 | 21.6%(+30.6)#3,013 |
| 66. | Mesick | 51.7% | 23.3%(+28.5)#66 | 21.6%(+30.1)#3,051 |
| 67. | Grayling | 50.0% | 23.3%(+26.7)#67 | 21.6%(+28.4)#3,163 |
| 68. | Bloomingdale | 50.0% | 23.3%(+26.7)#68 | 21.6%(+28.4)#3,231 |
| 69. | River Rouge | 49.3% | 23.3%(+26.1)#69 | 21.6%(+27.7)#3,378 |
| 70. | St Ignace | 48.4% | 23.3%(+25.1)#70 | 21.6%(+26.8)#3,448 |
| 71. | Ypsilanti | 48.1% | 23.3%(+24.8)#71 | 21.6%(+26.5)#3,482 |
| 72. | Addison | 47.1% | 23.3%(+23.8)#72 | 21.6%(+25.5)#3,584 |
| 73. | White Pine | 47.1% | 23.3%(+23.8)#73 | 21.6%(+25.5)#3,591 |
| 74. | Imlay City | 46.3% | 23.3%(+23.0)#74 | 21.6%(+24.7)#3,681 |
| 75. | Eureka | 46.2% | 23.3%(+22.9)#75 | 21.6%(+24.6)#3,714 |
| 76. | Marlette | 46.0% | 23.3%(+22.7)#76 | 21.6%(+24.4)#3,722 |
| 77. | Vassar | 45.4% | 23.3%(+22.1)#77 | 21.6%(+23.8)#3,816 |
| 78. | Caro | 45.4% | 23.3%(+22.1)#78 | 21.6%(+23.8)#3,818 |
| 79. | Bay City | 45.3% | 23.3%(+22.1)#79 | 21.6%(+23.7)#3,820 |
| 80. | Decatur | 45.2% | 23.3%(+22.0)#80 | 21.6%(+23.6)#3,829 |
| 81. | Woodland | 45.2% | 23.3%(+21.9)#81 | 21.6%(+23.6)#3,837 |
| 82. | Corunna | 45.1% | 23.3%(+21.8)#82 | 21.6%(+23.5)#3,843 |
| 83. | Gaastra | 44.4% | 23.3%(+21.2)#83 | 21.6%(+22.8)#3,934 |
| 84. | Hamtramck | 44.2% | 23.3%(+21.0)#84 | 21.6%(+22.6)#3,954 |
| 85. | Centreville | 44.1% | 23.3%(+20.9)#85 | 21.6%(+22.5)#3,962 |
| 86. | St Helen | 43.9% | 23.3%(+20.6)#86 | 21.6%(+22.3)#3,983 |
| 87. | White Pigeon | 43.9% | 23.3%(+20.6)#87 | 21.6%(+22.3)#3,989 |
| 88. | Stony Point | 43.3% | 23.3%(+20.1)#88 | 21.6%(+21.7)#4,043 |
| 89. | Algonac | 43.2% | 23.3%(+19.9)#89 | 21.6%(+21.6)#4,057 |
| 90. | Lawrence | 43.1% | 23.3%(+19.9)#90 | 21.6%(+21.5)#4,064 |
| 91. | Houghton Lake | 43.0% | 23.3%(+19.7)#91 | 21.6%(+21.4)#4,072 |
| 92. | Rapid City | 42.9% | 23.3%(+19.6)#92 | 21.6%(+21.3)#4,096 |
| 93. | Onaway | 42.7% | 23.3%(+19.5)#93 | 21.6%(+21.1)#4,149 |
| 94. | Quinnesec | 42.5% | 23.3%(+19.2)#94 | 21.6%(+20.9)#4,173 |
| 95. | Ecorse | 42.3% | 23.3%(+19.1)#95 | 21.6%(+20.7)#4,187 |
| 96. | Howard City | 42.2% | 23.3%(+19.0)#96 | 21.6%(+20.6)#4,197 |
| 97. | Adrian | 42.1% | 23.3%(+18.9)#97 | 21.6%(+20.5)#4,207 |
| 98. | Camden | 41.9% | 23.3%(+18.6)#98 | 21.6%(+20.3)#4,257 |
| 99. | Parma | 41.7% | 23.3%(+18.4)#99 | 21.6%(+20.1)#4,287 |
| 100. | Marshall | 41.6% | 23.3%(+18.4)#100 | 21.6%(+20.0)#4,312 |
Common Questions
What are the Top 10 Cities with the Highest Poverty Level Among Females Between Ages 18 and 24 in Michigan?
Top 10 Cities with the Highest Poverty Level Among Females Between Ages 18 and 24 in Michigan are:
#1
100.0%
#2
100.0%
#3
100.0%
#4
100.0%
#5
100.0%
#6
100.0%
#7
100.0%
#8
100.0%
#9
100.0%
#10
93.8%
What city has the Highest Poverty Level Among Females Between Ages 18 and 24 in Michigan?
Hubbell has the Highest Poverty Level Among Females Between Ages 18 and 24 in Michigan with 100.0%.
What is the Poverty Level Among Females Between Ages 18 and 24 in the State of Michigan?
Poverty Level Among Females Between Ages 18 and 24 in Michigan is 23.3%.
What is the Poverty Level Among Females Between Ages 18 and 24 in the United States?
Poverty Level Among Females Between Ages 18 and 24 in the United States is 21.6%.