Middleville, MI Map & Demographics
Middleville Map
Middleville Overview
$31,308
PER CAPITA INCOME
$94,342
AVG FAMILY INCOME
$67,759
AVG HOUSEHOLD INCOME
19.4%
WAGE / INCOME GAP [ % ]
80.6¢/ $1
WAGE / INCOME GAP [ $ ]
0.36
INEQUALITY / GINI INDEX
4,259
TOTAL POPULATION
2,193
MALE POPULATION
2,066
FEMALE POPULATION
106.15
MALES / 100 FEMALES
94.21
FEMALES / 100 MALES
28.8
MEDIAN AGE
3.5
AVG FAMILY SIZE
2.5
AVG HOUSEHOLD SIZE
2,259
LABOR FORCE [ PEOPLE ]
77.5%
PERCENT IN LABOR FORCE
0.6%
UNEMPLOYMENT RATE
Middleville Zip Codes
Middleville Area Codes
Income in Middleville
Income Overview in Middleville
Per Capita Income in Middleville is $31,308, while median incomes of families and households are $94,342 and $67,759 respectively.
| Characteristic | Number | Measure |
| Per Capita Income | 4,259 | $31,308 |
| Median Family Income | 942 | $94,342 |
| Mean Family Income | 942 | $102,384 |
| Median Household Income | 1,726 | $67,759 |
| Mean Household Income | 1,726 | $75,729 |
| Income Deficit | 942 | $0 |
| Wage / Income Gap (%) | 4,259 | 19.42% |
| Wage / Income Gap ($) | 4,259 | 80.58¢ per $1 |
| Gini / Inequality Index | 4,259 | 0.36 |
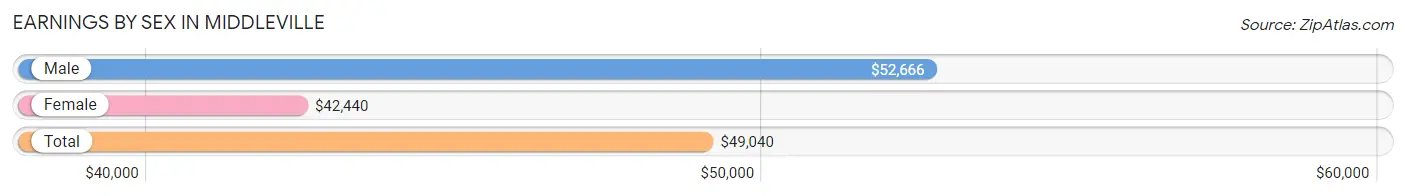
Earnings by Sex in Middleville
Average Earnings in Middleville are $49,040, $52,666 for men and $42,440 for women, a difference of 19.4%.
| Sex | Number | Average Earnings |
| Male | 1,386 (59.6%) | $52,666 |
| Female | 939 (40.4%) | $42,440 |
| Total | 2,325 (100.0%) | $49,040 |
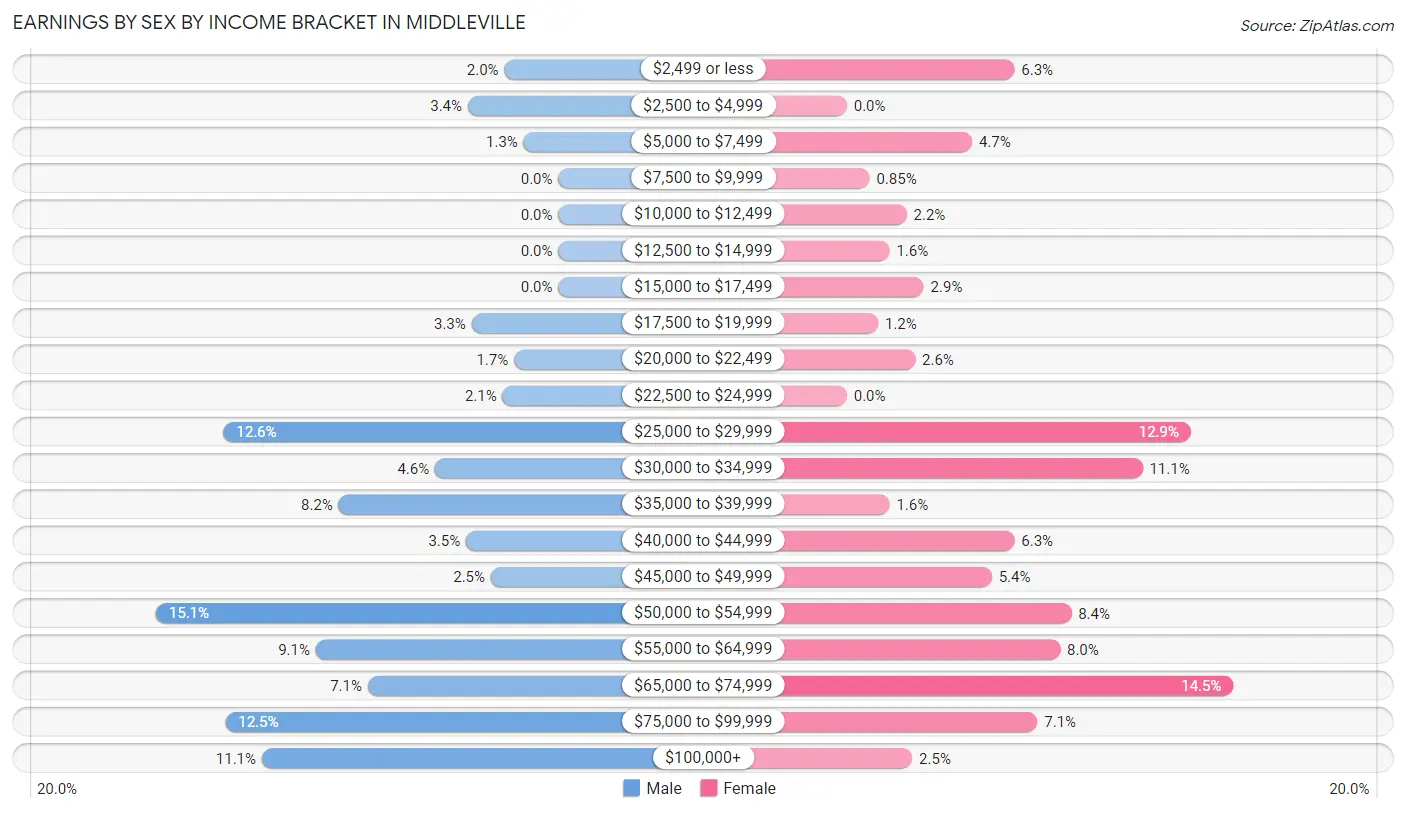
Earnings by Sex by Income Bracket in Middleville
The most common earnings brackets in Middleville are $50,000 to $54,999 for men (209 | 15.1%) and $65,000 to $74,999 for women (136 | 14.5%).
| Income | Male | Female |
| $2,499 or less | 28 (2.0%) | 59 (6.3%) |
| $2,500 to $4,999 | 47 (3.4%) | 0 (0.0%) |
| $5,000 to $7,499 | 18 (1.3%) | 44 (4.7%) |
| $7,500 to $9,999 | 0 (0.0%) | 8 (0.9%) |
| $10,000 to $12,499 | 0 (0.0%) | 21 (2.2%) |
| $12,500 to $14,999 | 0 (0.0%) | 15 (1.6%) |
| $15,000 to $17,499 | 0 (0.0%) | 27 (2.9%) |
| $17,500 to $19,999 | 45 (3.3%) | 11 (1.2%) |
| $20,000 to $22,499 | 23 (1.7%) | 24 (2.6%) |
| $22,500 to $24,999 | 29 (2.1%) | 0 (0.0%) |
| $25,000 to $29,999 | 174 (12.6%) | 121 (12.9%) |
| $30,000 to $34,999 | 64 (4.6%) | 104 (11.1%) |
| $35,000 to $39,999 | 114 (8.2%) | 15 (1.6%) |
| $40,000 to $44,999 | 48 (3.5%) | 59 (6.3%) |
| $45,000 to $49,999 | 35 (2.5%) | 51 (5.4%) |
| $50,000 to $54,999 | 209 (15.1%) | 79 (8.4%) |
| $55,000 to $64,999 | 126 (9.1%) | 75 (8.0%) |
| $65,000 to $74,999 | 99 (7.1%) | 136 (14.5%) |
| $75,000 to $99,999 | 173 (12.5%) | 67 (7.1%) |
| $100,000+ | 154 (11.1%) | 23 (2.5%) |
| Total | 1,386 (100.0%) | 939 (100.0%) |
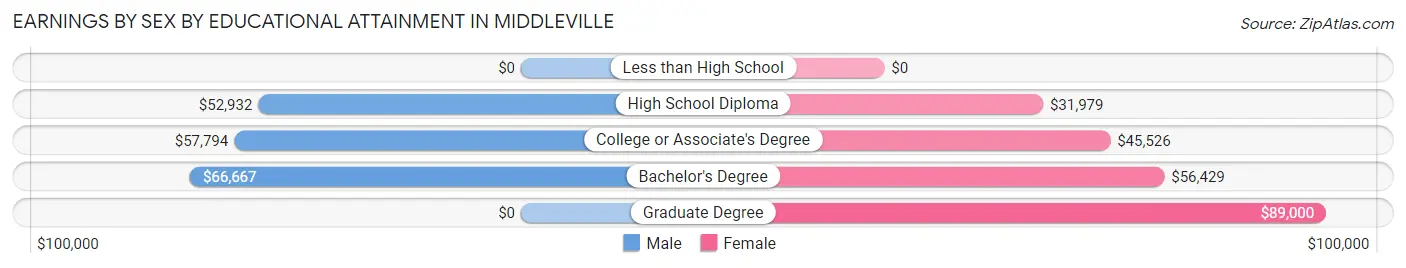
Earnings by Sex by Educational Attainment in Middleville
Average earnings in Middleville are $53,653 for men and $43,966 for women, a difference of 18.0%. Men with an educational attainment of bachelor's degree enjoy the highest average annual earnings of $66,667, while those with high school diploma education earn the least with $52,932. Women with an educational attainment of graduate degree earn the most with the average annual earnings of $89,000, while those with high school diploma education have the smallest earnings of $31,979.
| Educational Attainment | Male Income | Female Income |
| Less than High School | - | - |
| High School Diploma | $52,932 | $31,979 |
| College or Associate's Degree | $57,794 | $45,526 |
| Bachelor's Degree | $66,667 | $56,429 |
| Graduate Degree | - | - |
| Total | $53,653 | $43,966 |
Family Income in Middleville
Family Income Brackets in Middleville
According to the Middleville family income data, there are 291 families falling into the $75,000 to $99,999 income range, which is the most common income bracket and makes up 30.9% of all families.
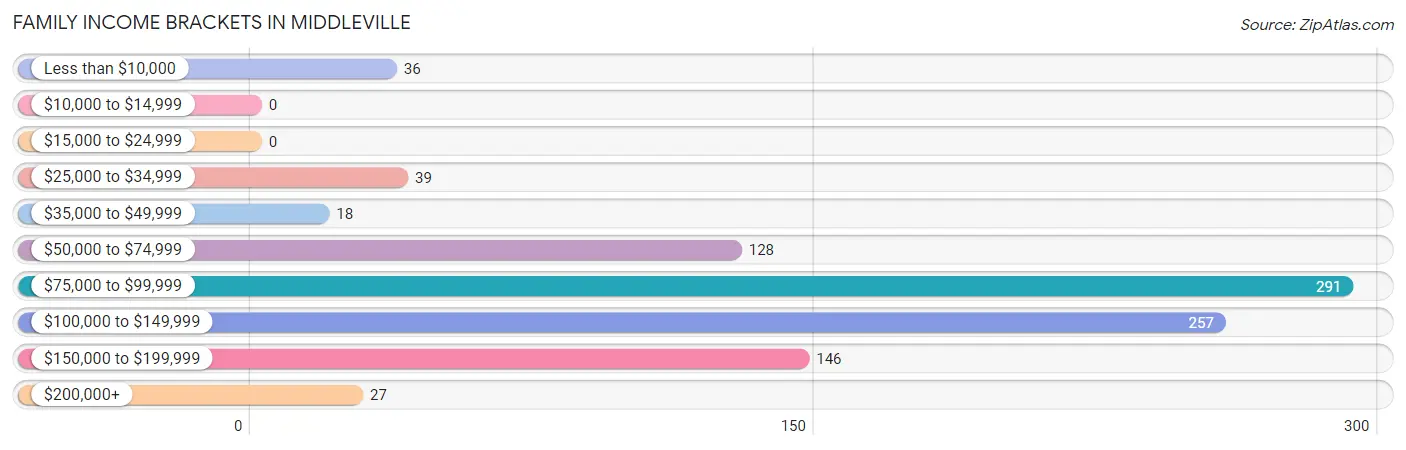
| Income Bracket | # Families | % Families |
| Less than $10,000 | 36 | 3.8% |
| $10,000 to $14,999 | 0 | 0.0% |
| $15,000 to $24,999 | 0 | 0.0% |
| $25,000 to $34,999 | 39 | 4.1% |
| $35,000 to $49,999 | 18 | 1.9% |
| $50,000 to $74,999 | 128 | 13.6% |
| $75,000 to $99,999 | 291 | 30.9% |
| $100,000 to $149,999 | 257 | 27.3% |
| $150,000 to $199,999 | 146 | 15.5% |
| $200,000+ | 27 | 2.9% |
Family Income by Famaliy Size in Middleville
3-person families (123 | 13.1%) account for the highest median family income in Middleville with $149,313 per family, while 3-person families (123 | 13.1%) have the highest median income of $49,771 per family member.
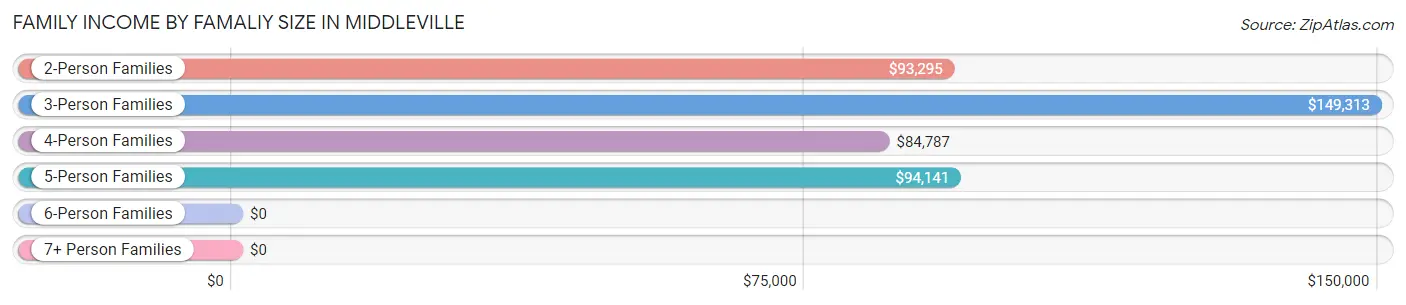
| Income Bracket | # Families | Median Income |
| 2-Person Families | 246 (26.1%) | $93,295 |
| 3-Person Families | 123 (13.1%) | $149,313 |
| 4-Person Families | 460 (48.8%) | $84,787 |
| 5-Person Families | 113 (12.0%) | $94,141 |
| 6-Person Families | 0 (0.0%) | $0 |
| 7+ Person Families | 0 (0.0%) | $0 |
| Total | 942 (100.0%) | $94,342 |
Family Income by Number of Earners in Middleville
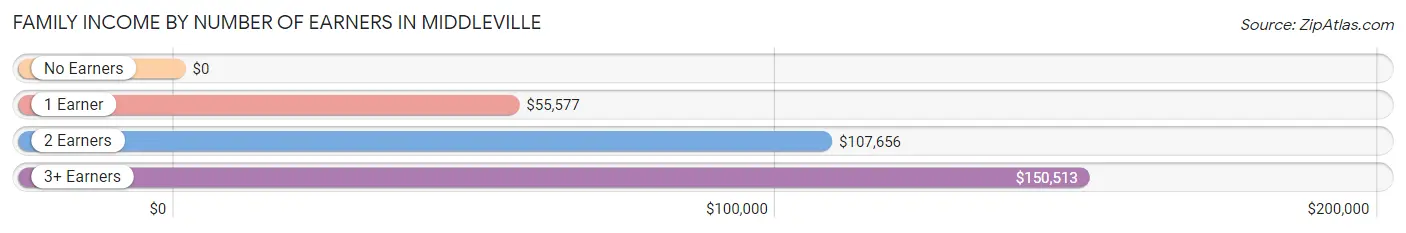
| Number of Earners | # Families | Median Income |
| No Earners | 73 (7.7%) | $0 |
| 1 Earner | 200 (21.2%) | $55,577 |
| 2 Earners | 550 (58.4%) | $107,656 |
| 3+ Earners | 119 (12.6%) | $150,513 |
| Total | 942 (100.0%) | $94,342 |
Household Income in Middleville
Household Income Brackets in Middleville
With 380 households falling in the category, the $50,000 to $74,999 income range is the most frequent in Middleville, accounting for 22.0% of all households. In contrast, only 36 households (2.1%) fall into the $200,000+ income bracket, making it the least populous group.
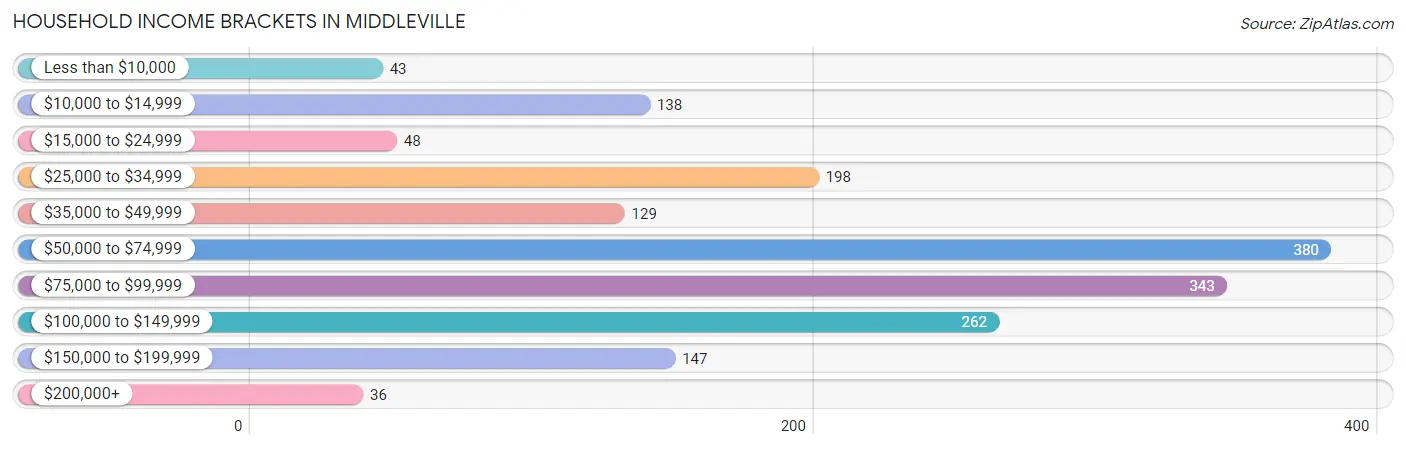
| Income Bracket | # Households | % Households |
| Less than $10,000 | 43 | 2.5% |
| $10,000 to $14,999 | 138 | 8.0% |
| $15,000 to $24,999 | 48 | 2.8% |
| $25,000 to $34,999 | 198 | 11.5% |
| $35,000 to $49,999 | 129 | 7.5% |
| $50,000 to $74,999 | 380 | 22.0% |
| $75,000 to $99,999 | 343 | 19.9% |
| $100,000 to $149,999 | 262 | 15.2% |
| $150,000 to $199,999 | 147 | 8.5% |
| $200,000+ | 36 | 2.1% |
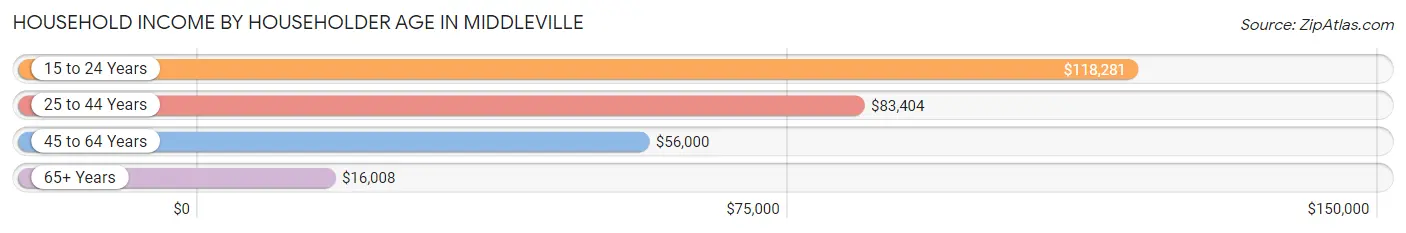
Household Income by Householder Age in Middleville
The median household income in Middleville is $67,759, with the highest median household income of $118,281 found in the 15 to 24 years age bracket for the primary householder. A total of 101 households (5.9%) fall into this category. Meanwhile, the 65+ years age bracket for the primary householder has the lowest median household income of $16,008, with 317 households (18.4%) in this group.
| Income Bracket | # Households | Median Income |
| 15 to 24 Years | 101 (5.9%) | $118,281 |
| 25 to 44 Years | 644 (37.3%) | $83,404 |
| 45 to 64 Years | 664 (38.5%) | $56,000 |
| 65+ Years | 317 (18.4%) | $16,008 |
| Total | 1,726 (100.0%) | $67,759 |
Poverty in Middleville
Income Below Poverty by Sex and Age in Middleville
With 3.6% poverty level for males and 14.7% for females among the residents of Middleville, 5 year old males and 15 year old females are the most vulnerable to poverty, with 9 males (52.9%) and 32 females (74.4%) in their respective age groups living below the poverty level.
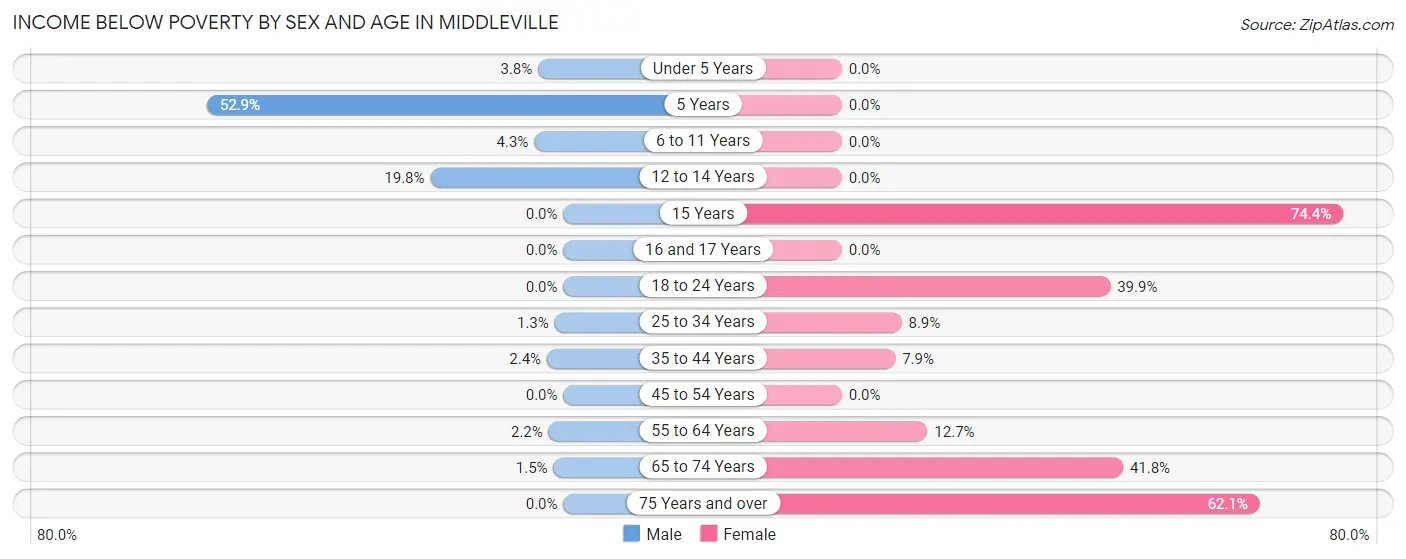
| Age Bracket | Male | Female |
| Under 5 Years | 8 (3.8%) | 0 (0.0%) |
| 5 Years | 9 (52.9%) | 0 (0.0%) |
| 6 to 11 Years | 9 (4.3%) | 0 (0.0%) |
| 12 to 14 Years | 32 (19.8%) | 0 (0.0%) |
| 15 Years | 0 (0.0%) | 32 (74.4%) |
| 16 and 17 Years | 0 (0.0%) | 0 (0.0%) |
| 18 to 24 Years | 0 (0.0%) | 55 (39.9%) |
| 25 to 34 Years | 4 (1.3%) | 26 (8.9%) |
| 35 to 44 Years | 9 (2.4%) | 28 (7.9%) |
| 45 to 54 Years | 0 (0.0%) | 0 (0.0%) |
| 55 to 64 Years | 6 (2.2%) | 15 (12.7%) |
| 65 to 74 Years | 1 (1.5%) | 43 (41.7%) |
| 75 Years and over | 0 (0.0%) | 103 (62.1%) |
| Total | 78 (3.6%) | 302 (14.7%) |
Income Above Poverty by Sex and Age in Middleville
According to the poverty statistics in Middleville, males aged 15 years and females aged under 5 years are the age groups that are most secure financially, with 100.0% of males and 100.0% of females in these age groups living above the poverty line.
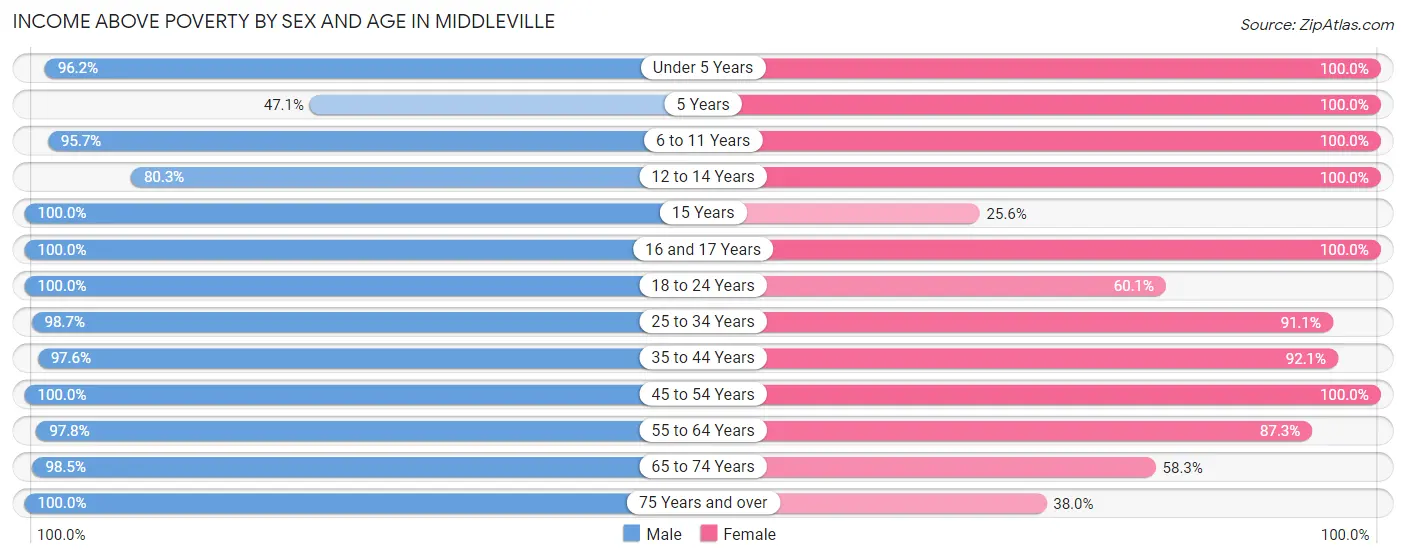
| Age Bracket | Male | Female |
| Under 5 Years | 205 (96.2%) | 235 (100.0%) |
| 5 Years | 8 (47.1%) | 31 (100.0%) |
| 6 to 11 Years | 199 (95.7%) | 227 (100.0%) |
| 12 to 14 Years | 130 (80.2%) | 127 (100.0%) |
| 15 Years | 17 (100.0%) | 11 (25.6%) |
| 16 and 17 Years | 16 (100.0%) | 53 (100.0%) |
| 18 to 24 Years | 159 (100.0%) | 83 (60.1%) |
| 25 to 34 Years | 303 (98.7%) | 267 (91.1%) |
| 35 to 44 Years | 360 (97.6%) | 325 (92.1%) |
| 45 to 54 Years | 294 (100.0%) | 162 (100.0%) |
| 55 to 64 Years | 268 (97.8%) | 103 (87.3%) |
| 65 to 74 Years | 67 (98.5%) | 60 (58.3%) |
| 75 Years and over | 31 (100.0%) | 63 (38.0%) |
| Total | 2,057 (96.4%) | 1,747 (85.3%) |
Income Below Poverty Among Married-Couple Families in Middleville
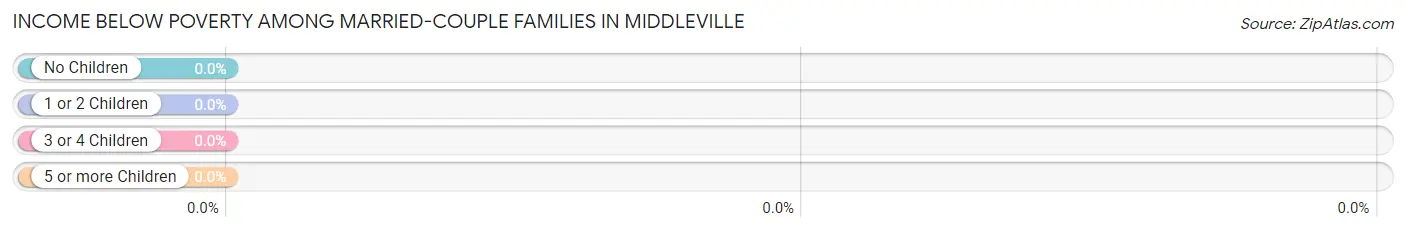
| Children | Above Poverty | Below Poverty |
| No Children | 166 (100.0%) | 0 (0.0%) |
| 1 or 2 Children | 438 (100.0%) | 0 (0.0%) |
| 3 or 4 Children | 86 (100.0%) | 0 (0.0%) |
| 5 or more Children | 0 (0.0%) | 0 (0.0%) |
| Total | 690 (100.0%) | 0 (0.0%) |
Income Below Poverty Among Single-Parent Households in Middleville
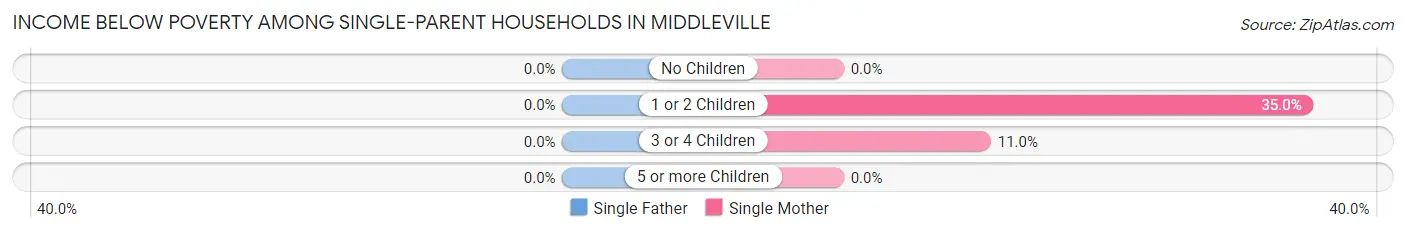
| Children | Single Father | Single Mother |
| No Children | 0 (0.0%) | 0 (0.0%) |
| 1 or 2 Children | 0 (0.0%) | 28 (35.0%) |
| 3 or 4 Children | 0 (0.0%) | 8 (11.0%) |
| 5 or more Children | 0 (0.0%) | 0 (0.0%) |
| Total | 0 (0.0%) | 36 (20.1%) |
Income Below Poverty Among Married-Couple vs Single-Parent Households in Middleville
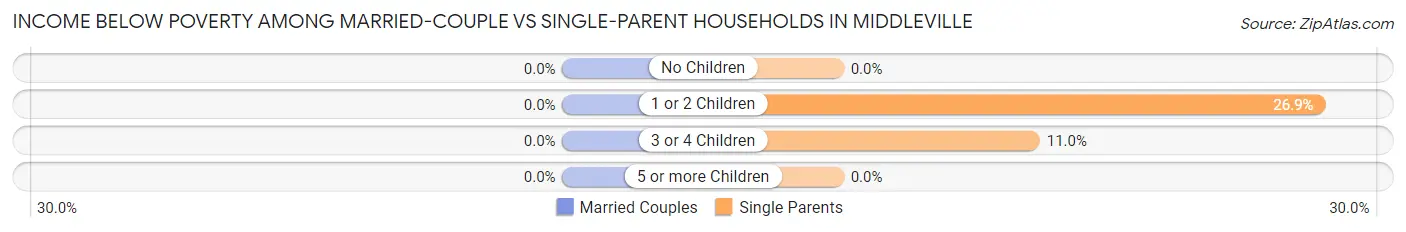
| Children | Married-Couple Families | Single-Parent Households |
| No Children | 0 (0.0%) | 0 (0.0%) |
| 1 or 2 Children | 0 (0.0%) | 28 (26.9%) |
| 3 or 4 Children | 0 (0.0%) | 8 (11.0%) |
| 5 or more Children | 0 (0.0%) | 0 (0.0%) |
| Total | 0 (0.0%) | 36 (14.3%) |
Race in Middleville
The most populous races in Middleville are White / Caucasian (3,434 | 80.6%), Two or more Races (559 | 13.1%), and Hispanic or Latino (257 | 6.0%).
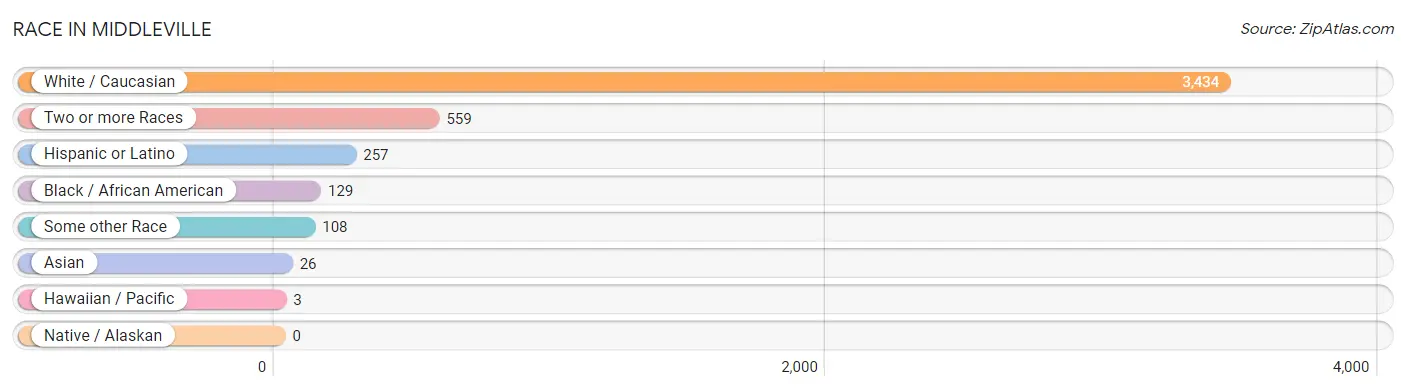
| Race | # Population | % Population |
| Asian | 26 | 0.6% |
| Black / African American | 129 | 3.0% |
| Hawaiian / Pacific | 3 | 0.1% |
| Hispanic or Latino | 257 | 6.0% |
| Native / Alaskan | 0 | 0.0% |
| White / Caucasian | 3,434 | 80.6% |
| Two or more Races | 559 | 13.1% |
| Some other Race | 108 | 2.5% |
| Total | 4,259 | 100.0% |
Ancestry in Middleville
The most populous ancestries reported in Middleville are German (957 | 22.5%), Irish (838 | 19.7%), English (609 | 14.3%), Dutch (503 | 11.8%), and Polish (240 | 5.6%), together accounting for 73.9% of all Middleville residents.
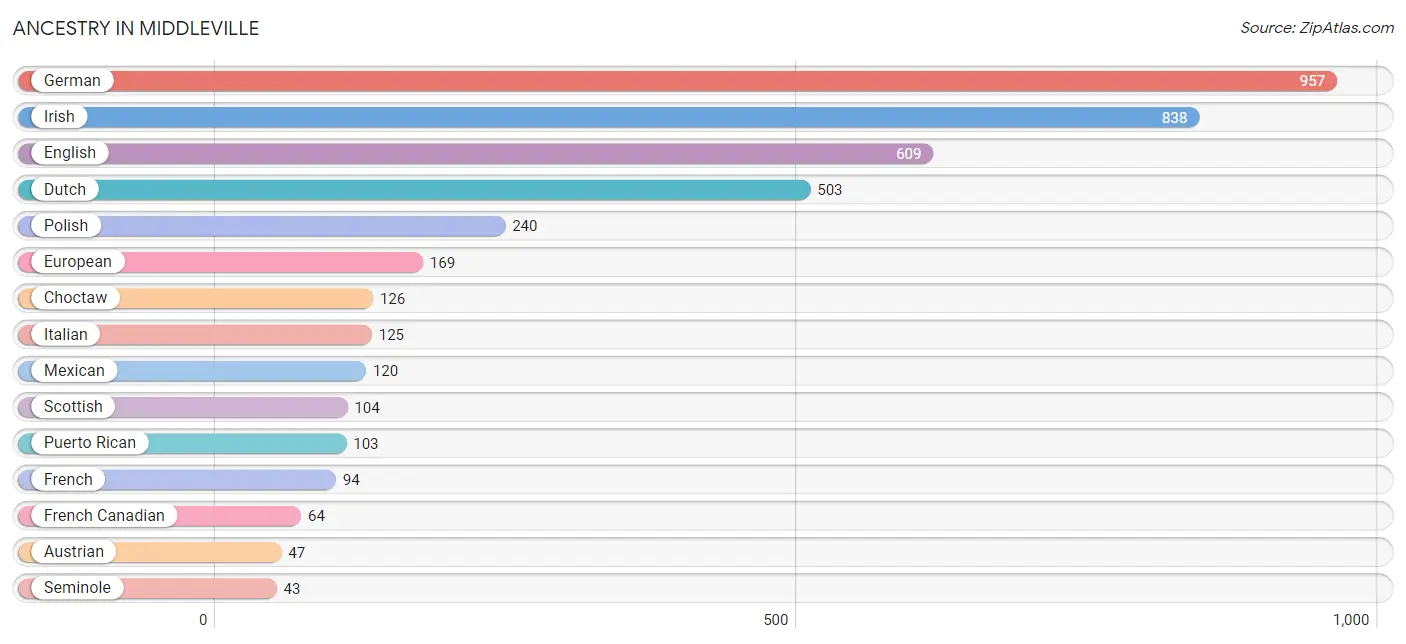
| Ancestry | # Population | % Population |
| Arab | 40 | 0.9% |
| Austrian | 47 | 1.1% |
| Bhutanese | 24 | 0.6% |
| British | 10 | 0.2% |
| Canadian | 19 | 0.4% |
| Choctaw | 126 | 3.0% |
| Cuban | 17 | 0.4% |
| Czech | 13 | 0.3% |
| Dutch | 503 | 11.8% |
| English | 609 | 14.3% |
| European | 169 | 4.0% |
| French | 94 | 2.2% |
| French Canadian | 64 | 1.5% |
| German | 957 | 22.5% |
| Indonesian | 19 | 0.4% |
| Irish | 838 | 19.7% |
| Italian | 125 | 2.9% |
| Laotian | 31 | 0.7% |
| Mexican | 120 | 2.8% |
| Native Hawaiian | 3 | 0.1% |
| Northern European | 13 | 0.3% |
| Norwegian | 29 | 0.7% |
| Polish | 240 | 5.6% |
| Puerto Rican | 103 | 2.4% |
| Scandinavian | 29 | 0.7% |
| Scotch-Irish | 18 | 0.4% |
| Scottish | 104 | 2.4% |
| Seminole | 43 | 1.0% |
| Slovene | 5 | 0.1% |
| Spaniard | 17 | 0.4% |
| Swedish | 39 | 0.9% |
| Syrian | 40 | 0.9% | View All 32 Rows |
Immigrants in Middleville
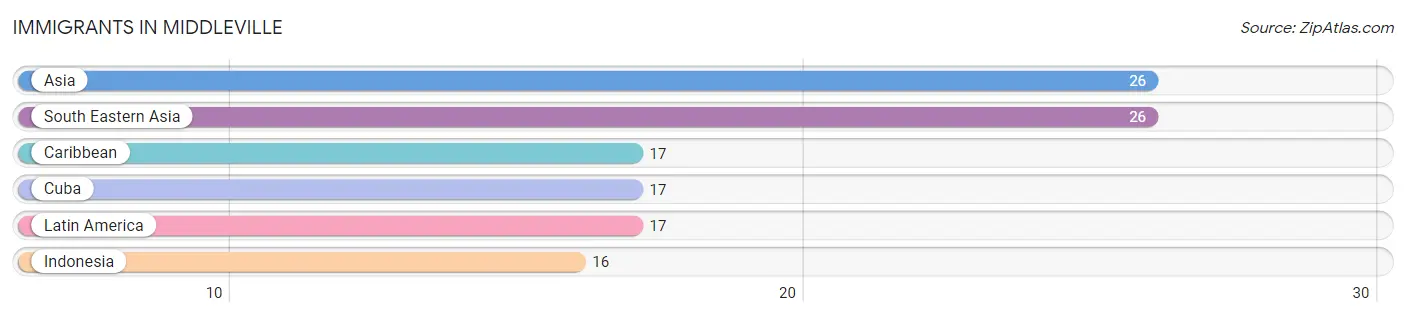
The most numerous immigrant groups reported in Middleville came from Asia (26 | 0.6%), South Eastern Asia (26 | 0.6%), Caribbean (17 | 0.4%), Cuba (17 | 0.4%), and Latin America (17 | 0.4%), together accounting for 2.4% of all Middleville residents.
| Immigration Origin | # Population | % Population |
| Asia | 26 | 0.6% |
| Caribbean | 17 | 0.4% |
| Cuba | 17 | 0.4% |
| Indonesia | 16 | 0.4% |
| Latin America | 17 | 0.4% |
| South Eastern Asia | 26 | 0.6% | View All 6 Rows |
Sex and Age in Middleville
Sex and Age in Middleville
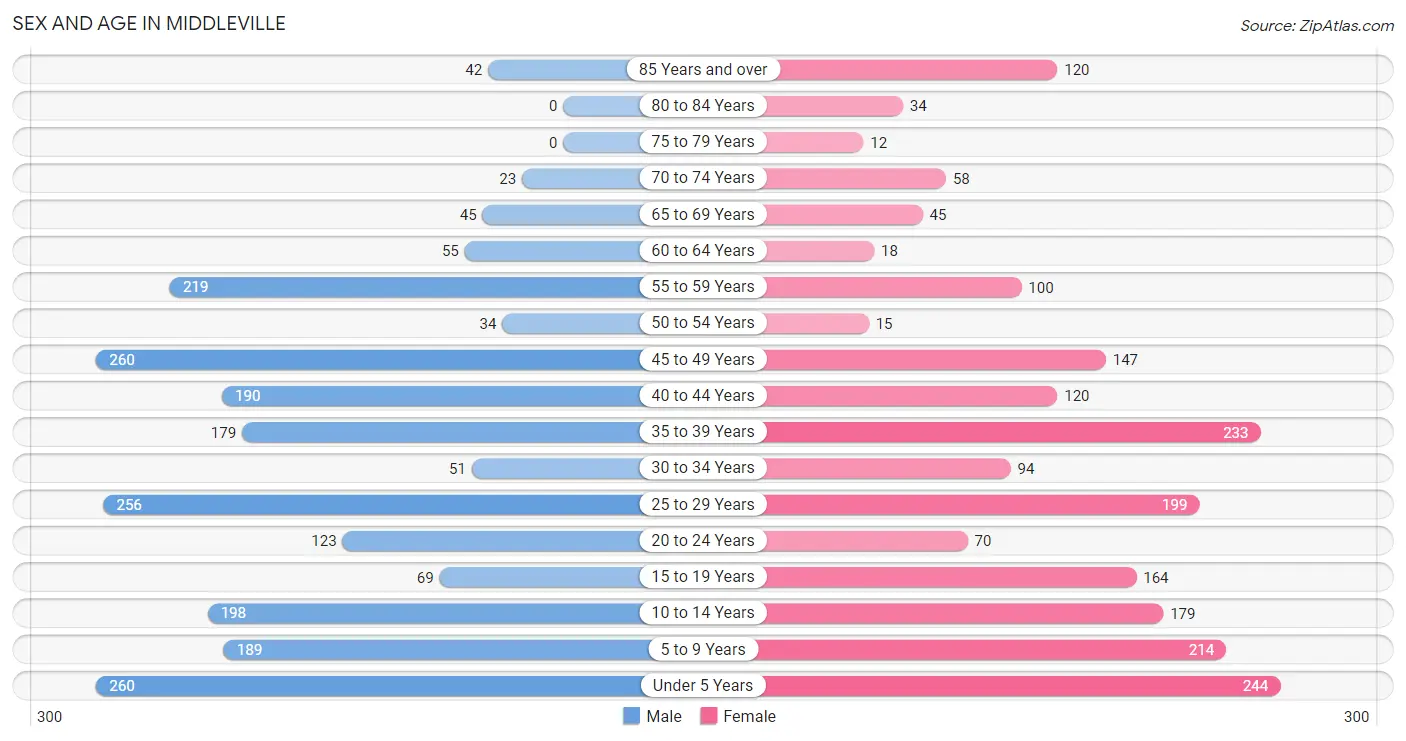
The most populous age groups in Middleville are Under 5 Years (260 | 11.9%) for men and Under 5 Years (244 | 11.8%) for women.
| Age Bracket | Male | Female |
| Under 5 Years | 260 (11.9%) | 244 (11.8%) |
| 5 to 9 Years | 189 (8.6%) | 214 (10.4%) |
| 10 to 14 Years | 198 (9.0%) | 179 (8.7%) |
| 15 to 19 Years | 69 (3.2%) | 164 (7.9%) |
| 20 to 24 Years | 123 (5.6%) | 70 (3.4%) |
| 25 to 29 Years | 256 (11.7%) | 199 (9.6%) |
| 30 to 34 Years | 51 (2.3%) | 94 (4.5%) |
| 35 to 39 Years | 179 (8.2%) | 233 (11.3%) |
| 40 to 44 Years | 190 (8.7%) | 120 (5.8%) |
| 45 to 49 Years | 260 (11.9%) | 147 (7.1%) |
| 50 to 54 Years | 34 (1.5%) | 15 (0.7%) |
| 55 to 59 Years | 219 (10.0%) | 100 (4.8%) |
| 60 to 64 Years | 55 (2.5%) | 18 (0.9%) |
| 65 to 69 Years | 45 (2.1%) | 45 (2.2%) |
| 70 to 74 Years | 23 (1.1%) | 58 (2.8%) |
| 75 to 79 Years | 0 (0.0%) | 12 (0.6%) |
| 80 to 84 Years | 0 (0.0%) | 34 (1.7%) |
| 85 Years and over | 42 (1.9%) | 120 (5.8%) |
| Total | 2,193 (100.0%) | 2,066 (100.0%) |
Families and Households in Middleville
Median Family Size in Middleville
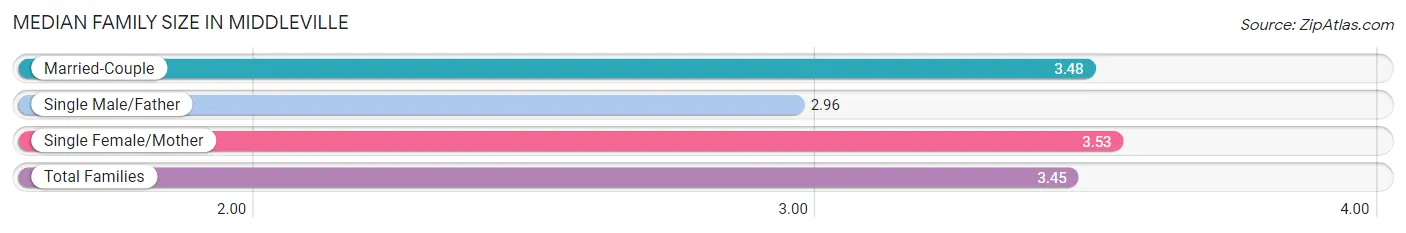
The median family size in Middleville is 3.45 persons per family, with single female/mother families (179 | 19.0%) accounting for the largest median family size of 3.53 persons per family. On the other hand, single male/father families (73 | 7.7%) represent the smallest median family size with 2.96 persons per family.
| Family Type | # Families | Family Size |
| Married-Couple | 690 (73.3%) | 3.48 |
| Single Male/Father | 73 (7.7%) | 2.96 |
| Single Female/Mother | 179 (19.0%) | 3.53 |
| Total Families | 942 (100.0%) | 3.45 |
Median Household Size in Middleville
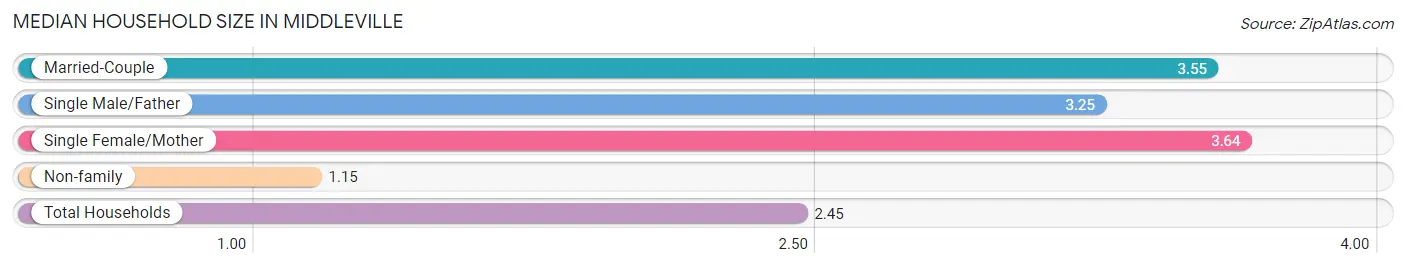
The median household size in Middleville is 2.45 persons per household, with single female/mother households (179 | 10.4%) accounting for the largest median household size of 3.64 persons per household. non-family households (784 | 45.4%) represent the smallest median household size with 1.15 persons per household.
| Household Type | # Households | Household Size |
| Married-Couple | 690 (40.0%) | 3.55 |
| Single Male/Father | 73 (4.2%) | 3.25 |
| Single Female/Mother | 179 (10.4%) | 3.64 |
| Non-family | 784 (45.4%) | 1.15 |
| Total Households | 1,726 (100.0%) | 2.45 |
Household Size by Marriage Status in Middleville
Out of a total of 1,726 households in Middleville, 942 (54.6%) are family households, while 784 (45.4%) are nonfamily households. The most numerous type of family households are 4-person households, comprising 461, and the most common type of nonfamily households are 1-person households, comprising 688.
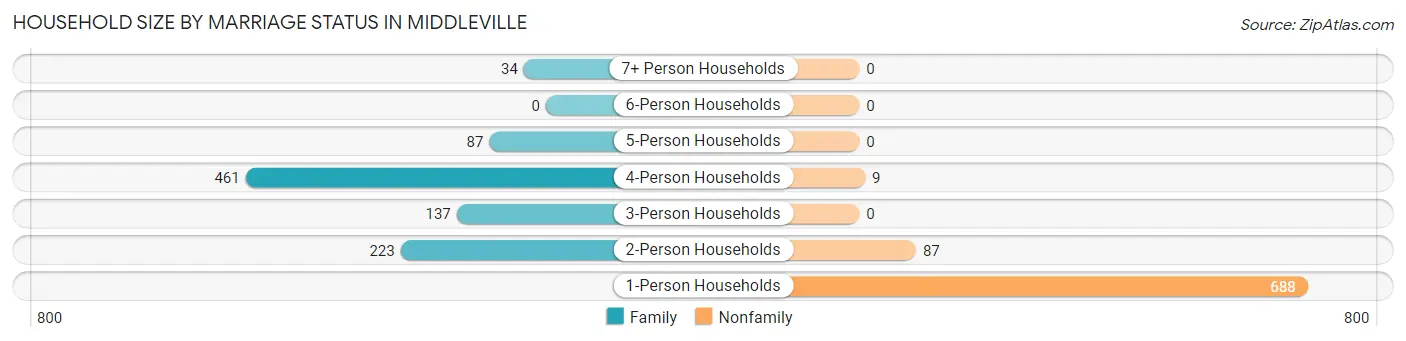
| Household Size | Family Households | Nonfamily Households |
| 1-Person Households | - | 688 (39.9%) |
| 2-Person Households | 223 (12.9%) | 87 (5.0%) |
| 3-Person Households | 137 (7.9%) | 0 (0.0%) |
| 4-Person Households | 461 (26.7%) | 9 (0.5%) |
| 5-Person Households | 87 (5.0%) | 0 (0.0%) |
| 6-Person Households | 0 (0.0%) | 0 (0.0%) |
| 7+ Person Households | 34 (2.0%) | 0 (0.0%) |
| Total | 942 (54.6%) | 784 (45.4%) |
Female Fertility in Middleville
Fertility by Age in Middleville
Average fertility rate in Middleville is 93.0 births per 1,000 women. Women in the age bracket of 20 to 34 years have the highest fertility rate with 223.0 births per 1,000 women. Women in the age bracket of 20 to 34 years acount for 84.4% of all women with births.
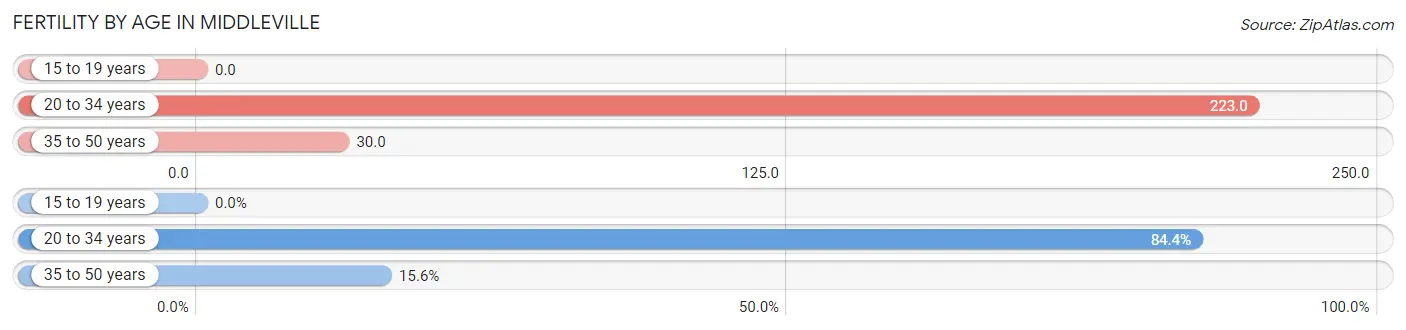
| Age Bracket | Women with Births | Births / 1,000 Women |
| 15 to 19 years | 0 (0.0%) | 0.0 |
| 20 to 34 years | 81 (84.4%) | 223.0 |
| 35 to 50 years | 15 (15.6%) | 30.0 |
| Total | 96 (100.0%) | 93.0 |
Fertility by Age by Marriage Status in Middleville
84.4% of women with births (96) in Middleville are married. The highest percentage of unmarried women with births falls into 35 to 50 years age bracket with 100.0% of them unmarried at the time of birth, while the lowest percentage of unmarried women with births belong to 20 to 34 years age bracket with 0.0% of them unmarried.
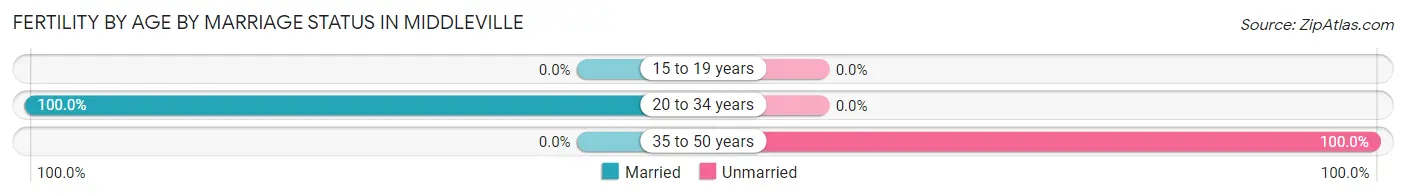
| Age Bracket | Married | Unmarried |
| 15 to 19 years | 0 (0.0%) | 0 (0.0%) |
| 20 to 34 years | 81 (100.0%) | 0 (0.0%) |
| 35 to 50 years | 0 (0.0%) | 15 (100.0%) |
| Total | 81 (84.4%) | 15 (15.6%) |
Fertility by Education in Middleville
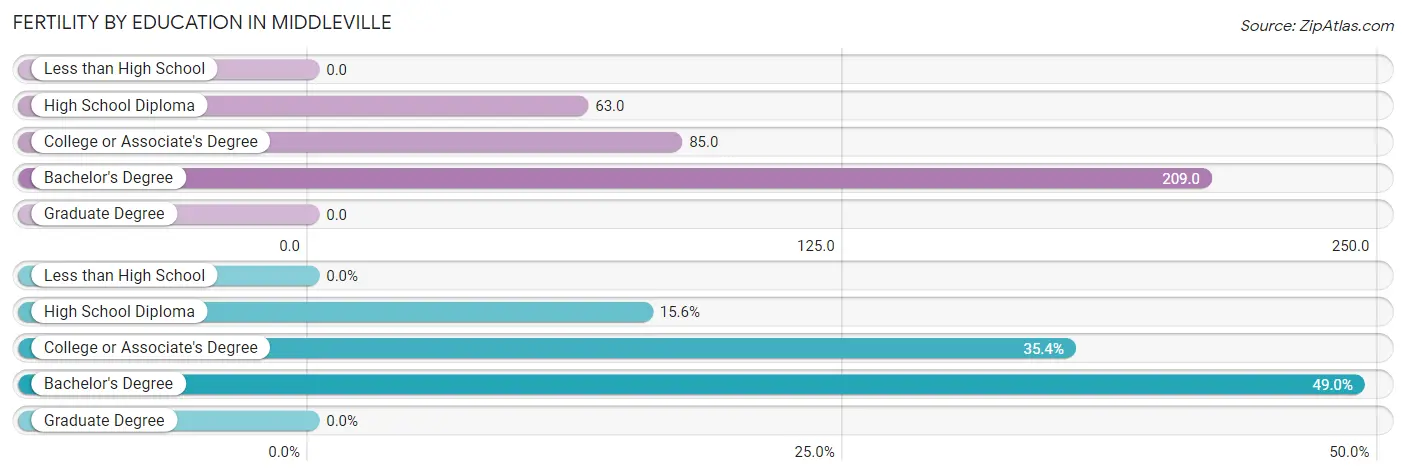
| Educational Attainment | Women with Births | Births / 1,000 Women |
| Less than High School | 0 (0.0%) | 0.0 |
| High School Diploma | 15 (15.6%) | 63.0 |
| College or Associate's Degree | 34 (35.4%) | 85.0 |
| Bachelor's Degree | 47 (49.0%) | 209.0 |
| Graduate Degree | 0 (0.0%) | 0.0 |
| Total | 96 (100.0%) | 93.0 |
Fertility by Education by Marriage Status in Middleville
15.6% of women with births in Middleville are unmarried. Women with the educational attainment of college or associate's degree are most likely to be married with 100.0% of them married at childbirth, while women with the educational attainment of high school diploma are least likely to be married with 100.0% of them unmarried at childbirth.
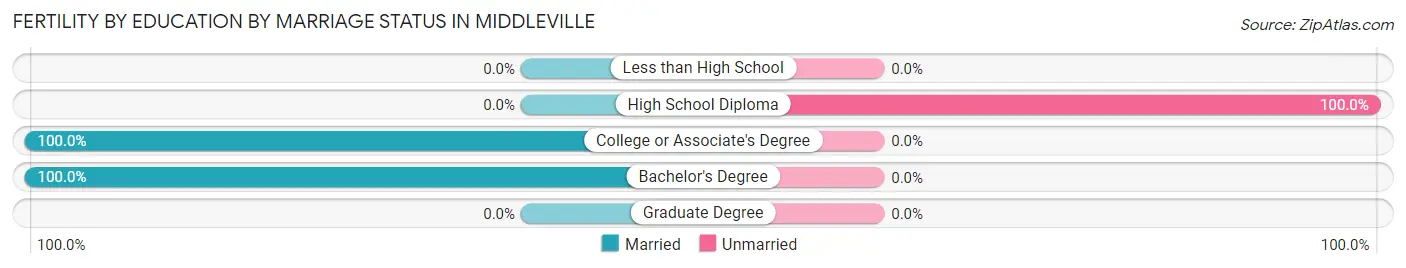
| Educational Attainment | Married | Unmarried |
| Less than High School | 0 (0.0%) | 0 (0.0%) |
| High School Diploma | 0 (0.0%) | 15 (100.0%) |
| College or Associate's Degree | 34 (100.0%) | 0 (0.0%) |
| Bachelor's Degree | 47 (100.0%) | 0 (0.0%) |
| Graduate Degree | 0 (0.0%) | 0 (0.0%) |
| Total | 81 (84.4%) | 15 (15.6%) |
Employment Characteristics in Middleville
Employment by Class of Employer in Middleville
Among the 2,244 employed individuals in Middleville, private company employees (1,664 | 74.2%), not-for-profit organizations (192 | 8.6%), and state government employees (145 | 6.5%) make up the most common classes of employment.
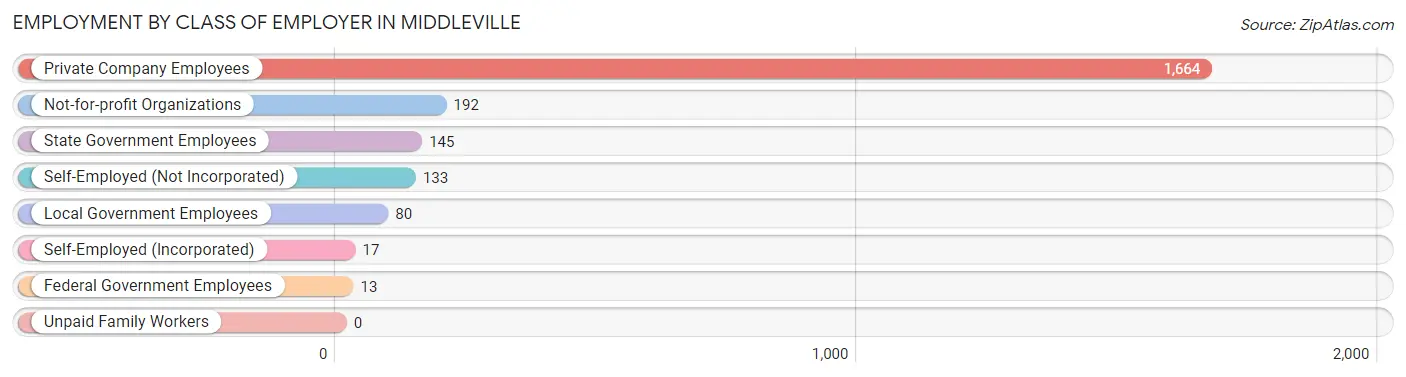
| Employer Class | # Employees | % Employees |
| Private Company Employees | 1,664 | 74.2% |
| Self-Employed (Incorporated) | 17 | 0.8% |
| Self-Employed (Not Incorporated) | 133 | 5.9% |
| Not-for-profit Organizations | 192 | 8.6% |
| Local Government Employees | 80 | 3.6% |
| State Government Employees | 145 | 6.5% |
| Federal Government Employees | 13 | 0.6% |
| Unpaid Family Workers | 0 | 0.0% |
| Total | 2,244 | 100.0% |
Employment Status by Age in Middleville
According to the labor force statistics for Middleville, out of the total population over 16 years of age (2,915), 77.5% or 2,259 individuals are in the labor force, with 0.6% or 14 of them unemployed. The age group with the highest labor force participation rate is 20 to 24 years, with 100.0% or 193 individuals in the labor force. Within the labor force, the 20 to 24 years age range has the highest percentage of unemployed individuals, with 7.3% or 14 of them being unemployed.
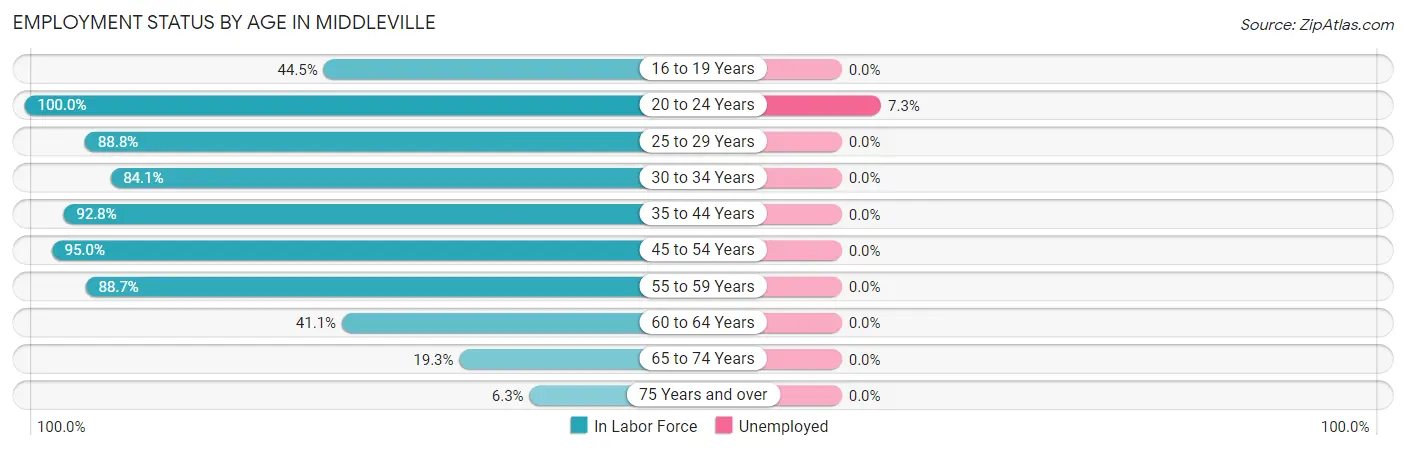
| Age Bracket | In Labor Force | Unemployed |
| 16 to 19 Years | 77 (44.5%) | 0 (0.0%) |
| 20 to 24 Years | 193 (100.0%) | 14 (7.3%) |
| 25 to 29 Years | 404 (88.8%) | 0 (0.0%) |
| 30 to 34 Years | 122 (84.1%) | 0 (0.0%) |
| 35 to 44 Years | 670 (92.8%) | 0 (0.0%) |
| 45 to 54 Years | 433 (95.0%) | 0 (0.0%) |
| 55 to 59 Years | 283 (88.7%) | 0 (0.0%) |
| 60 to 64 Years | 30 (41.1%) | 0 (0.0%) |
| 65 to 74 Years | 33 (19.3%) | 0 (0.0%) |
| 75 Years and over | 13 (6.3%) | 0 (0.0%) |
| Total | 2,259 (77.5%) | 14 (0.6%) |
Employment Status by Educational Attainment in Middleville
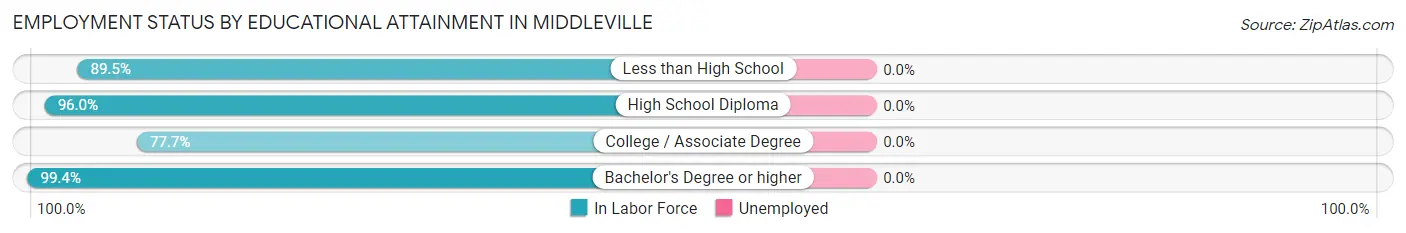
| Educational Attainment | In Labor Force | Unemployed |
| Less than High School | 17 (89.5%) | 0 (0.0%) |
| High School Diploma | 713 (96.0%) | 0 (0.0%) |
| College / Associate Degree | 673 (77.7%) | 0 (0.0%) |
| Bachelor's Degree or higher | 539 (99.4%) | 0 (0.0%) |
| Total | 1,942 (89.5%) | 0 (0.0%) |
Employment Occupations by Sex in Middleville
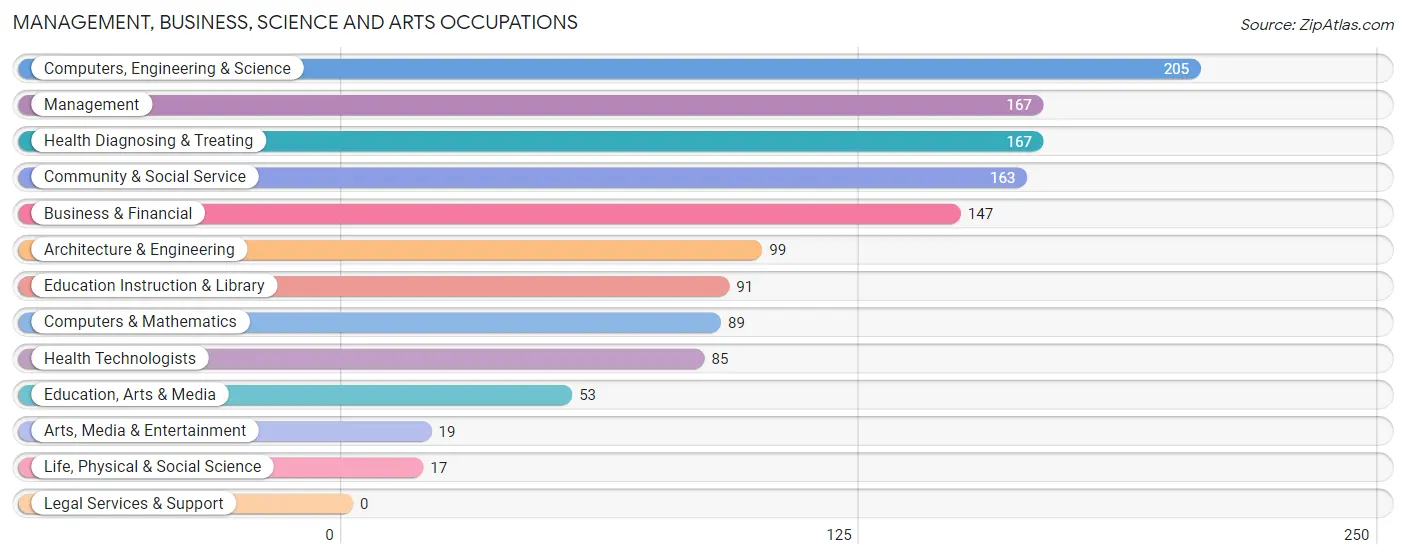
Management, Business, Science and Arts Occupations
The most common Management, Business, Science and Arts occupations in Middleville are Computers, Engineering & Science (205 | 9.1%), Management (167 | 7.4%), Health Diagnosing & Treating (167 | 7.4%), Community & Social Service (163 | 7.3%), and Business & Financial (147 | 6.6%).
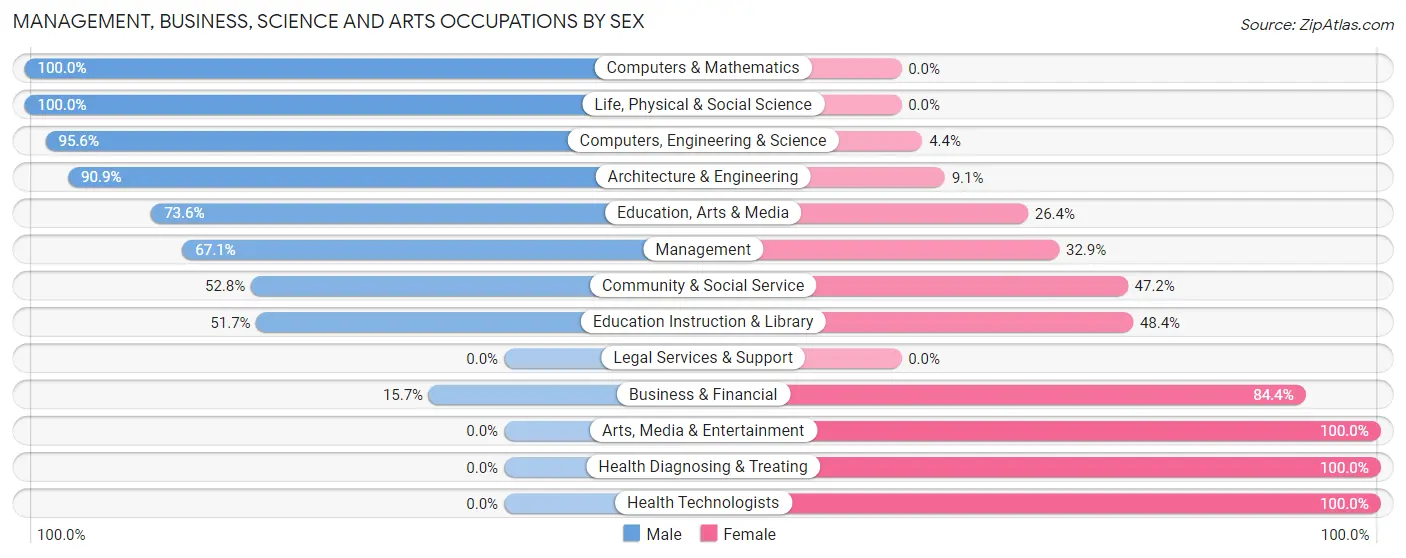
Management, Business, Science and Arts Occupations by Sex
Within the Management, Business, Science and Arts occupations in Middleville, the most male-oriented occupations are Computers & Mathematics (100.0%), Life, Physical & Social Science (100.0%), and Computers, Engineering & Science (95.6%), while the most female-oriented occupations are Arts, Media & Entertainment (100.0%), Health Diagnosing & Treating (100.0%), and Health Technologists (100.0%).
| Occupation | Male | Female |
| Management | 112 (67.1%) | 55 (32.9%) |
| Business & Financial | 23 (15.7%) | 124 (84.4%) |
| Computers, Engineering & Science | 196 (95.6%) | 9 (4.4%) |
| Computers & Mathematics | 89 (100.0%) | 0 (0.0%) |
| Architecture & Engineering | 90 (90.9%) | 9 (9.1%) |
| Life, Physical & Social Science | 17 (100.0%) | 0 (0.0%) |
| Community & Social Service | 86 (52.8%) | 77 (47.2%) |
| Education, Arts & Media | 39 (73.6%) | 14 (26.4%) |
| Legal Services & Support | 0 (0.0%) | 0 (0.0%) |
| Education Instruction & Library | 47 (51.6%) | 44 (48.3%) |
| Arts, Media & Entertainment | 0 (0.0%) | 19 (100.0%) |
| Health Diagnosing & Treating | 0 (0.0%) | 167 (100.0%) |
| Health Technologists | 0 (0.0%) | 85 (100.0%) |
| Total (Category) | 417 (49.1%) | 432 (50.9%) |
| Total (Overall) | 1,344 (59.9%) | 900 (40.1%) |
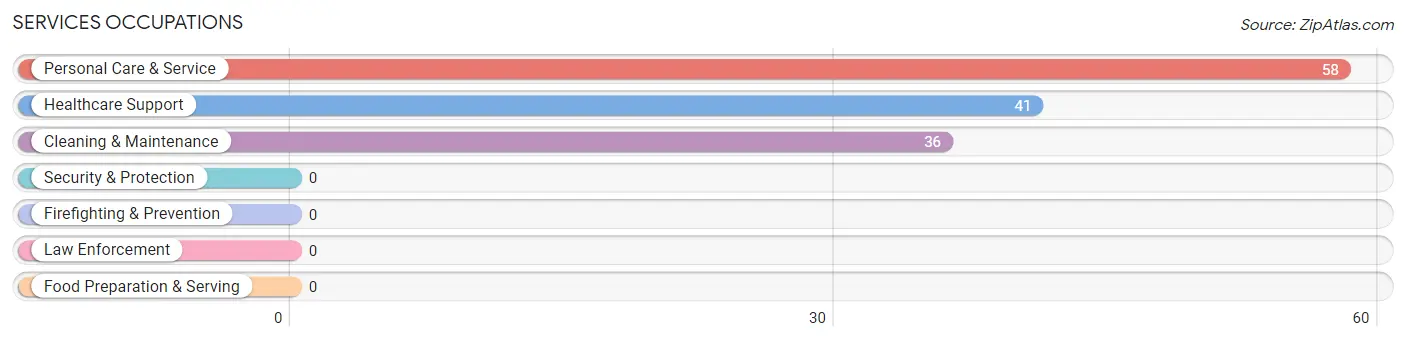
Services Occupations
The most common Services occupations in Middleville are Personal Care & Service (58 | 2.6%), Healthcare Support (41 | 1.8%), and Cleaning & Maintenance (36 | 1.6%).
Services Occupations by Sex
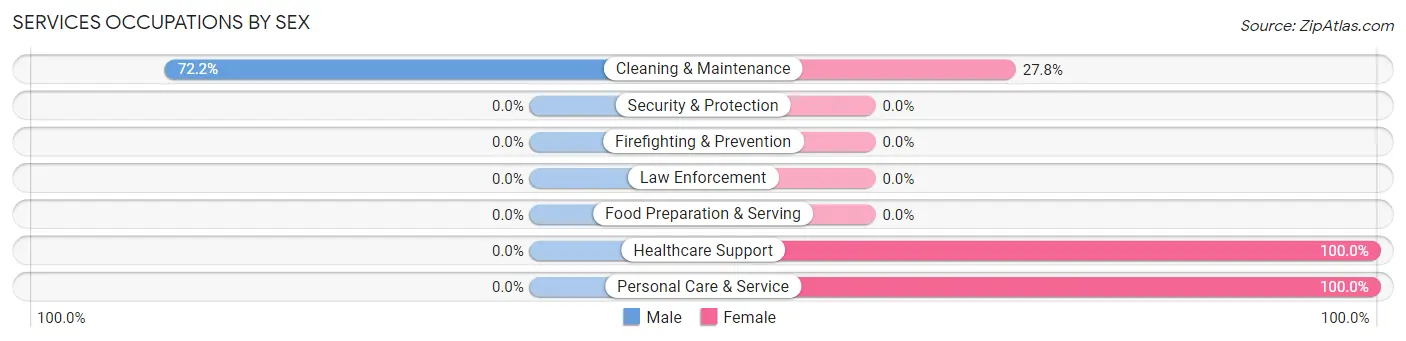
| Occupation | Male | Female |
| Healthcare Support | 0 (0.0%) | 41 (100.0%) |
| Security & Protection | 0 (0.0%) | 0 (0.0%) |
| Firefighting & Prevention | 0 (0.0%) | 0 (0.0%) |
| Law Enforcement | 0 (0.0%) | 0 (0.0%) |
| Food Preparation & Serving | 0 (0.0%) | 0 (0.0%) |
| Cleaning & Maintenance | 26 (72.2%) | 10 (27.8%) |
| Personal Care & Service | 0 (0.0%) | 58 (100.0%) |
| Total (Category) | 26 (19.3%) | 109 (80.7%) |
| Total (Overall) | 1,344 (59.9%) | 900 (40.1%) |
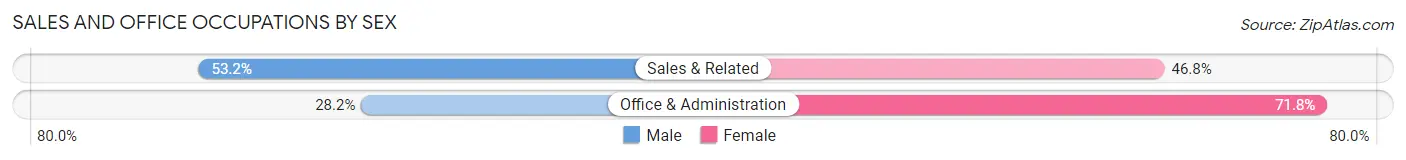
Sales and Office Occupations
The most common Sales and Office occupations in Middleville are Office & Administration (280 | 12.5%), and Sales & Related (201 | 9.0%).
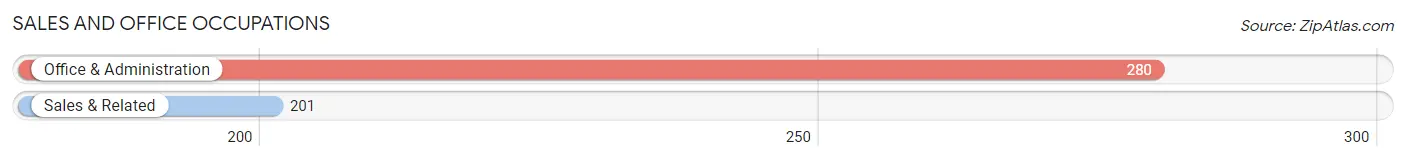
Sales and Office Occupations by Sex
| Occupation | Male | Female |
| Sales & Related | 107 (53.2%) | 94 (46.8%) |
| Office & Administration | 79 (28.2%) | 201 (71.8%) |
| Total (Category) | 186 (38.7%) | 295 (61.3%) |
| Total (Overall) | 1,344 (59.9%) | 900 (40.1%) |
Natural Resources, Construction and Maintenance Occupations
The most common Natural Resources, Construction and Maintenance occupations in Middleville are Construction & Extraction (132 | 5.9%), and Installation, Maintenance & Repair (131 | 5.8%).
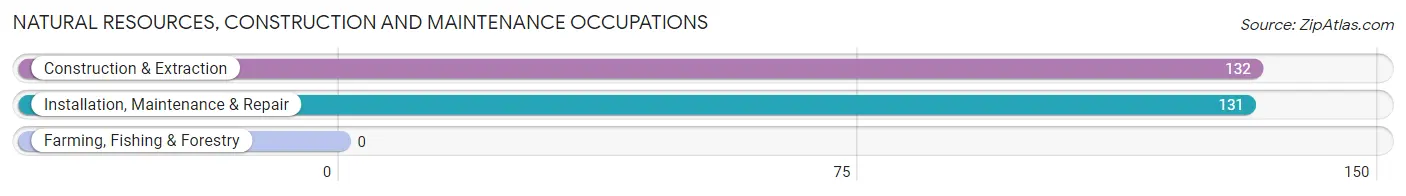
Natural Resources, Construction and Maintenance Occupations by Sex

| Occupation | Male | Female |
| Farming, Fishing & Forestry | 0 (0.0%) | 0 (0.0%) |
| Construction & Extraction | 132 (100.0%) | 0 (0.0%) |
| Installation, Maintenance & Repair | 131 (100.0%) | 0 (0.0%) |
| Total (Category) | 263 (100.0%) | 0 (0.0%) |
| Total (Overall) | 1,344 (59.9%) | 900 (40.1%) |
Production, Transportation and Moving Occupations
The most common Production, Transportation and Moving occupations in Middleville are Production (398 | 17.7%), Material Moving (91 | 4.1%), and Transportation (27 | 1.2%).
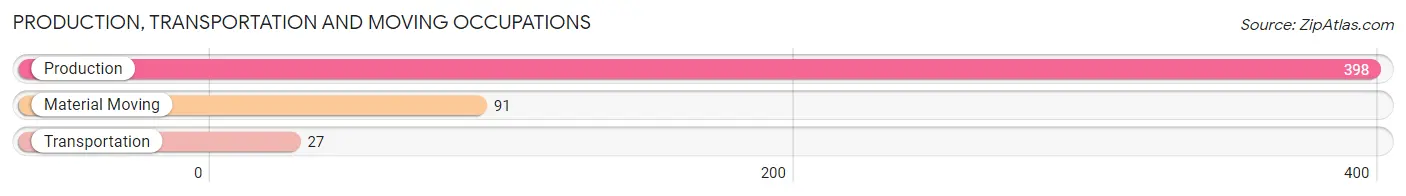
Production, Transportation and Moving Occupations by Sex
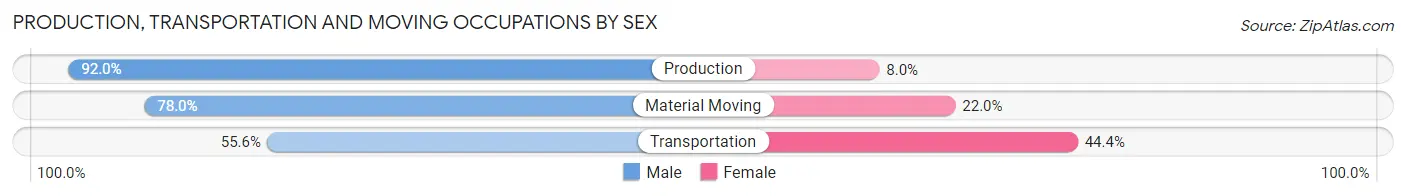
| Occupation | Male | Female |
| Production | 366 (92.0%) | 32 (8.0%) |
| Transportation | 15 (55.6%) | 12 (44.4%) |
| Material Moving | 71 (78.0%) | 20 (22.0%) |
| Total (Category) | 452 (87.6%) | 64 (12.4%) |
| Total (Overall) | 1,344 (59.9%) | 900 (40.1%) |
Employment Industries by Sex in Middleville
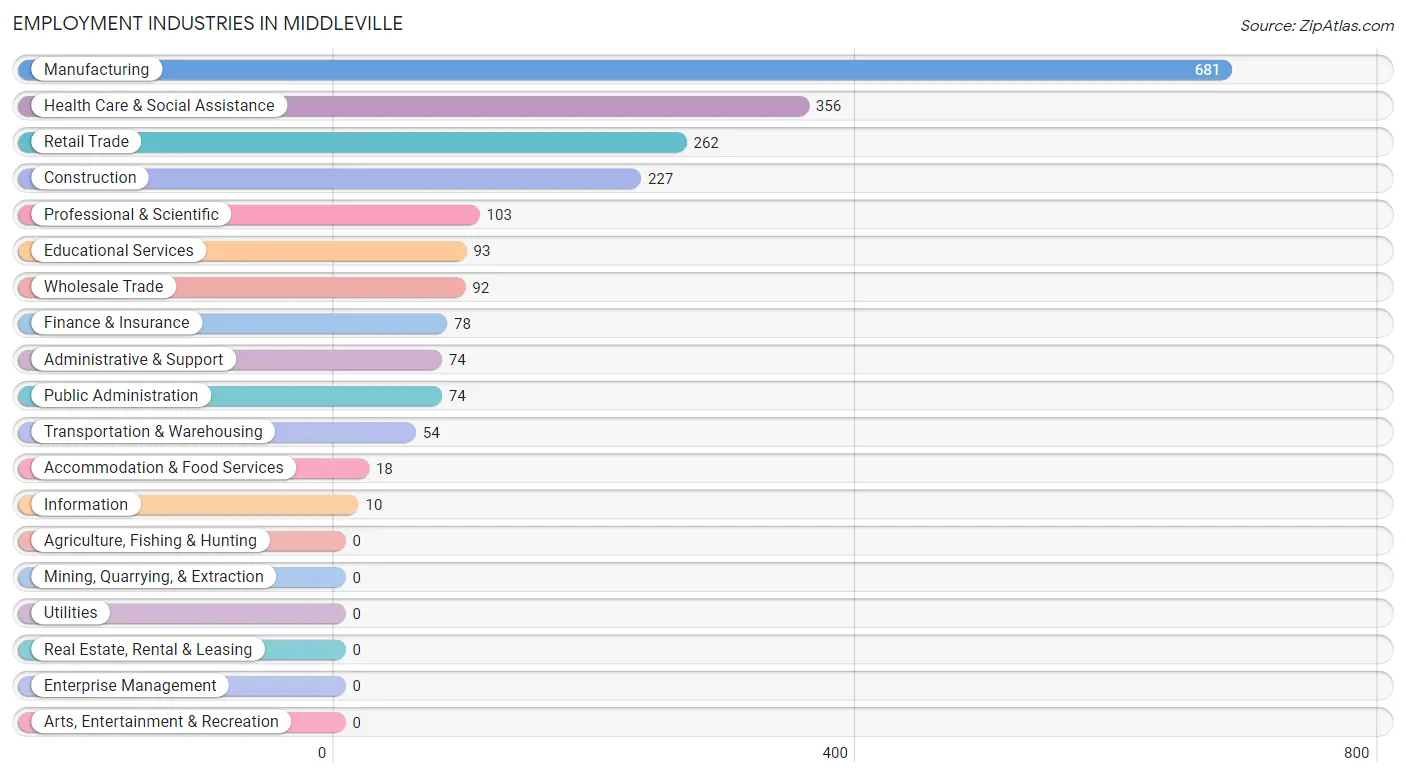
Employment Industries in Middleville
The major employment industries in Middleville include Manufacturing (681 | 30.3%), Health Care & Social Assistance (356 | 15.9%), Retail Trade (262 | 11.7%), Construction (227 | 10.1%), and Professional & Scientific (103 | 4.6%).
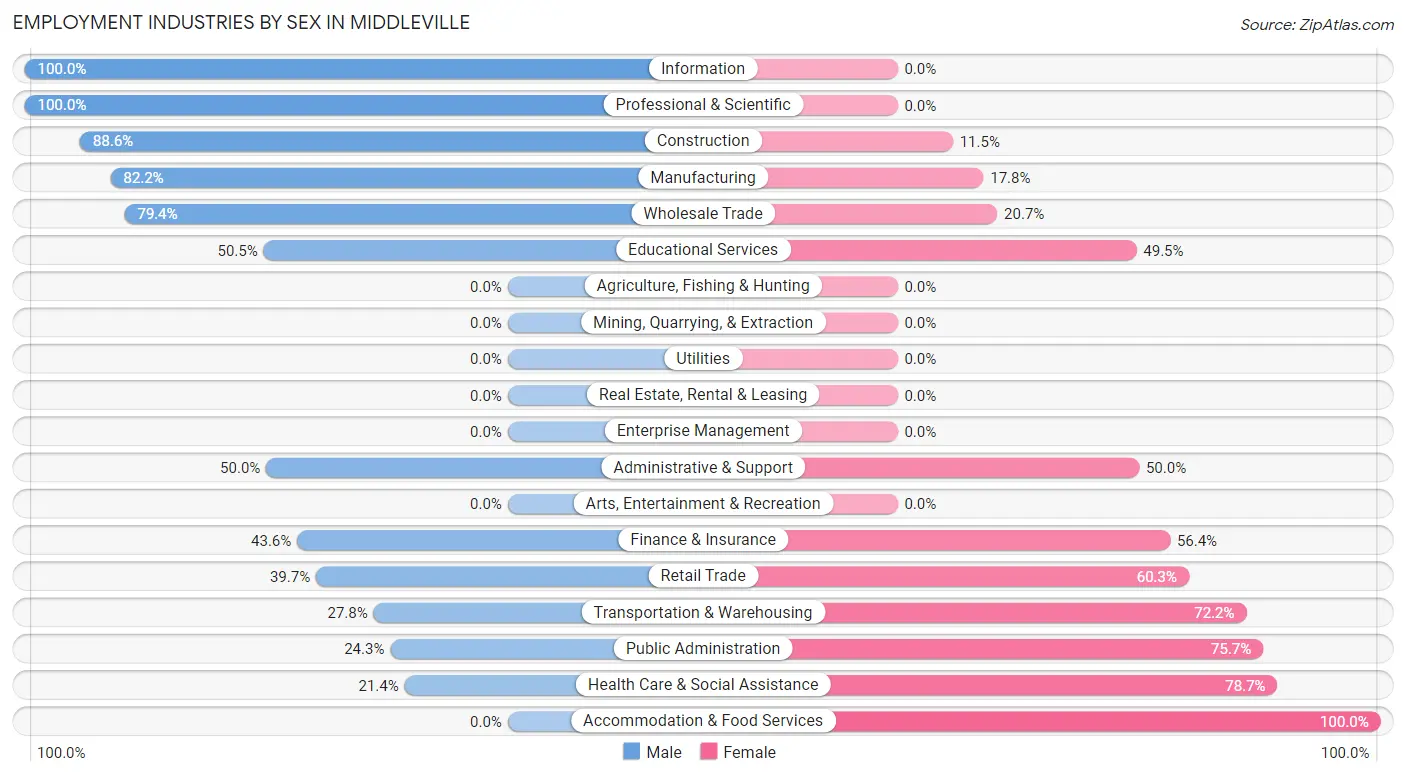
Employment Industries by Sex in Middleville
The Middleville industries that see more men than women are Information (100.0%), Professional & Scientific (100.0%), and Construction (88.5%), whereas the industries that tend to have a higher number of women are Accommodation & Food Services (100.0%), Health Care & Social Assistance (78.6%), and Public Administration (75.7%).
| Industry | Male | Female |
| Agriculture, Fishing & Hunting | 0 (0.0%) | 0 (0.0%) |
| Mining, Quarrying, & Extraction | 0 (0.0%) | 0 (0.0%) |
| Construction | 201 (88.5%) | 26 (11.5%) |
| Manufacturing | 560 (82.2%) | 121 (17.8%) |
| Wholesale Trade | 73 (79.3%) | 19 (20.6%) |
| Retail Trade | 104 (39.7%) | 158 (60.3%) |
| Transportation & Warehousing | 15 (27.8%) | 39 (72.2%) |
| Utilities | 0 (0.0%) | 0 (0.0%) |
| Information | 10 (100.0%) | 0 (0.0%) |
| Finance & Insurance | 34 (43.6%) | 44 (56.4%) |
| Real Estate, Rental & Leasing | 0 (0.0%) | 0 (0.0%) |
| Professional & Scientific | 103 (100.0%) | 0 (0.0%) |
| Enterprise Management | 0 (0.0%) | 0 (0.0%) |
| Administrative & Support | 37 (50.0%) | 37 (50.0%) |
| Educational Services | 47 (50.5%) | 46 (49.5%) |
| Health Care & Social Assistance | 76 (21.3%) | 280 (78.6%) |
| Arts, Entertainment & Recreation | 0 (0.0%) | 0 (0.0%) |
| Accommodation & Food Services | 0 (0.0%) | 18 (100.0%) |
| Public Administration | 18 (24.3%) | 56 (75.7%) |
| Total | 1,344 (59.9%) | 900 (40.1%) |
Education in Middleville
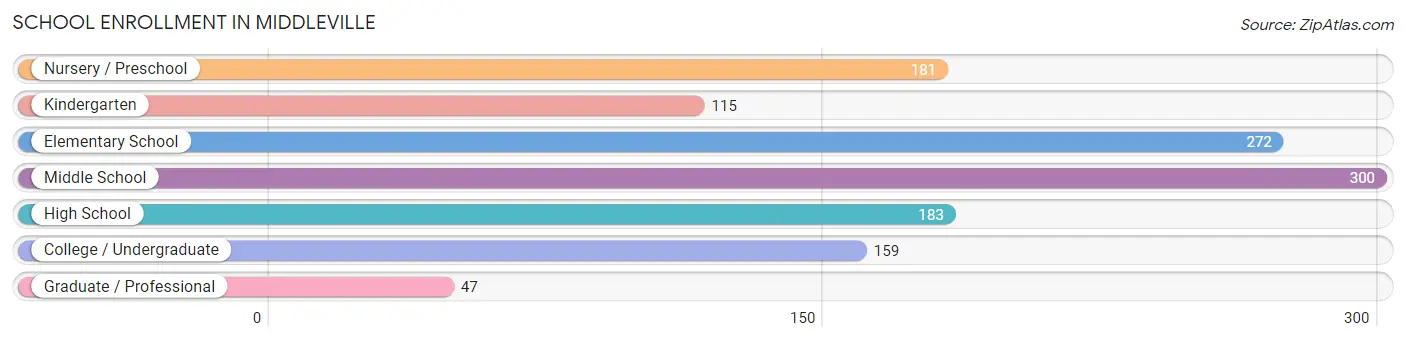
School Enrollment in Middleville
The most common levels of schooling among the 1,257 students in Middleville are middle school (300 | 23.9%), elementary school (272 | 21.6%), and high school (183 | 14.6%).
| School Level | # Students | % Students |
| Nursery / Preschool | 181 | 14.4% |
| Kindergarten | 115 | 9.1% |
| Elementary School | 272 | 21.6% |
| Middle School | 300 | 23.9% |
| High School | 183 | 14.6% |
| College / Undergraduate | 159 | 12.7% |
| Graduate / Professional | 47 | 3.7% |
| Total | 1,257 | 100.0% |
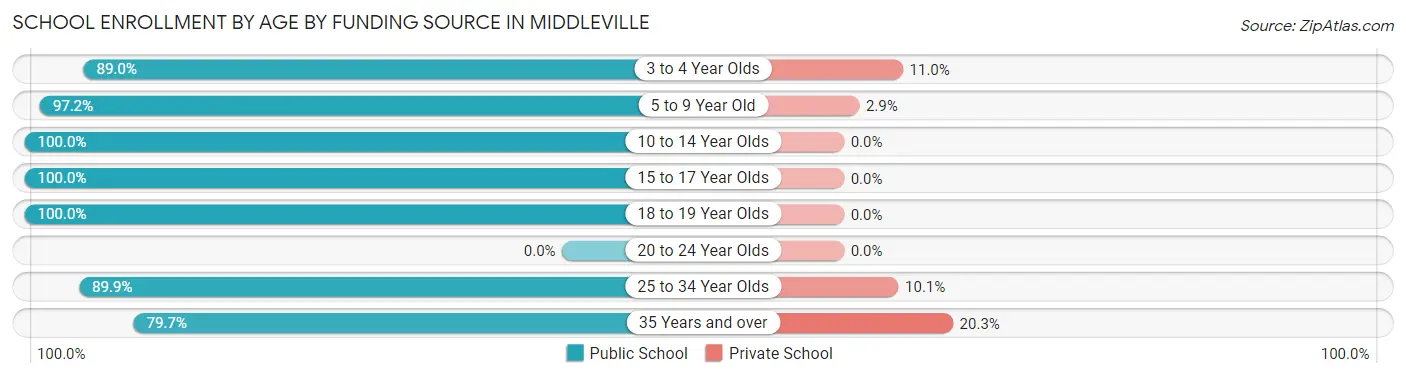
School Enrollment by Age by Funding Source in Middleville
Out of a total of 1,257 students who are enrolled in schools in Middleville, 64 (5.1%) attend a private institution, while the remaining 1,193 (94.9%) are enrolled in public schools. The age group of 35 years and over has the highest likelihood of being enrolled in private schools, with 27 (20.3% in the age bracket) enrolled. Conversely, the age group of 10 to 14 year olds has the lowest likelihood of being enrolled in a private school, with 345 (100.0% in the age bracket) attending a public institution.
| Age Bracket | Public School | Private School |
| 3 to 4 Year Olds | 154 (89.0%) | 19 (11.0%) |
| 5 to 9 Year Old | 375 (97.2%) | 11 (2.9%) |
| 10 to 14 Year Olds | 345 (100.0%) | 0 (0.0%) |
| 15 to 17 Year Olds | 129 (100.0%) | 0 (0.0%) |
| 18 to 19 Year Olds | 22 (100.0%) | 0 (0.0%) |
| 20 to 24 Year Olds | 0 (0.0%) | 0 (0.0%) |
| 25 to 34 Year Olds | 62 (89.9%) | 7 (10.1%) |
| 35 Years and over | 106 (79.7%) | 27 (20.3%) |
| Total | 1,193 (94.9%) | 64 (5.1%) |
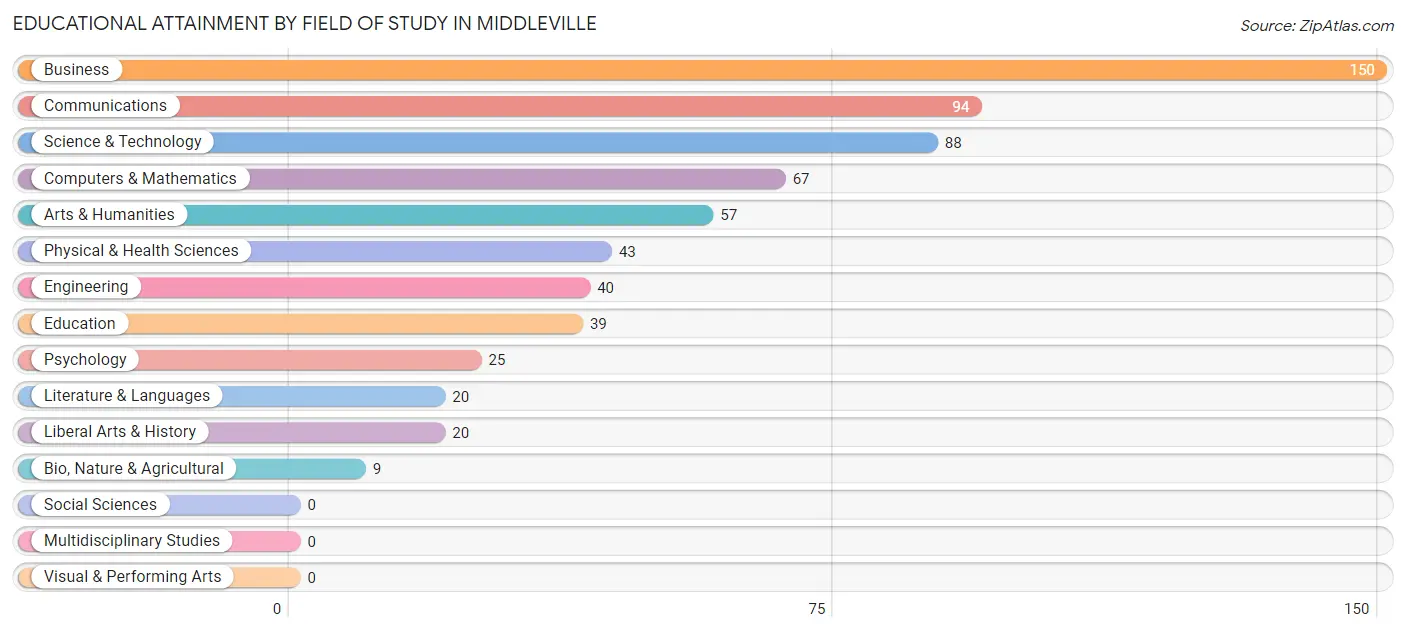
Educational Attainment by Field of Study in Middleville
Business (150 | 23.0%), communications (94 | 14.4%), science & technology (88 | 13.5%), computers & mathematics (67 | 10.3%), and arts & humanities (57 | 8.7%) are the most common fields of study among 652 individuals in Middleville who have obtained a bachelor's degree or higher.
| Field of Study | # Graduates | % Graduates |
| Computers & Mathematics | 67 | 10.3% |
| Bio, Nature & Agricultural | 9 | 1.4% |
| Physical & Health Sciences | 43 | 6.6% |
| Psychology | 25 | 3.8% |
| Social Sciences | 0 | 0.0% |
| Engineering | 40 | 6.1% |
| Multidisciplinary Studies | 0 | 0.0% |
| Science & Technology | 88 | 13.5% |
| Business | 150 | 23.0% |
| Education | 39 | 6.0% |
| Literature & Languages | 20 | 3.1% |
| Liberal Arts & History | 20 | 3.1% |
| Visual & Performing Arts | 0 | 0.0% |
| Communications | 94 | 14.4% |
| Arts & Humanities | 57 | 8.7% |
| Total | 652 | 100.0% |
Transportation & Commute in Middleville
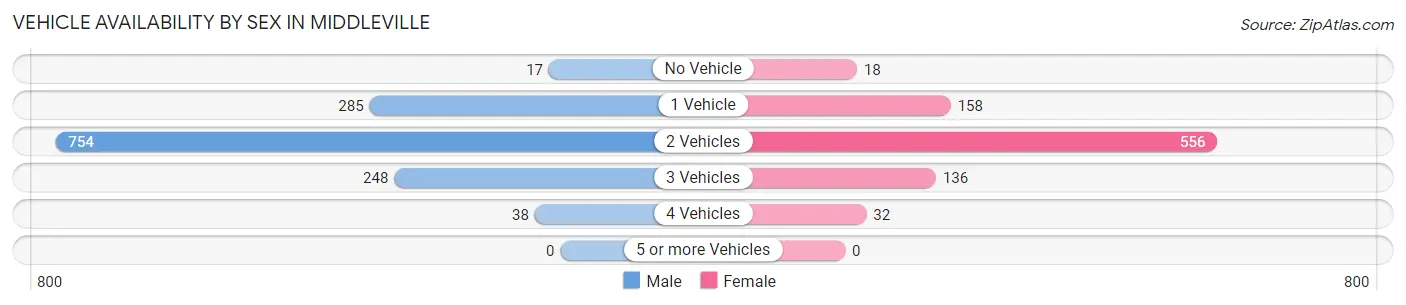
Vehicle Availability by Sex in Middleville
The most prevalent vehicle ownership categories in Middleville are males with 2 vehicles (754, accounting for 56.2%) and females with 2 vehicles (556, making up 83.8%).
| Vehicles Available | Male | Female |
| No Vehicle | 17 (1.3%) | 18 (2.0%) |
| 1 Vehicle | 285 (21.2%) | 158 (17.6%) |
| 2 Vehicles | 754 (56.2%) | 556 (61.8%) |
| 3 Vehicles | 248 (18.5%) | 136 (15.1%) |
| 4 Vehicles | 38 (2.8%) | 32 (3.6%) |
| 5 or more Vehicles | 0 (0.0%) | 0 (0.0%) |
| Total | 1,342 (100.0%) | 900 (100.0%) |
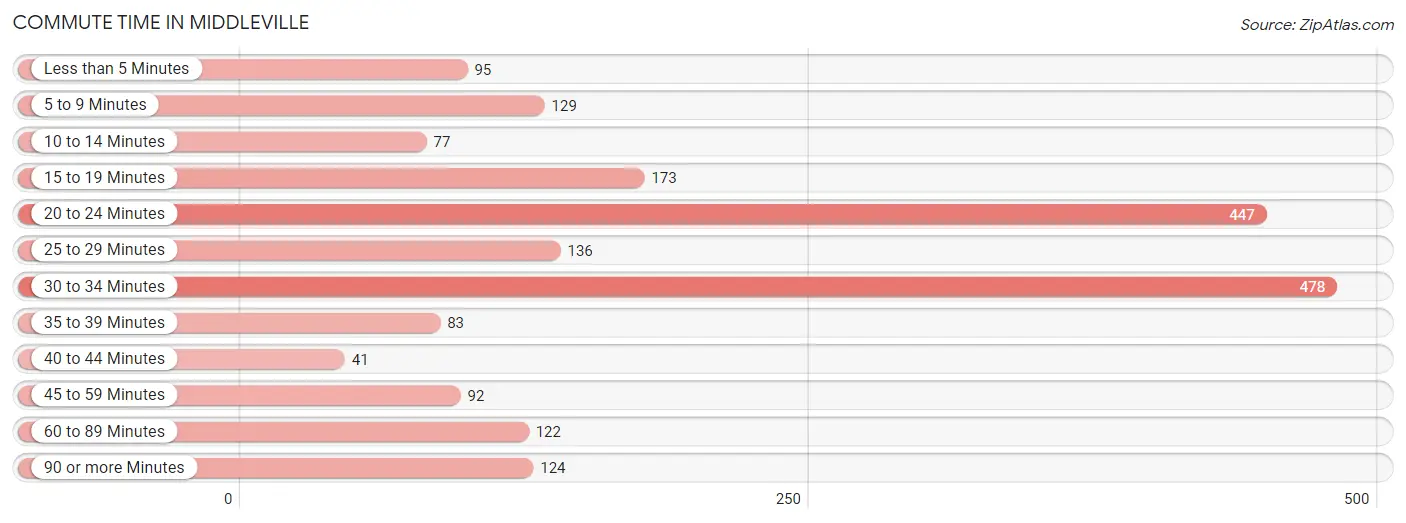
Commute Time in Middleville
The most frequently occuring commute durations in Middleville are 30 to 34 minutes (478 commuters, 23.9%), 20 to 24 minutes (447 commuters, 22.4%), and 15 to 19 minutes (173 commuters, 8.7%).
| Commute Time | # Commuters | % Commuters |
| Less than 5 Minutes | 95 | 4.8% |
| 5 to 9 Minutes | 129 | 6.5% |
| 10 to 14 Minutes | 77 | 3.9% |
| 15 to 19 Minutes | 173 | 8.7% |
| 20 to 24 Minutes | 447 | 22.4% |
| 25 to 29 Minutes | 136 | 6.8% |
| 30 to 34 Minutes | 478 | 23.9% |
| 35 to 39 Minutes | 83 | 4.2% |
| 40 to 44 Minutes | 41 | 2.1% |
| 45 to 59 Minutes | 92 | 4.6% |
| 60 to 89 Minutes | 122 | 6.1% |
| 90 or more Minutes | 124 | 6.2% |
Commute Time by Sex in Middleville
The most common commute times in Middleville are 30 to 34 minutes (365 commuters, 29.1%) for males and 20 to 24 minutes (149 commuters, 20.0%) for females.
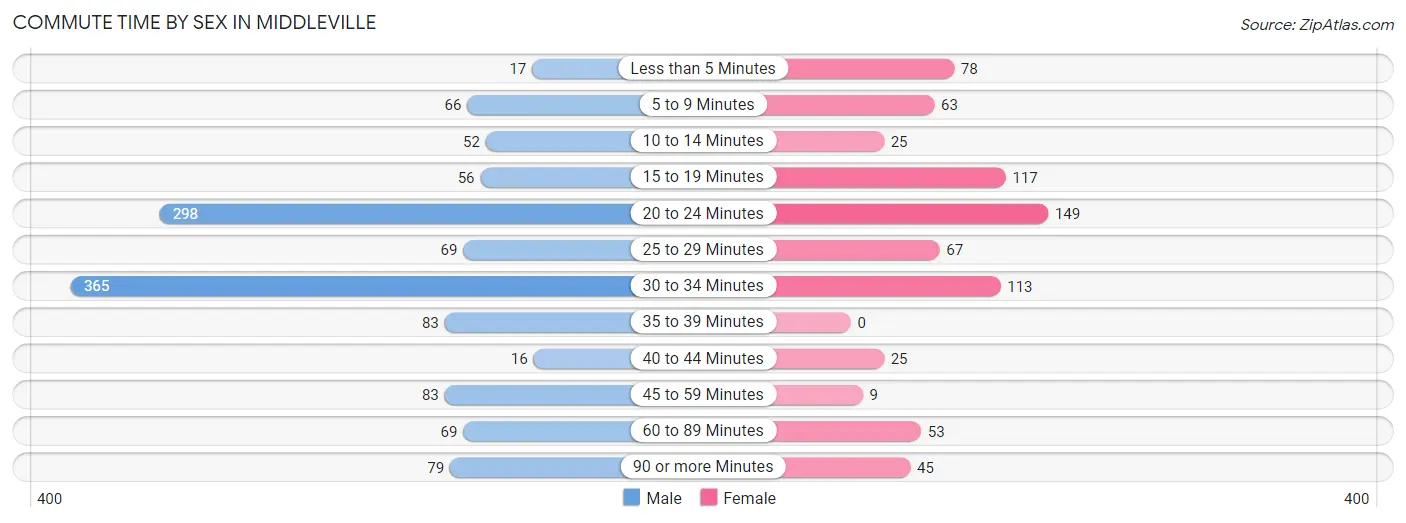
| Commute Time | Male | Female |
| Less than 5 Minutes | 17 (1.4%) | 78 (10.5%) |
| 5 to 9 Minutes | 66 (5.3%) | 63 (8.5%) |
| 10 to 14 Minutes | 52 (4.2%) | 25 (3.4%) |
| 15 to 19 Minutes | 56 (4.5%) | 117 (15.7%) |
| 20 to 24 Minutes | 298 (23.8%) | 149 (20.0%) |
| 25 to 29 Minutes | 69 (5.5%) | 67 (9.0%) |
| 30 to 34 Minutes | 365 (29.1%) | 113 (15.2%) |
| 35 to 39 Minutes | 83 (6.6%) | 0 (0.0%) |
| 40 to 44 Minutes | 16 (1.3%) | 25 (3.4%) |
| 45 to 59 Minutes | 83 (6.6%) | 9 (1.2%) |
| 60 to 89 Minutes | 69 (5.5%) | 53 (7.1%) |
| 90 or more Minutes | 79 (6.3%) | 45 (6.0%) |
Time of Departure to Work by Sex in Middleville
The most frequent times of departure to work in Middleville are 6:00 AM to 6:29 AM (254, 20.3%) for males and 7:00 AM to 7:29 AM (143, 19.2%) for females.
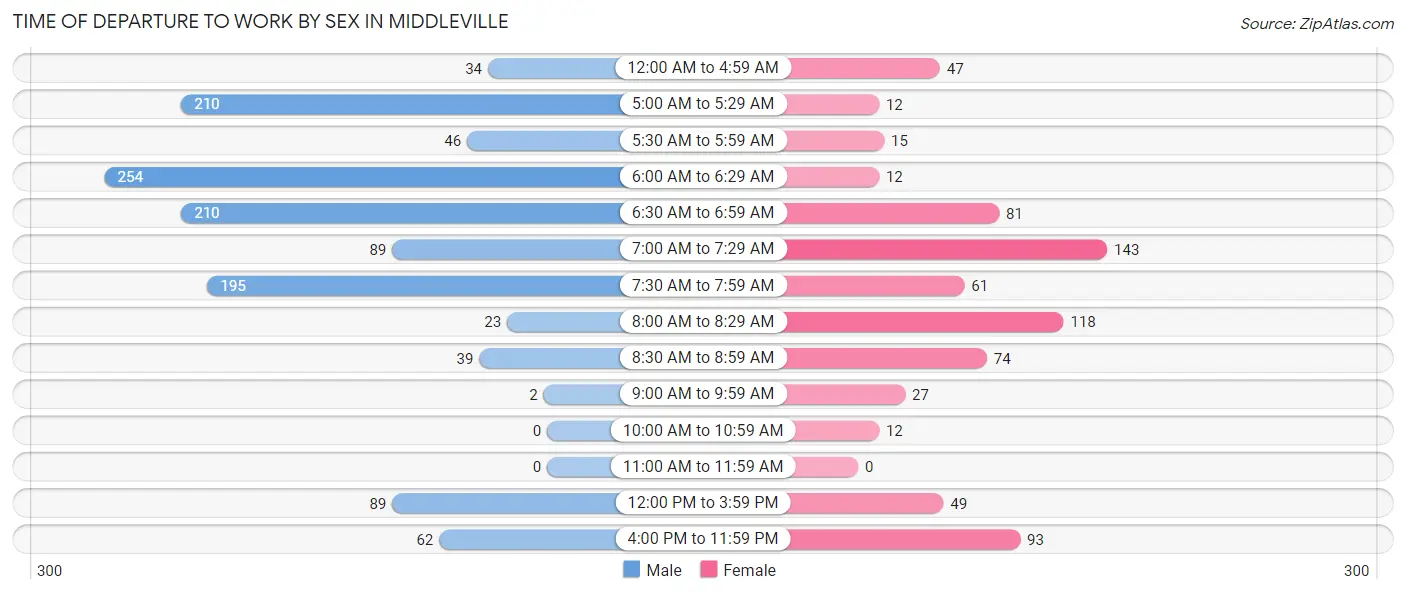
| Time of Departure | Male | Female |
| 12:00 AM to 4:59 AM | 34 (2.7%) | 47 (6.3%) |
| 5:00 AM to 5:29 AM | 210 (16.8%) | 12 (1.6%) |
| 5:30 AM to 5:59 AM | 46 (3.7%) | 15 (2.0%) |
| 6:00 AM to 6:29 AM | 254 (20.3%) | 12 (1.6%) |
| 6:30 AM to 6:59 AM | 210 (16.8%) | 81 (10.9%) |
| 7:00 AM to 7:29 AM | 89 (7.1%) | 143 (19.2%) |
| 7:30 AM to 7:59 AM | 195 (15.6%) | 61 (8.2%) |
| 8:00 AM to 8:29 AM | 23 (1.8%) | 118 (15.9%) |
| 8:30 AM to 8:59 AM | 39 (3.1%) | 74 (10.0%) |
| 9:00 AM to 9:59 AM | 2 (0.2%) | 27 (3.6%) |
| 10:00 AM to 10:59 AM | 0 (0.0%) | 12 (1.6%) |
| 11:00 AM to 11:59 AM | 0 (0.0%) | 0 (0.0%) |
| 12:00 PM to 3:59 PM | 89 (7.1%) | 49 (6.6%) |
| 4:00 PM to 11:59 PM | 62 (5.0%) | 93 (12.5%) |
| Total | 1,253 (100.0%) | 744 (100.0%) |
Housing Occupancy in Middleville
Occupancy by Ownership in Middleville
Of the total 1,726 dwellings in Middleville, owner-occupied units account for 1,283 (74.3%), while renter-occupied units make up 443 (25.7%).
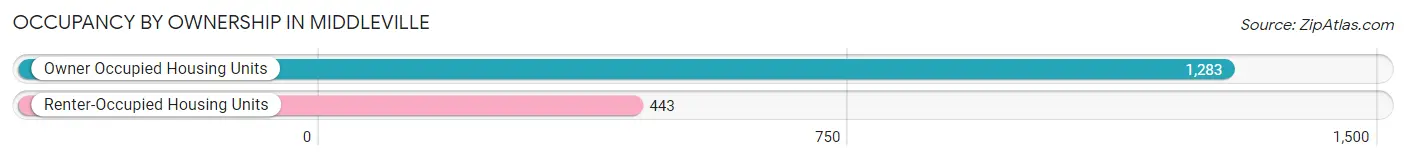
| Occupancy | # Housing Units | % Housing Units |
| Owner Occupied Housing Units | 1,283 | 74.3% |
| Renter-Occupied Housing Units | 443 | 25.7% |
| Total Occupied Housing Units | 1,726 | 100.0% |
Occupancy by Household Size in Middleville
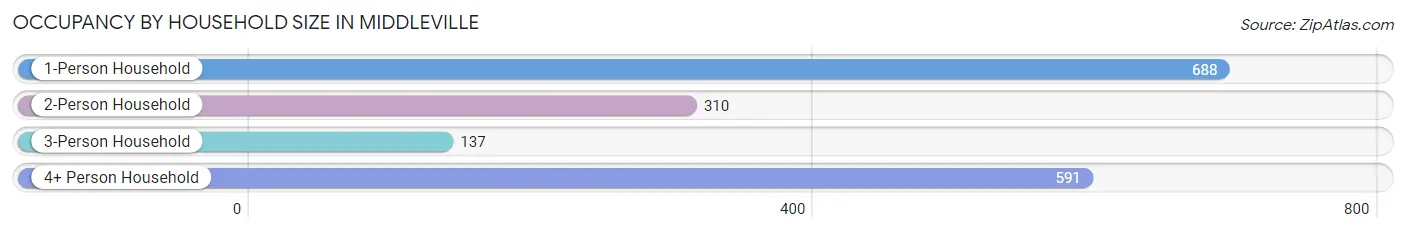
| Household Size | # Housing Units | % Housing Units |
| 1-Person Household | 688 | 39.9% |
| 2-Person Household | 310 | 18.0% |
| 3-Person Household | 137 | 7.9% |
| 4+ Person Household | 591 | 34.2% |
| Total Housing Units | 1,726 | 100.0% |
Occupancy by Ownership by Household Size in Middleville
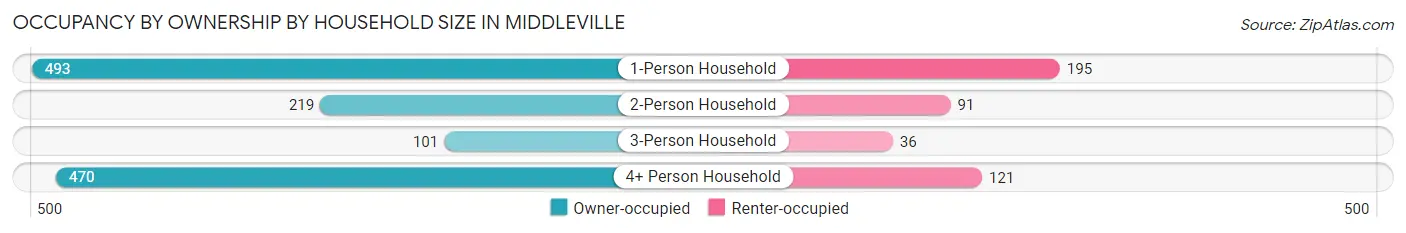
| Household Size | Owner-occupied | Renter-occupied |
| 1-Person Household | 493 (71.7%) | 195 (28.3%) |
| 2-Person Household | 219 (70.7%) | 91 (29.3%) |
| 3-Person Household | 101 (73.7%) | 36 (26.3%) |
| 4+ Person Household | 470 (79.5%) | 121 (20.5%) |
| Total Housing Units | 1,283 (74.3%) | 443 (25.7%) |
Occupancy by Educational Attainment in Middleville
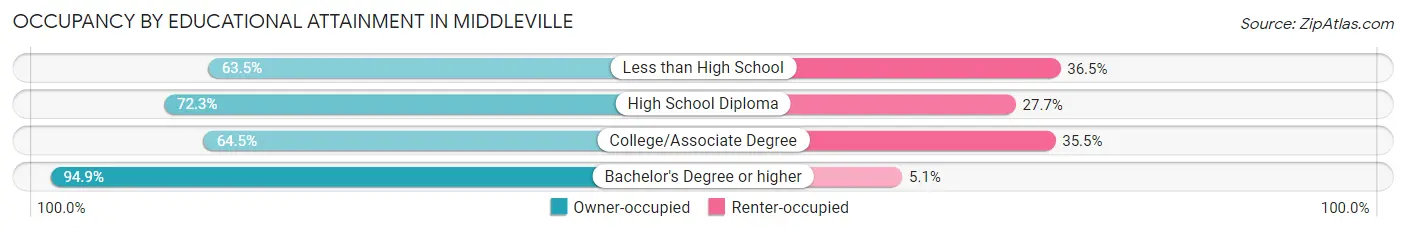
| Household Size | Owner-occupied | Renter-occupied |
| Less than High School | 40 (63.5%) | 23 (36.5%) |
| High School Diploma | 374 (72.3%) | 143 (27.7%) |
| College/Associate Degree | 463 (64.5%) | 255 (35.5%) |
| Bachelor's Degree or higher | 406 (94.9%) | 22 (5.1%) |
Occupancy by Age of Householder in Middleville
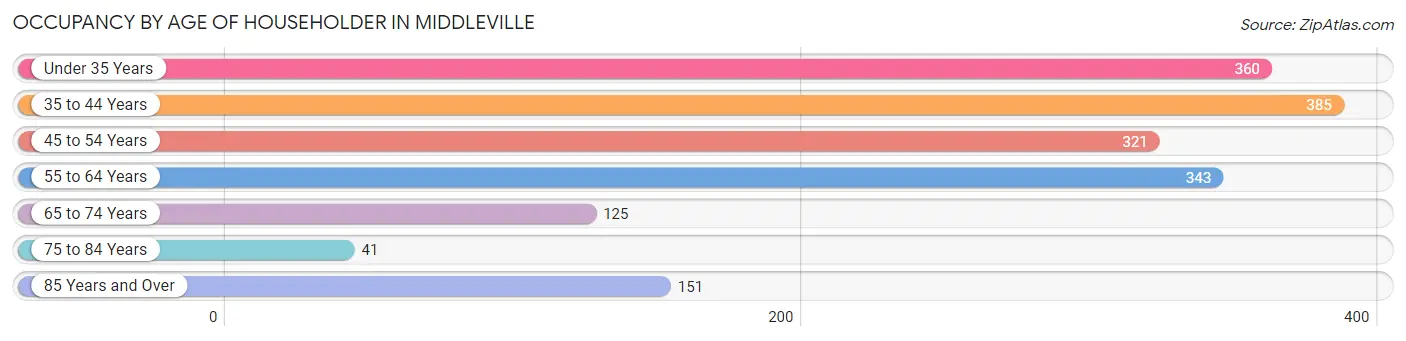
| Age Bracket | # Households | % Households |
| Under 35 Years | 360 | 20.9% |
| 35 to 44 Years | 385 | 22.3% |
| 45 to 54 Years | 321 | 18.6% |
| 55 to 64 Years | 343 | 19.9% |
| 65 to 74 Years | 125 | 7.2% |
| 75 to 84 Years | 41 | 2.4% |
| 85 Years and Over | 151 | 8.7% |
| Total | 1,726 | 100.0% |
Housing Finances in Middleville
Median Income by Occupancy in Middleville
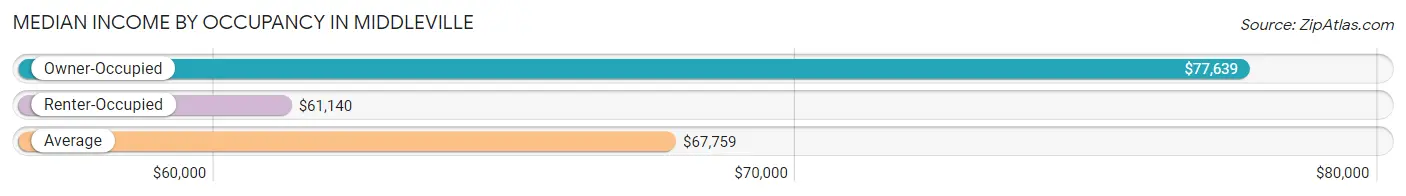
| Occupancy Type | # Households | Median Income |
| Owner-Occupied | 1,283 (74.3%) | $77,639 |
| Renter-Occupied | 443 (25.7%) | $61,140 |
| Average | 1,726 (100.0%) | $67,759 |
Occupancy by Householder Income Bracket in Middleville
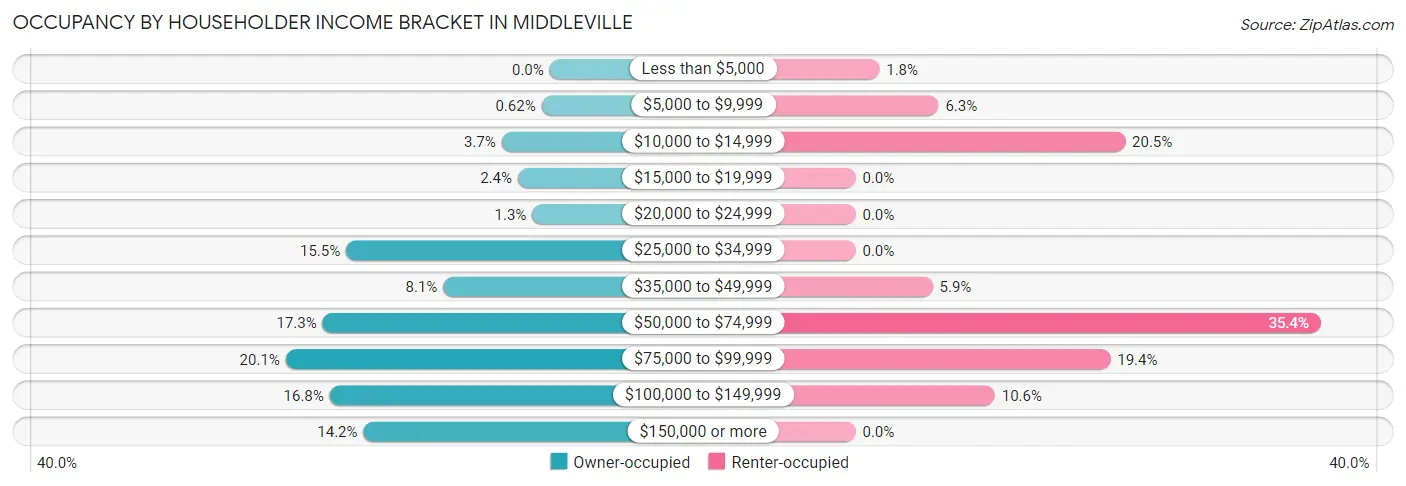
| Income Bracket | Owner-occupied | Renter-occupied |
| Less than $5,000 | 0 (0.0%) | 8 (1.8%) |
| $5,000 to $9,999 | 8 (0.6%) | 28 (6.3%) |
| $10,000 to $14,999 | 47 (3.7%) | 91 (20.5%) |
| $15,000 to $19,999 | 31 (2.4%) | 0 (0.0%) |
| $20,000 to $24,999 | 17 (1.3%) | 0 (0.0%) |
| $25,000 to $34,999 | 199 (15.5%) | 0 (0.0%) |
| $35,000 to $49,999 | 104 (8.1%) | 26 (5.9%) |
| $50,000 to $74,999 | 222 (17.3%) | 157 (35.4%) |
| $75,000 to $99,999 | 258 (20.1%) | 86 (19.4%) |
| $100,000 to $149,999 | 215 (16.8%) | 47 (10.6%) |
| $150,000 or more | 182 (14.2%) | 0 (0.0%) |
| Total | 1,283 (100.0%) | 443 (100.0%) |
Monthly Housing Cost Tiers in Middleville
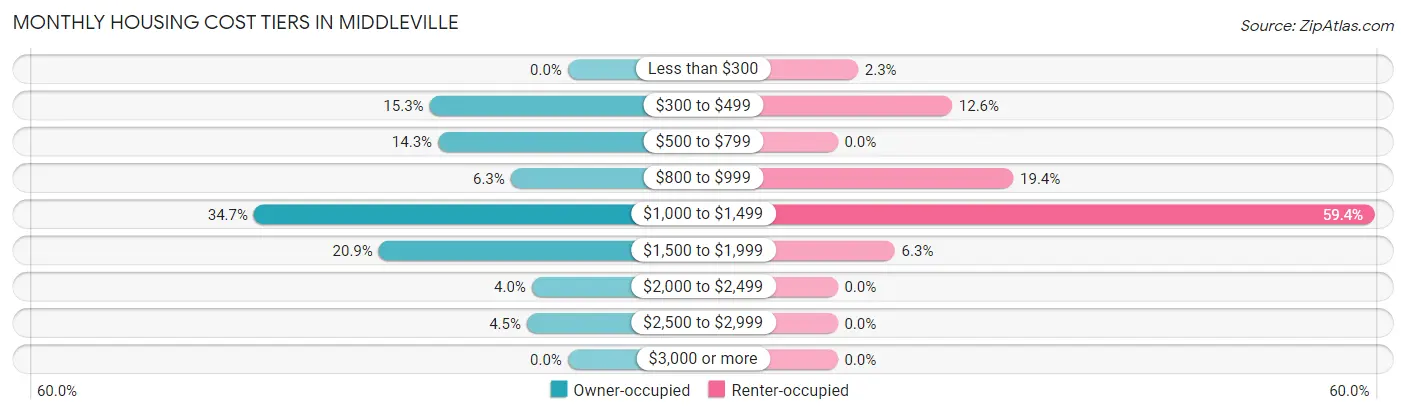
| Monthly Cost | Owner-occupied | Renter-occupied |
| Less than $300 | 0 (0.0%) | 10 (2.3%) |
| $300 to $499 | 196 (15.3%) | 56 (12.6%) |
| $500 to $799 | 184 (14.3%) | 0 (0.0%) |
| $800 to $999 | 81 (6.3%) | 86 (19.4%) |
| $1,000 to $1,499 | 445 (34.7%) | 263 (59.4%) |
| $1,500 to $1,999 | 268 (20.9%) | 28 (6.3%) |
| $2,000 to $2,499 | 51 (4.0%) | 0 (0.0%) |
| $2,500 to $2,999 | 58 (4.5%) | 0 (0.0%) |
| $3,000 or more | 0 (0.0%) | 0 (0.0%) |
| Total | 1,283 (100.0%) | 443 (100.0%) |
Physical Housing Characteristics in Middleville
Housing Structures in Middleville
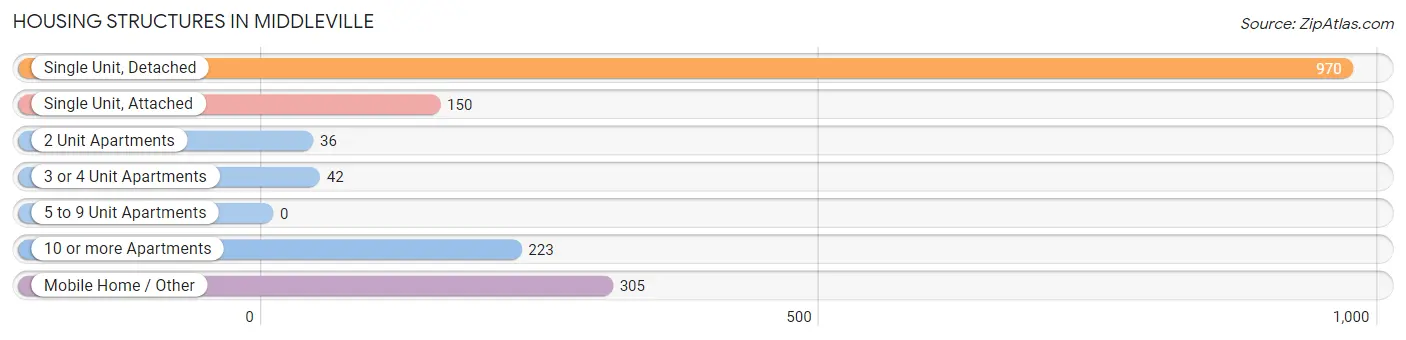
| Structure Type | # Housing Units | % Housing Units |
| Single Unit, Detached | 970 | 56.2% |
| Single Unit, Attached | 150 | 8.7% |
| 2 Unit Apartments | 36 | 2.1% |
| 3 or 4 Unit Apartments | 42 | 2.4% |
| 5 to 9 Unit Apartments | 0 | 0.0% |
| 10 or more Apartments | 223 | 12.9% |
| Mobile Home / Other | 305 | 17.7% |
| Total | 1,726 | 100.0% |
Housing Structures by Occupancy in Middleville
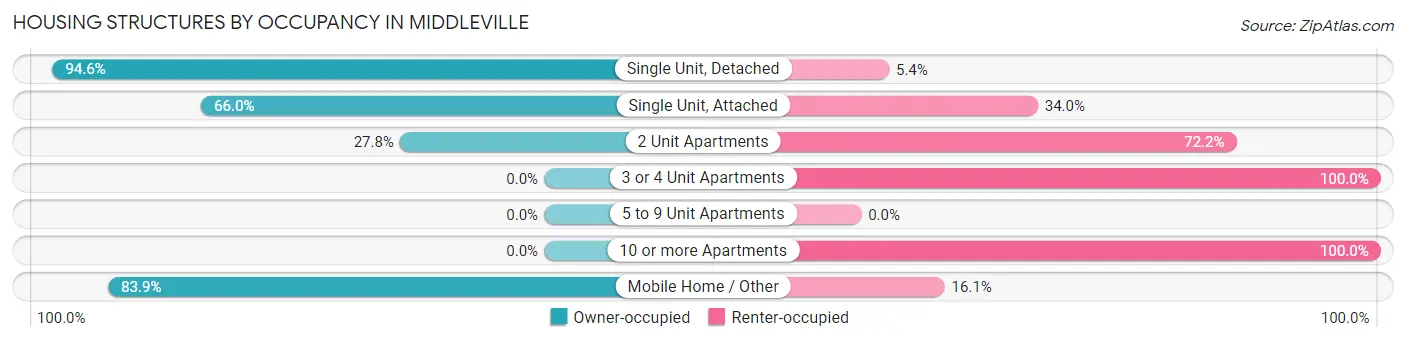
| Structure Type | Owner-occupied | Renter-occupied |
| Single Unit, Detached | 918 (94.6%) | 52 (5.4%) |
| Single Unit, Attached | 99 (66.0%) | 51 (34.0%) |
| 2 Unit Apartments | 10 (27.8%) | 26 (72.2%) |
| 3 or 4 Unit Apartments | 0 (0.0%) | 42 (100.0%) |
| 5 to 9 Unit Apartments | 0 (0.0%) | 0 (0.0%) |
| 10 or more Apartments | 0 (0.0%) | 223 (100.0%) |
| Mobile Home / Other | 256 (83.9%) | 49 (16.1%) |
| Total | 1,283 (74.3%) | 443 (25.7%) |
Housing Structures by Number of Rooms in Middleville
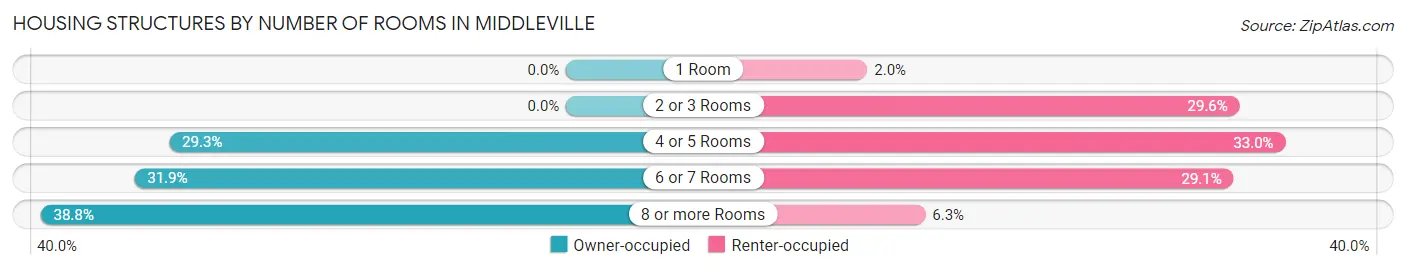
| Number of Rooms | Owner-occupied | Renter-occupied |
| 1 Room | 0 (0.0%) | 9 (2.0%) |
| 2 or 3 Rooms | 0 (0.0%) | 131 (29.6%) |
| 4 or 5 Rooms | 376 (29.3%) | 146 (33.0%) |
| 6 or 7 Rooms | 409 (31.9%) | 129 (29.1%) |
| 8 or more Rooms | 498 (38.8%) | 28 (6.3%) |
| Total | 1,283 (100.0%) | 443 (100.0%) |
Housing Structure by Heating Type in Middleville
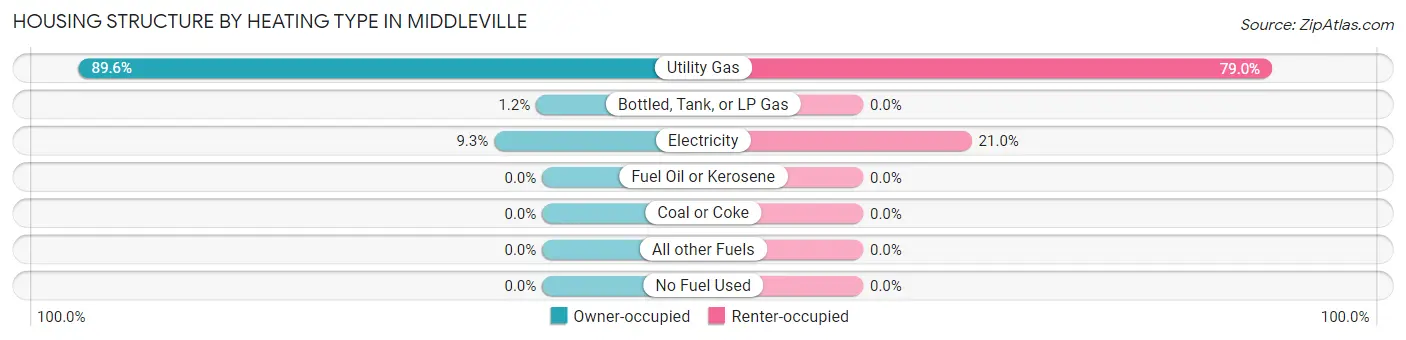
| Heating Type | Owner-occupied | Renter-occupied |
| Utility Gas | 1,149 (89.6%) | 350 (79.0%) |
| Bottled, Tank, or LP Gas | 15 (1.2%) | 0 (0.0%) |
| Electricity | 119 (9.3%) | 93 (21.0%) |
| Fuel Oil or Kerosene | 0 (0.0%) | 0 (0.0%) |
| Coal or Coke | 0 (0.0%) | 0 (0.0%) |
| All other Fuels | 0 (0.0%) | 0 (0.0%) |
| No Fuel Used | 0 (0.0%) | 0 (0.0%) |
| Total | 1,283 (100.0%) | 443 (100.0%) |
Household Vehicle Usage in Middleville
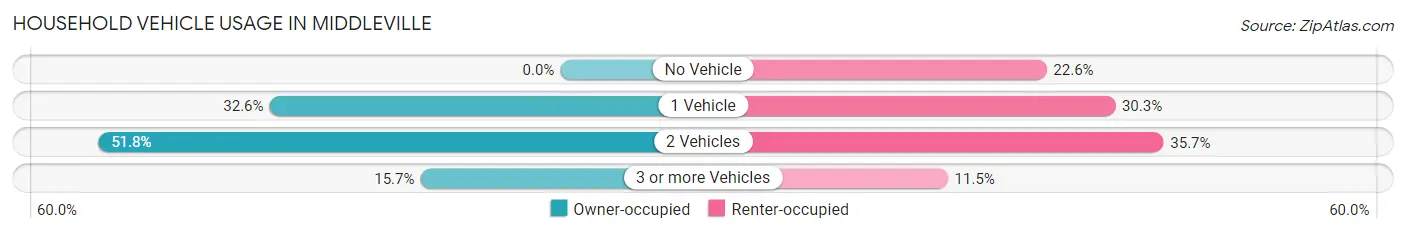
| Vehicles per Household | Owner-occupied | Renter-occupied |
| No Vehicle | 0 (0.0%) | 100 (22.6%) |
| 1 Vehicle | 418 (32.6%) | 134 (30.2%) |
| 2 Vehicles | 664 (51.7%) | 158 (35.7%) |
| 3 or more Vehicles | 201 (15.7%) | 51 (11.5%) |
| Total | 1,283 (100.0%) | 443 (100.0%) |
Real Estate & Mortgages in Middleville
Real Estate and Mortgage Overview in Middleville
| Characteristic | Without Mortgage | With Mortgage |
| Housing Units | 258 | 1,025 |
| Median Property Value | $196,400 | $178,700 |
| Median Household Income | $44,444 | $182 |
| Monthly Housing Costs | $641 | $0 |
| Real Estate Taxes | $2,538 | $205 |
Property Value by Mortgage Status in Middleville
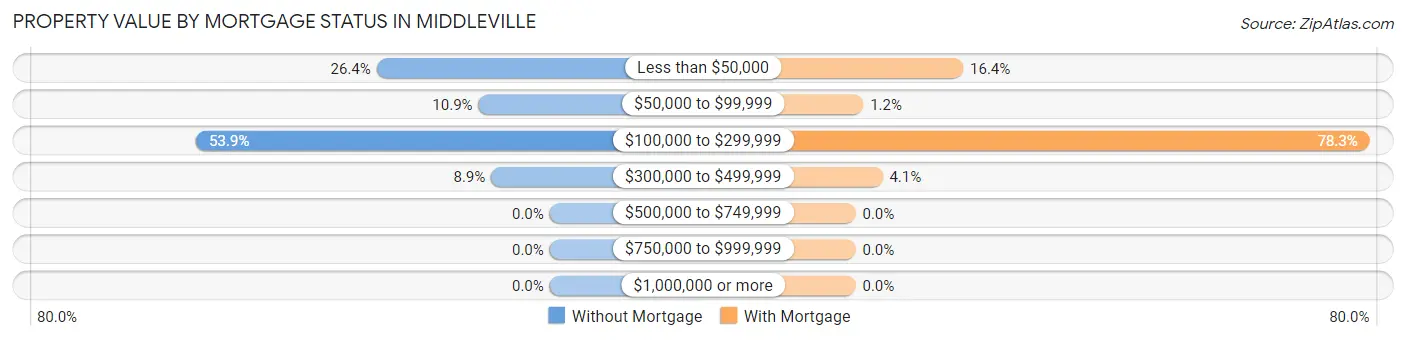
| Property Value | Without Mortgage | With Mortgage |
| Less than $50,000 | 68 (26.4%) | 168 (16.4%) |
| $50,000 to $99,999 | 28 (10.8%) | 12 (1.2%) |
| $100,000 to $299,999 | 139 (53.9%) | 803 (78.3%) |
| $300,000 to $499,999 | 23 (8.9%) | 42 (4.1%) |
| $500,000 to $749,999 | 0 (0.0%) | 0 (0.0%) |
| $750,000 to $999,999 | 0 (0.0%) | 0 (0.0%) |
| $1,000,000 or more | 0 (0.0%) | 0 (0.0%) |
| Total | 258 (100.0%) | 1,025 (100.0%) |
Household Income by Mortgage Status in Middleville
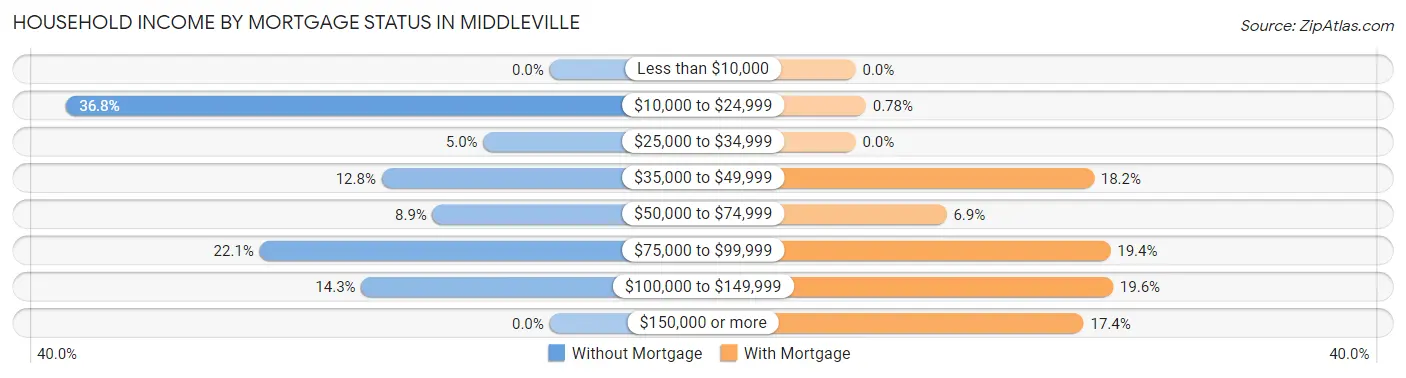
| Household Income | Without Mortgage | With Mortgage |
| Less than $10,000 | 0 (0.0%) | 0 (0.0%) |
| $10,000 to $24,999 | 95 (36.8%) | 8 (0.8%) |
| $25,000 to $34,999 | 13 (5.0%) | 0 (0.0%) |
| $35,000 to $49,999 | 33 (12.8%) | 186 (18.1%) |
| $50,000 to $74,999 | 23 (8.9%) | 71 (6.9%) |
| $75,000 to $99,999 | 57 (22.1%) | 199 (19.4%) |
| $100,000 to $149,999 | 37 (14.3%) | 201 (19.6%) |
| $150,000 or more | 0 (0.0%) | 178 (17.4%) |
| Total | 258 (100.0%) | 1,025 (100.0%) |
Property Value to Household Income Ratio in Middleville
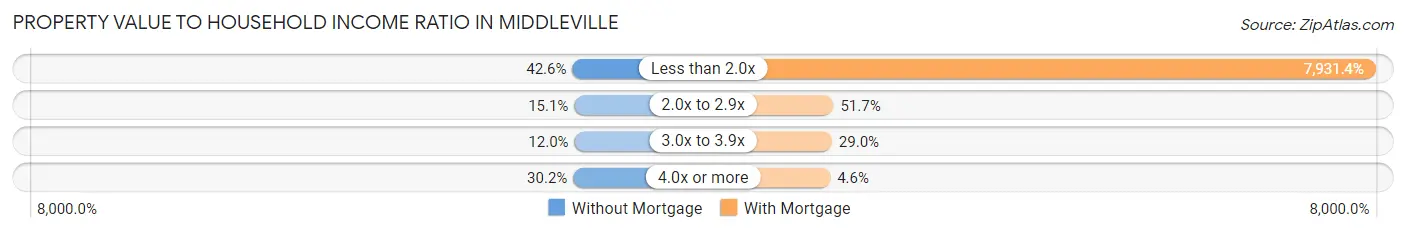
| Value-to-Income Ratio | Without Mortgage | With Mortgage |
| Less than 2.0x | 110 (42.6%) | 81,297 (7,931.4%) |
| 2.0x to 2.9x | 39 (15.1%) | 530 (51.7%) |
| 3.0x to 3.9x | 31 (12.0%) | 297 (29.0%) |
| 4.0x or more | 78 (30.2%) | 47 (4.6%) |
| Total | 258 (100.0%) | 1,025 (100.0%) |
Real Estate Taxes by Mortgage Status in Middleville
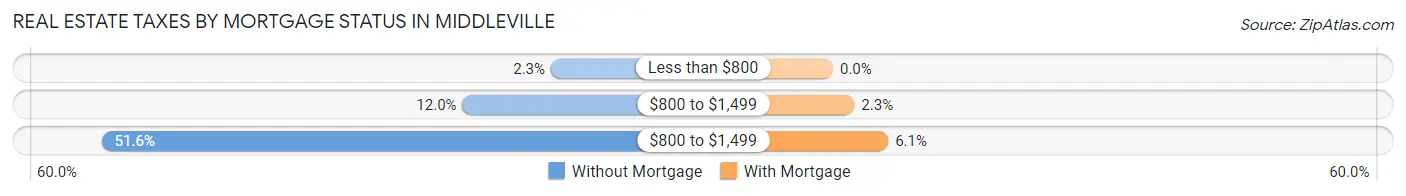
| Property Taxes | Without Mortgage | With Mortgage |
| Less than $800 | 6 (2.3%) | 0 (0.0%) |
| $800 to $1,499 | 31 (12.0%) | 24 (2.3%) |
| $800 to $1,499 | 133 (51.5%) | 62 (6.0%) |
| Total | 258 (100.0%) | 1,025 (100.0%) |
Health & Disability in Middleville
Health Insurance Coverage by Age in Middleville
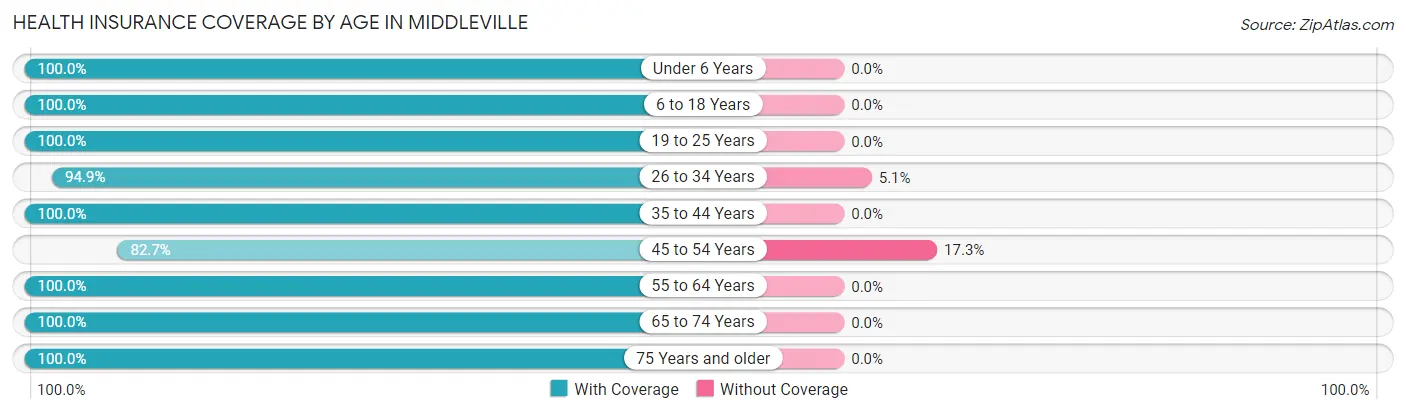
| Age Bracket | With Coverage | Without Coverage |
| Under 6 Years | 552 (100.0%) | 0 (0.0%) |
| 6 to 18 Years | 965 (100.0%) | 0 (0.0%) |
| 19 to 25 Years | 286 (100.0%) | 0 (0.0%) |
| 26 to 34 Years | 481 (94.9%) | 26 (5.1%) |
| 35 to 44 Years | 722 (100.0%) | 0 (0.0%) |
| 45 to 54 Years | 377 (82.7%) | 79 (17.3%) |
| 55 to 64 Years | 392 (100.0%) | 0 (0.0%) |
| 65 to 74 Years | 171 (100.0%) | 0 (0.0%) |
| 75 Years and older | 197 (100.0%) | 0 (0.0%) |
| Total | 4,143 (97.5%) | 105 (2.5%) |
Health Insurance Coverage by Citizenship Status in Middleville

| Citizenship Status | With Coverage | Without Coverage |
| Native Born | 552 (100.0%) | 0 (0.0%) |
| Foreign Born, Citizen | 965 (100.0%) | 0 (0.0%) |
| Foreign Born, not a Citizen | 286 (100.0%) | 0 (0.0%) |
Health Insurance Coverage by Household Income in Middleville
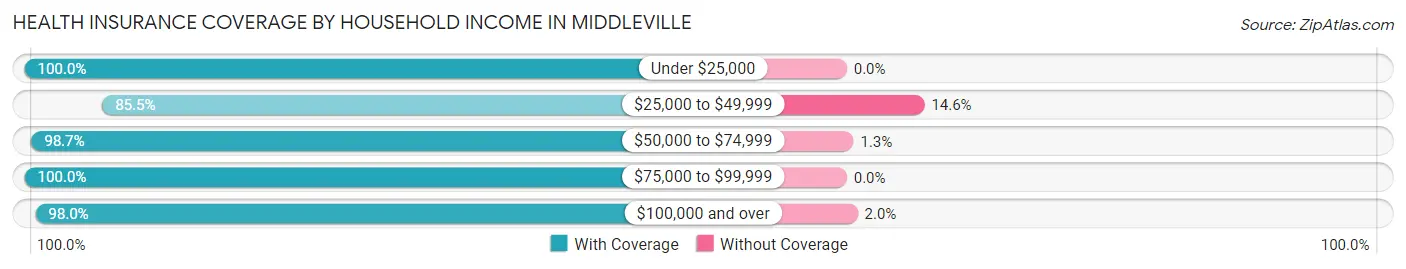
| Household Income | With Coverage | Without Coverage |
| Under $25,000 | 363 (100.0%) | 0 (0.0%) |
| $25,000 to $49,999 | 376 (85.5%) | 64 (14.5%) |
| $50,000 to $74,999 | 863 (98.7%) | 11 (1.3%) |
| $75,000 to $99,999 | 1,084 (100.0%) | 0 (0.0%) |
| $100,000 and over | 1,446 (98.0%) | 30 (2.0%) |
Public vs Private Health Insurance Coverage by Age in Middleville
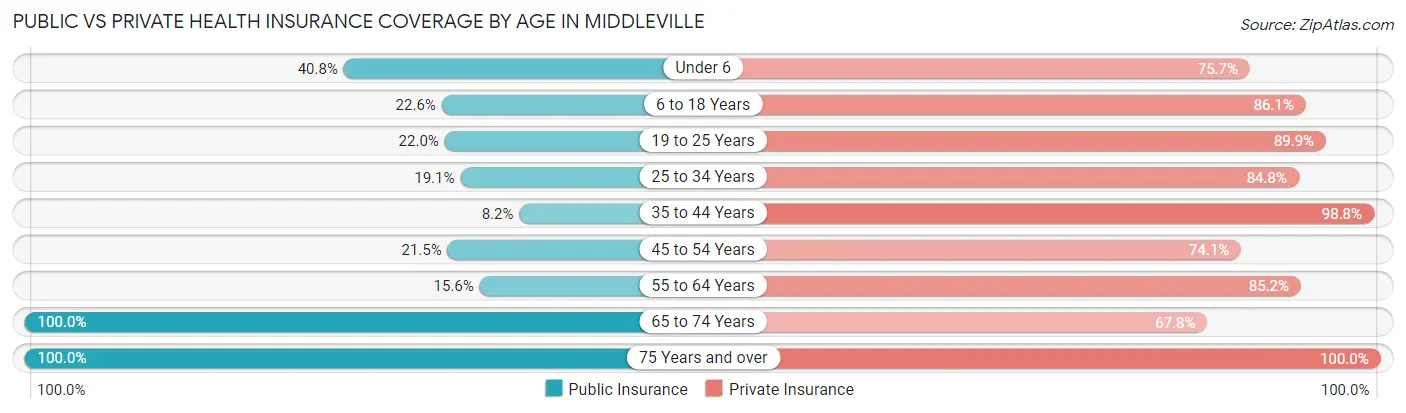
| Age Bracket | Public Insurance | Private Insurance |
| Under 6 | 225 (40.8%) | 418 (75.7%) |
| 6 to 18 Years | 218 (22.6%) | 831 (86.1%) |
| 19 to 25 Years | 63 (22.0%) | 257 (89.9%) |
| 25 to 34 Years | 97 (19.1%) | 430 (84.8%) |
| 35 to 44 Years | 59 (8.2%) | 713 (98.8%) |
| 45 to 54 Years | 98 (21.5%) | 338 (74.1%) |
| 55 to 64 Years | 61 (15.6%) | 334 (85.2%) |
| 65 to 74 Years | 171 (100.0%) | 116 (67.8%) |
| 75 Years and over | 197 (100.0%) | 197 (100.0%) |
| Total | 1,189 (28.0%) | 3,634 (85.6%) |
Disability Status by Sex by Age in Middleville
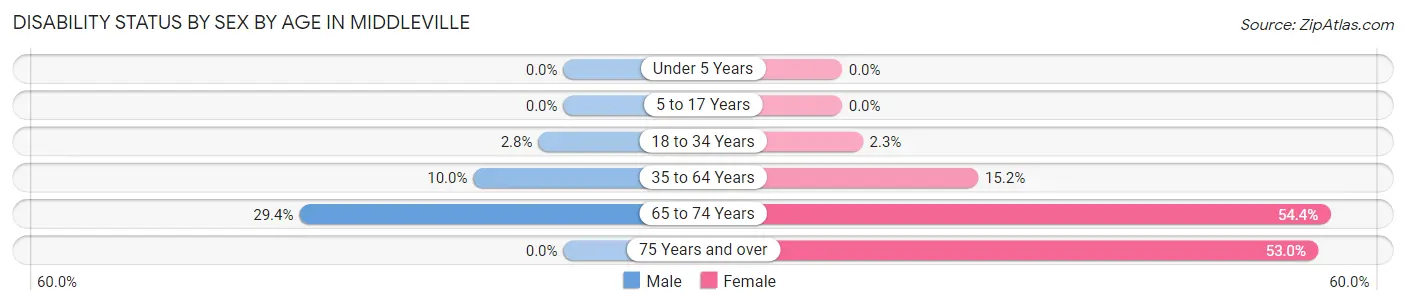
| Age Bracket | Male | Female |
| Under 5 Years | 0 (0.0%) | 0 (0.0%) |
| 5 to 17 Years | 0 (0.0%) | 0 (0.0%) |
| 18 to 34 Years | 13 (2.8%) | 10 (2.3%) |
| 35 to 64 Years | 94 (10.0%) | 96 (15.2%) |
| 65 to 74 Years | 20 (29.4%) | 56 (54.4%) |
| 75 Years and over | 0 (0.0%) | 88 (53.0%) |
Disability Class by Sex by Age in Middleville
Disability Class: Hearing Difficulty
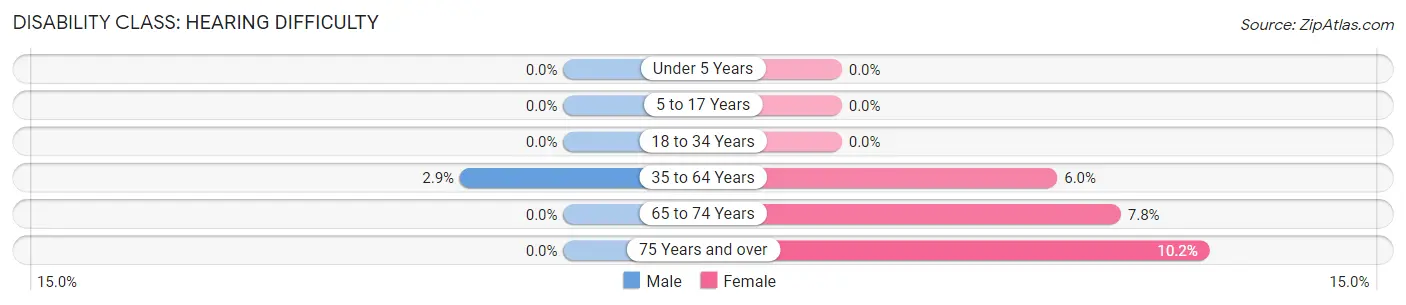
| Age Bracket | Male | Female |
| Under 5 Years | 0 (0.0%) | 0 (0.0%) |
| 5 to 17 Years | 0 (0.0%) | 0 (0.0%) |
| 18 to 34 Years | 0 (0.0%) | 0 (0.0%) |
| 35 to 64 Years | 27 (2.9%) | 38 (6.0%) |
| 65 to 74 Years | 0 (0.0%) | 8 (7.8%) |
| 75 Years and over | 0 (0.0%) | 17 (10.2%) |
Disability Class: Vision Difficulty
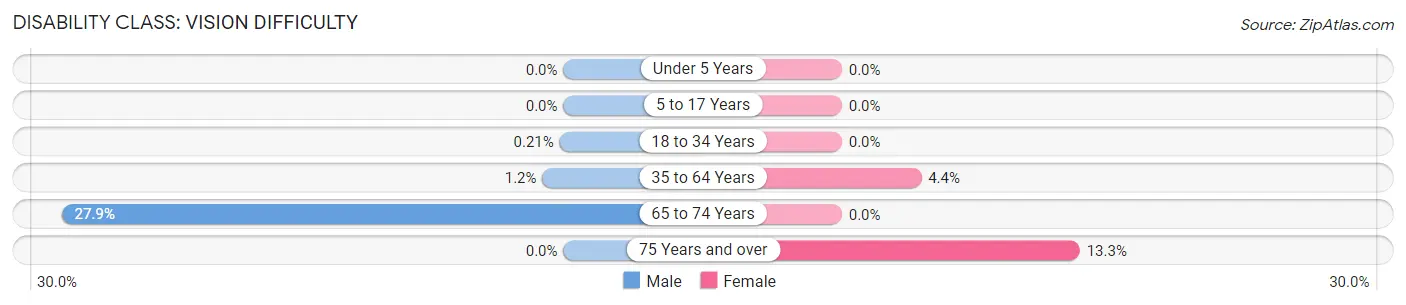
| Age Bracket | Male | Female |
| Under 5 Years | 0 (0.0%) | 0 (0.0%) |
| 5 to 17 Years | 0 (0.0%) | 0 (0.0%) |
| 18 to 34 Years | 1 (0.2%) | 0 (0.0%) |
| 35 to 64 Years | 11 (1.2%) | 28 (4.4%) |
| 65 to 74 Years | 19 (27.9%) | 0 (0.0%) |
| 75 Years and over | 0 (0.0%) | 22 (13.3%) |
Disability Class: Cognitive Difficulty
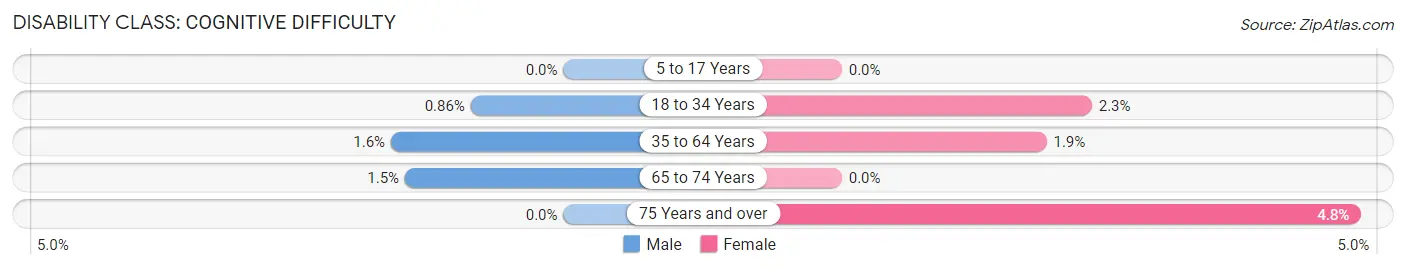
| Age Bracket | Male | Female |
| 5 to 17 Years | 0 (0.0%) | 0 (0.0%) |
| 18 to 34 Years | 4 (0.9%) | 10 (2.3%) |
| 35 to 64 Years | 15 (1.6%) | 12 (1.9%) |
| 65 to 74 Years | 1 (1.5%) | 0 (0.0%) |
| 75 Years and over | 0 (0.0%) | 8 (4.8%) |
Disability Class: Ambulatory Difficulty
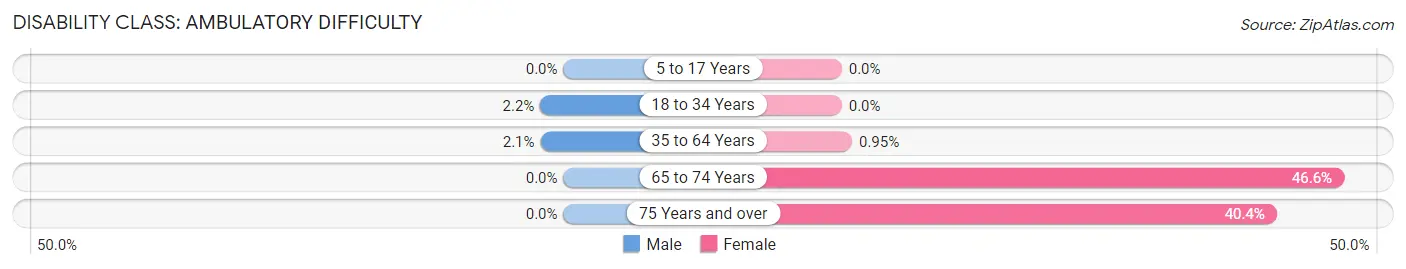
| Age Bracket | Male | Female |
| 5 to 17 Years | 0 (0.0%) | 0 (0.0%) |
| 18 to 34 Years | 10 (2.1%) | 0 (0.0%) |
| 35 to 64 Years | 20 (2.1%) | 6 (0.9%) |
| 65 to 74 Years | 0 (0.0%) | 48 (46.6%) |
| 75 Years and over | 0 (0.0%) | 67 (40.4%) |
Disability Class: Self-Care Difficulty
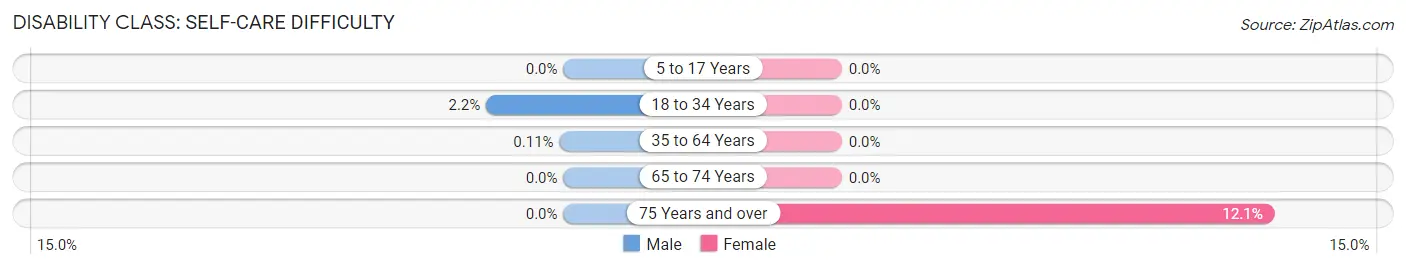
| Age Bracket | Male | Female |
| 5 to 17 Years | 0 (0.0%) | 0 (0.0%) |
| 18 to 34 Years | 10 (2.1%) | 0 (0.0%) |
| 35 to 64 Years | 1 (0.1%) | 0 (0.0%) |
| 65 to 74 Years | 0 (0.0%) | 0 (0.0%) |
| 75 Years and over | 0 (0.0%) | 20 (12.0%) |
Technology Access in Middleville
Computing Device Access in Middleville
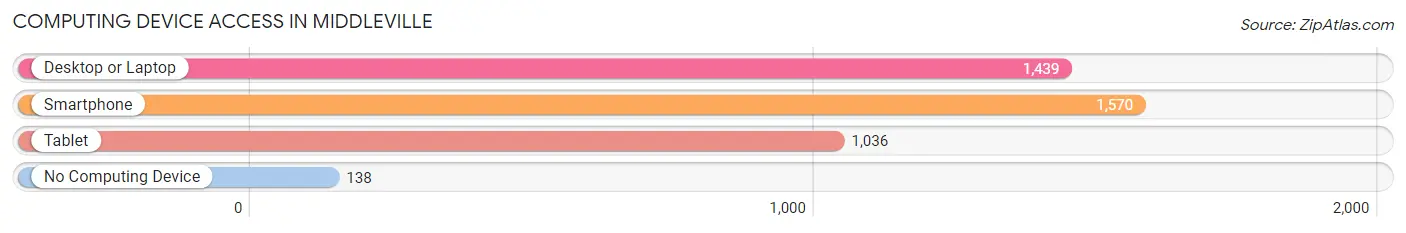
| Device Type | # Households | % Households |
| Desktop or Laptop | 1,439 | 83.4% |
| Smartphone | 1,570 | 91.0% |
| Tablet | 1,036 | 60.0% |
| No Computing Device | 138 | 8.0% |
| Total | 1,726 | 100.0% |
Internet Access in Middleville
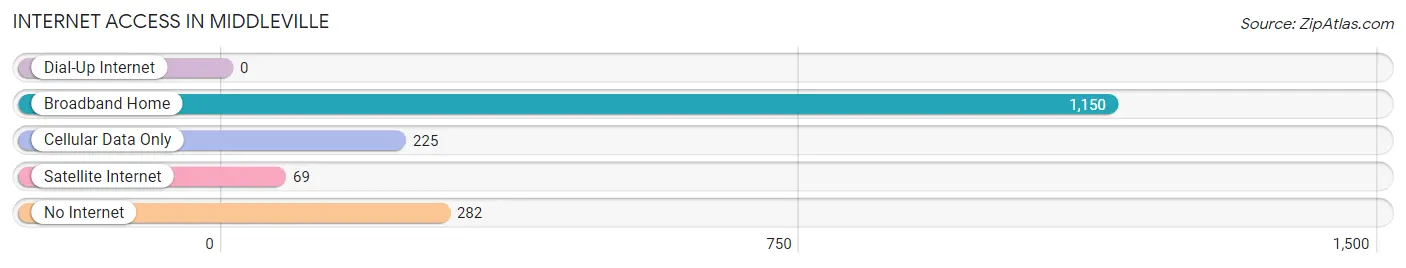
| Internet Type | # Households | % Households |
| Dial-Up Internet | 0 | 0.0% |
| Broadband Home | 1,150 | 66.6% |
| Cellular Data Only | 225 | 13.0% |
| Satellite Internet | 69 | 4.0% |
| No Internet | 282 | 16.3% |
| Total | 1,726 | 100.0% |
Middleville Summary
History
The small village of Middleville, Michigan is located in Barry County, in the southwestern part of the state. The village was first settled in 1836 by a group of settlers from New York. The village was originally known as “Middleville Center”, and was later shortened to “Middleville”. The village was incorporated in 1867.
The village was named after the Middleville family, who were among the first settlers in the area. The family owned a large amount of land in the area, and the village was built around their homestead. The family also owned a sawmill, which was the first industry in the village.
The village grew slowly over the years, and by the early 1900s, it had a population of around 500 people. The village was home to a variety of businesses, including a general store, a blacksmith shop, a hotel, and a post office.
The village was also home to a number of churches, including the First Congregational Church, which was founded in 1867. The church is still active today, and is the oldest church in the village.
The village was also home to a number of schools, including the Middleville High School, which was founded in 1876. The school is still active today, and is the oldest school in the village.
The village was also home to a number of factories, including a furniture factory, a canning factory, and a brickyard. These factories provided employment for many of the villagers, and helped to make the village a prosperous place.
The village was also home to a number of recreational activities, including a golf course, a swimming pool, and a baseball field. The village also had a movie theater, which was a popular destination for the villagers.
The village was also home to a number of cultural events, including the Middleville Music Festival, which was held annually from the late 1800s until the early 1900s. The festival was a popular event, and attracted people from all over the state.
Geography
Middleville is located in Barry County, in the southwestern part of the state. The village is situated on the banks of the Thornapple River, and is surrounded by rolling hills and farmland. The village is located about 25 miles from Grand Rapids, and about 50 miles from Kalamazoo.
The village is located in a rural area, and is surrounded by small towns and villages. The nearest major city is Lansing, which is about 50 miles away.
The village is located in a temperate climate, with warm summers and cold winters. The average temperature in the summer is around 75 degrees Fahrenheit, and the average temperature in the winter is around 25 degrees Fahrenheit.
Economy
The economy of Middleville is largely based on agriculture and tourism. The village is home to a number of farms, which produce a variety of crops, including corn, soybeans, and wheat. The village is also home to a number of wineries, which produce a variety of wines.
The village is also home to a number of small businesses, including restaurants, shops, and other services. The village is also home to a number of bed and breakfasts, which attract tourists from all over the state.
The village is also home to a number of manufacturing companies, which produce a variety of products, including furniture, clothing, and electronics. The village is also home to a number of technology companies, which produce a variety of software and hardware products.
Demographics
The population of Middleville was 1,845 in the 2010 census. The population is largely white, with a small percentage of African Americans, Hispanics, and Asians. The median age of the population is 42.7 years, and the median household income is $45,845.
The village is home to a number of churches, including the First Congregational Church, which was founded in 1867. The village is also home to a number of schools, including the Middleville High School, which was founded in 1876.
Conclusion
Middleville is a small village located in Barry County, in the southwestern part of the state. The village was first settled in 1836, and was incorporated in 1867. The village is home to a number of businesses, churches, schools, and recreational activities. The economy of the village is largely based on agriculture and tourism. The population of the village is largely white, with a small percentage of African Americans, Hispanics, and Asians. The median age of the population is 42.7 years, and the median household income is $45,845.
Common Questions
What is Per Capita Income in Middleville?
Per Capita income in Middleville is $31,308.
What is the Median Family Income in Middleville?
Median Family Income in Middleville is $94,342.
What is the Median Household income in Middleville?
Median Household Income in Middleville is $67,759.
What is Income or Wage Gap in Middleville?
Income or Wage Gap in Middleville is 19.4%.
Women in Middleville earn 80.6 cents for every dollar earned by a man.
What is Inequality or Gini Index in Middleville?
Inequality or Gini Index in Middleville is 0.36.
What is the Total Population of Middleville?
Total Population of Middleville is 4,259.
What is the Total Male Population of Middleville?
Total Male Population of Middleville is 2,193.
What is the Total Female Population of Middleville?
Total Female Population of Middleville is 2,066.
What is the Ratio of Males per 100 Females in Middleville?
There are 106.15 Males per 100 Females in Middleville.
What is the Ratio of Females per 100 Males in Middleville?
There are 94.21 Females per 100 Males in Middleville.
What is the Median Population Age in Middleville?
Median Population Age in Middleville is 28.8 Years.
What is the Average Family Size in Middleville
Average Family Size in Middleville is 3.5 People.
What is the Average Household Size in Middleville
Average Household Size in Middleville is 2.5 People.
How Large is the Labor Force in Middleville?
There are 2,259 People in the Labor Forcein in Middleville.
What is the Percentage of People in the Labor Force in Middleville?
77.5% of People are in the Labor Force in Middleville.
What is the Unemployment Rate in Middleville?
Unemployment Rate in Middleville is 0.6%.