Cities with the Highest Percentage of Maltese Population in Michigan
RELATED REPORTS & OPTIONS
Maltese
Michigan
Compare Cities
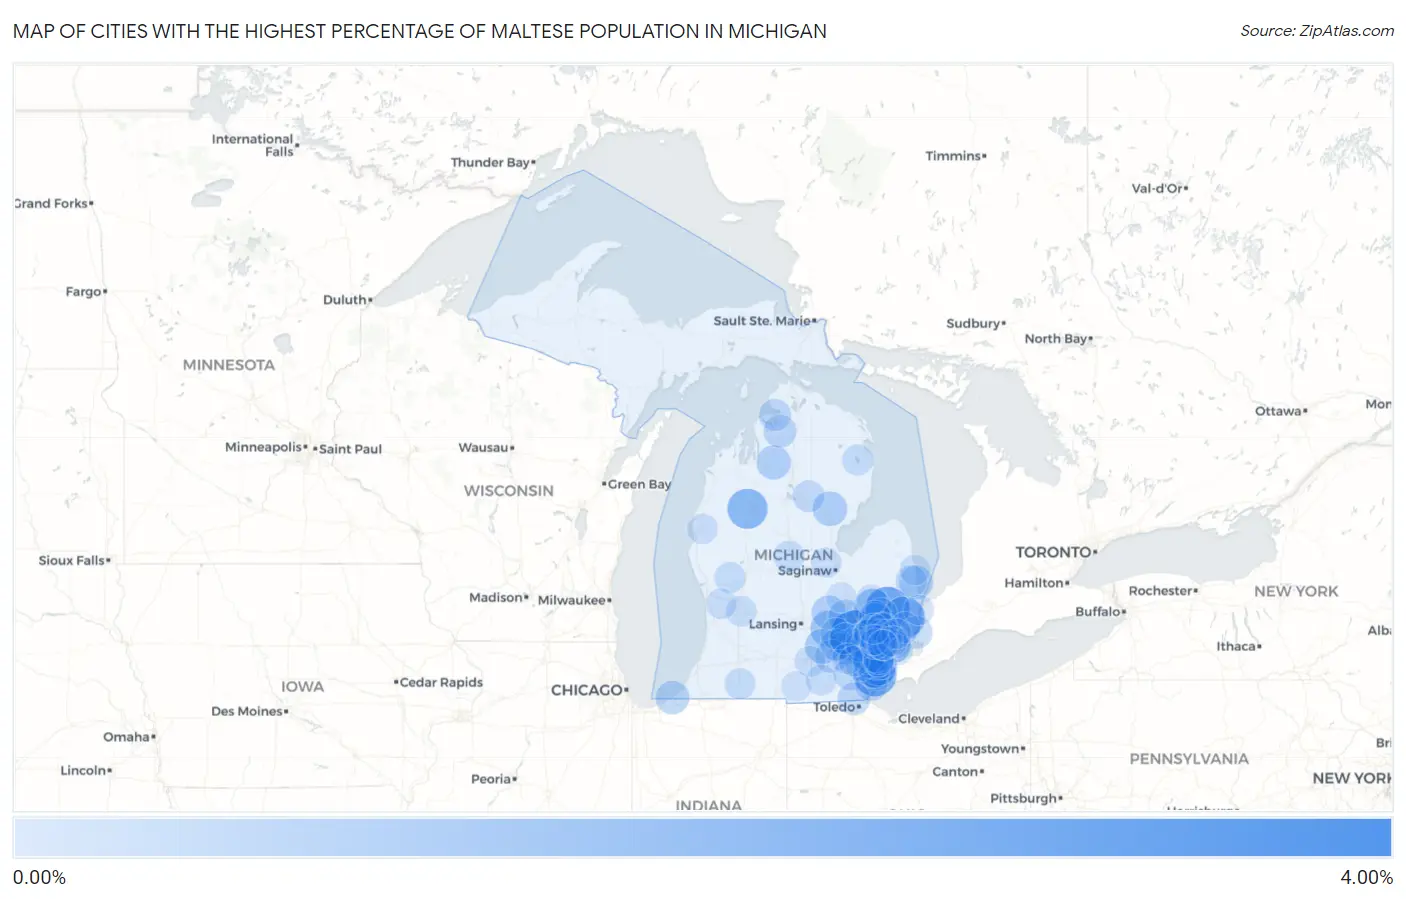
Map of Cities with the Highest Percentage of Maltese Population in Michigan
0.00%
4.00%
Cities with the Highest Percentage of Maltese Population in Michigan
| City | Maltese | vs State | vs National | |
| 1. | Milford | 3.92% | 0.13%(+3.79)#1 | 0.012%(+3.91)#7 |
| 2. | Almont | 2.80% | 0.13%(+2.67)#2 | 0.012%(+2.78)#8 |
| 3. | Rockwood | 2.54% | 0.13%(+2.41)#3 | 0.012%(+2.52)#10 |
| 4. | Richmond | 2.38% | 0.13%(+2.25)#4 | 0.012%(+2.36)#12 |
| 5. | Wedgewood | 2.00% | 0.13%(+1.87)#5 | 0.012%(+1.99)#15 |
| 6. | Metamora | 1.45% | 0.13%(+1.33)#6 | 0.012%(+1.44)#24 |
| 7. | Riverview | 1.33% | 0.13%(+1.20)#7 | 0.012%(+1.32)#28 |
| 8. | Garden City | 1.31% | 0.13%(+1.18)#8 | 0.012%(+1.30)#29 |
| 9. | Fowlerville | 1.29% | 0.13%(+1.16)#9 | 0.012%(+1.28)#30 |
| 10. | Woodhaven | 1.17% | 0.13%(+1.04)#10 | 0.012%(+1.15)#32 |
| 11. | Stockbridge | 0.95% | 0.13%(+0.825)#11 | 0.012%(+0.941)#37 |
| 12. | Gibraltar | 0.93% | 0.13%(+0.802)#12 | 0.012%(+0.917)#41 |
| 13. | Skidway Lake | 0.90% | 0.13%(+0.775)#13 | 0.012%(+0.890)#43 |
| 14. | Whitmore Lake | 0.86% | 0.13%(+0.732)#14 | 0.012%(+0.847)#46 |
| 15. | Lake Orion | 0.82% | 0.13%(+0.696)#15 | 0.012%(+0.811)#48 |
| 16. | Manistee Lake | 0.82% | 0.13%(+0.692)#16 | 0.012%(+0.807)#49 |
| 17. | Bancroft | 0.80% | 0.13%(+0.672)#17 | 0.012%(+0.788)#50 |
| 18. | Lexington | 0.75% | 0.13%(+0.625)#18 | 0.012%(+0.740)#54 |
| 19. | Livonia | 0.71% | 0.13%(+0.585)#19 | 0.012%(+0.701)#58 |
| 20. | Michiana | 0.70% | 0.13%(+0.574)#20 | 0.012%(+0.689)#60 |
| 21. | Linden | 0.65% | 0.13%(+0.527)#21 | 0.012%(+0.642)#65 |
| 22. | South Lyon | 0.64% | 0.13%(+0.517)#22 | 0.012%(+0.632)#67 |
| 23. | Trenton | 0.61% | 0.13%(+0.480)#23 | 0.012%(+0.596)#77 |
| 24. | Boyne Falls | 0.59% | 0.13%(+0.459)#24 | 0.012%(+0.574)#79 |
| 25. | Southgate | 0.58% | 0.13%(+0.450)#25 | 0.012%(+0.565)#83 |
| 26. | Chelsea | 0.57% | 0.13%(+0.442)#26 | 0.012%(+0.557)#85 |
| 27. | Farmington | 0.56% | 0.13%(+0.430)#27 | 0.012%(+0.545)#87 |
| 28. | Taylor | 0.54% | 0.13%(+0.416)#28 | 0.012%(+0.531)#89 |
| 29. | Plymouth | 0.54% | 0.13%(+0.410)#29 | 0.012%(+0.525)#91 |
| 30. | Algonac | 0.53% | 0.13%(+0.400)#30 | 0.012%(+0.516)#93 |
| 31. | Milan | 0.52% | 0.13%(+0.392)#31 | 0.012%(+0.508)#96 |
| 32. | Lathrup Village | 0.52% | 0.13%(+0.388)#32 | 0.012%(+0.503)#98 |
| 33. | Berkley | 0.51% | 0.13%(+0.387)#33 | 0.012%(+0.502)#99 |
| 34. | Lambertville | 0.50% | 0.13%(+0.370)#34 | 0.012%(+0.485)#104 |
| 35. | Harper Woods | 0.48% | 0.13%(+0.350)#35 | 0.012%(+0.465)#108 |
| 36. | Allen Park | 0.46% | 0.13%(+0.337)#36 | 0.012%(+0.452)#112 |
| 37. | Farmington Hills | 0.46% | 0.13%(+0.333)#37 | 0.012%(+0.448)#114 |
| 38. | Petoskey | 0.44% | 0.13%(+0.316)#38 | 0.012%(+0.431)#118 |
| 39. | Woodland Beach | 0.42% | 0.13%(+0.296)#39 | 0.012%(+0.411)#122 |
| 40. | Wixom | 0.42% | 0.13%(+0.290)#40 | 0.012%(+0.405)#124 |
| 41. | Pinckney | 0.41% | 0.13%(+0.283)#41 | 0.012%(+0.398)#128 |
| 42. | Grosse Pointe Woods | 0.40% | 0.13%(+0.276)#42 | 0.012%(+0.392)#131 |
| 43. | Dearborn | 0.40% | 0.13%(+0.273)#43 | 0.012%(+0.388)#132 |
| 44. | Westland | 0.37% | 0.13%(+0.246)#44 | 0.012%(+0.361)#139 |
| 45. | St Helen | 0.35% | 0.13%(+0.227)#45 | 0.012%(+0.342)#149 |
| 46. | Croswell | 0.34% | 0.13%(+0.216)#46 | 0.012%(+0.331)#153 |
| 47. | Dearborn Heights | 0.34% | 0.13%(+0.208)#47 | 0.012%(+0.324)#156 |
| 48. | Leonard | 0.31% | 0.13%(+0.182)#48 | 0.012%(+0.297)#167 |
| 49. | Belleville | 0.30% | 0.13%(+0.174)#49 | 0.012%(+0.289)#169 |
| 50. | St Clair Shores | 0.30% | 0.13%(+0.171)#50 | 0.012%(+0.286)#171 |
| 51. | Howell | 0.30% | 0.13%(+0.170)#51 | 0.012%(+0.286)#172 |
| 52. | Novi | 0.29% | 0.13%(+0.164)#52 | 0.012%(+0.279)#176 |
| 53. | Sylvan Lake | 0.29% | 0.13%(+0.161)#53 | 0.012%(+0.277)#177 |
| 54. | Wayne | 0.28% | 0.13%(+0.151)#54 | 0.012%(+0.266)#182 |
| 55. | Northville | 0.26% | 0.13%(+0.135)#55 | 0.012%(+0.250)#193 |
| 56. | Romulus | 0.24% | 0.13%(+0.112)#56 | 0.012%(+0.227)#206 |
| 57. | New Baltimore | 0.23% | 0.13%(+0.104)#57 | 0.012%(+0.219)#212 |
| 58. | Oxford | 0.23% | 0.13%(+0.102)#58 | 0.012%(+0.217)#216 |
| 59. | Mount Pleasant | 0.22% | 0.13%(+0.097)#59 | 0.012%(+0.212)#220 |
| 60. | Grant | 0.22% | 0.13%(+0.095)#60 | 0.012%(+0.210)#222 |
| 61. | Hubbard Lake | 0.22% | 0.13%(+0.093)#61 | 0.012%(+0.208)#224 |
| 62. | Keego Harbor | 0.22% | 0.13%(+0.089)#62 | 0.012%(+0.204)#229 |
| 63. | Three Rivers | 0.21% | 0.13%(+0.087)#63 | 0.012%(+0.202)#231 |
| 64. | Brighton | 0.21% | 0.13%(+0.086)#64 | 0.012%(+0.201)#232 |
| 65. | Orchard Lake Village | 0.21% | 0.13%(+0.086)#65 | 0.012%(+0.201)#233 |
| 66. | Royal Oak | 0.21% | 0.13%(+0.081)#66 | 0.012%(+0.196)#238 |
| 67. | Pleasant Ridge | 0.19% | 0.13%(+0.064)#67 | 0.012%(+0.179)#253 |
| 68. | Flat Rock | 0.19% | 0.13%(+0.064)#68 | 0.012%(+0.179)#255 |
| 69. | Jackson | 0.19% | 0.13%(+0.063)#69 | 0.012%(+0.179)#257 |
| 70. | Rochester Hills | 0.19% | 0.13%(+0.063)#70 | 0.012%(+0.178)#258 |
| 71. | Kentwood | 0.18% | 0.13%(+0.054)#71 | 0.012%(+0.169)#261 |
| 72. | Grosse Pointe Farms | 0.18% | 0.13%(+0.052)#72 | 0.012%(+0.167)#262 |
| 73. | Wyandotte | 0.18% | 0.13%(+0.049)#73 | 0.012%(+0.165)#265 |
| 74. | Onsted | 0.17% | 0.13%(+0.047)#74 | 0.012%(+0.162)#272 |
| 75. | Troy | 0.15% | 0.13%(+0.027)#75 | 0.012%(+0.142)#294 |
| 76. | Ann Arbor | 0.14% | 0.13%(+0.015)#76 | 0.012%(+0.131)#308 |
| 77. | Lapeer | 0.13% | 0.13%(+0.005)#77 | 0.012%(+0.120)#322 |
| 78. | Scottville | 0.13% | 0.13%(+0.005)#78 | 0.012%(+0.120)#324 |
| 79. | Port Sanilac | 0.13% | 0.13%(-0.001)#79 | 0.012%(+0.114)#334 |
| 80. | Beverly Hills | 0.12% | 0.13%(-0.004)#80 | 0.012%(+0.111)#337 |
| 81. | Clawson | 0.12% | 0.13%(-0.005)#81 | 0.012%(+0.110)#338 |
| 82. | Sterling Heights | 0.12% | 0.13%(-0.005)#82 | 0.012%(+0.110)#339 |
| 83. | Allendale | 0.12% | 0.13%(-0.009)#83 | 0.012%(+0.107)#345 |
| 84. | Lincoln Park | 0.11% | 0.13%(-0.015)#84 | 0.012%(+0.101)#351 |
| 85. | Freeland | 0.11% | 0.13%(-0.019)#85 | 0.012%(+0.096)#356 |
| 86. | Melvindale | 0.10% | 0.13%(-0.025)#86 | 0.012%(+0.090)#370 |
| 87. | Warren | 0.094% | 0.13%(-0.034)#87 | 0.012%(+0.081)#381 |
| 88. | Hazel Park | 0.093% | 0.13%(-0.035)#88 | 0.012%(+0.080)#385 |
| 89. | Kincheloe | 0.091% | 0.13%(-0.037)#89 | 0.012%(+0.079)#390 |
| 90. | Marysville | 0.090% | 0.13%(-0.037)#90 | 0.012%(+0.078)#394 |
| 91. | Rochester | 0.085% | 0.13%(-0.043)#91 | 0.012%(+0.072)#400 |
| 92. | Ypsilanti | 0.084% | 0.13%(-0.044)#92 | 0.012%(+0.072)#402 |
| 93. | Southfield | 0.081% | 0.13%(-0.046)#93 | 0.012%(+0.069)#409 |
| 94. | Flushing | 0.072% | 0.13%(-0.056)#94 | 0.012%(+0.059)#432 |
| 95. | Roseville | 0.072% | 0.13%(-0.056)#95 | 0.012%(+0.059)#433 |
| 96. | Mount Clemens | 0.070% | 0.13%(-0.058)#96 | 0.012%(+0.058)#438 |
| 97. | Bingham Farms | 0.062% | 0.13%(-0.066)#97 | 0.012%(+0.049)#459 |
| 98. | Auburn Hills | 0.057% | 0.13%(-0.071)#98 | 0.012%(+0.044)#477 |
| 99. | Ferndale | 0.052% | 0.13%(-0.076)#99 | 0.012%(+0.039)#498 |
| 100. | Hillsdale | 0.050% | 0.13%(-0.078)#100 | 0.012%(+0.038)#507 |
Common Questions
What are the Top 10 Cities with the Highest Percentage of Maltese Population in Michigan?
Top 10 Cities with the Highest Percentage of Maltese Population in Michigan are:
#1
3.92%
#2
2.80%
#3
2.54%
#4
2.38%
#5
2.00%
#6
1.45%
#7
1.33%
#8
1.31%
#9
1.29%
#10
1.17%
What city has the Highest Percentage of Maltese Population in Michigan?
Milford has the Highest Percentage of Maltese Population in Michigan with 3.92%.
What is the Percentage of Maltese Population in the State of Michigan?
Percentage of Maltese Population in Michigan is 0.13%.
What is the Percentage of Maltese Population in the United States?
Percentage of Maltese Population in the United States is 0.012%.