Rochester Hills, MI Map & Demographics
Rochester Hills Map
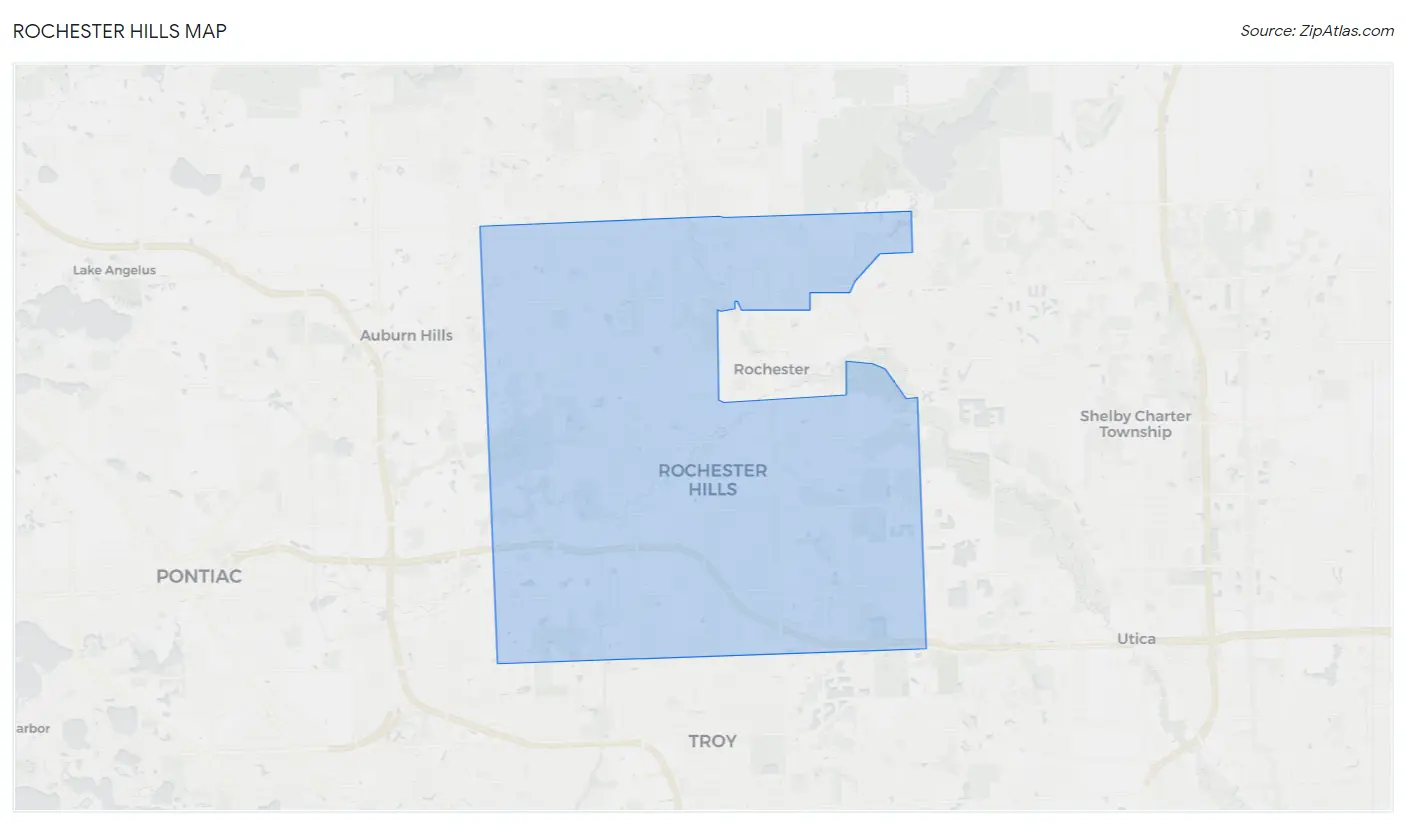
Rochester Hills Overview
$55,343
PER CAPITA INCOME
$138,781
AVG FAMILY INCOME
$115,968
AVG HOUSEHOLD INCOME
56.9%
WAGE / INCOME GAP [ % ]
43.1¢/ $1
WAGE / INCOME GAP [ $ ]
$10,805
FAMILY INCOME DEFICIT
0.41
INEQUALITY / GINI INDEX
76,041
TOTAL POPULATION
36,879
MALE POPULATION
39,162
FEMALE POPULATION
94.17
MALES / 100 FEMALES
106.19
FEMALES / 100 MALES
40.9
MEDIAN AGE
3.1
AVG FAMILY SIZE
2.6
AVG HOUSEHOLD SIZE
39,173
LABOR FORCE [ PEOPLE ]
64.1%
PERCENT IN LABOR FORCE
3.9%
UNEMPLOYMENT RATE
Rochester Hills Area Codes
Income in Rochester Hills
Income Overview in Rochester Hills
Per Capita Income in Rochester Hills is $55,343, while median incomes of families and households are $138,781 and $115,968 respectively.
| Characteristic | Number | Measure |
| Per Capita Income | 76,041 | $55,343 |
| Median Family Income | 20,404 | $138,781 |
| Mean Family Income | 20,404 | $171,917 |
| Median Household Income | 28,988 | $115,968 |
| Mean Household Income | 28,988 | $143,065 |
| Income Deficit | 20,404 | $10,805 |
| Wage / Income Gap (%) | 76,041 | 56.94% |
| Wage / Income Gap ($) | 76,041 | 43.06¢ per $1 |
| Gini / Inequality Index | 76,041 | 0.41 |
Earnings by Sex in Rochester Hills
Average Earnings in Rochester Hills are $60,930, $86,967 for men and $37,448 for women, a difference of 56.9%.
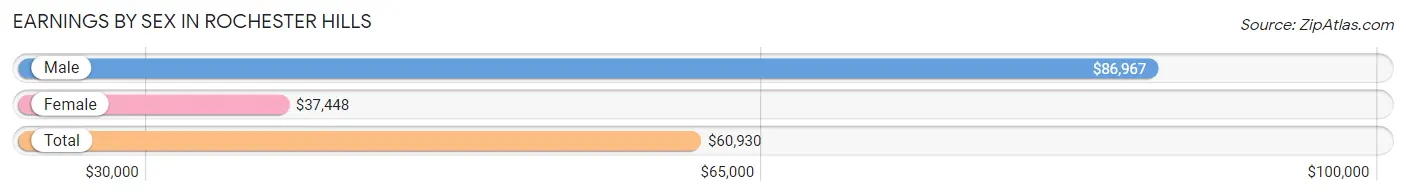
| Sex | Number | Average Earnings |
| Male | 23,028 (55.2%) | $86,967 |
| Female | 18,684 (44.8%) | $37,448 |
| Total | 41,712 (100.0%) | $60,930 |
Earnings by Sex by Income Bracket in Rochester Hills
The most common earnings brackets in Rochester Hills are $100,000+ for men (9,905 | 43.0%) and $100,000+ for women (3,324 | 17.8%).
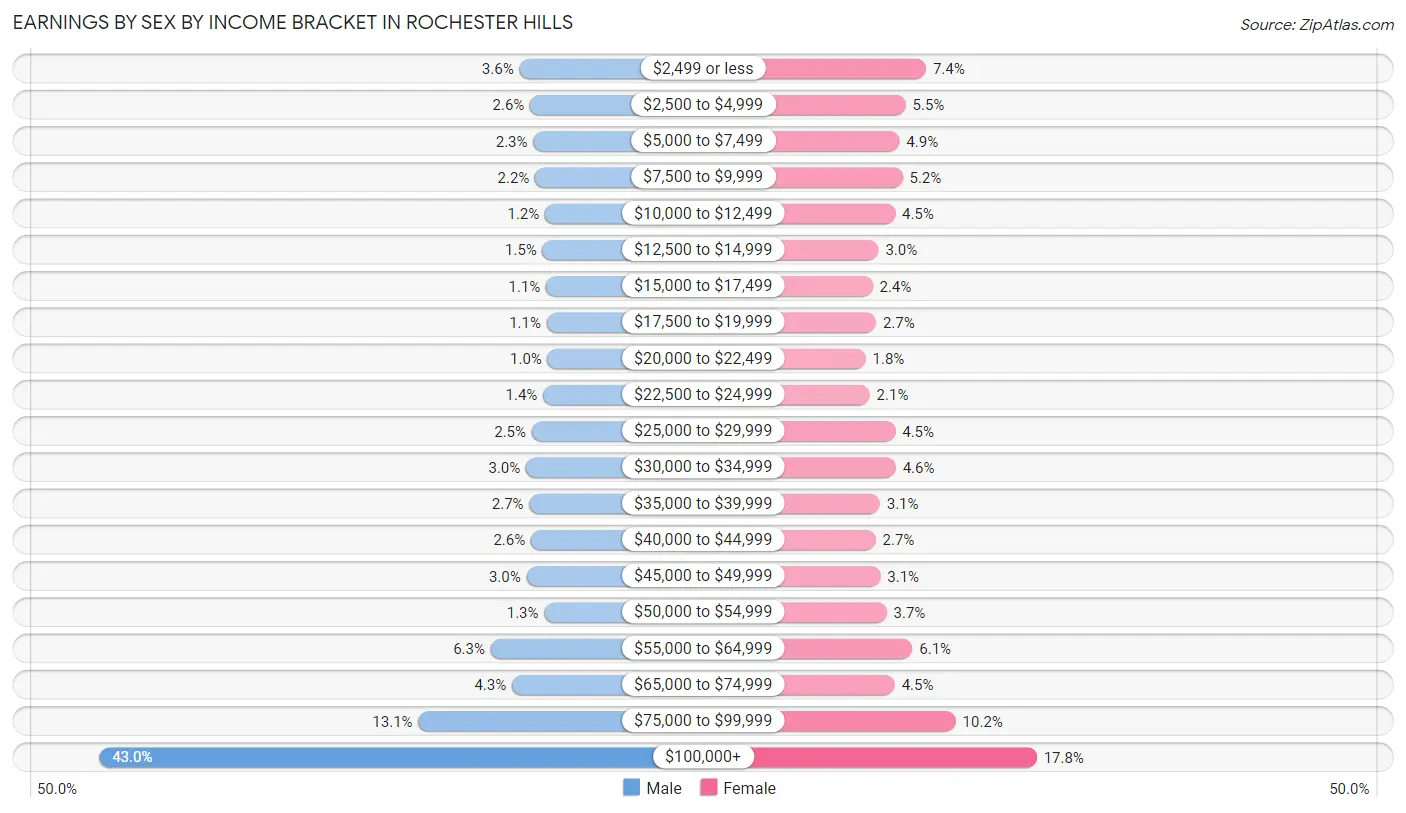
| Income | Male | Female |
| $2,499 or less | 838 (3.6%) | 1,386 (7.4%) |
| $2,500 to $4,999 | 609 (2.6%) | 1,029 (5.5%) |
| $5,000 to $7,499 | 539 (2.3%) | 921 (4.9%) |
| $7,500 to $9,999 | 499 (2.2%) | 976 (5.2%) |
| $10,000 to $12,499 | 286 (1.2%) | 844 (4.5%) |
| $12,500 to $14,999 | 338 (1.5%) | 554 (3.0%) |
| $15,000 to $17,499 | 263 (1.1%) | 451 (2.4%) |
| $17,500 to $19,999 | 248 (1.1%) | 511 (2.7%) |
| $20,000 to $22,499 | 231 (1.0%) | 329 (1.8%) |
| $22,500 to $24,999 | 327 (1.4%) | 399 (2.1%) |
| $25,000 to $29,999 | 572 (2.5%) | 849 (4.5%) |
| $30,000 to $34,999 | 696 (3.0%) | 856 (4.6%) |
| $35,000 to $39,999 | 624 (2.7%) | 578 (3.1%) |
| $40,000 to $44,999 | 590 (2.6%) | 504 (2.7%) |
| $45,000 to $49,999 | 686 (3.0%) | 586 (3.1%) |
| $50,000 to $54,999 | 301 (1.3%) | 696 (3.7%) |
| $55,000 to $64,999 | 1,457 (6.3%) | 1,147 (6.1%) |
| $65,000 to $74,999 | 1,000 (4.3%) | 839 (4.5%) |
| $75,000 to $99,999 | 3,019 (13.1%) | 1,905 (10.2%) |
| $100,000+ | 9,905 (43.0%) | 3,324 (17.8%) |
| Total | 23,028 (100.0%) | 18,684 (100.0%) |
Earnings by Sex by Educational Attainment in Rochester Hills
Average earnings in Rochester Hills are $97,965 for men and $50,809 for women, a difference of 48.1%. Men with an educational attainment of graduate degree enjoy the highest average annual earnings of $126,175, while those with high school diploma education earn the least with $47,240. Women with an educational attainment of graduate degree earn the most with the average annual earnings of $87,582, while those with less than high school education have the smallest earnings of $10,947.
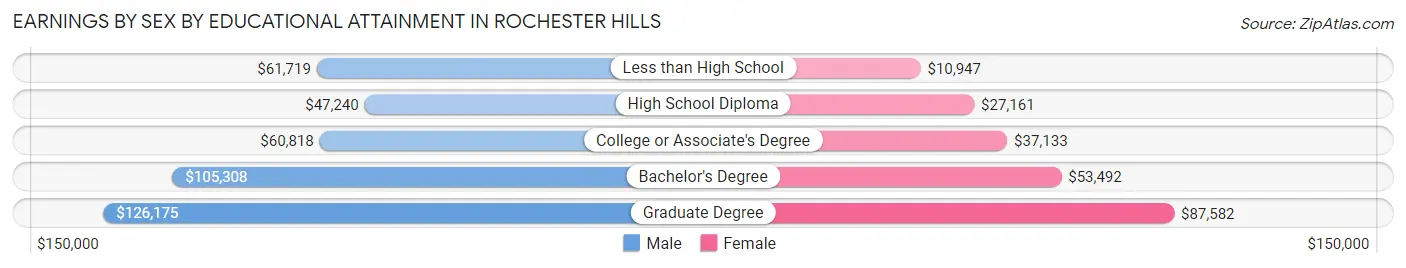
| Educational Attainment | Male Income | Female Income |
| Less than High School | $61,719 | $10,947 |
| High School Diploma | $47,240 | $27,161 |
| College or Associate's Degree | $60,818 | $37,133 |
| Bachelor's Degree | $105,308 | $53,492 |
| Graduate Degree | $126,175 | $87,582 |
| Total | $97,965 | $50,809 |
Family Income in Rochester Hills
Family Income Brackets in Rochester Hills
According to the Rochester Hills family income data, there are 5,876 families falling into the $200,000+ income range, which is the most common income bracket and makes up 28.8% of all families. Conversely, the $10,000 to $14,999 income bracket is the least frequent group with only 61 families (0.3%) belonging to this category.
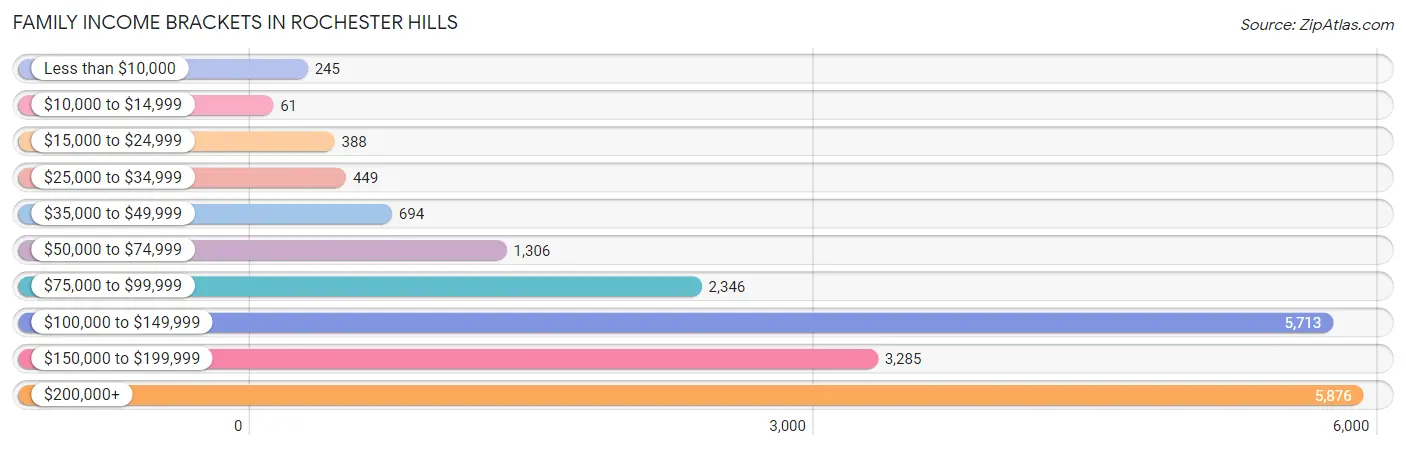
| Income Bracket | # Families | % Families |
| Less than $10,000 | 245 | 1.2% |
| $10,000 to $14,999 | 61 | 0.3% |
| $15,000 to $24,999 | 388 | 1.9% |
| $25,000 to $34,999 | 449 | 2.2% |
| $35,000 to $49,999 | 694 | 3.4% |
| $50,000 to $74,999 | 1,306 | 6.4% |
| $75,000 to $99,999 | 2,346 | 11.5% |
| $100,000 to $149,999 | 5,713 | 28.0% |
| $150,000 to $199,999 | 3,285 | 16.1% |
| $200,000+ | 5,876 | 28.8% |
Family Income by Famaliy Size in Rochester Hills
7+ person families (146 | 0.7%) account for the highest median family income in Rochester Hills with $226,538 per family, while 2-person families (8,666 | 42.5%) have the highest median income of $57,998 per family member.
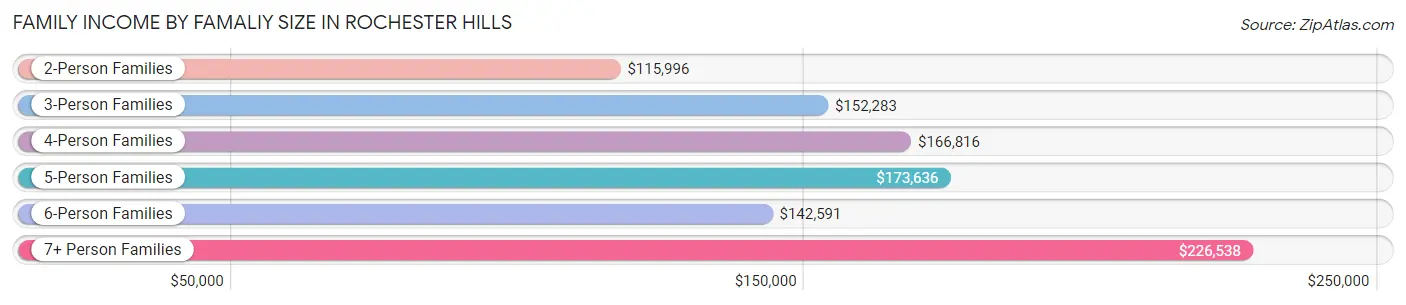
| Income Bracket | # Families | Median Income |
| 2-Person Families | 8,666 (42.5%) | $115,996 |
| 3-Person Families | 4,796 (23.5%) | $152,283 |
| 4-Person Families | 4,613 (22.6%) | $166,816 |
| 5-Person Families | 1,668 (8.2%) | $173,636 |
| 6-Person Families | 515 (2.5%) | $142,591 |
| 7+ Person Families | 146 (0.7%) | $226,538 |
| Total | 20,404 (100.0%) | $138,781 |
Family Income by Number of Earners in Rochester Hills
The median family income in Rochester Hills is $138,781, with families comprising 3+ earners (2,804) having the highest median family income of $189,600, while families with no earners (2,612) have the lowest median family income of $93,045, accounting for 13.7% and 12.8% of families, respectively.
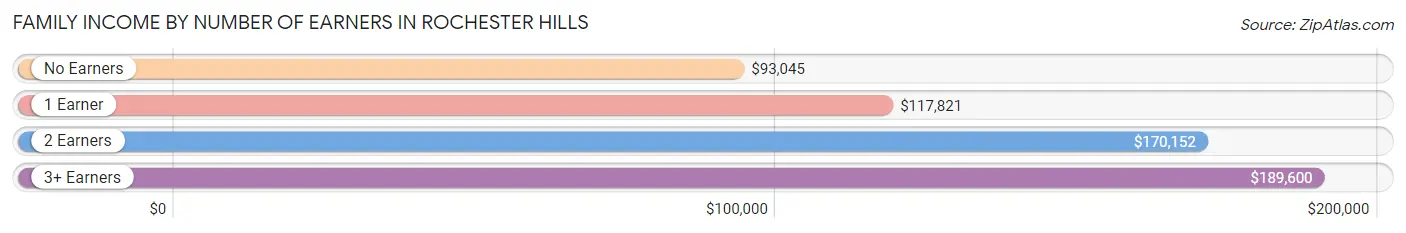
| Number of Earners | # Families | Median Income |
| No Earners | 2,612 (12.8%) | $93,045 |
| 1 Earner | 5,897 (28.9%) | $117,821 |
| 2 Earners | 9,091 (44.6%) | $170,152 |
| 3+ Earners | 2,804 (13.7%) | $189,600 |
| Total | 20,404 (100.0%) | $138,781 |
Household Income in Rochester Hills
Household Income Brackets in Rochester Hills
With 6,870 households falling in the category, the $100,000 to $149,999 income range is the most frequent in Rochester Hills, accounting for 23.7% of all households. In contrast, only 522 households (1.8%) fall into the $10,000 to $14,999 income bracket, making it the least populous group.
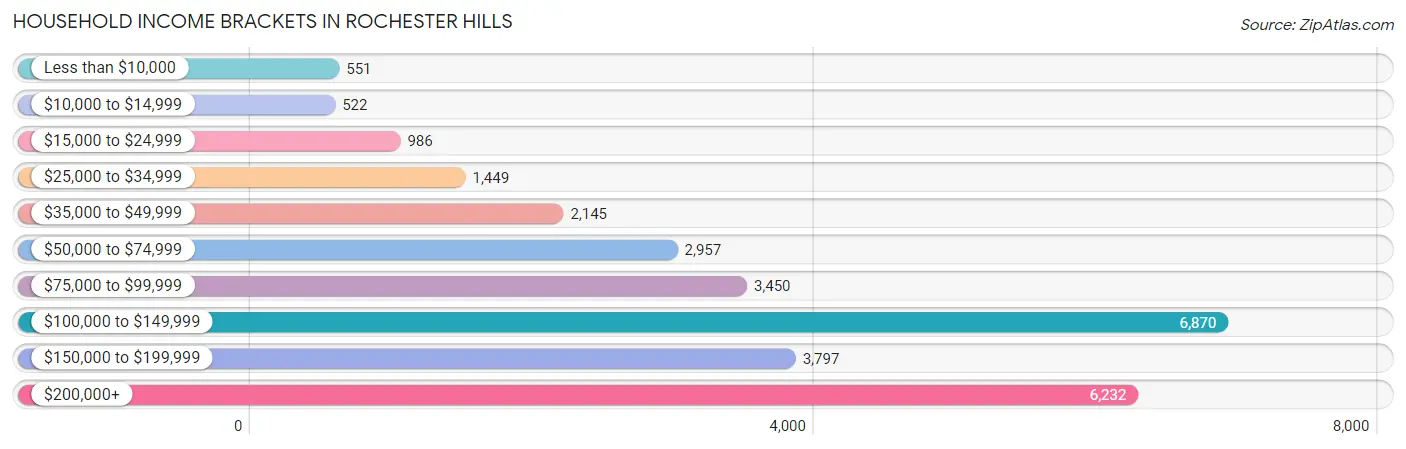
| Income Bracket | # Households | % Households |
| Less than $10,000 | 551 | 1.9% |
| $10,000 to $14,999 | 522 | 1.8% |
| $15,000 to $24,999 | 986 | 3.4% |
| $25,000 to $34,999 | 1,449 | 5.0% |
| $35,000 to $49,999 | 2,145 | 7.4% |
| $50,000 to $74,999 | 2,957 | 10.2% |
| $75,000 to $99,999 | 3,450 | 11.9% |
| $100,000 to $149,999 | 6,870 | 23.7% |
| $150,000 to $199,999 | 3,797 | 13.1% |
| $200,000+ | 6,232 | 21.5% |
Household Income by Householder Age in Rochester Hills
The median household income in Rochester Hills is $115,968, with the highest median household income of $148,093 found in the 45 to 64 years age bracket for the primary householder. A total of 11,014 households (38.0%) fall into this category. Meanwhile, the 15 to 24 years age bracket for the primary householder has the lowest median household income of $68,494, with 506 households (1.8%) in this group.
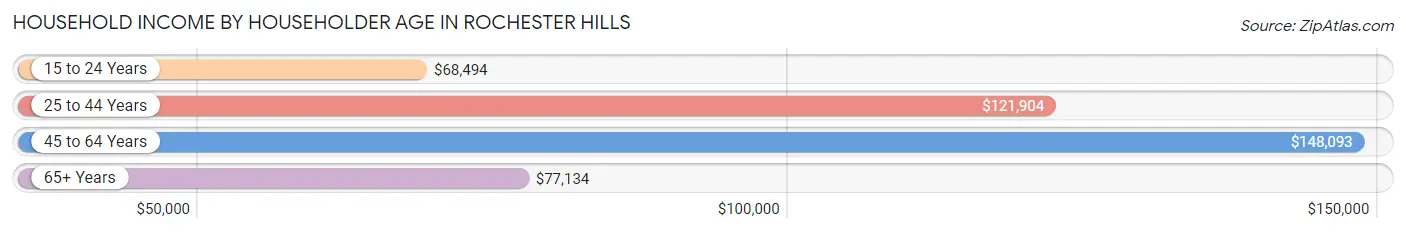
| Income Bracket | # Households | Median Income |
| 15 to 24 Years | 506 (1.8%) | $68,494 |
| 25 to 44 Years | 8,822 (30.4%) | $121,904 |
| 45 to 64 Years | 11,014 (38.0%) | $148,093 |
| 65+ Years | 8,646 (29.8%) | $77,134 |
| Total | 28,988 (100.0%) | $115,968 |
Poverty in Rochester Hills
Income Below Poverty by Sex and Age in Rochester Hills
With 4.1% poverty level for males and 4.6% for females among the residents of Rochester Hills, 6 to 11 year old males and under 5 year old females are the most vulnerable to poverty, with 167 males (6.3%) and 165 females (8.1%) in their respective age groups living below the poverty level.
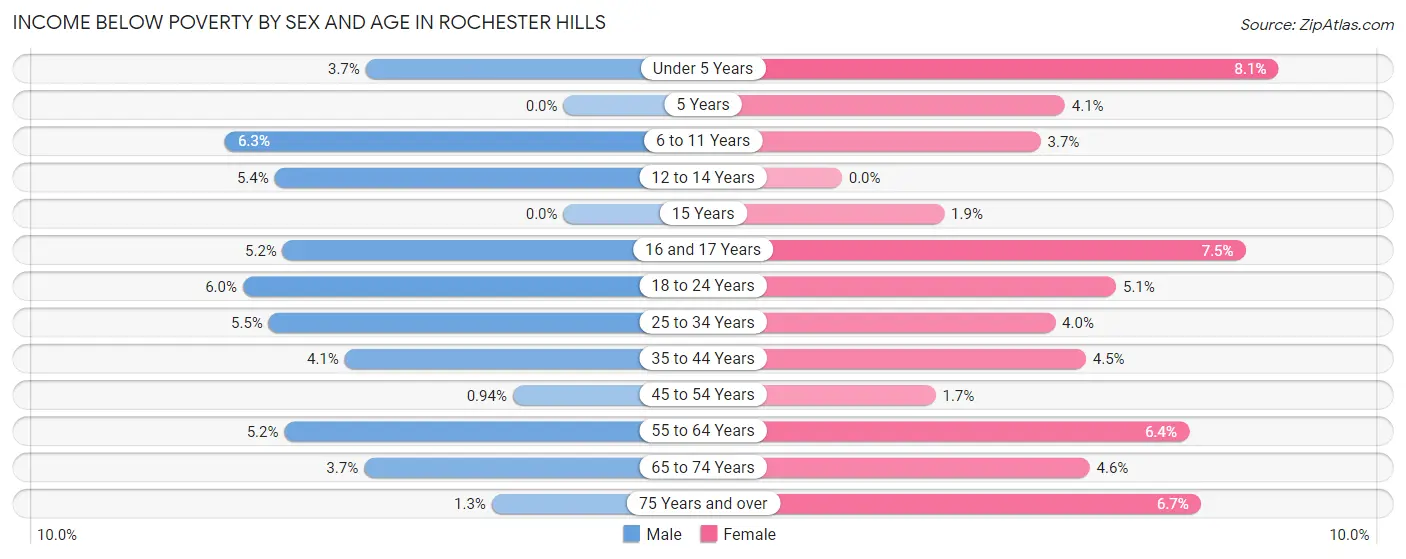
| Age Bracket | Male | Female |
| Under 5 Years | 74 (3.7%) | 165 (8.1%) |
| 5 Years | 0 (0.0%) | 20 (4.1%) |
| 6 to 11 Years | 167 (6.3%) | 111 (3.7%) |
| 12 to 14 Years | 82 (5.4%) | 0 (0.0%) |
| 15 Years | 0 (0.0%) | 12 (1.9%) |
| 16 and 17 Years | 50 (5.2%) | 84 (7.5%) |
| 18 to 24 Years | 168 (5.9%) | 140 (5.1%) |
| 25 to 34 Years | 225 (5.5%) | 138 (4.0%) |
| 35 to 44 Years | 224 (4.1%) | 241 (4.5%) |
| 45 to 54 Years | 46 (0.9%) | 88 (1.7%) |
| 55 to 64 Years | 268 (5.2%) | 314 (6.4%) |
| 65 to 74 Years | 135 (3.7%) | 194 (4.6%) |
| 75 Years and over | 27 (1.3%) | 220 (6.7%) |
| Total | 1,466 (4.1%) | 1,727 (4.6%) |
Income Above Poverty by Sex and Age in Rochester Hills
According to the poverty statistics in Rochester Hills, males aged 5 years and females aged 12 to 14 years are the age groups that are most secure financially, with 100.0% of males and 100.0% of females in these age groups living above the poverty line.
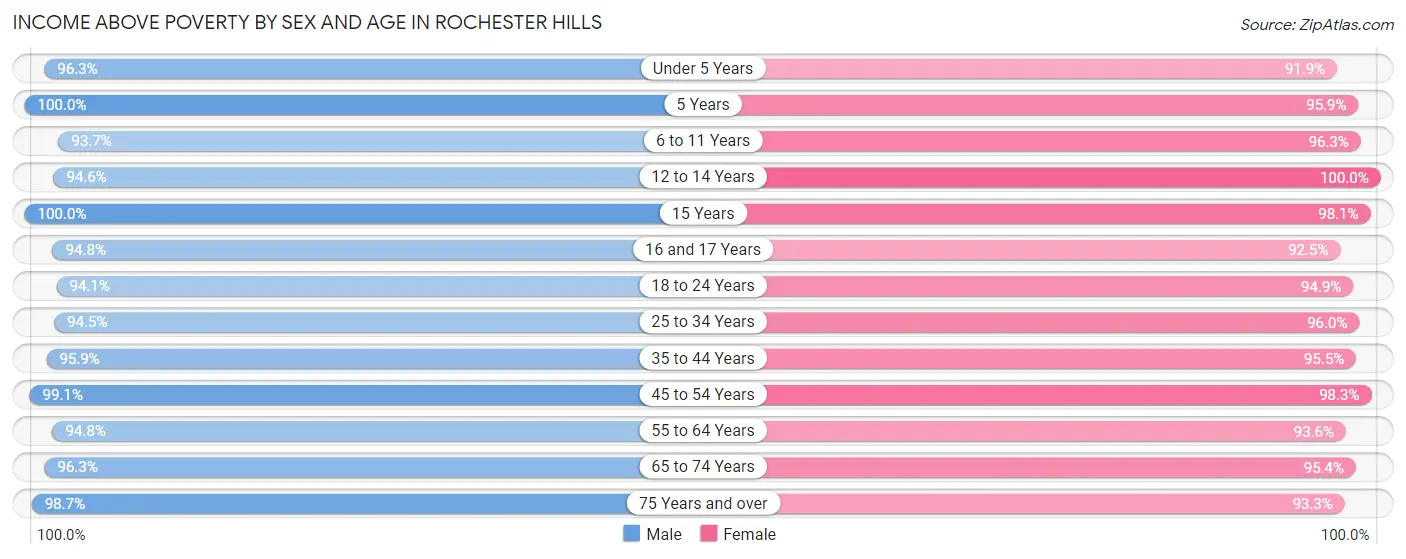
| Age Bracket | Male | Female |
| Under 5 Years | 1,941 (96.3%) | 1,871 (91.9%) |
| 5 Years | 520 (100.0%) | 463 (95.9%) |
| 6 to 11 Years | 2,494 (93.7%) | 2,900 (96.3%) |
| 12 to 14 Years | 1,448 (94.6%) | 1,537 (100.0%) |
| 15 Years | 363 (100.0%) | 619 (98.1%) |
| 16 and 17 Years | 910 (94.8%) | 1,038 (92.5%) |
| 18 to 24 Years | 2,656 (94.1%) | 2,613 (94.9%) |
| 25 to 34 Years | 3,885 (94.5%) | 3,350 (96.0%) |
| 35 to 44 Years | 5,290 (95.9%) | 5,075 (95.5%) |
| 45 to 54 Years | 4,836 (99.1%) | 4,967 (98.3%) |
| 55 to 64 Years | 4,905 (94.8%) | 4,560 (93.6%) |
| 65 to 74 Years | 3,511 (96.3%) | 4,027 (95.4%) |
| 75 Years and over | 2,001 (98.7%) | 3,083 (93.3%) |
| Total | 34,760 (96.0%) | 36,103 (95.4%) |
Income Below Poverty Among Married-Couple Families in Rochester Hills
The poverty statistics for married-couple families in Rochester Hills show that 1.8% or 314 of the total 17,328 families live below the poverty line. Families with 5 or more children have the highest poverty rate of 14.5%, comprising of 12 families. On the other hand, families with 1 or 2 children have the lowest poverty rate of 0.8%, which includes 54 families.
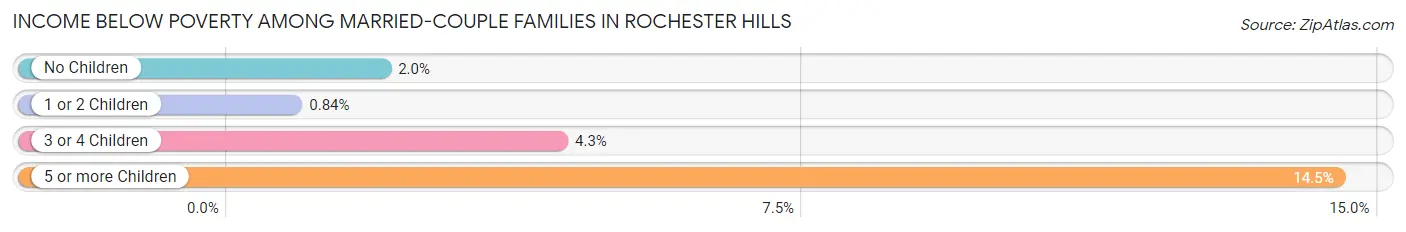
| Children | Above Poverty | Below Poverty |
| No Children | 9,273 (98.0%) | 189 (2.0%) |
| 1 or 2 Children | 6,359 (99.2%) | 54 (0.8%) |
| 3 or 4 Children | 1,311 (95.7%) | 59 (4.3%) |
| 5 or more Children | 71 (85.5%) | 12 (14.5%) |
| Total | 17,014 (98.2%) | 314 (1.8%) |
Income Below Poverty Among Single-Parent Households in Rochester Hills
According to the poverty data in Rochester Hills, 8.1% or 74 single-father households and 11.5% or 248 single-mother households are living below the poverty line. Among single-father households, those with 1 or 2 children have the highest poverty rate, with 47 households (14.7%) experiencing poverty. Likewise, among single-mother households, those with 3 or 4 children have the highest poverty rate, with 58 households (65.9%) falling below the poverty line.
| Children | Single Father | Single Mother |
| No Children | 27 (5.1%) | 56 (5.0%) |
| 1 or 2 Children | 47 (14.7%) | 134 (14.1%) |
| 3 or 4 Children | 0 (0.0%) | 58 (65.9%) |
| 5 or more Children | 0 (0.0%) | 0 (0.0%) |
| Total | 74 (8.1%) | 248 (11.5%) |
Income Below Poverty Among Married-Couple vs Single-Parent Households in Rochester Hills
The poverty data for Rochester Hills shows that 314 of the married-couple family households (1.8%) and 322 of the single-parent households (10.5%) are living below the poverty level. Within the married-couple family households, those with 5 or more children have the highest poverty rate, with 12 households (14.5%) falling below the poverty line. Among the single-parent households, those with 3 or 4 children have the highest poverty rate, with 58 household (38.2%) living below poverty.
| Children | Married-Couple Families | Single-Parent Households |
| No Children | 189 (2.0%) | 83 (5.0%) |
| 1 or 2 Children | 54 (0.8%) | 181 (14.3%) |
| 3 or 4 Children | 59 (4.3%) | 58 (38.2%) |
| 5 or more Children | 12 (14.5%) | 0 (0.0%) |
| Total | 314 (1.8%) | 322 (10.5%) |
Race in Rochester Hills
The most populous races in Rochester Hills are White / Caucasian (58,300 | 76.7%), Asian (10,425 | 13.7%), and Two or more Races (3,743 | 4.9%).
| Race | # Population | % Population |
| Asian | 10,425 | 13.7% |
| Black / African American | 2,643 | 3.5% |
| Hawaiian / Pacific | 0 | 0.0% |
| Hispanic or Latino | 3,346 | 4.4% |
| Native / Alaskan | 116 | 0.2% |
| White / Caucasian | 58,300 | 76.7% |
| Two or more Races | 3,743 | 4.9% |
| Some other Race | 814 | 1.1% |
| Total | 76,041 | 100.0% |
Ancestry in Rochester Hills
The most populous ancestries reported in Rochester Hills are German (14,704 | 19.3%), English (8,911 | 11.7%), Irish (7,335 | 9.7%), Polish (7,103 | 9.3%), and Italian (6,342 | 8.3%), together accounting for 58.4% of all Rochester Hills residents.
| Ancestry | # Population | % Population |
| African | 46 | 0.1% |
| Alaska Native | 24 | 0.0% |
| Albanian | 490 | 0.6% |
| American | 2,347 | 3.1% |
| Arab | 2,227 | 2.9% |
| Argentinean | 356 | 0.5% |
| Armenian | 142 | 0.2% |
| Assyrian / Chaldean / Syriac | 1,018 | 1.3% |
| Australian | 30 | 0.0% |
| Austrian | 543 | 0.7% |
| Bangladeshi | 31 | 0.0% |
| Barbadian | 9 | 0.0% |
| Belgian | 591 | 0.8% |
| Bhutanese | 439 | 0.6% |
| Blackfeet | 37 | 0.1% |
| Brazilian | 266 | 0.4% |
| British | 373 | 0.5% |
| Bulgarian | 17 | 0.0% |
| Burmese | 1,606 | 2.1% |
| Canadian | 456 | 0.6% |
| Central American | 148 | 0.2% |
| Central American Indian | 23 | 0.0% |
| Cherokee | 66 | 0.1% |
| Chinese | 5 | 0.0% |
| Chippewa | 29 | 0.0% |
| Choctaw | 4 | 0.0% |
| Colombian | 104 | 0.1% |
| Cree | 5 | 0.0% |
| Croatian | 162 | 0.2% |
| Cuban | 17 | 0.0% |
| Czech | 302 | 0.4% |
| Czechoslovakian | 78 | 0.1% |
| Danish | 229 | 0.3% |
| Dominican | 9 | 0.0% |
| Dutch | 954 | 1.3% |
| Eastern European | 309 | 0.4% |
| Egyptian | 339 | 0.4% |
| English | 8,911 | 11.7% |
| European | 1,227 | 1.6% |
| Filipino | 134 | 0.2% |
| Finnish | 752 | 1.0% |
| French | 2,656 | 3.5% |
| French Canadian | 927 | 1.2% |
| German | 14,704 | 19.3% |
| Ghanaian | 69 | 0.1% |
| Greek | 877 | 1.1% |
| Guatemalan | 60 | 0.1% |
| Hungarian | 461 | 0.6% |
| Icelander | 7 | 0.0% |
| Indian (Asian) | 2,623 | 3.5% |
| Iranian | 43 | 0.1% |
| Iraqi | 73 | 0.1% |
| Irish | 7,335 | 9.7% |
| Iroquois | 4 | 0.0% |
| Israeli | 3 | 0.0% |
| Italian | 6,342 | 8.3% |
| Jamaican | 8 | 0.0% |
| Japanese | 7 | 0.0% |
| Jordanian | 171 | 0.2% |
| Korean | 586 | 0.8% |
| Latvian | 63 | 0.1% |
| Lebanese | 632 | 0.8% |
| Liberian | 3 | 0.0% |
| Lithuanian | 297 | 0.4% |
| Macedonian | 207 | 0.3% |
| Malaysian | 10 | 0.0% |
| Maltese | 145 | 0.2% |
| Mexican | 1,955 | 2.6% |
| Mexican American Indian | 191 | 0.3% |
| Moroccan | 53 | 0.1% |
| Navajo | 9 | 0.0% |
| Nigerian | 12 | 0.0% |
| Northern European | 145 | 0.2% |
| Norwegian | 454 | 0.6% |
| Pakistani | 115 | 0.2% |
| Palestinian | 54 | 0.1% |
| Panamanian | 77 | 0.1% |
| Pennsylvania German | 31 | 0.0% |
| Peruvian | 21 | 0.0% |
| Polish | 7,103 | 9.3% |
| Portuguese | 178 | 0.2% |
| Puerto Rican | 285 | 0.4% |
| Romanian | 711 | 0.9% |
| Russian | 310 | 0.4% |
| Salvadoran | 11 | 0.0% |
| Scandinavian | 200 | 0.3% |
| Scotch-Irish | 659 | 0.9% |
| Scottish | 1,522 | 2.0% |
| Serbian | 124 | 0.2% |
| Slavic | 100 | 0.1% |
| Slovak | 377 | 0.5% |
| Slovene | 18 | 0.0% |
| South African | 11 | 0.0% |
| South American | 498 | 0.6% |
| South American Indian | 12 | 0.0% |
| Spaniard | 80 | 0.1% |
| Spanish | 120 | 0.2% |
| Sri Lankan | 271 | 0.4% |
| Subsaharan African | 377 | 0.5% |
| Swedish | 641 | 0.8% |
| Swiss | 114 | 0.2% |
| Syrian | 172 | 0.2% |
| Thai | 4,666 | 6.1% |
| Tongan | 1 | 0.0% |
| Turkish | 15 | 0.0% |
| Ukrainian | 593 | 0.8% |
| Venezuelan | 17 | 0.0% |
| Vietnamese | 90 | 0.1% |
| Welsh | 315 | 0.4% |
| Yugoslavian | 61 | 0.1% | View All 110 Rows |
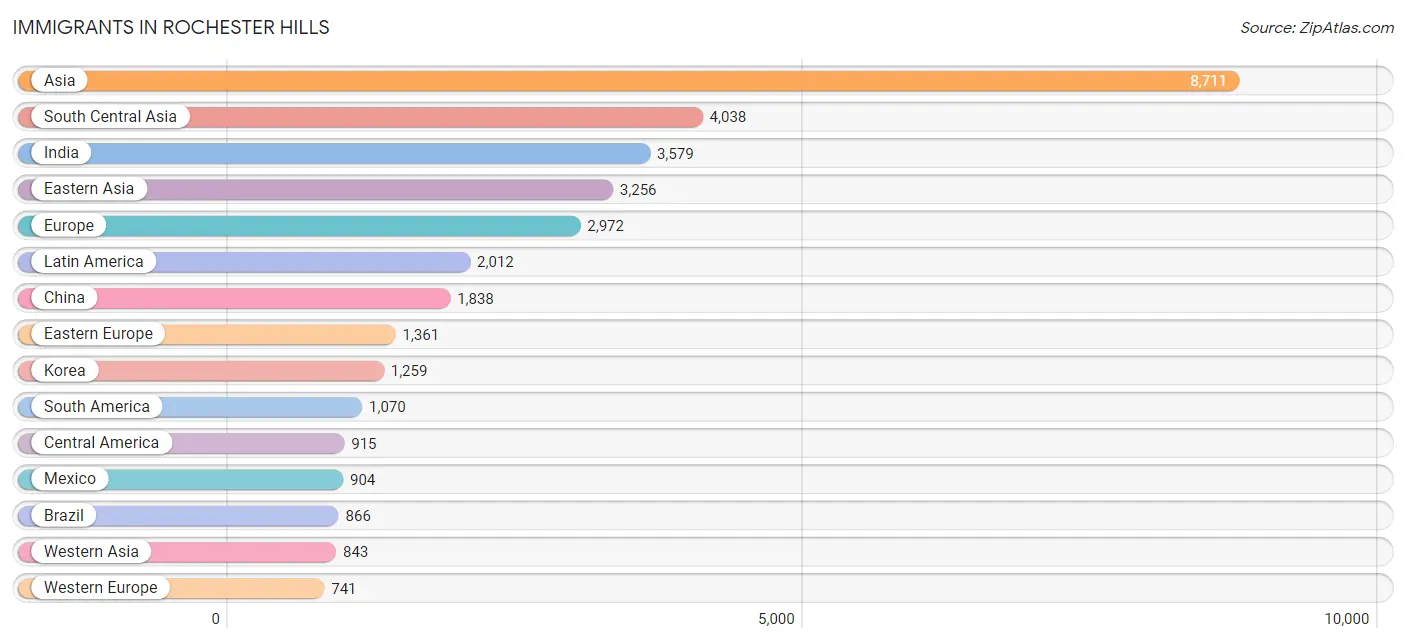
Immigrants in Rochester Hills
The most numerous immigrant groups reported in Rochester Hills came from Asia (8,711 | 11.5%), South Central Asia (4,038 | 5.3%), India (3,579 | 4.7%), Eastern Asia (3,256 | 4.3%), and Europe (2,972 | 3.9%), together accounting for 29.7% of all Rochester Hills residents.
| Immigration Origin | # Population | % Population |
| Africa | 612 | 0.8% |
| Albania | 187 | 0.3% |
| Argentina | 141 | 0.2% |
| Asia | 8,711 | 11.5% |
| Australia | 37 | 0.1% |
| Austria | 115 | 0.2% |
| Bangladesh | 130 | 0.2% |
| Barbados | 9 | 0.0% |
| Belgium | 8 | 0.0% |
| Bosnia and Herzegovina | 15 | 0.0% |
| Brazil | 866 | 1.1% |
| Canada | 582 | 0.8% |
| Caribbean | 27 | 0.0% |
| Central America | 915 | 1.2% |
| China | 1,838 | 2.4% |
| Colombia | 14 | 0.0% |
| Croatia | 16 | 0.0% |
| Cuba | 18 | 0.0% |
| Czechoslovakia | 57 | 0.1% |
| Eastern Africa | 18 | 0.0% |
| Eastern Asia | 3,256 | 4.3% |
| Eastern Europe | 1,361 | 1.8% |
| Egypt | 329 | 0.4% |
| El Salvador | 11 | 0.0% |
| England | 97 | 0.1% |
| Europe | 2,972 | 3.9% |
| France | 34 | 0.0% |
| Germany | 549 | 0.7% |
| Ghana | 19 | 0.0% |
| Greece | 90 | 0.1% |
| Hong Kong | 31 | 0.0% |
| Hungary | 13 | 0.0% |
| India | 3,579 | 4.7% |
| Indonesia | 11 | 0.0% |
| Iran | 61 | 0.1% |
| Iraq | 525 | 0.7% |
| Italy | 411 | 0.5% |
| Japan | 159 | 0.2% |
| Jordan | 14 | 0.0% |
| Korea | 1,259 | 1.7% |
| Kuwait | 34 | 0.0% |
| Laos | 6 | 0.0% |
| Latin America | 2,012 | 2.6% |
| Lebanon | 131 | 0.2% |
| Lithuania | 11 | 0.0% |
| Malaysia | 25 | 0.0% |
| Mexico | 904 | 1.2% |
| Middle Africa | 135 | 0.2% |
| Morocco | 27 | 0.0% |
| Netherlands | 26 | 0.0% |
| Nigeria | 15 | 0.0% |
| North Macedonia | 36 | 0.1% |
| Northern Africa | 356 | 0.5% |
| Northern Europe | 231 | 0.3% |
| Oceania | 37 | 0.1% |
| Pakistan | 268 | 0.4% |
| Peru | 21 | 0.0% |
| Philippines | 337 | 0.4% |
| Poland | 254 | 0.3% |
| Portugal | 40 | 0.1% |
| Romania | 339 | 0.4% |
| Russia | 27 | 0.0% |
| Saudi Arabia | 59 | 0.1% |
| Scotland | 9 | 0.0% |
| Serbia | 24 | 0.0% |
| Singapore | 27 | 0.0% |
| South Africa | 19 | 0.0% |
| South America | 1,070 | 1.4% |
| South Central Asia | 4,038 | 5.3% |
| South Eastern Asia | 557 | 0.7% |
| Southern Europe | 639 | 0.8% |
| Spain | 47 | 0.1% |
| Switzerland | 6 | 0.0% |
| Syria | 52 | 0.1% |
| Taiwan | 204 | 0.3% |
| Thailand | 13 | 0.0% |
| Ukraine | 300 | 0.4% |
| Venezuela | 17 | 0.0% |
| Vietnam | 138 | 0.2% |
| Western Africa | 34 | 0.0% |
| Western Asia | 843 | 1.1% |
| Western Europe | 741 | 1.0% |
| Zimbabwe | 13 | 0.0% | View All 83 Rows |
Sex and Age in Rochester Hills
Sex and Age in Rochester Hills
The most populous age groups in Rochester Hills are 35 to 39 Years (2,849 | 7.7%) for men and 15 to 19 Years (3,444 | 8.8%) for women.
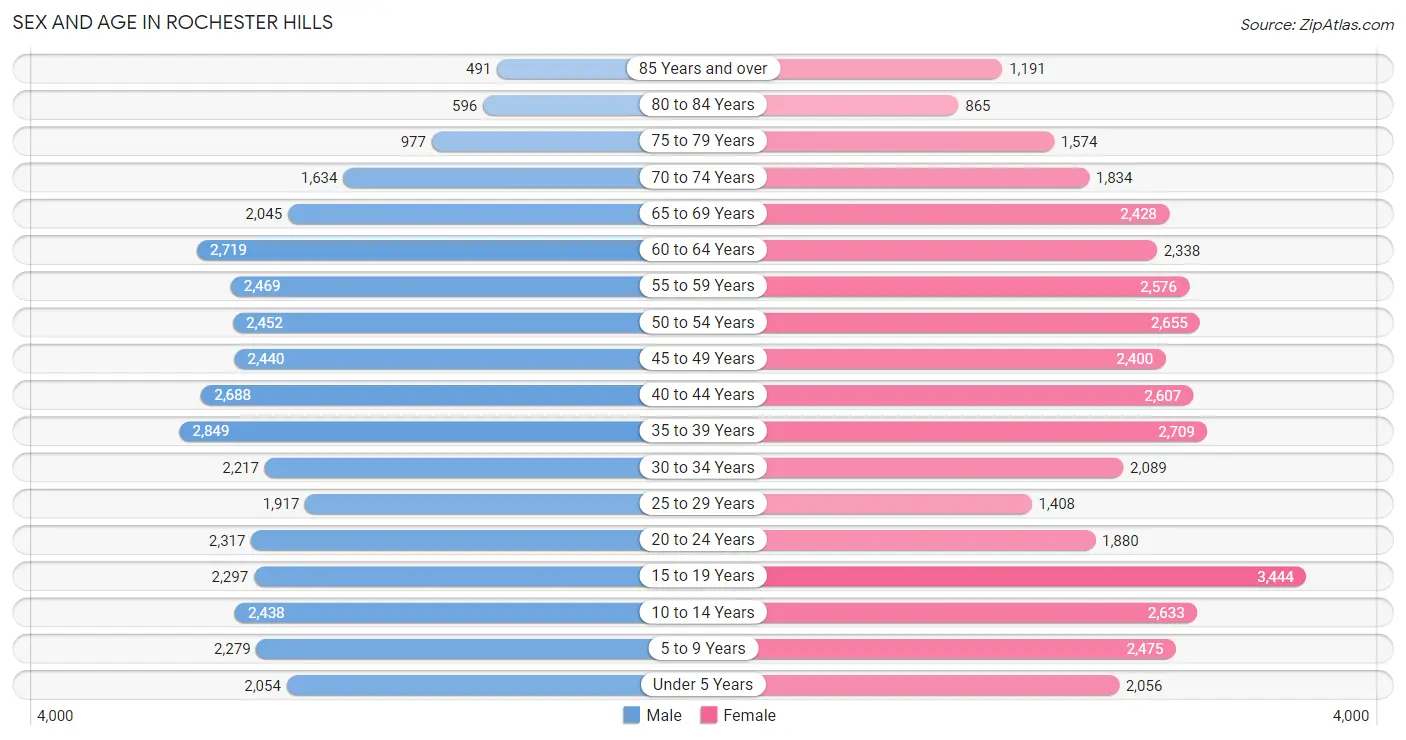
| Age Bracket | Male | Female |
| Under 5 Years | 2,054 (5.6%) | 2,056 (5.2%) |
| 5 to 9 Years | 2,279 (6.2%) | 2,475 (6.3%) |
| 10 to 14 Years | 2,438 (6.6%) | 2,633 (6.7%) |
| 15 to 19 Years | 2,297 (6.2%) | 3,444 (8.8%) |
| 20 to 24 Years | 2,317 (6.3%) | 1,880 (4.8%) |
| 25 to 29 Years | 1,917 (5.2%) | 1,408 (3.6%) |
| 30 to 34 Years | 2,217 (6.0%) | 2,089 (5.3%) |
| 35 to 39 Years | 2,849 (7.7%) | 2,709 (6.9%) |
| 40 to 44 Years | 2,688 (7.3%) | 2,607 (6.7%) |
| 45 to 49 Years | 2,440 (6.6%) | 2,400 (6.1%) |
| 50 to 54 Years | 2,452 (6.7%) | 2,655 (6.8%) |
| 55 to 59 Years | 2,469 (6.7%) | 2,576 (6.6%) |
| 60 to 64 Years | 2,719 (7.4%) | 2,338 (6.0%) |
| 65 to 69 Years | 2,045 (5.6%) | 2,428 (6.2%) |
| 70 to 74 Years | 1,634 (4.4%) | 1,834 (4.7%) |
| 75 to 79 Years | 977 (2.6%) | 1,574 (4.0%) |
| 80 to 84 Years | 596 (1.6%) | 865 (2.2%) |
| 85 Years and over | 491 (1.3%) | 1,191 (3.0%) |
| Total | 36,879 (100.0%) | 39,162 (100.0%) |
Families and Households in Rochester Hills
Median Family Size in Rochester Hills
The median family size in Rochester Hills is 3.12 persons per family, with married-couple families (17,328 | 84.9%) accounting for the largest median family size of 3.17 persons per family. On the other hand, single female/mother families (2,160 | 10.6%) represent the smallest median family size with 2.80 persons per family.
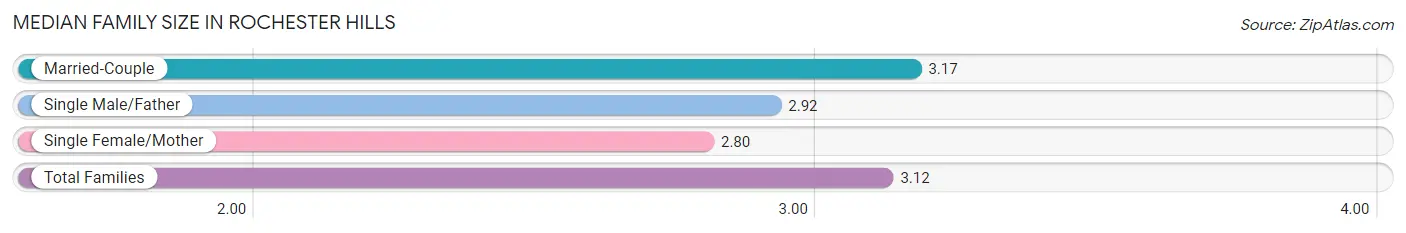
| Family Type | # Families | Family Size |
| Married-Couple | 17,328 (84.9%) | 3.17 |
| Single Male/Father | 916 (4.5%) | 2.92 |
| Single Female/Mother | 2,160 (10.6%) | 2.80 |
| Total Families | 20,404 (100.0%) | 3.12 |
Median Household Size in Rochester Hills
The median household size in Rochester Hills is 2.56 persons per household, with single male/father households (916 | 3.2%) accounting for the largest median household size of 3.31 persons per household. non-family households (8,584 | 29.6%) represent the smallest median household size with 1.13 persons per household.
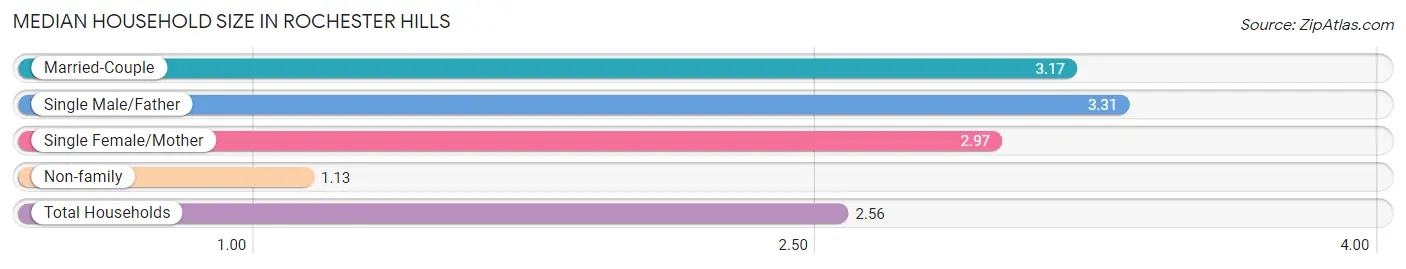
| Household Type | # Households | Household Size |
| Married-Couple | 17,328 (59.8%) | 3.17 |
| Single Male/Father | 916 (3.2%) | 3.31 |
| Single Female/Mother | 2,160 (7.4%) | 2.97 |
| Non-family | 8,584 (29.6%) | 1.13 |
| Total Households | 28,988 (100.0%) | 2.56 |
Household Size by Marriage Status in Rochester Hills
Out of a total of 28,988 households in Rochester Hills, 20,404 (70.4%) are family households, while 8,584 (29.6%) are nonfamily households. The most numerous type of family households are 2-person households, comprising 8,321, and the most common type of nonfamily households are 1-person households, comprising 7,602.
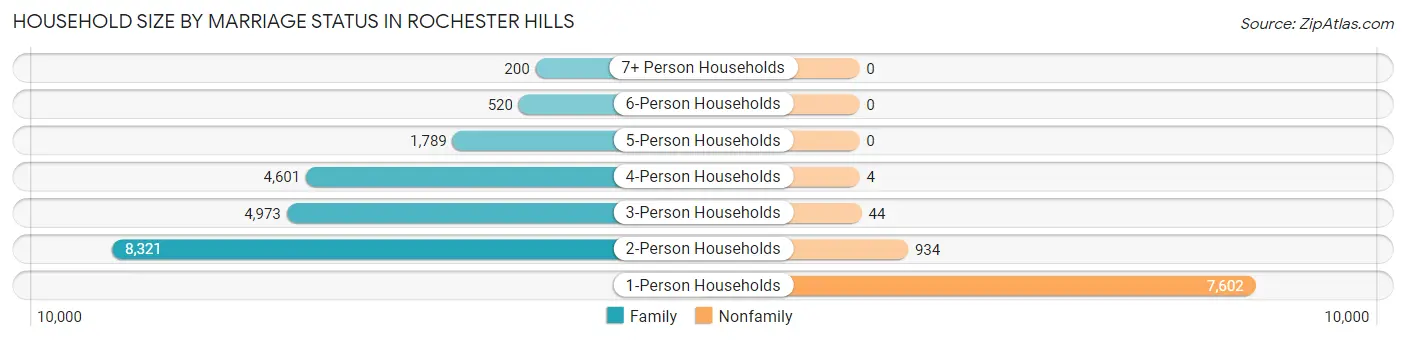
| Household Size | Family Households | Nonfamily Households |
| 1-Person Households | - | 7,602 (26.2%) |
| 2-Person Households | 8,321 (28.7%) | 934 (3.2%) |
| 3-Person Households | 4,973 (17.2%) | 44 (0.2%) |
| 4-Person Households | 4,601 (15.9%) | 4 (0.0%) |
| 5-Person Households | 1,789 (6.2%) | 0 (0.0%) |
| 6-Person Households | 520 (1.8%) | 0 (0.0%) |
| 7+ Person Households | 200 (0.7%) | 0 (0.0%) |
| Total | 20,404 (70.4%) | 8,584 (29.6%) |
Female Fertility in Rochester Hills
Fertility by Age in Rochester Hills
Average fertility rate in Rochester Hills is 59.0 births per 1,000 women. Women in the age bracket of 20 to 34 years have the highest fertility rate with 151.0 births per 1,000 women. Women in the age bracket of 20 to 34 years acount for 79.9% of all women with births.
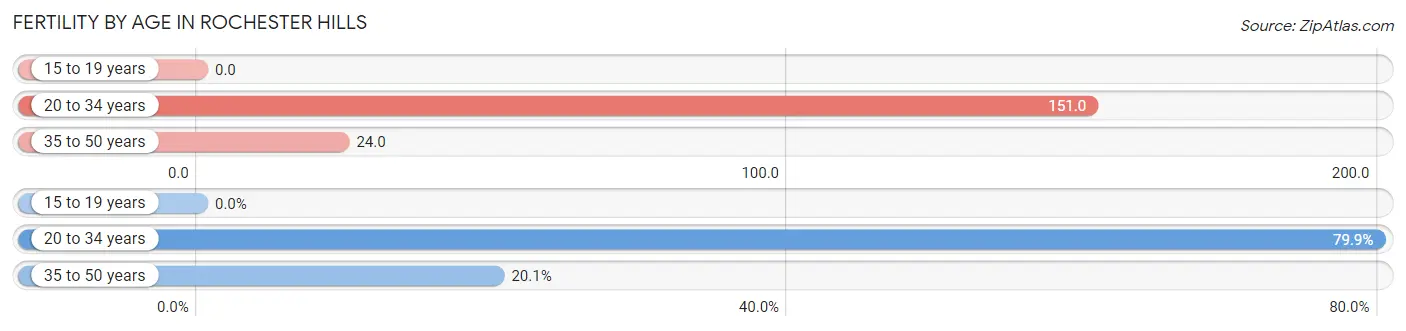
| Age Bracket | Women with Births | Births / 1,000 Women |
| 15 to 19 years | 0 (0.0%) | 0.0 |
| 20 to 34 years | 814 (79.9%) | 151.0 |
| 35 to 50 years | 205 (20.1%) | 24.0 |
| Total | 1,019 (100.0%) | 59.0 |
Fertility by Age by Marriage Status in Rochester Hills
84.5% of women with births (1,019) in Rochester Hills are married. The highest percentage of unmarried women with births falls into 20 to 34 years age bracket with 19.4% of them unmarried at the time of birth, while the lowest percentage of unmarried women with births belong to 35 to 50 years age bracket with 0.0% of them unmarried.
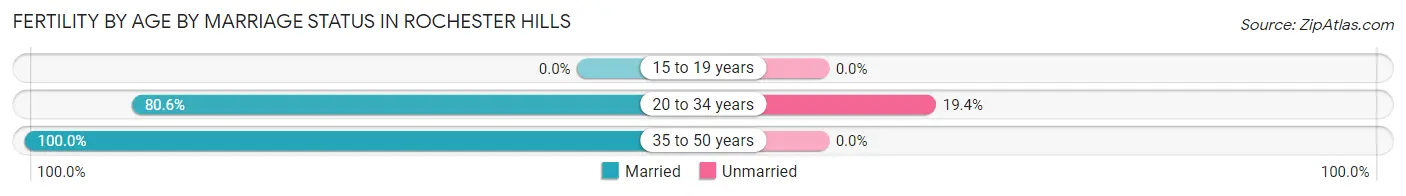
| Age Bracket | Married | Unmarried |
| 15 to 19 years | 0 (0.0%) | 0 (0.0%) |
| 20 to 34 years | 656 (80.6%) | 158 (19.4%) |
| 35 to 50 years | 205 (100.0%) | 0 (0.0%) |
| Total | 861 (84.5%) | 158 (15.5%) |
Fertility by Education in Rochester Hills
Average fertility rate in Rochester Hills is 59.0 births per 1,000 women. Women with the education attainment of graduate degree have the highest fertility rate of 113.0 births per 1,000 women, while women with the education attainment of less than high school have the lowest fertility at 9.0 births per 1,000 women. Women with the education attainment of graduate degree represent 41.9% of all women with births.
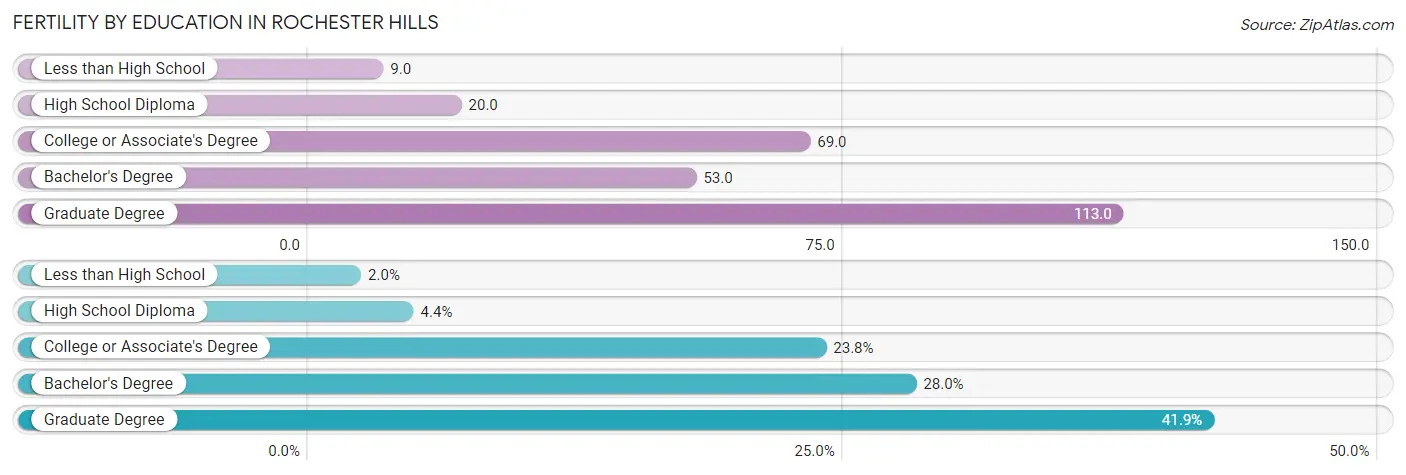
| Educational Attainment | Women with Births | Births / 1,000 Women |
| Less than High School | 20 (2.0%) | 9.0 |
| High School Diploma | 45 (4.4%) | 20.0 |
| College or Associate's Degree | 242 (23.7%) | 69.0 |
| Bachelor's Degree | 285 (28.0%) | 53.0 |
| Graduate Degree | 427 (41.9%) | 113.0 |
| Total | 1,019 (100.0%) | 59.0 |
Fertility by Education by Marriage Status in Rochester Hills
15.5% of women with births in Rochester Hills are unmarried. Women with the educational attainment of less than high school are most likely to be married with 100.0% of them married at childbirth, while women with the educational attainment of high school diploma are least likely to be married with 75.6% of them unmarried at childbirth.
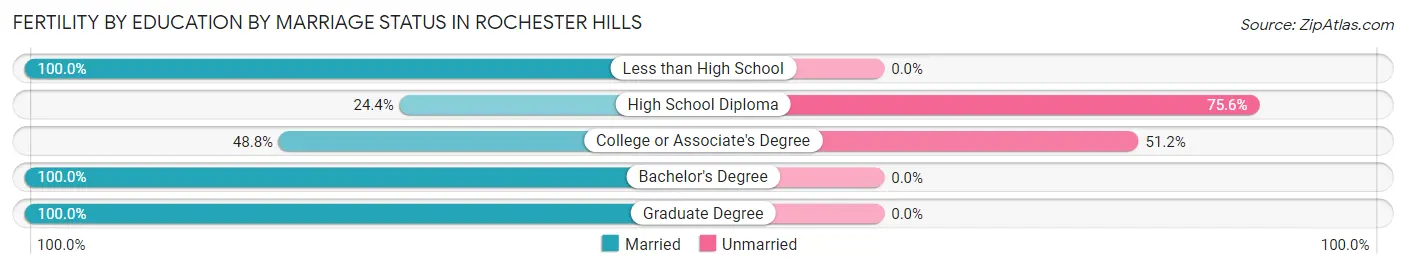
| Educational Attainment | Married | Unmarried |
| Less than High School | 20 (100.0%) | 0 (0.0%) |
| High School Diploma | 11 (24.4%) | 34 (75.6%) |
| College or Associate's Degree | 118 (48.8%) | 124 (51.2%) |
| Bachelor's Degree | 285 (100.0%) | 0 (0.0%) |
| Graduate Degree | 427 (100.0%) | 0 (0.0%) |
| Total | 861 (84.5%) | 158 (15.5%) |
Employment Characteristics in Rochester Hills
Employment by Class of Employer in Rochester Hills
Among the 36,912 employed individuals in Rochester Hills, private company employees (27,659 | 74.9%), not-for-profit organizations (3,051 | 8.3%), and self-employed (incorporated) (1,795 | 4.9%) make up the most common classes of employment.
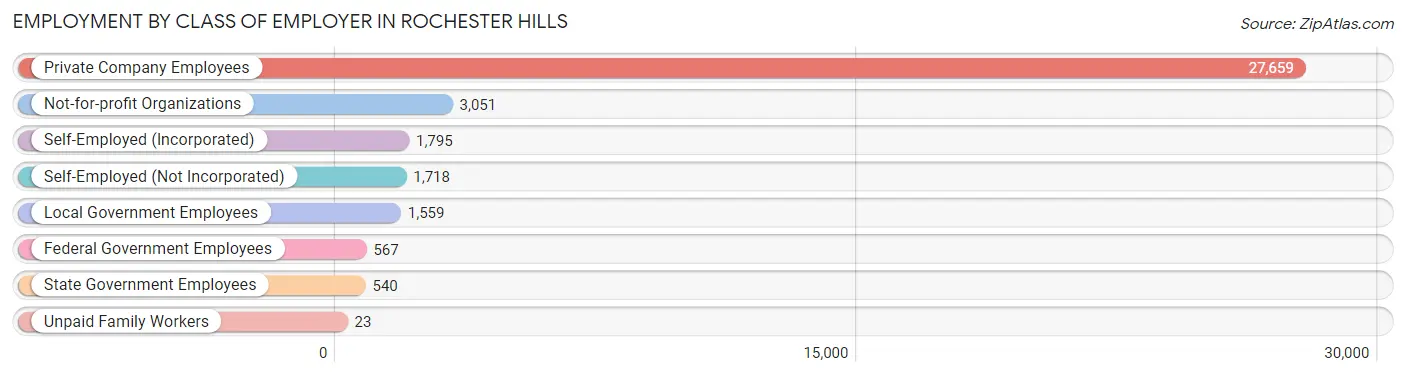
| Employer Class | # Employees | % Employees |
| Private Company Employees | 27,659 | 74.9% |
| Self-Employed (Incorporated) | 1,795 | 4.9% |
| Self-Employed (Not Incorporated) | 1,718 | 4.6% |
| Not-for-profit Organizations | 3,051 | 8.3% |
| Local Government Employees | 1,559 | 4.2% |
| State Government Employees | 540 | 1.5% |
| Federal Government Employees | 567 | 1.5% |
| Unpaid Family Workers | 23 | 0.1% |
| Total | 36,912 | 100.0% |
Employment Status by Age in Rochester Hills
According to the labor force statistics for Rochester Hills, out of the total population over 16 years of age (61,112), 64.1% or 39,173 individuals are in the labor force, with 3.9% or 1,528 of them unemployed. The age group with the highest labor force participation rate is 25 to 29 years, with 90.1% or 2,996 individuals in the labor force. Within the labor force, the 16 to 19 years age range has the highest percentage of unemployed individuals, with 11.3% or 226 of them being unemployed.
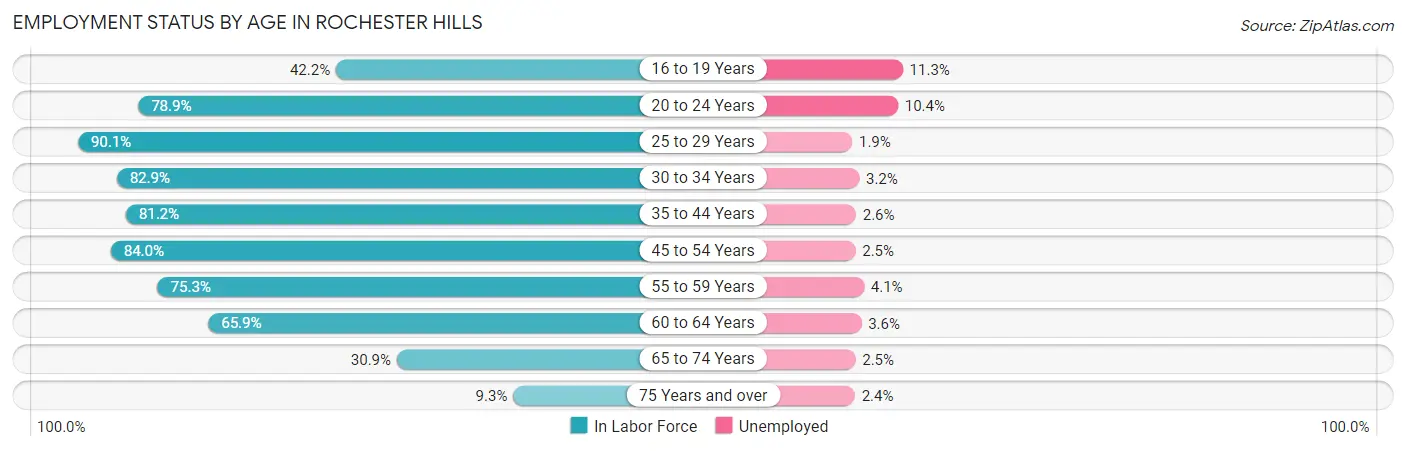
| Age Bracket | In Labor Force | Unemployed |
| 16 to 19 Years | 2,003 (42.2%) | 226 (11.3%) |
| 20 to 24 Years | 3,311 (78.9%) | 344 (10.4%) |
| 25 to 29 Years | 2,996 (90.1%) | 57 (1.9%) |
| 30 to 34 Years | 3,570 (82.9%) | 114 (3.2%) |
| 35 to 44 Years | 8,813 (81.2%) | 229 (2.6%) |
| 45 to 54 Years | 8,355 (84.0%) | 209 (2.5%) |
| 55 to 59 Years | 3,799 (75.3%) | 156 (4.1%) |
| 60 to 64 Years | 3,333 (65.9%) | 120 (3.6%) |
| 65 to 74 Years | 2,454 (30.9%) | 61 (2.5%) |
| 75 Years and over | 530 (9.3%) | 13 (2.4%) |
| Total | 39,173 (64.1%) | 1,528 (3.9%) |
Employment Status by Educational Attainment in Rochester Hills
According to labor force statistics for Rochester Hills, 80.1% of individuals (30,865) out of the total population between 25 and 64 years of age (38,533) are in the labor force, with 2.8% or 864 of them being unemployed. The group with the highest labor force participation rate are those with the educational attainment of bachelor's degree or higher, with 83.8% or 21,511 individuals in the labor force. Within the labor force, individuals with less than high school education have the highest percentage of unemployment, with 11.8% or 56 of them being unemployed.
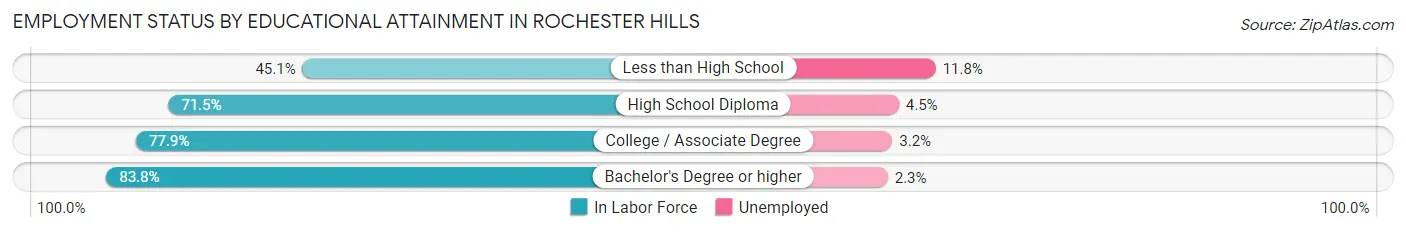
| Educational Attainment | In Labor Force | Unemployed |
| Less than High School | 473 (45.1%) | 124 (11.8%) |
| High School Diploma | 3,445 (71.5%) | 217 (4.5%) |
| College / Associate Degree | 5,451 (77.9%) | 224 (3.2%) |
| Bachelor's Degree or higher | 21,511 (83.8%) | 590 (2.3%) |
| Total | 30,865 (80.1%) | 1,079 (2.8%) |
Employment Occupations by Sex in Rochester Hills
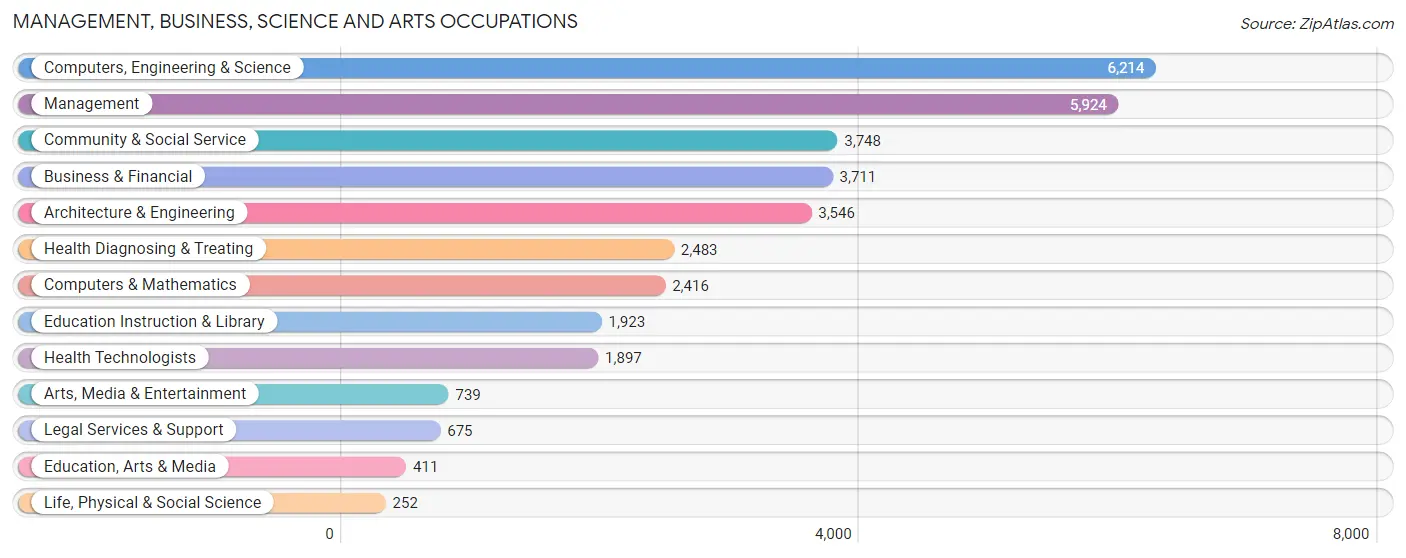
Management, Business, Science and Arts Occupations
The most common Management, Business, Science and Arts occupations in Rochester Hills are Computers, Engineering & Science (6,214 | 16.5%), Management (5,924 | 15.8%), Community & Social Service (3,748 | 10.0%), Business & Financial (3,711 | 9.9%), and Architecture & Engineering (3,546 | 9.4%).
Management, Business, Science and Arts Occupations by Sex
Within the Management, Business, Science and Arts occupations in Rochester Hills, the most male-oriented occupations are Architecture & Engineering (88.5%), Computers, Engineering & Science (81.1%), and Computers & Mathematics (71.8%), while the most female-oriented occupations are Education, Arts & Media (75.4%), Education Instruction & Library (75.4%), and Health Diagnosing & Treating (73.7%).
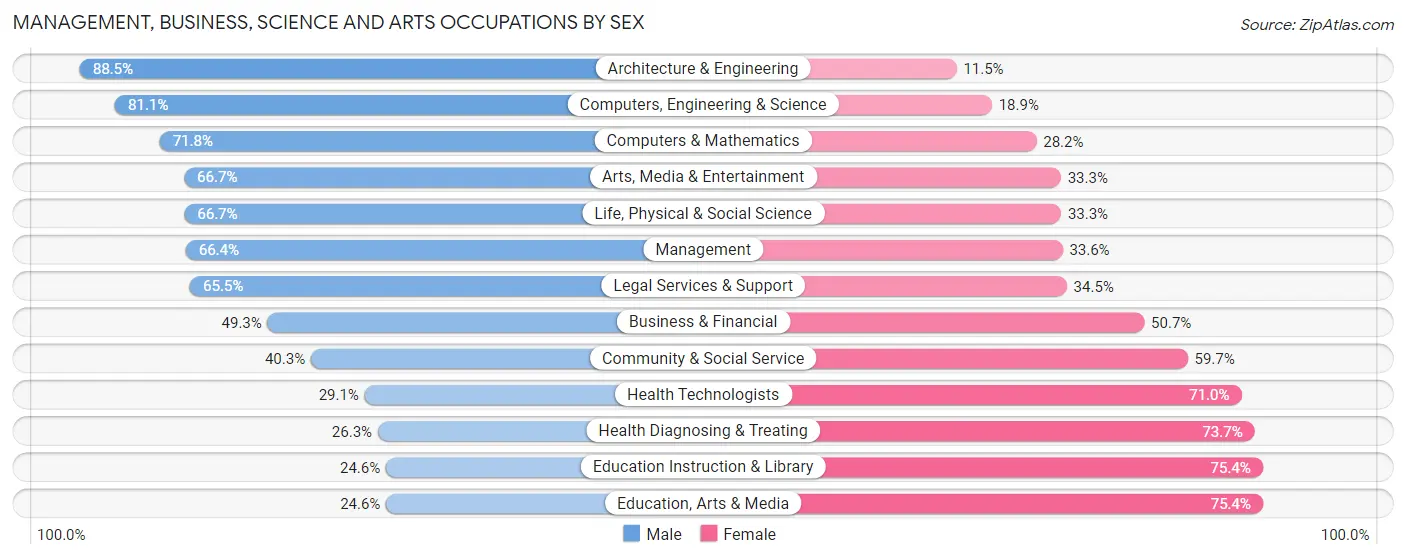
| Occupation | Male | Female |
| Management | 3,931 (66.4%) | 1,993 (33.6%) |
| Business & Financial | 1,830 (49.3%) | 1,881 (50.7%) |
| Computers, Engineering & Science | 5,040 (81.1%) | 1,174 (18.9%) |
| Computers & Mathematics | 1,735 (71.8%) | 681 (28.2%) |
| Architecture & Engineering | 3,137 (88.5%) | 409 (11.5%) |
| Life, Physical & Social Science | 168 (66.7%) | 84 (33.3%) |
| Community & Social Service | 1,509 (40.3%) | 2,239 (59.7%) |
| Education, Arts & Media | 101 (24.6%) | 310 (75.4%) |
| Legal Services & Support | 442 (65.5%) | 233 (34.5%) |
| Education Instruction & Library | 473 (24.6%) | 1,450 (75.4%) |
| Arts, Media & Entertainment | 493 (66.7%) | 246 (33.3%) |
| Health Diagnosing & Treating | 653 (26.3%) | 1,830 (73.7%) |
| Health Technologists | 551 (29.0%) | 1,346 (71.0%) |
| Total (Category) | 12,963 (58.7%) | 9,117 (41.3%) |
| Total (Overall) | 21,411 (56.9%) | 16,206 (43.1%) |
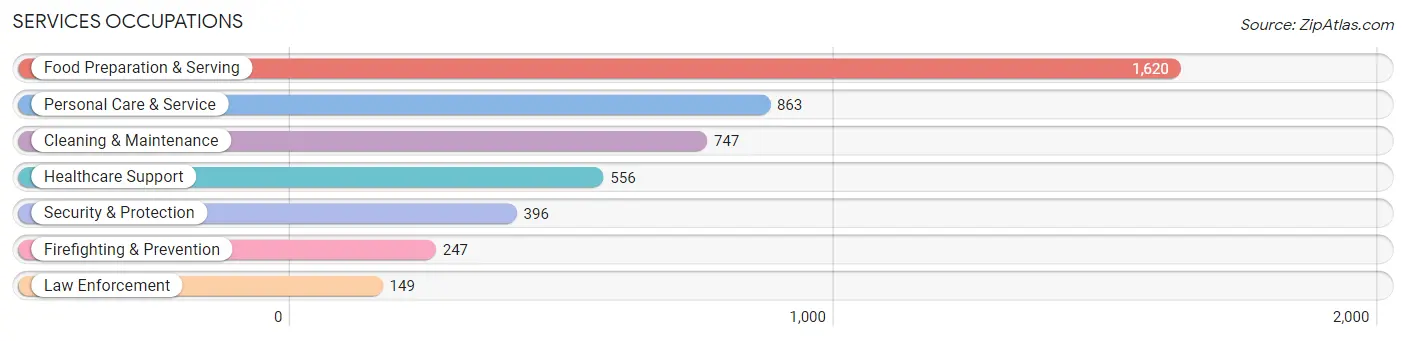
Services Occupations
The most common Services occupations in Rochester Hills are Food Preparation & Serving (1,620 | 4.3%), Personal Care & Service (863 | 2.3%), Cleaning & Maintenance (747 | 2.0%), Healthcare Support (556 | 1.5%), and Security & Protection (396 | 1.1%).
Services Occupations by Sex
Within the Services occupations in Rochester Hills, the most male-oriented occupations are Firefighting & Prevention (84.6%), Security & Protection (84.1%), and Law Enforcement (83.2%), while the most female-oriented occupations are Personal Care & Service (77.1%), Healthcare Support (67.1%), and Food Preparation & Serving (63.4%).
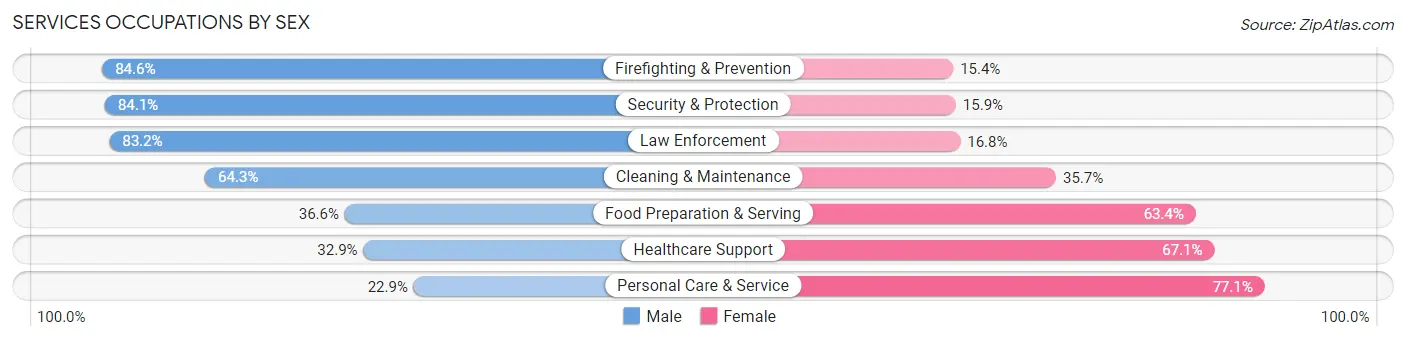
| Occupation | Male | Female |
| Healthcare Support | 183 (32.9%) | 373 (67.1%) |
| Security & Protection | 333 (84.1%) | 63 (15.9%) |
| Firefighting & Prevention | 209 (84.6%) | 38 (15.4%) |
| Law Enforcement | 124 (83.2%) | 25 (16.8%) |
| Food Preparation & Serving | 593 (36.6%) | 1,027 (63.4%) |
| Cleaning & Maintenance | 480 (64.3%) | 267 (35.7%) |
| Personal Care & Service | 198 (22.9%) | 665 (77.1%) |
| Total (Category) | 1,787 (42.7%) | 2,395 (57.3%) |
| Total (Overall) | 21,411 (56.9%) | 16,206 (43.1%) |
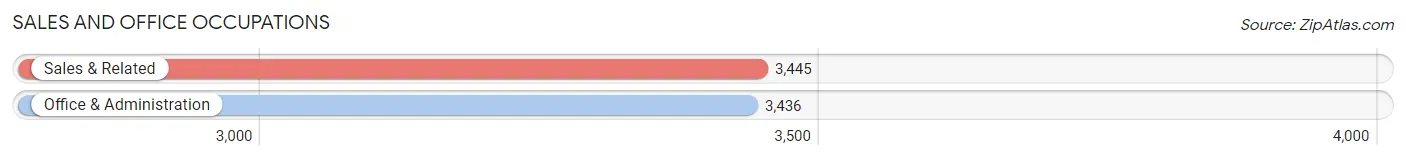
Sales and Office Occupations
The most common Sales and Office occupations in Rochester Hills are Sales & Related (3,445 | 9.2%), and Office & Administration (3,436 | 9.1%).
Sales and Office Occupations by Sex
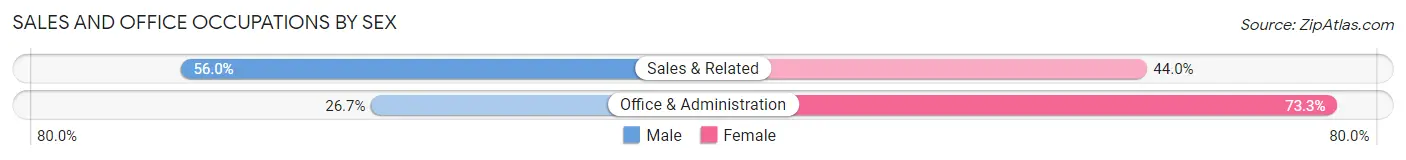
| Occupation | Male | Female |
| Sales & Related | 1,930 (56.0%) | 1,515 (44.0%) |
| Office & Administration | 916 (26.7%) | 2,520 (73.3%) |
| Total (Category) | 2,846 (41.4%) | 4,035 (58.6%) |
| Total (Overall) | 21,411 (56.9%) | 16,206 (43.1%) |
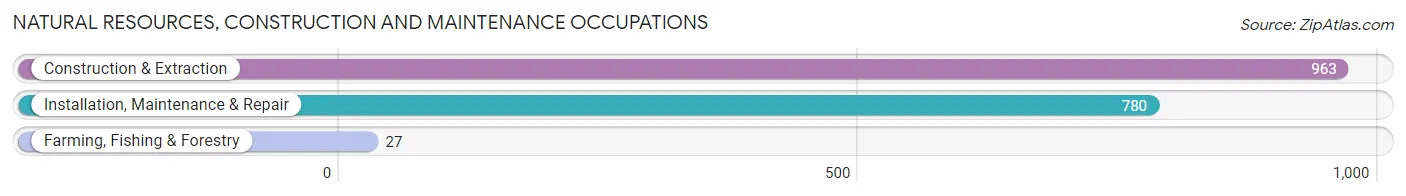
Natural Resources, Construction and Maintenance Occupations
The most common Natural Resources, Construction and Maintenance occupations in Rochester Hills are Construction & Extraction (963 | 2.6%), Installation, Maintenance & Repair (780 | 2.1%), and Farming, Fishing & Forestry (27 | 0.1%).
Natural Resources, Construction and Maintenance Occupations by Sex
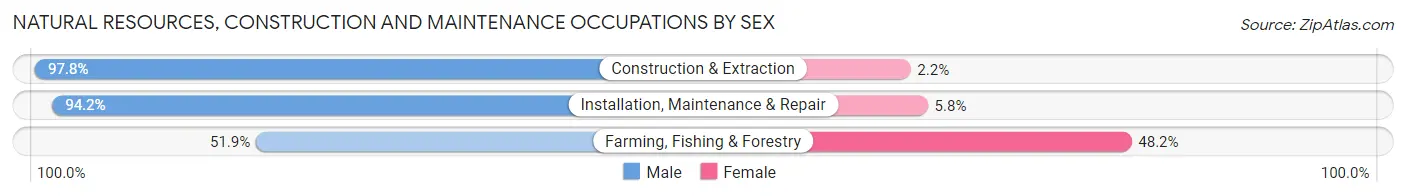
| Occupation | Male | Female |
| Farming, Fishing & Forestry | 14 (51.8%) | 13 (48.1%) |
| Construction & Extraction | 942 (97.8%) | 21 (2.2%) |
| Installation, Maintenance & Repair | 735 (94.2%) | 45 (5.8%) |
| Total (Category) | 1,691 (95.5%) | 79 (4.5%) |
| Total (Overall) | 21,411 (56.9%) | 16,206 (43.1%) |
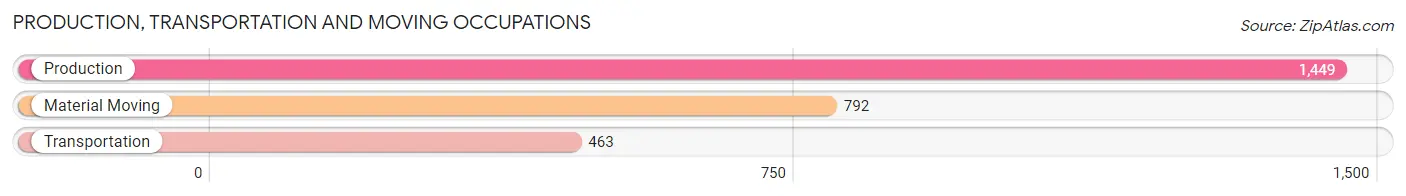
Production, Transportation and Moving Occupations
The most common Production, Transportation and Moving occupations in Rochester Hills are Production (1,449 | 3.8%), Material Moving (792 | 2.1%), and Transportation (463 | 1.2%).
Production, Transportation and Moving Occupations by Sex
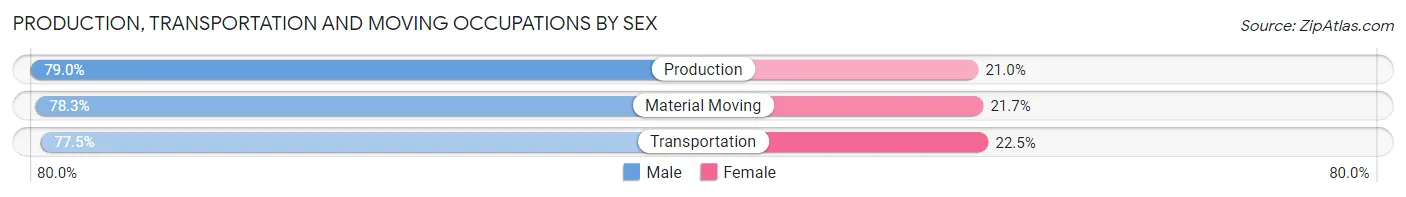
| Occupation | Male | Female |
| Production | 1,145 (79.0%) | 304 (21.0%) |
| Transportation | 359 (77.5%) | 104 (22.5%) |
| Material Moving | 620 (78.3%) | 172 (21.7%) |
| Total (Category) | 2,124 (78.5%) | 580 (21.4%) |
| Total (Overall) | 21,411 (56.9%) | 16,206 (43.1%) |
Employment Industries by Sex in Rochester Hills
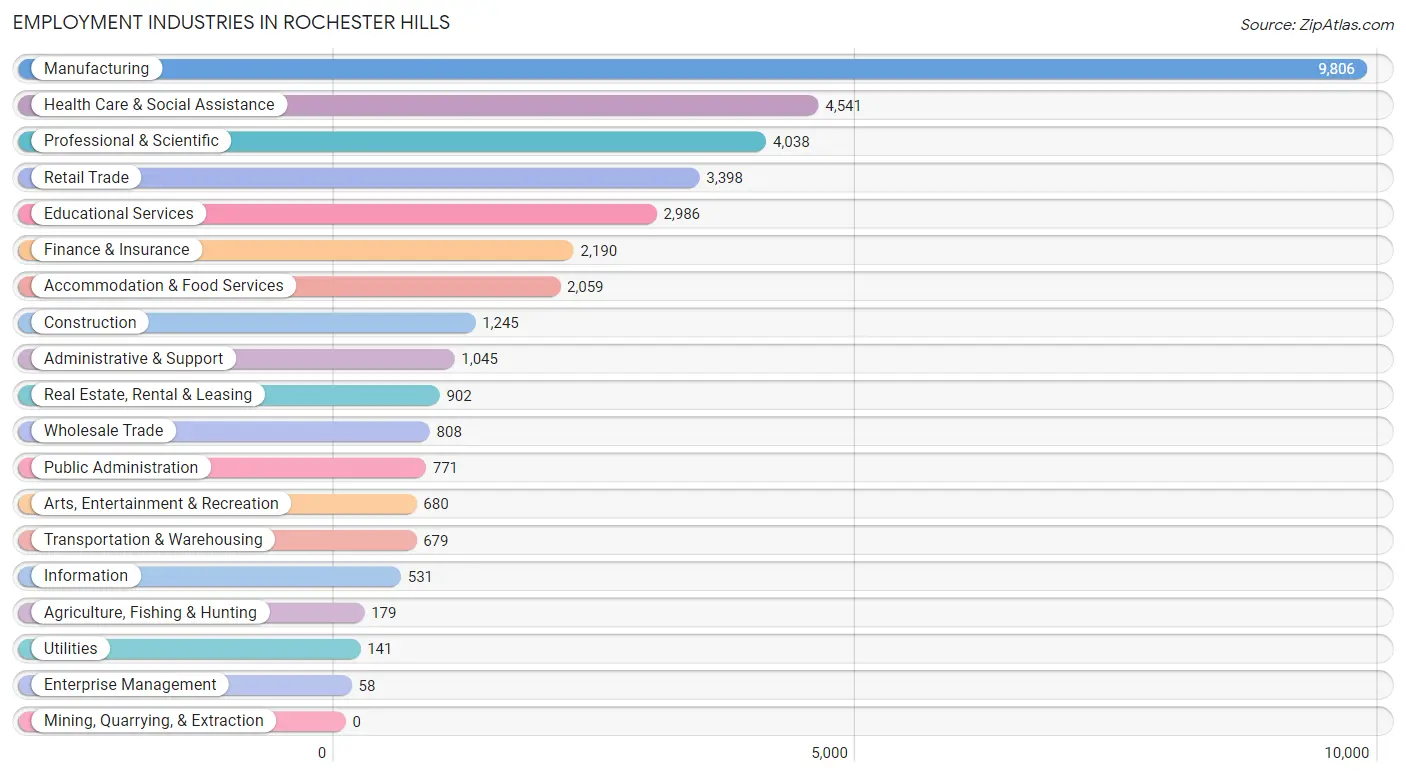
Employment Industries in Rochester Hills
The major employment industries in Rochester Hills include Manufacturing (9,806 | 26.1%), Health Care & Social Assistance (4,541 | 12.1%), Professional & Scientific (4,038 | 10.7%), Retail Trade (3,398 | 9.0%), and Educational Services (2,986 | 7.9%).
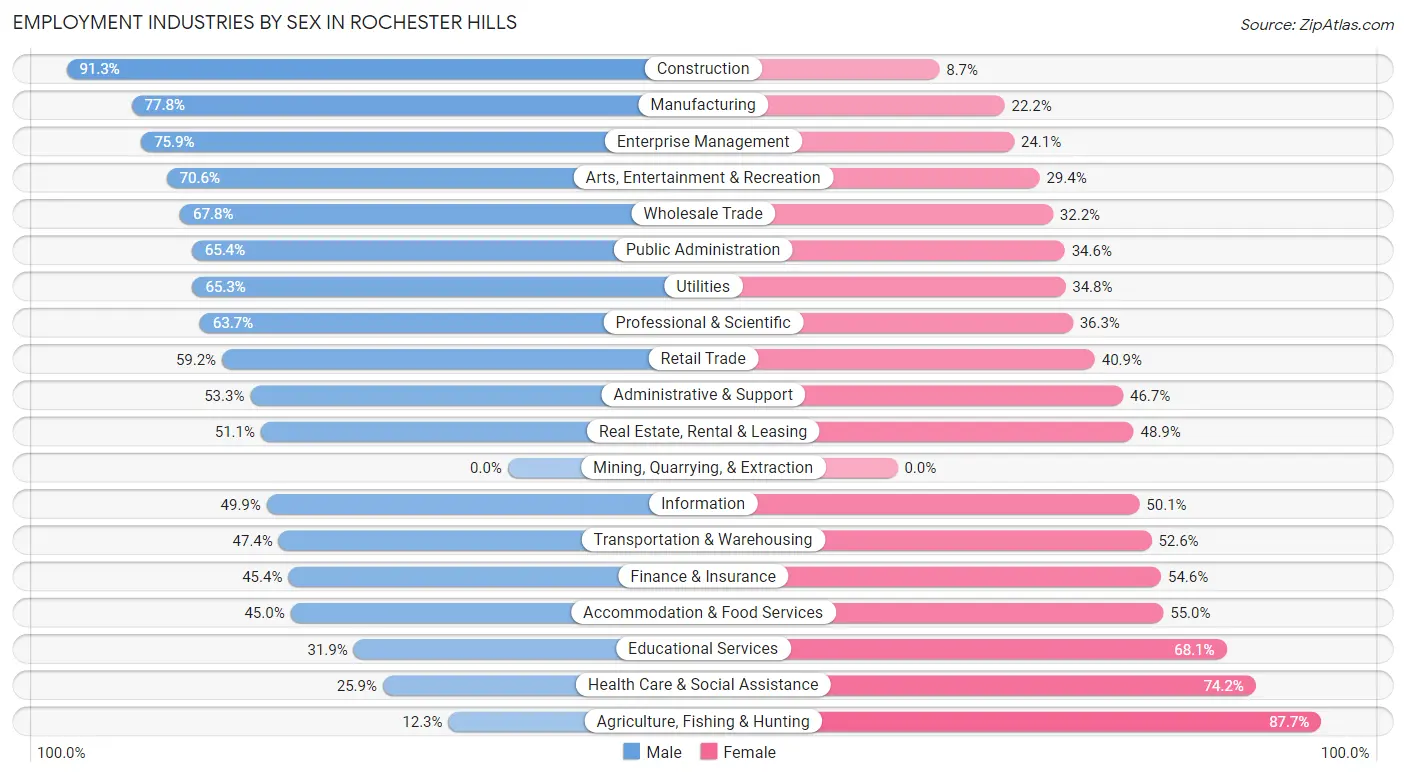
Employment Industries by Sex in Rochester Hills
The Rochester Hills industries that see more men than women are Construction (91.3%), Manufacturing (77.8%), and Enterprise Management (75.9%), whereas the industries that tend to have a higher number of women are Agriculture, Fishing & Hunting (87.7%), Health Care & Social Assistance (74.2%), and Educational Services (68.1%).
| Industry | Male | Female |
| Agriculture, Fishing & Hunting | 22 (12.3%) | 157 (87.7%) |
| Mining, Quarrying, & Extraction | 0 (0.0%) | 0 (0.0%) |
| Construction | 1,137 (91.3%) | 108 (8.7%) |
| Manufacturing | 7,632 (77.8%) | 2,174 (22.2%) |
| Wholesale Trade | 548 (67.8%) | 260 (32.2%) |
| Retail Trade | 2,010 (59.2%) | 1,388 (40.8%) |
| Transportation & Warehousing | 322 (47.4%) | 357 (52.6%) |
| Utilities | 92 (65.2%) | 49 (34.7%) |
| Information | 265 (49.9%) | 266 (50.1%) |
| Finance & Insurance | 995 (45.4%) | 1,195 (54.6%) |
| Real Estate, Rental & Leasing | 461 (51.1%) | 441 (48.9%) |
| Professional & Scientific | 2,573 (63.7%) | 1,465 (36.3%) |
| Enterprise Management | 44 (75.9%) | 14 (24.1%) |
| Administrative & Support | 557 (53.3%) | 488 (46.7%) |
| Educational Services | 953 (31.9%) | 2,033 (68.1%) |
| Health Care & Social Assistance | 1,174 (25.9%) | 3,367 (74.2%) |
| Arts, Entertainment & Recreation | 480 (70.6%) | 200 (29.4%) |
| Accommodation & Food Services | 926 (45.0%) | 1,133 (55.0%) |
| Public Administration | 504 (65.4%) | 267 (34.6%) |
| Total | 21,411 (56.9%) | 16,206 (43.1%) |
Education in Rochester Hills
School Enrollment in Rochester Hills
The most common levels of schooling among the 20,218 students in Rochester Hills are college / undergraduate (4,426 | 21.9%), high school (4,239 | 21.0%), and middle school (4,058 | 20.1%).
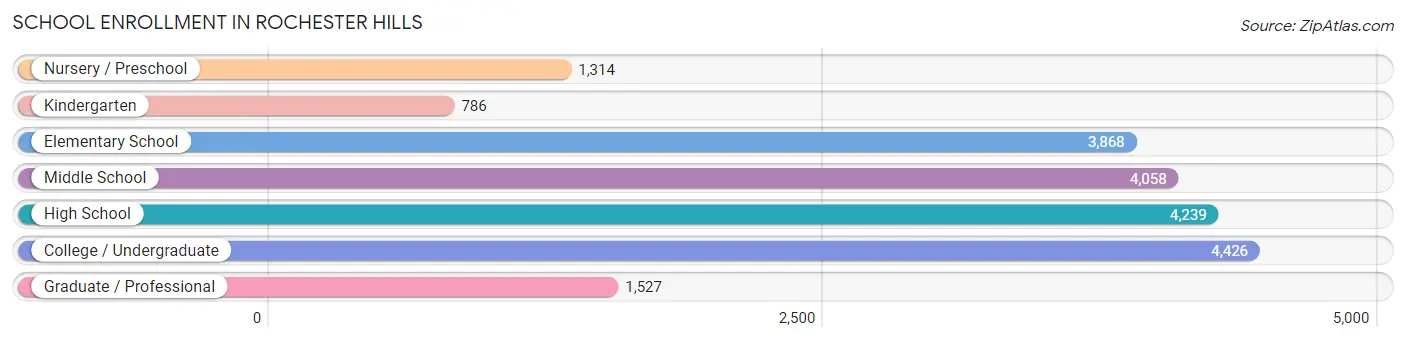
| School Level | # Students | % Students |
| Nursery / Preschool | 1,314 | 6.5% |
| Kindergarten | 786 | 3.9% |
| Elementary School | 3,868 | 19.1% |
| Middle School | 4,058 | 20.1% |
| High School | 4,239 | 21.0% |
| College / Undergraduate | 4,426 | 21.9% |
| Graduate / Professional | 1,527 | 7.5% |
| Total | 20,218 | 100.0% |
School Enrollment by Age by Funding Source in Rochester Hills
Out of a total of 20,218 students who are enrolled in schools in Rochester Hills, 3,639 (18.0%) attend a private institution, while the remaining 16,579 (82.0%) are enrolled in public schools. The age group of 35 years and over has the highest likelihood of being enrolled in private schools, with 461 (50.5% in the age bracket) enrolled. Conversely, the age group of 18 to 19 year olds has the lowest likelihood of being enrolled in a private school, with 2,266 (91.0% in the age bracket) attending a public institution.
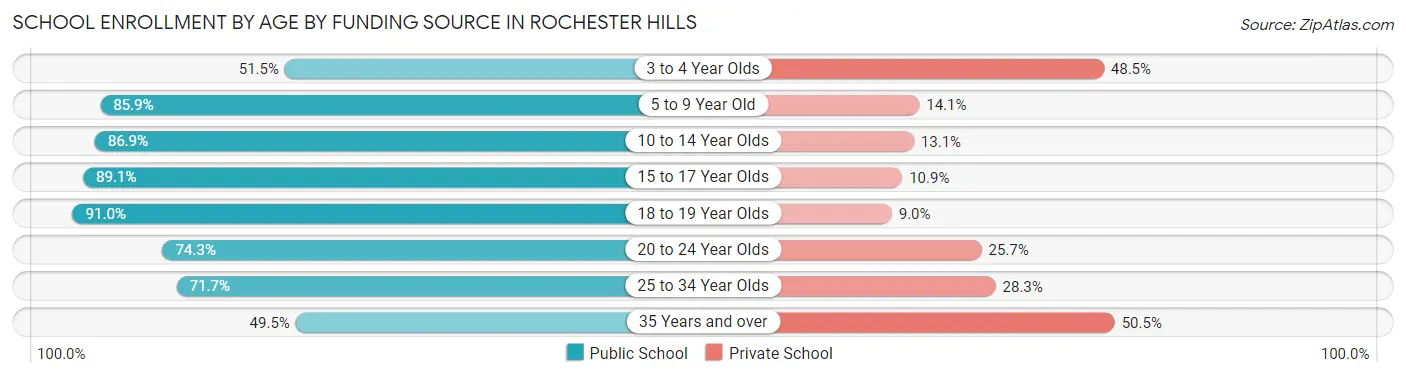
| Age Bracket | Public School | Private School |
| 3 to 4 Year Olds | 502 (51.5%) | 472 (48.5%) |
| 5 to 9 Year Old | 3,956 (85.9%) | 649 (14.1%) |
| 10 to 14 Year Olds | 4,327 (86.9%) | 651 (13.1%) |
| 15 to 17 Year Olds | 2,736 (89.1%) | 335 (10.9%) |
| 18 to 19 Year Olds | 2,266 (91.0%) | 223 (9.0%) |
| 20 to 24 Year Olds | 1,773 (74.3%) | 613 (25.7%) |
| 25 to 34 Year Olds | 575 (71.7%) | 227 (28.3%) |
| 35 Years and over | 452 (49.5%) | 461 (50.5%) |
| Total | 16,579 (82.0%) | 3,639 (18.0%) |
Educational Attainment by Field of Study in Rochester Hills
Business (7,616 | 22.9%), engineering (6,923 | 20.8%), science & technology (3,183 | 9.6%), education (3,072 | 9.2%), and social sciences (2,033 | 6.1%) are the most common fields of study among 33,335 individuals in Rochester Hills who have obtained a bachelor's degree or higher.
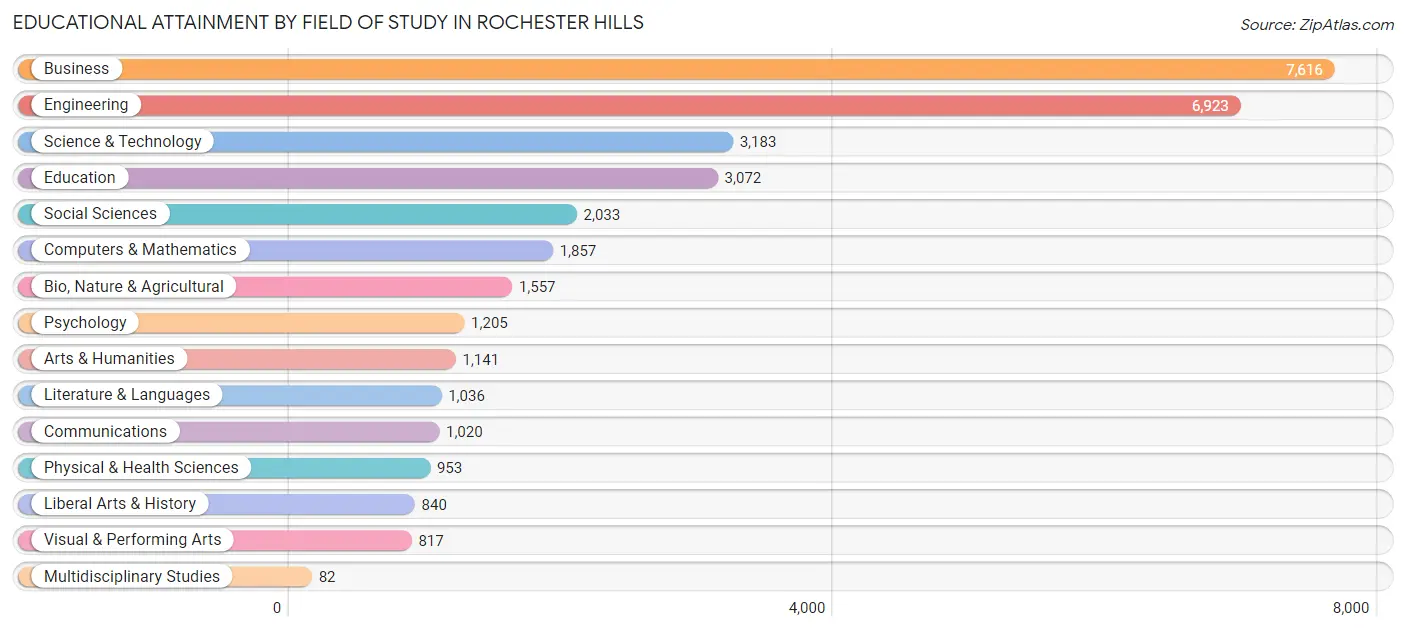
| Field of Study | # Graduates | % Graduates |
| Computers & Mathematics | 1,857 | 5.6% |
| Bio, Nature & Agricultural | 1,557 | 4.7% |
| Physical & Health Sciences | 953 | 2.9% |
| Psychology | 1,205 | 3.6% |
| Social Sciences | 2,033 | 6.1% |
| Engineering | 6,923 | 20.8% |
| Multidisciplinary Studies | 82 | 0.3% |
| Science & Technology | 3,183 | 9.6% |
| Business | 7,616 | 22.9% |
| Education | 3,072 | 9.2% |
| Literature & Languages | 1,036 | 3.1% |
| Liberal Arts & History | 840 | 2.5% |
| Visual & Performing Arts | 817 | 2.5% |
| Communications | 1,020 | 3.1% |
| Arts & Humanities | 1,141 | 3.4% |
| Total | 33,335 | 100.0% |
Transportation & Commute in Rochester Hills
Vehicle Availability by Sex in Rochester Hills
The most prevalent vehicle ownership categories in Rochester Hills are males with 2 vehicles (10,294, accounting for 48.9%) and females with 2 vehicles (7,008, making up 67.6%).
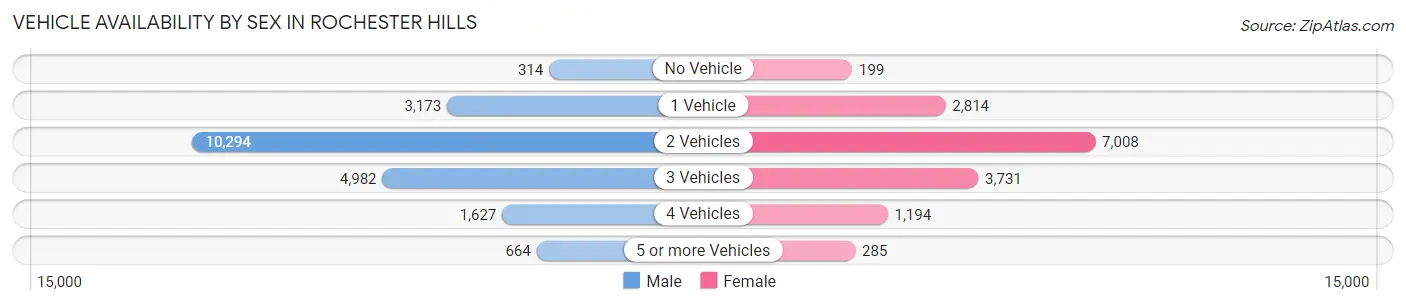
| Vehicles Available | Male | Female |
| No Vehicle | 314 (1.5%) | 199 (1.3%) |
| 1 Vehicle | 3,173 (15.1%) | 2,814 (18.5%) |
| 2 Vehicles | 10,294 (48.9%) | 7,008 (46.0%) |
| 3 Vehicles | 4,982 (23.7%) | 3,731 (24.5%) |
| 4 Vehicles | 1,627 (7.7%) | 1,194 (7.8%) |
| 5 or more Vehicles | 664 (3.2%) | 285 (1.9%) |
| Total | 21,054 (100.0%) | 15,231 (100.0%) |
Commute Time in Rochester Hills
The most frequently occuring commute durations in Rochester Hills are 15 to 19 minutes (5,508 commuters, 18.0%), 20 to 24 minutes (4,777 commuters, 15.6%), and 30 to 34 minutes (4,089 commuters, 13.4%).
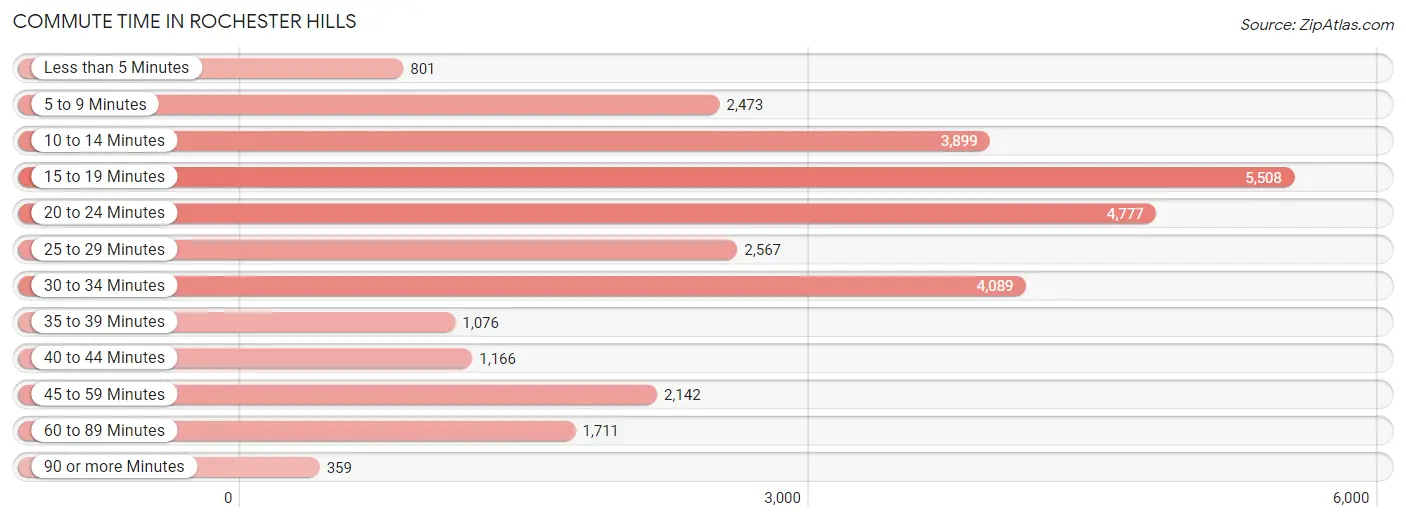
| Commute Time | # Commuters | % Commuters |
| Less than 5 Minutes | 801 | 2.6% |
| 5 to 9 Minutes | 2,473 | 8.1% |
| 10 to 14 Minutes | 3,899 | 12.8% |
| 15 to 19 Minutes | 5,508 | 18.0% |
| 20 to 24 Minutes | 4,777 | 15.6% |
| 25 to 29 Minutes | 2,567 | 8.4% |
| 30 to 34 Minutes | 4,089 | 13.4% |
| 35 to 39 Minutes | 1,076 | 3.5% |
| 40 to 44 Minutes | 1,166 | 3.8% |
| 45 to 59 Minutes | 2,142 | 7.0% |
| 60 to 89 Minutes | 1,711 | 5.6% |
| 90 or more Minutes | 359 | 1.2% |
Commute Time by Sex in Rochester Hills
The most common commute times in Rochester Hills are 15 to 19 minutes (3,194 commuters, 18.3%) for males and 20 to 24 minutes (2,429 commuters, 18.5%) for females.
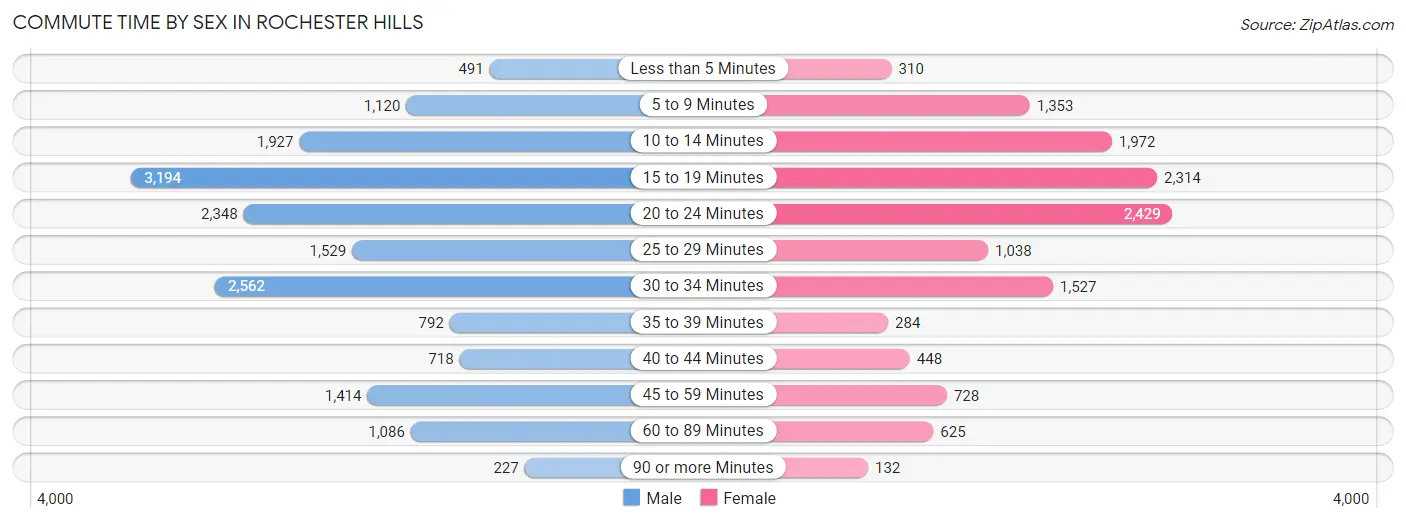
| Commute Time | Male | Female |
| Less than 5 Minutes | 491 (2.8%) | 310 (2.4%) |
| 5 to 9 Minutes | 1,120 (6.4%) | 1,353 (10.3%) |
| 10 to 14 Minutes | 1,927 (11.1%) | 1,972 (15.0%) |
| 15 to 19 Minutes | 3,194 (18.3%) | 2,314 (17.6%) |
| 20 to 24 Minutes | 2,348 (13.5%) | 2,429 (18.5%) |
| 25 to 29 Minutes | 1,529 (8.8%) | 1,038 (7.9%) |
| 30 to 34 Minutes | 2,562 (14.7%) | 1,527 (11.6%) |
| 35 to 39 Minutes | 792 (4.5%) | 284 (2.2%) |
| 40 to 44 Minutes | 718 (4.1%) | 448 (3.4%) |
| 45 to 59 Minutes | 1,414 (8.1%) | 728 (5.5%) |
| 60 to 89 Minutes | 1,086 (6.2%) | 625 (4.8%) |
| 90 or more Minutes | 227 (1.3%) | 132 (1.0%) |
Time of Departure to Work by Sex in Rochester Hills
The most frequent times of departure to work in Rochester Hills are 7:00 AM to 7:29 AM (2,741, 15.8%) for males and 8:00 AM to 8:29 AM (2,092, 15.9%) for females.
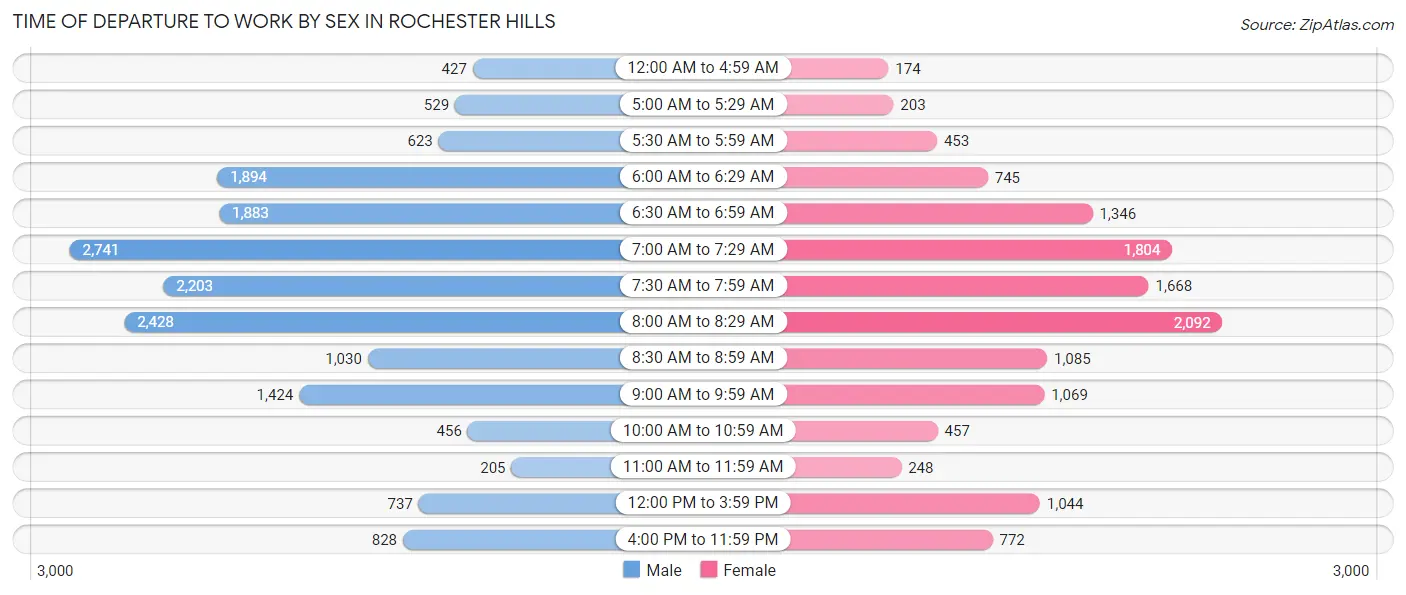
| Time of Departure | Male | Female |
| 12:00 AM to 4:59 AM | 427 (2.5%) | 174 (1.3%) |
| 5:00 AM to 5:29 AM | 529 (3.0%) | 203 (1.5%) |
| 5:30 AM to 5:59 AM | 623 (3.6%) | 453 (3.4%) |
| 6:00 AM to 6:29 AM | 1,894 (10.9%) | 745 (5.7%) |
| 6:30 AM to 6:59 AM | 1,883 (10.8%) | 1,346 (10.2%) |
| 7:00 AM to 7:29 AM | 2,741 (15.8%) | 1,804 (13.7%) |
| 7:30 AM to 7:59 AM | 2,203 (12.7%) | 1,668 (12.7%) |
| 8:00 AM to 8:29 AM | 2,428 (14.0%) | 2,092 (15.9%) |
| 8:30 AM to 8:59 AM | 1,030 (5.9%) | 1,085 (8.2%) |
| 9:00 AM to 9:59 AM | 1,424 (8.2%) | 1,069 (8.1%) |
| 10:00 AM to 10:59 AM | 456 (2.6%) | 457 (3.5%) |
| 11:00 AM to 11:59 AM | 205 (1.2%) | 248 (1.9%) |
| 12:00 PM to 3:59 PM | 737 (4.2%) | 1,044 (7.9%) |
| 4:00 PM to 11:59 PM | 828 (4.8%) | 772 (5.9%) |
| Total | 17,408 (100.0%) | 13,160 (100.0%) |
Housing Occupancy in Rochester Hills
Occupancy by Ownership in Rochester Hills
Of the total 28,988 dwellings in Rochester Hills, owner-occupied units account for 22,402 (77.3%), while renter-occupied units make up 6,586 (22.7%).
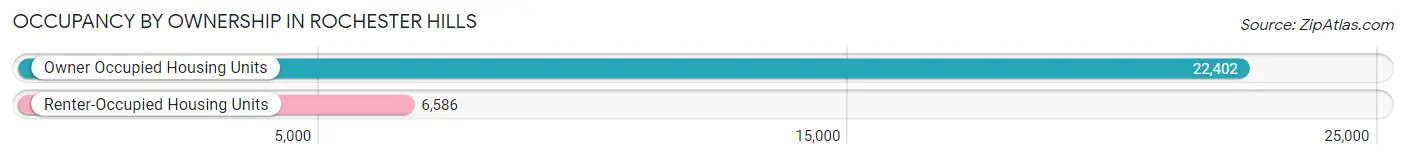
| Occupancy | # Housing Units | % Housing Units |
| Owner Occupied Housing Units | 22,402 | 77.3% |
| Renter-Occupied Housing Units | 6,586 | 22.7% |
| Total Occupied Housing Units | 28,988 | 100.0% |
Occupancy by Household Size in Rochester Hills
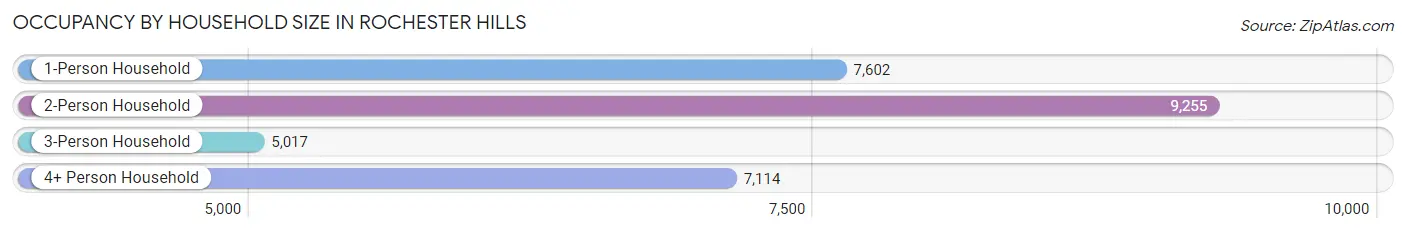
| Household Size | # Housing Units | % Housing Units |
| 1-Person Household | 7,602 | 26.2% |
| 2-Person Household | 9,255 | 31.9% |
| 3-Person Household | 5,017 | 17.3% |
| 4+ Person Household | 7,114 | 24.5% |
| Total Housing Units | 28,988 | 100.0% |
Occupancy by Ownership by Household Size in Rochester Hills
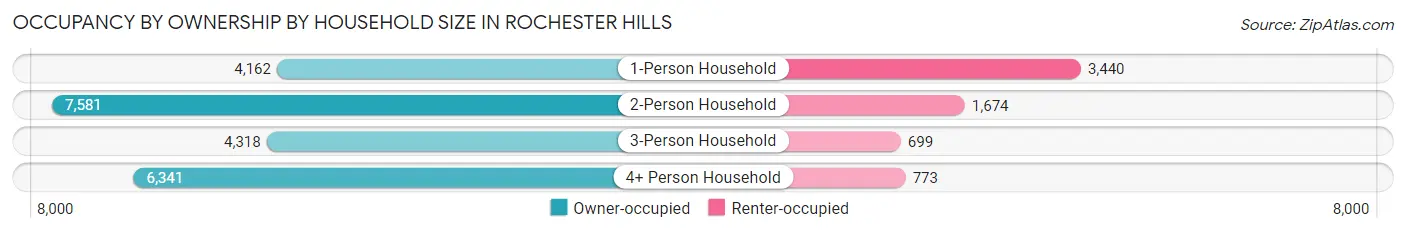
| Household Size | Owner-occupied | Renter-occupied |
| 1-Person Household | 4,162 (54.7%) | 3,440 (45.3%) |
| 2-Person Household | 7,581 (81.9%) | 1,674 (18.1%) |
| 3-Person Household | 4,318 (86.1%) | 699 (13.9%) |
| 4+ Person Household | 6,341 (89.1%) | 773 (10.9%) |
| Total Housing Units | 22,402 (77.3%) | 6,586 (22.7%) |
Occupancy by Educational Attainment in Rochester Hills
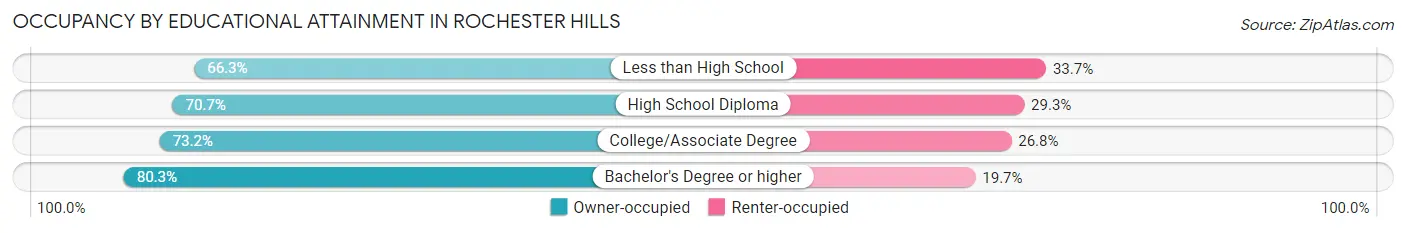
| Household Size | Owner-occupied | Renter-occupied |
| Less than High School | 453 (66.3%) | 230 (33.7%) |
| High School Diploma | 2,656 (70.7%) | 1,103 (29.3%) |
| College/Associate Degree | 4,375 (73.2%) | 1,601 (26.8%) |
| Bachelor's Degree or higher | 14,918 (80.3%) | 3,652 (19.7%) |
Occupancy by Age of Householder in Rochester Hills
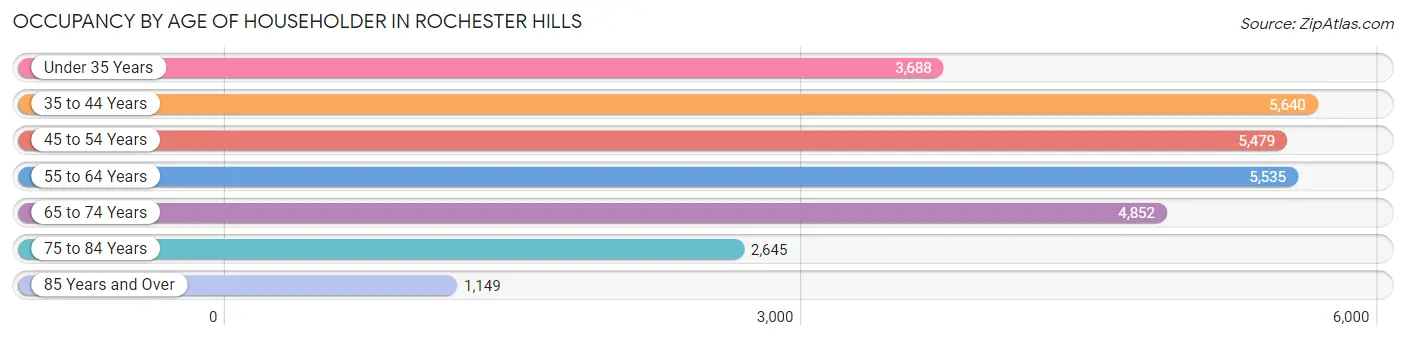
| Age Bracket | # Households | % Households |
| Under 35 Years | 3,688 | 12.7% |
| 35 to 44 Years | 5,640 | 19.5% |
| 45 to 54 Years | 5,479 | 18.9% |
| 55 to 64 Years | 5,535 | 19.1% |
| 65 to 74 Years | 4,852 | 16.7% |
| 75 to 84 Years | 2,645 | 9.1% |
| 85 Years and Over | 1,149 | 4.0% |
| Total | 28,988 | 100.0% |
Housing Finances in Rochester Hills
Median Income by Occupancy in Rochester Hills
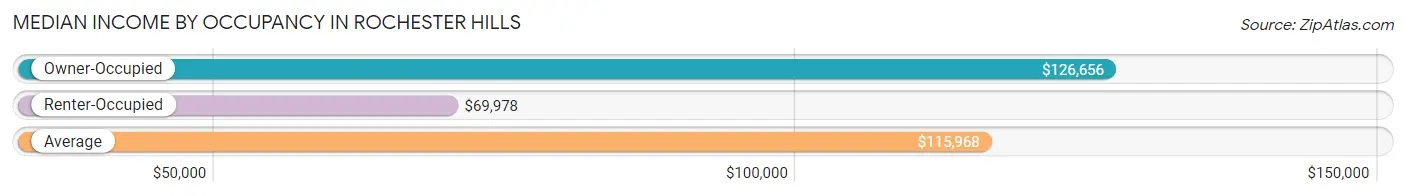
| Occupancy Type | # Households | Median Income |
| Owner-Occupied | 22,402 (77.3%) | $126,656 |
| Renter-Occupied | 6,586 (22.7%) | $69,978 |
| Average | 28,988 (100.0%) | $115,968 |
Occupancy by Householder Income Bracket in Rochester Hills
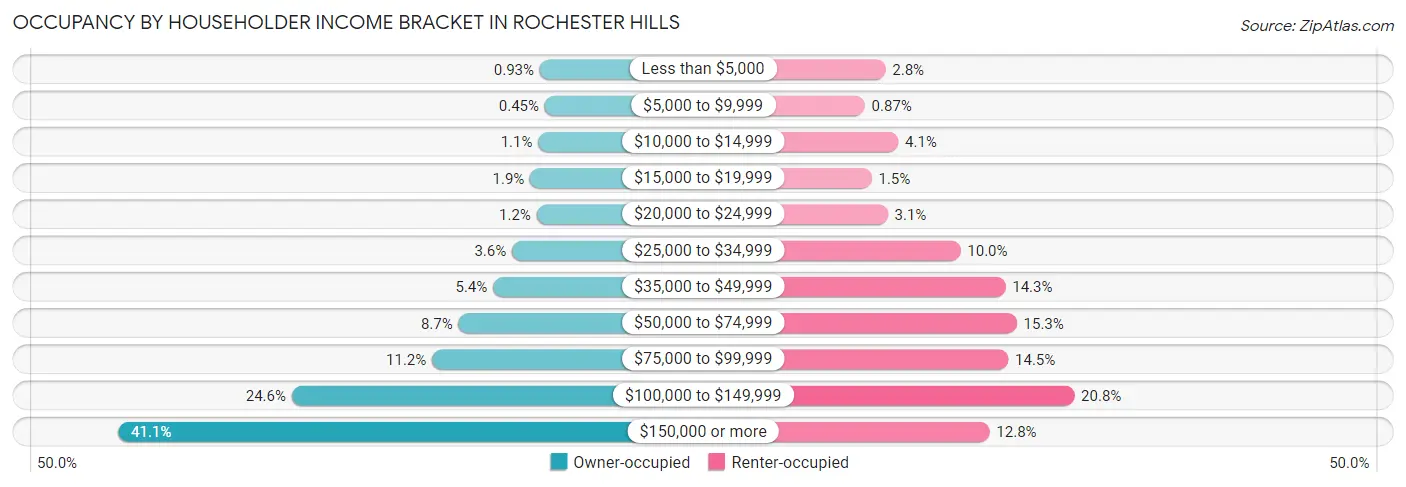
| Income Bracket | Owner-occupied | Renter-occupied |
| Less than $5,000 | 209 (0.9%) | 187 (2.8%) |
| $5,000 to $9,999 | 101 (0.4%) | 57 (0.9%) |
| $10,000 to $14,999 | 241 (1.1%) | 267 (4.1%) |
| $15,000 to $19,999 | 414 (1.8%) | 100 (1.5%) |
| $20,000 to $24,999 | 275 (1.2%) | 201 (3.0%) |
| $25,000 to $34,999 | 802 (3.6%) | 657 (10.0%) |
| $35,000 to $49,999 | 1,206 (5.4%) | 939 (14.3%) |
| $50,000 to $74,999 | 1,942 (8.7%) | 1,010 (15.3%) |
| $75,000 to $99,999 | 2,506 (11.2%) | 957 (14.5%) |
| $100,000 to $149,999 | 5,500 (24.5%) | 1,371 (20.8%) |
| $150,000 or more | 9,206 (41.1%) | 840 (12.8%) |
| Total | 22,402 (100.0%) | 6,586 (100.0%) |
Monthly Housing Cost Tiers in Rochester Hills
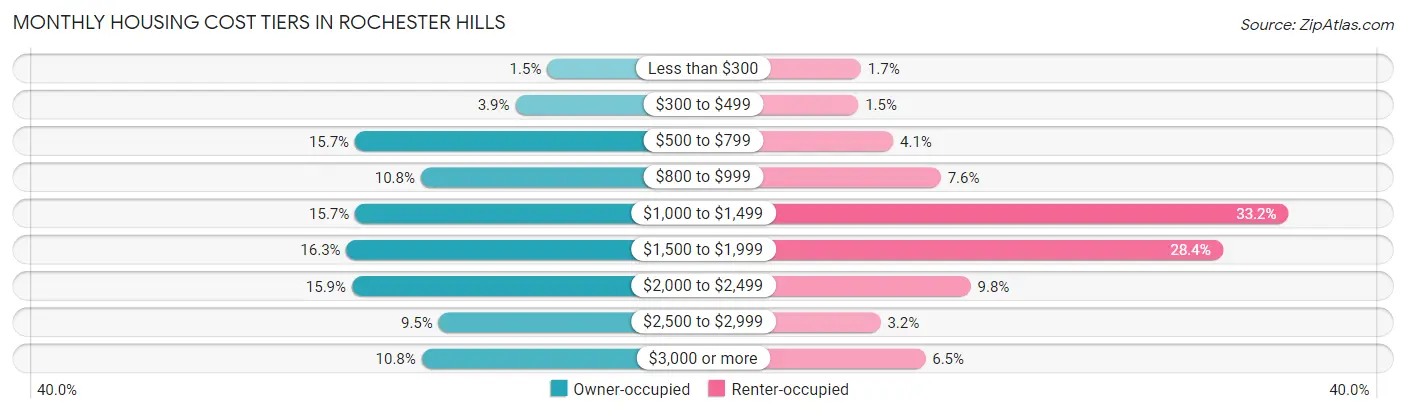
| Monthly Cost | Owner-occupied | Renter-occupied |
| Less than $300 | 339 (1.5%) | 114 (1.7%) |
| $300 to $499 | 865 (3.9%) | 101 (1.5%) |
| $500 to $799 | 3,511 (15.7%) | 270 (4.1%) |
| $800 to $999 | 2,425 (10.8%) | 501 (7.6%) |
| $1,000 to $1,499 | 3,509 (15.7%) | 2,187 (33.2%) |
| $1,500 to $1,999 | 3,651 (16.3%) | 1,868 (28.4%) |
| $2,000 to $2,499 | 3,561 (15.9%) | 646 (9.8%) |
| $2,500 to $2,999 | 2,130 (9.5%) | 209 (3.2%) |
| $3,000 or more | 2,411 (10.8%) | 426 (6.5%) |
| Total | 22,402 (100.0%) | 6,586 (100.0%) |
Physical Housing Characteristics in Rochester Hills
Housing Structures in Rochester Hills
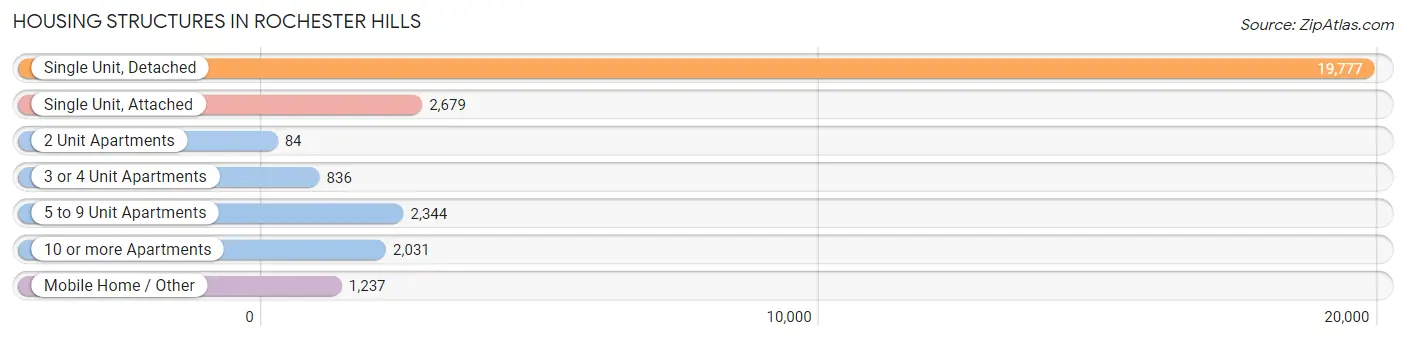
| Structure Type | # Housing Units | % Housing Units |
| Single Unit, Detached | 19,777 | 68.2% |
| Single Unit, Attached | 2,679 | 9.2% |
| 2 Unit Apartments | 84 | 0.3% |
| 3 or 4 Unit Apartments | 836 | 2.9% |
| 5 to 9 Unit Apartments | 2,344 | 8.1% |
| 10 or more Apartments | 2,031 | 7.0% |
| Mobile Home / Other | 1,237 | 4.3% |
| Total | 28,988 | 100.0% |
Housing Structures by Occupancy in Rochester Hills
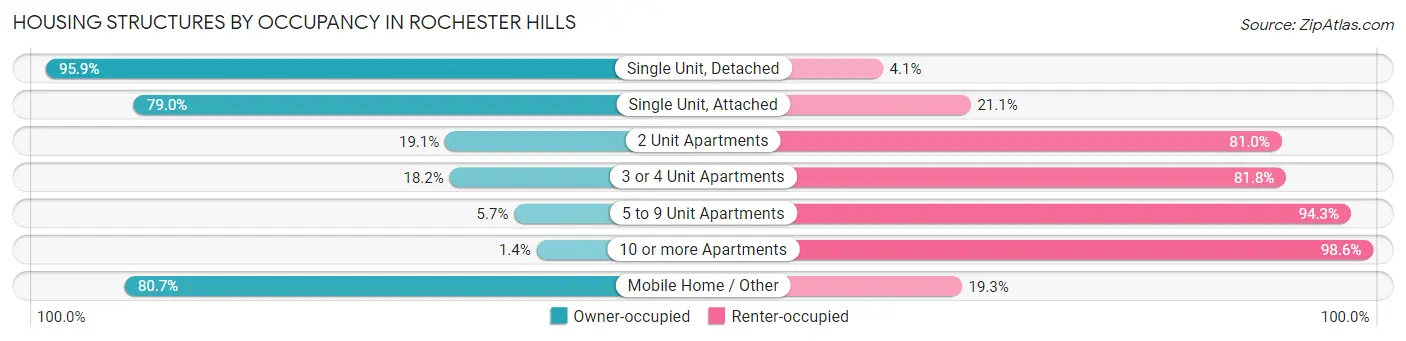
| Structure Type | Owner-occupied | Renter-occupied |
| Single Unit, Detached | 18,958 (95.9%) | 819 (4.1%) |
| Single Unit, Attached | 2,115 (78.9%) | 564 (21.0%) |
| 2 Unit Apartments | 16 (19.1%) | 68 (80.9%) |
| 3 or 4 Unit Apartments | 152 (18.2%) | 684 (81.8%) |
| 5 to 9 Unit Apartments | 134 (5.7%) | 2,210 (94.3%) |
| 10 or more Apartments | 29 (1.4%) | 2,002 (98.6%) |
| Mobile Home / Other | 998 (80.7%) | 239 (19.3%) |
| Total | 22,402 (77.3%) | 6,586 (22.7%) |
Housing Structures by Number of Rooms in Rochester Hills
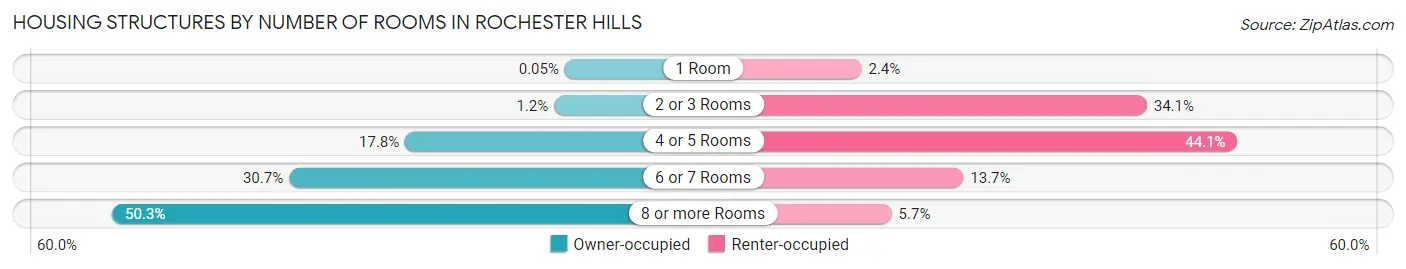
| Number of Rooms | Owner-occupied | Renter-occupied |
| 1 Room | 12 (0.1%) | 158 (2.4%) |
| 2 or 3 Rooms | 275 (1.2%) | 2,243 (34.1%) |
| 4 or 5 Rooms | 3,980 (17.8%) | 2,905 (44.1%) |
| 6 or 7 Rooms | 6,868 (30.7%) | 902 (13.7%) |
| 8 or more Rooms | 11,267 (50.3%) | 378 (5.7%) |
| Total | 22,402 (100.0%) | 6,586 (100.0%) |
Housing Structure by Heating Type in Rochester Hills
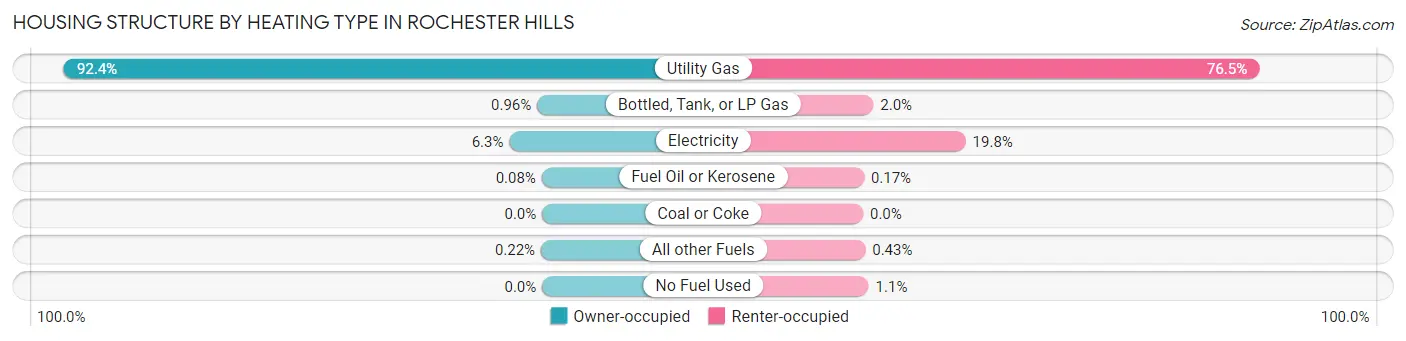
| Heating Type | Owner-occupied | Renter-occupied |
| Utility Gas | 20,699 (92.4%) | 5,039 (76.5%) |
| Bottled, Tank, or LP Gas | 215 (1.0%) | 131 (2.0%) |
| Electricity | 1,420 (6.3%) | 1,306 (19.8%) |
| Fuel Oil or Kerosene | 18 (0.1%) | 11 (0.2%) |
| Coal or Coke | 0 (0.0%) | 0 (0.0%) |
| All other Fuels | 50 (0.2%) | 28 (0.4%) |
| No Fuel Used | 0 (0.0%) | 71 (1.1%) |
| Total | 22,402 (100.0%) | 6,586 (100.0%) |
Household Vehicle Usage in Rochester Hills
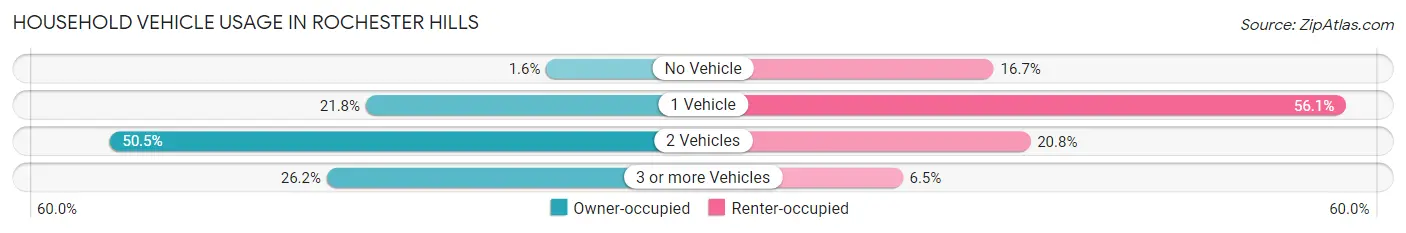
| Vehicles per Household | Owner-occupied | Renter-occupied |
| No Vehicle | 349 (1.6%) | 1,097 (16.7%) |
| 1 Vehicle | 4,878 (21.8%) | 3,697 (56.1%) |
| 2 Vehicles | 11,316 (50.5%) | 1,367 (20.8%) |
| 3 or more Vehicles | 5,859 (26.2%) | 425 (6.5%) |
| Total | 22,402 (100.0%) | 6,586 (100.0%) |
Real Estate & Mortgages in Rochester Hills
Real Estate and Mortgage Overview in Rochester Hills
| Characteristic | Without Mortgage | With Mortgage |
| Housing Units | 7,815 | 14,587 |
| Median Property Value | $314,200 | $378,700 |
| Median Household Income | $98,686 | $6,807 |
| Monthly Housing Costs | $766 | $2,398 |
| Real Estate Taxes | $3,966 | $410 |
Property Value by Mortgage Status in Rochester Hills
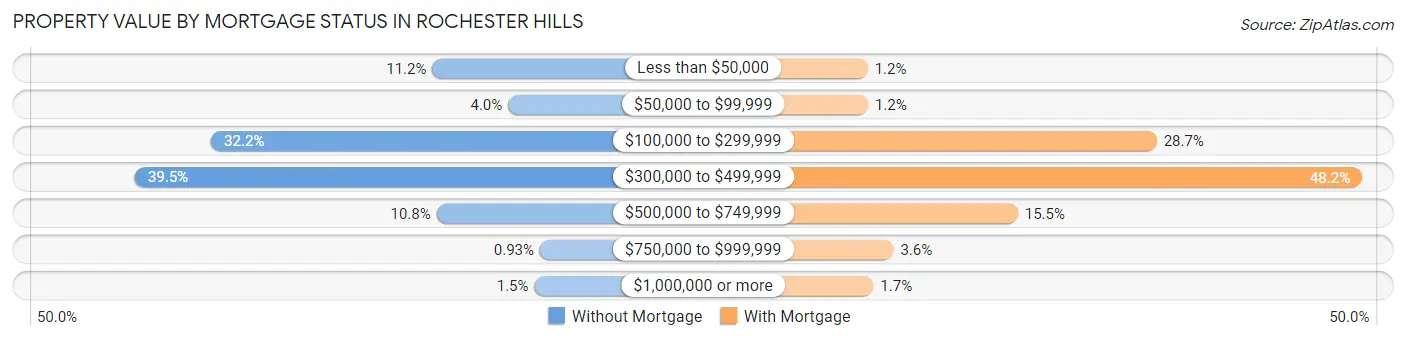
| Property Value | Without Mortgage | With Mortgage |
| Less than $50,000 | 873 (11.2%) | 169 (1.2%) |
| $50,000 to $99,999 | 309 (4.0%) | 172 (1.2%) |
| $100,000 to $299,999 | 2,519 (32.2%) | 4,183 (28.7%) |
| $300,000 to $499,999 | 3,086 (39.5%) | 7,035 (48.2%) |
| $500,000 to $749,999 | 842 (10.8%) | 2,254 (15.4%) |
| $750,000 to $999,999 | 73 (0.9%) | 526 (3.6%) |
| $1,000,000 or more | 113 (1.5%) | 248 (1.7%) |
| Total | 7,815 (100.0%) | 14,587 (100.0%) |
Household Income by Mortgage Status in Rochester Hills
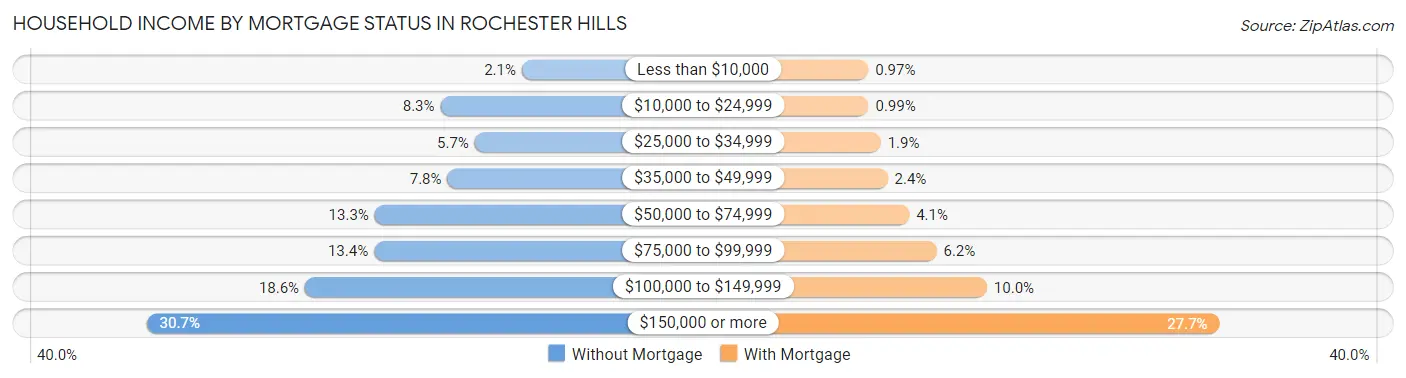
| Household Income | Without Mortgage | With Mortgage |
| Less than $10,000 | 166 (2.1%) | 142 (1.0%) |
| $10,000 to $24,999 | 650 (8.3%) | 144 (1.0%) |
| $25,000 to $34,999 | 446 (5.7%) | 280 (1.9%) |
| $35,000 to $49,999 | 609 (7.8%) | 356 (2.4%) |
| $50,000 to $74,999 | 1,042 (13.3%) | 597 (4.1%) |
| $75,000 to $99,999 | 1,046 (13.4%) | 900 (6.2%) |
| $100,000 to $149,999 | 1,457 (18.6%) | 1,460 (10.0%) |
| $150,000 or more | 2,399 (30.7%) | 4,043 (27.7%) |
| Total | 7,815 (100.0%) | 14,587 (100.0%) |
Property Value to Household Income Ratio in Rochester Hills
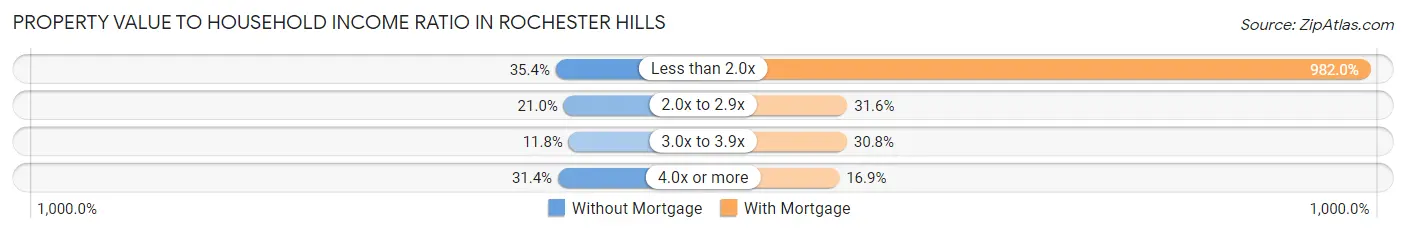
| Value-to-Income Ratio | Without Mortgage | With Mortgage |
| Less than 2.0x | 2,767 (35.4%) | 143,250 (982.0%) |
| 2.0x to 2.9x | 1,641 (21.0%) | 4,616 (31.6%) |
| 3.0x to 3.9x | 925 (11.8%) | 4,489 (30.8%) |
| 4.0x or more | 2,453 (31.4%) | 2,468 (16.9%) |
| Total | 7,815 (100.0%) | 14,587 (100.0%) |
Real Estate Taxes by Mortgage Status in Rochester Hills
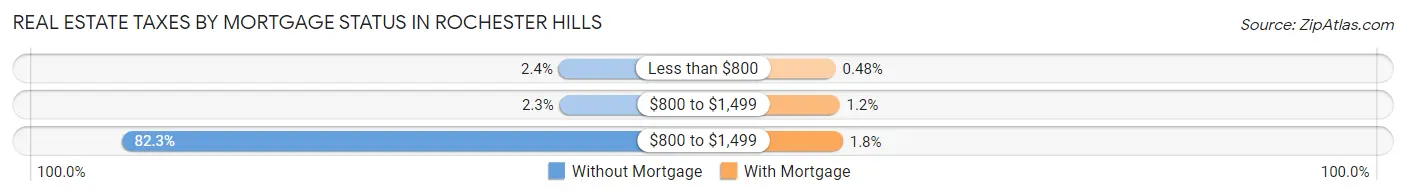
| Property Taxes | Without Mortgage | With Mortgage |
| Less than $800 | 191 (2.4%) | 70 (0.5%) |
| $800 to $1,499 | 180 (2.3%) | 174 (1.2%) |
| $800 to $1,499 | 6,430 (82.3%) | 260 (1.8%) |
| Total | 7,815 (100.0%) | 14,587 (100.0%) |
Health & Disability in Rochester Hills
Health Insurance Coverage by Age in Rochester Hills
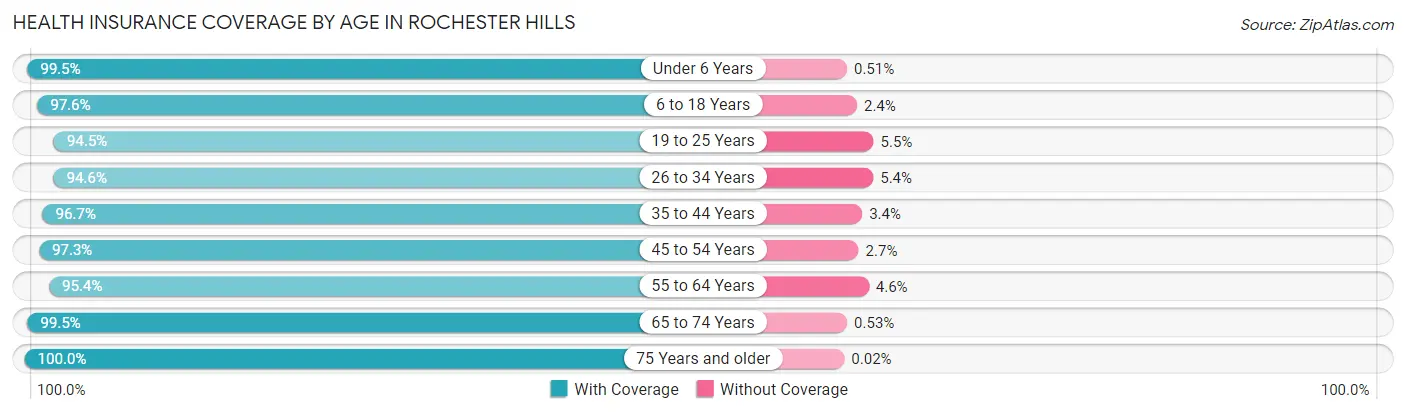
| Age Bracket | With Coverage | Without Coverage |
| Under 6 Years | 5,087 (99.5%) | 26 (0.5%) |
| 6 to 18 Years | 12,999 (97.6%) | 317 (2.4%) |
| 19 to 25 Years | 5,863 (94.5%) | 339 (5.5%) |
| 26 to 34 Years | 6,491 (94.6%) | 371 (5.4%) |
| 35 to 44 Years | 10,468 (96.7%) | 363 (3.4%) |
| 45 to 54 Years | 9,665 (97.3%) | 266 (2.7%) |
| 55 to 64 Years | 9,587 (95.4%) | 460 (4.6%) |
| 65 to 74 Years | 7,825 (99.5%) | 42 (0.5%) |
| 75 Years and older | 5,330 (100.0%) | 1 (0.0%) |
| Total | 73,315 (97.1%) | 2,185 (2.9%) |
Health Insurance Coverage by Citizenship Status in Rochester Hills
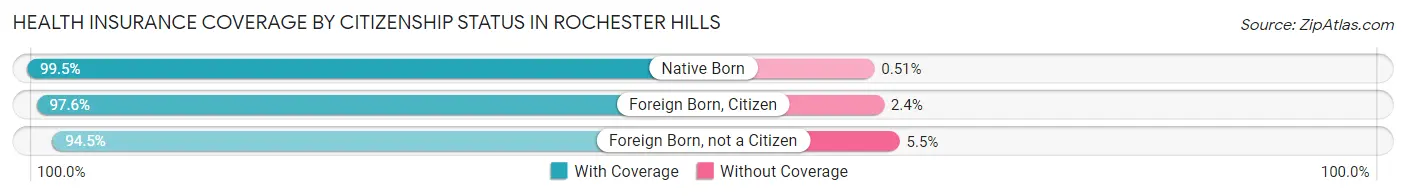
| Citizenship Status | With Coverage | Without Coverage |
| Native Born | 5,087 (99.5%) | 26 (0.5%) |
| Foreign Born, Citizen | 12,999 (97.6%) | 317 (2.4%) |
| Foreign Born, not a Citizen | 5,863 (94.5%) | 339 (5.5%) |
Health Insurance Coverage by Household Income in Rochester Hills
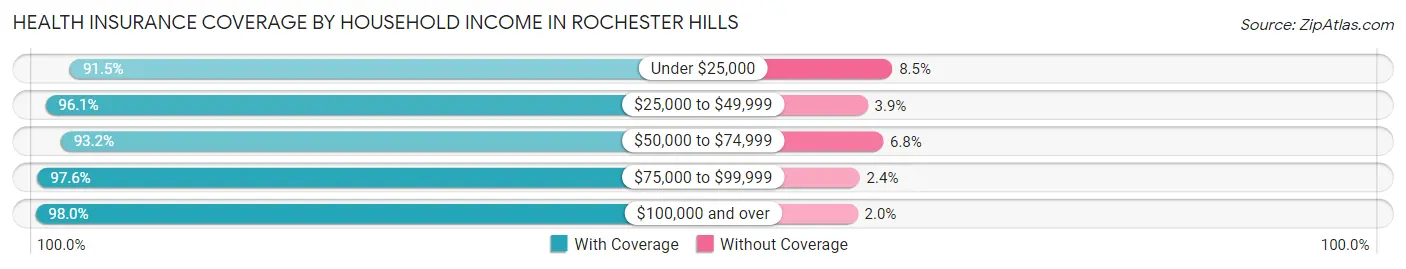
| Household Income | With Coverage | Without Coverage |
| Under $25,000 | 3,009 (91.5%) | 280 (8.5%) |
| $25,000 to $49,999 | 5,416 (96.1%) | 219 (3.9%) |
| $50,000 to $74,999 | 5,086 (93.2%) | 370 (6.8%) |
| $75,000 to $99,999 | 7,413 (97.6%) | 183 (2.4%) |
| $100,000 and over | 51,084 (98.0%) | 1,053 (2.0%) |
Public vs Private Health Insurance Coverage by Age in Rochester Hills
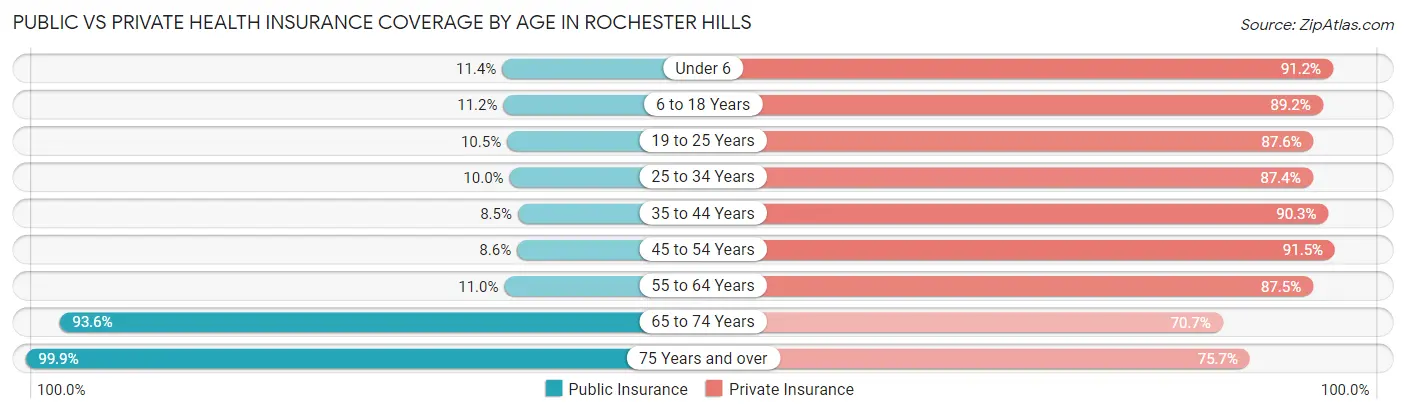
| Age Bracket | Public Insurance | Private Insurance |
| Under 6 | 582 (11.4%) | 4,661 (91.2%) |
| 6 to 18 Years | 1,485 (11.2%) | 11,883 (89.2%) |
| 19 to 25 Years | 649 (10.5%) | 5,431 (87.6%) |
| 25 to 34 Years | 687 (10.0%) | 5,995 (87.4%) |
| 35 to 44 Years | 915 (8.5%) | 9,780 (90.3%) |
| 45 to 54 Years | 855 (8.6%) | 9,089 (91.5%) |
| 55 to 64 Years | 1,101 (11.0%) | 8,787 (87.5%) |
| 65 to 74 Years | 7,360 (93.6%) | 5,561 (70.7%) |
| 75 Years and over | 5,324 (99.9%) | 4,037 (75.7%) |
| Total | 18,958 (25.1%) | 65,224 (86.4%) |
Disability Status by Sex by Age in Rochester Hills
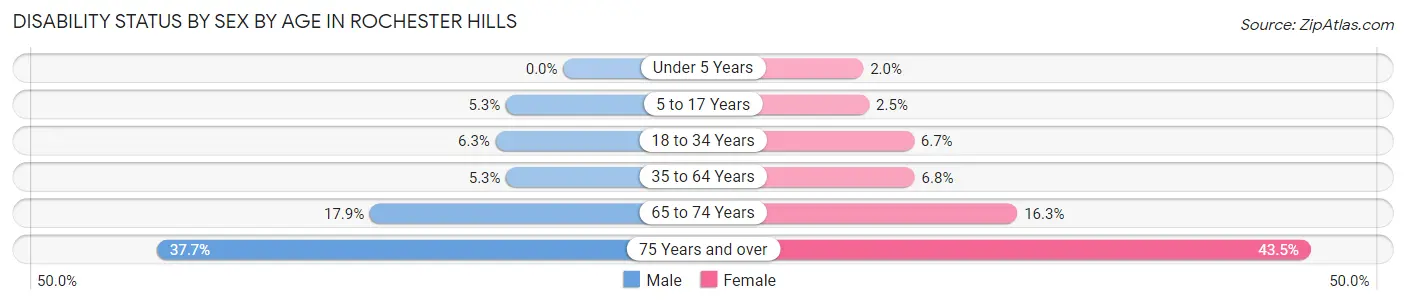
| Age Bracket | Male | Female |
| Under 5 Years | 0 (0.0%) | 41 (2.0%) |
| 5 to 17 Years | 321 (5.3%) | 175 (2.5%) |
| 18 to 34 Years | 465 (6.3%) | 471 (6.7%) |
| 35 to 64 Years | 823 (5.3%) | 1,030 (6.8%) |
| 65 to 74 Years | 654 (17.9%) | 687 (16.3%) |
| 75 Years and over | 765 (37.7%) | 1,437 (43.5%) |
Disability Class by Sex by Age in Rochester Hills
Disability Class: Hearing Difficulty
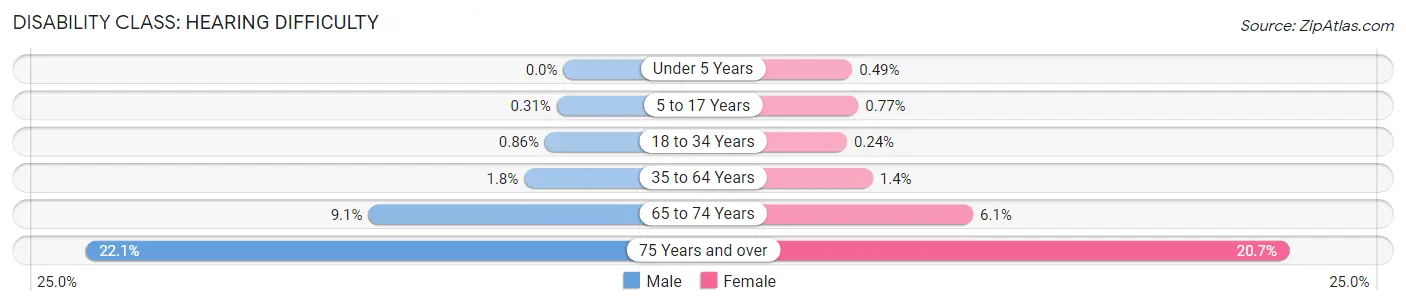
| Age Bracket | Male | Female |
| Under 5 Years | 0 (0.0%) | 10 (0.5%) |
| 5 to 17 Years | 19 (0.3%) | 53 (0.8%) |
| 18 to 34 Years | 64 (0.9%) | 17 (0.2%) |
| 35 to 64 Years | 284 (1.8%) | 219 (1.4%) |
| 65 to 74 Years | 330 (9.0%) | 257 (6.1%) |
| 75 Years and over | 449 (22.1%) | 685 (20.7%) |
Disability Class: Vision Difficulty
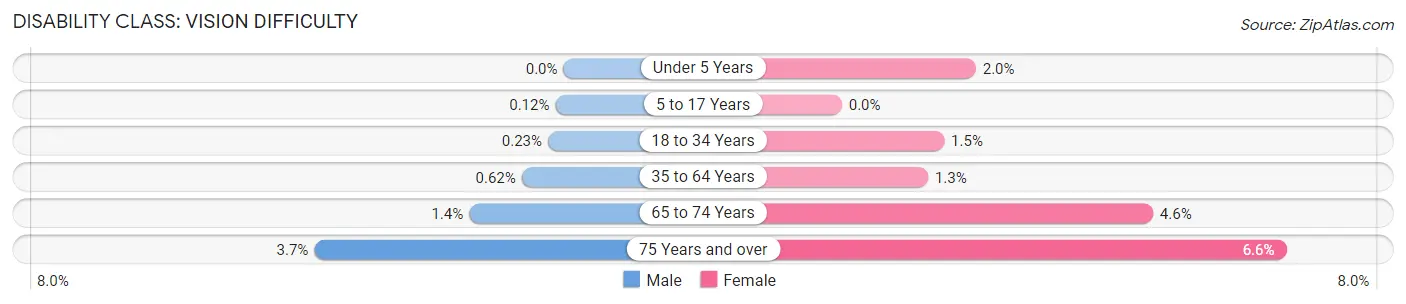
| Age Bracket | Male | Female |
| Under 5 Years | 0 (0.0%) | 41 (2.0%) |
| 5 to 17 Years | 7 (0.1%) | 0 (0.0%) |
| 18 to 34 Years | 17 (0.2%) | 107 (1.5%) |
| 35 to 64 Years | 97 (0.6%) | 195 (1.3%) |
| 65 to 74 Years | 51 (1.4%) | 195 (4.6%) |
| 75 Years and over | 75 (3.7%) | 218 (6.6%) |
Disability Class: Cognitive Difficulty
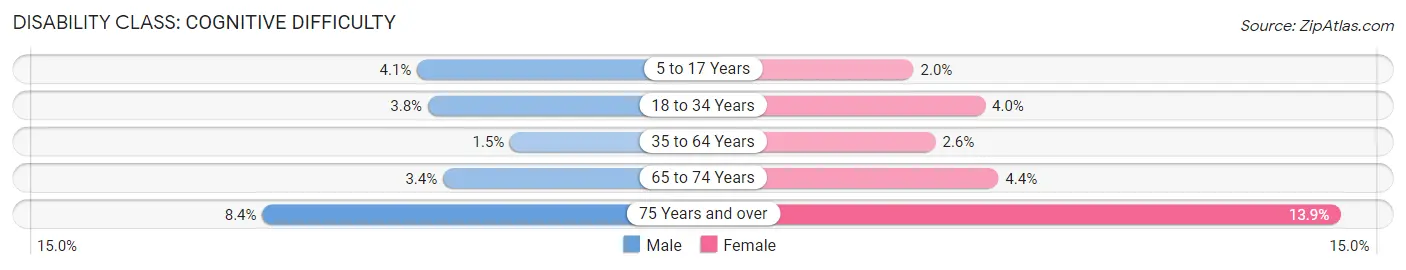
| Age Bracket | Male | Female |
| 5 to 17 Years | 246 (4.1%) | 138 (2.0%) |
| 18 to 34 Years | 279 (3.8%) | 281 (4.0%) |
| 35 to 64 Years | 230 (1.5%) | 398 (2.6%) |
| 65 to 74 Years | 122 (3.4%) | 184 (4.4%) |
| 75 Years and over | 170 (8.4%) | 459 (13.9%) |
Disability Class: Ambulatory Difficulty

| Age Bracket | Male | Female |
| 5 to 17 Years | 105 (1.7%) | 16 (0.2%) |
| 18 to 34 Years | 71 (1.0%) | 123 (1.8%) |
| 35 to 64 Years | 393 (2.5%) | 586 (3.8%) |
| 65 to 74 Years | 312 (8.6%) | 468 (11.1%) |
| 75 Years and over | 451 (22.2%) | 1,038 (31.4%) |
Disability Class: Self-Care Difficulty
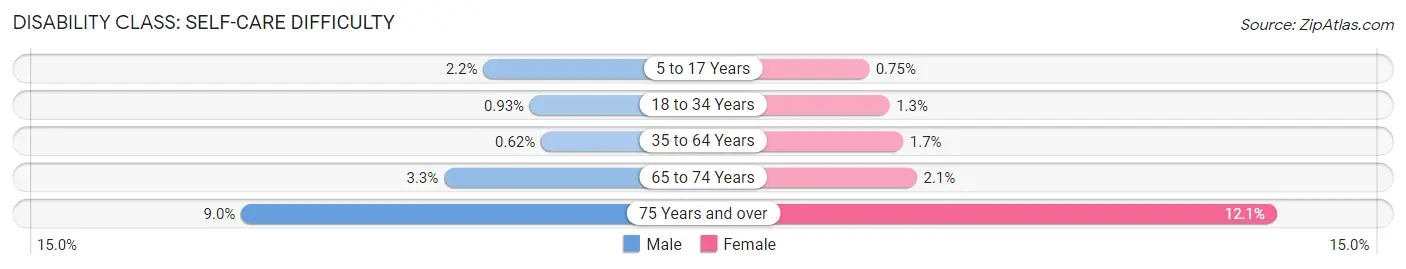
| Age Bracket | Male | Female |
| 5 to 17 Years | 135 (2.2%) | 52 (0.7%) |
| 18 to 34 Years | 69 (0.9%) | 93 (1.3%) |
| 35 to 64 Years | 96 (0.6%) | 259 (1.7%) |
| 65 to 74 Years | 121 (3.3%) | 88 (2.1%) |
| 75 Years and over | 182 (9.0%) | 400 (12.1%) |
Technology Access in Rochester Hills
Computing Device Access in Rochester Hills
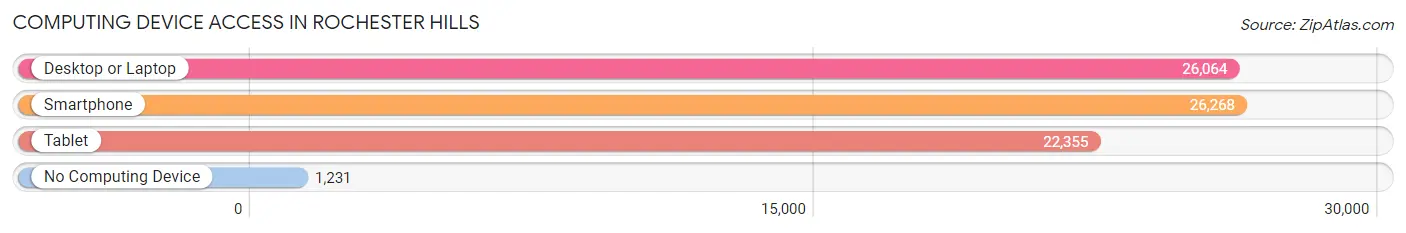
| Device Type | # Households | % Households |
| Desktop or Laptop | 26,064 | 89.9% |
| Smartphone | 26,268 | 90.6% |
| Tablet | 22,355 | 77.1% |
| No Computing Device | 1,231 | 4.3% |
| Total | 28,988 | 100.0% |
Internet Access in Rochester Hills
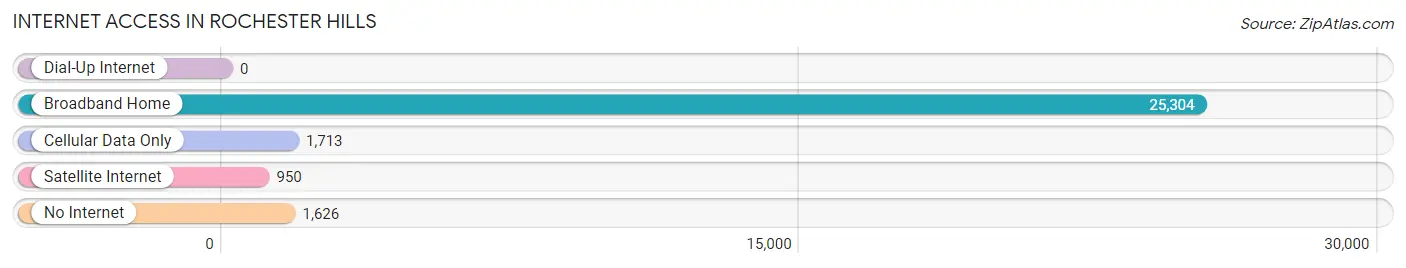
| Internet Type | # Households | % Households |
| Dial-Up Internet | 0 | 0.0% |
| Broadband Home | 25,304 | 87.3% |
| Cellular Data Only | 1,713 | 5.9% |
| Satellite Internet | 950 | 3.3% |
| No Internet | 1,626 | 5.6% |
| Total | 28,988 | 100.0% |
Rochester Hills Summary
Rochester Hills, Michigan is a city located in Oakland County, Michigan. It is a suburb of Detroit and is part of the Metro Detroit area. The city has a population of approximately 70,995 people as of the 2020 census.
History
Rochester Hills was first settled in 1817 by James Graham, a settler from New York. The area was originally known as Graham’s Corners, and was later renamed Rochester in 1817. The area was incorporated as a village in 1827, and was later incorporated as a city in 1967.
Geography
Rochester Hills is located in southeastern Michigan, approximately 25 miles north of Detroit. It is bordered by the cities of Troy, Auburn Hills, and Rochester. The city covers an area of approximately 33.2 square miles, and has a population density of 2,093 people per square mile.
Economy
Rochester Hills is home to a variety of businesses and industries. The city is home to several large employers, including DTE Energy, Flagstar Bank, and St. John Providence Health System. The city also has a thriving retail sector, with several shopping centers and malls located in the area.
Demographics
As of the 2020 census, Rochester Hills had a population of 70,995 people. The racial makeup of the city was 87.2% White, 5.3% African American, 0.4% Native American, 3.7% Asian, and 2.4% from other races. The median household income in the city was $87,945, and the median age was 40.7 years.
Conclusion
Rochester Hills, Michigan is a city located in Oakland County, Michigan. It is a suburb of Detroit and is part of the Metro Detroit area. The city has a population of approximately 70,995 people as of the 2020 census. The city was first settled in 1817, and was later incorporated as a village in 1827 and as a city in 1967. Rochester Hills is home to a variety of businesses and industries, and has a thriving retail sector. The city has a population that is 87.2% White, 5.3% African American, 0.4% Native American, 3.7% Asian, and 2.4% from other races. The median household income in the city was $87,945, and the median age was 40.7 years.
Common Questions
What is Per Capita Income in Rochester Hills?
Per Capita income in Rochester Hills is $55,343.
What is the Median Family Income in Rochester Hills?
Median Family Income in Rochester Hills is $138,781.
What is the Median Household income in Rochester Hills?
Median Household Income in Rochester Hills is $115,968.
What is Income or Wage Gap in Rochester Hills?
Income or Wage Gap in Rochester Hills is 56.9%.
Women in Rochester Hills earn 43.1 cents for every dollar earned by a man.
What is Family Income Deficit in Rochester Hills?
Family Income Deficit in Rochester Hills is $10,805.
Families that are below poverty line in Rochester Hills earn $10,805 less on average than the poverty threshold level.
What is Inequality or Gini Index in Rochester Hills?
Inequality or Gini Index in Rochester Hills is 0.41.
What is the Total Population of Rochester Hills?
Total Population of Rochester Hills is 76,041.
What is the Total Male Population of Rochester Hills?
Total Male Population of Rochester Hills is 36,879.
What is the Total Female Population of Rochester Hills?
Total Female Population of Rochester Hills is 39,162.
What is the Ratio of Males per 100 Females in Rochester Hills?
There are 94.17 Males per 100 Females in Rochester Hills.
What is the Ratio of Females per 100 Males in Rochester Hills?
There are 106.19 Females per 100 Males in Rochester Hills.
What is the Median Population Age in Rochester Hills?
Median Population Age in Rochester Hills is 40.9 Years.
What is the Average Family Size in Rochester Hills
Average Family Size in Rochester Hills is 3.1 People.
What is the Average Household Size in Rochester Hills
Average Household Size in Rochester Hills is 2.6 People.
How Large is the Labor Force in Rochester Hills?
There are 39,173 People in the Labor Forcein in Rochester Hills.
What is the Percentage of People in the Labor Force in Rochester Hills?
64.1% of People are in the Labor Force in Rochester Hills.
What is the Unemployment Rate in Rochester Hills?
Unemployment Rate in Rochester Hills is 3.9%.