Wedgewood, MI Map & Demographics
Wedgewood Map
Wedgewood Overview
$43,606
PER CAPITA INCOME
$129,167
AVG FAMILY INCOME
$125,938
AVG HOUSEHOLD INCOME
0.34
INEQUALITY / GINI INDEX
250
TOTAL POPULATION
117
MALE POPULATION
133
FEMALE POPULATION
87.97
MALES / 100 FEMALES
113.68
FEMALES / 100 MALES
58.3
MEDIAN AGE
3.0
AVG FAMILY SIZE
2.8
AVG HOUSEHOLD SIZE
98
LABOR FORCE [ PEOPLE ]
44.5%
PERCENT IN LABOR FORCE
Income in Wedgewood
Income Overview in Wedgewood
Per Capita Income in Wedgewood is $43,606, while median incomes of families and households are $129,167 and $125,938 respectively.
| Characteristic | Number | Measure |
| Per Capita Income | 250 | $43,606 |
| Median Family Income | 74 | $129,167 |
| Mean Family Income | 74 | $131,946 |
| Median Household Income | 83 | $125,938 |
| Mean Household Income | 83 | $121,219 |
| Income Deficit | 74 | $0 |
| Wage / Income Gap (%) | 250 | 0.00% |
| Wage / Income Gap ($) | 250 | 100.00¢ per $1 |
| Gini / Inequality Index | 250 | 0.34 |
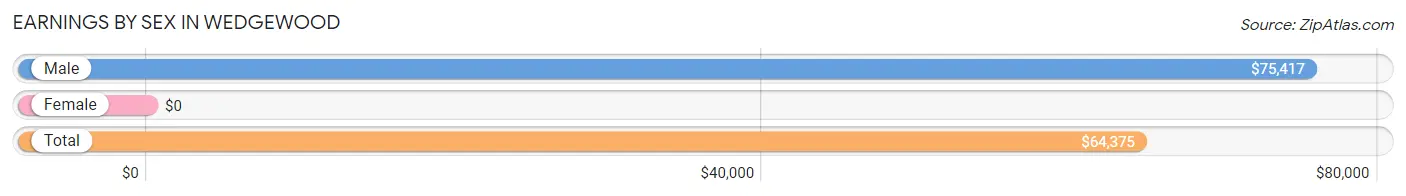
Earnings by Sex in Wedgewood
| Sex | Number | Average Earnings |
| Male | 56 (47.9%) | $75,417 |
| Female | 61 (52.1%) | $0 |
| Total | 117 (100.0%) | $64,375 |
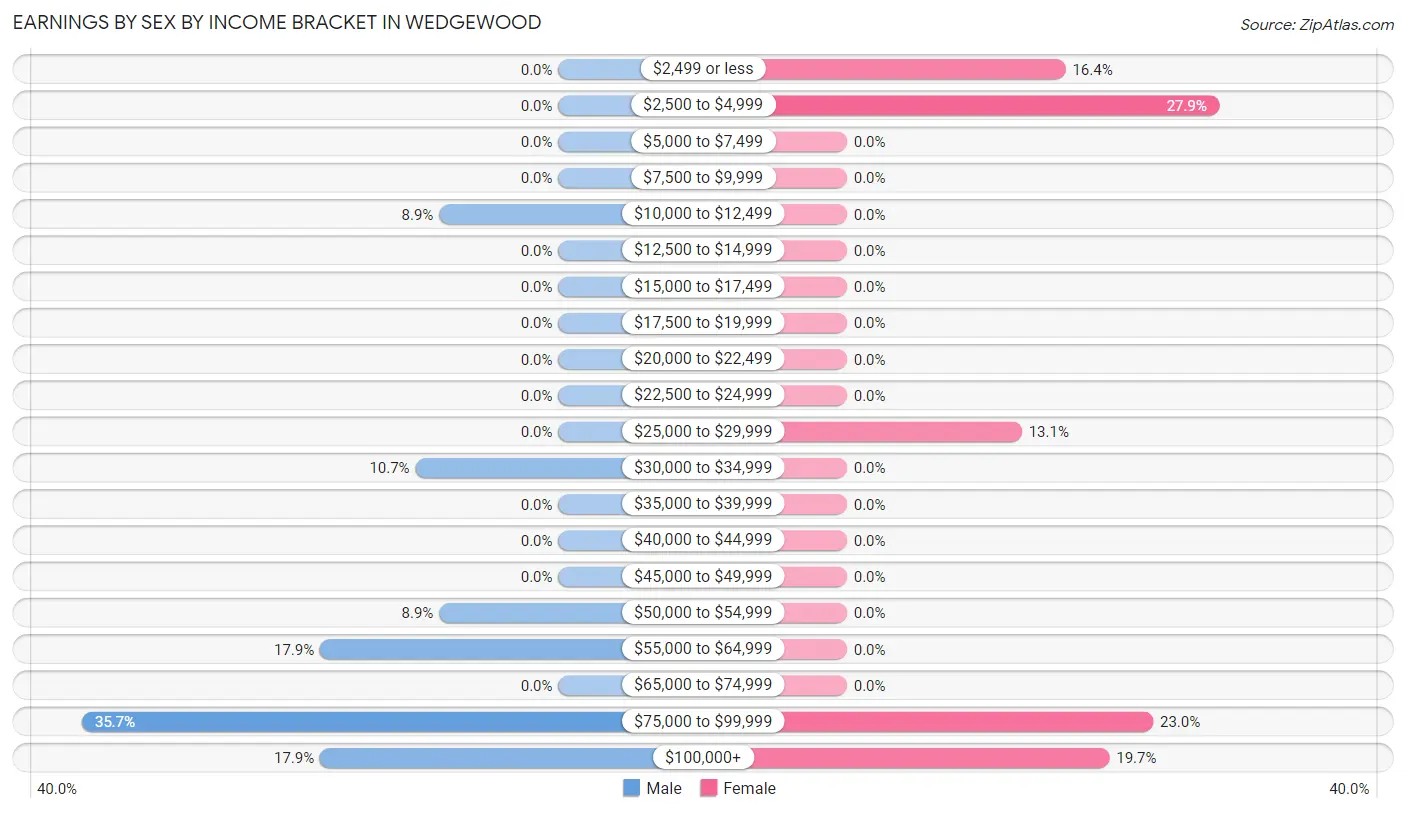
Earnings by Sex by Income Bracket in Wedgewood
The most common earnings brackets in Wedgewood are $75,000 to $99,999 for men (20 | 35.7%) and $2,500 to $4,999 for women (17 | 27.9%).
| Income | Male | Female |
| $2,499 or less | 0 (0.0%) | 10 (16.4%) |
| $2,500 to $4,999 | 0 (0.0%) | 17 (27.9%) |
| $5,000 to $7,499 | 0 (0.0%) | 0 (0.0%) |
| $7,500 to $9,999 | 0 (0.0%) | 0 (0.0%) |
| $10,000 to $12,499 | 5 (8.9%) | 0 (0.0%) |
| $12,500 to $14,999 | 0 (0.0%) | 0 (0.0%) |
| $15,000 to $17,499 | 0 (0.0%) | 0 (0.0%) |
| $17,500 to $19,999 | 0 (0.0%) | 0 (0.0%) |
| $20,000 to $22,499 | 0 (0.0%) | 0 (0.0%) |
| $22,500 to $24,999 | 0 (0.0%) | 0 (0.0%) |
| $25,000 to $29,999 | 0 (0.0%) | 8 (13.1%) |
| $30,000 to $34,999 | 6 (10.7%) | 0 (0.0%) |
| $35,000 to $39,999 | 0 (0.0%) | 0 (0.0%) |
| $40,000 to $44,999 | 0 (0.0%) | 0 (0.0%) |
| $45,000 to $49,999 | 0 (0.0%) | 0 (0.0%) |
| $50,000 to $54,999 | 5 (8.9%) | 0 (0.0%) |
| $55,000 to $64,999 | 10 (17.9%) | 0 (0.0%) |
| $65,000 to $74,999 | 0 (0.0%) | 0 (0.0%) |
| $75,000 to $99,999 | 20 (35.7%) | 14 (23.0%) |
| $100,000+ | 10 (17.9%) | 12 (19.7%) |
| Total | 56 (100.0%) | 61 (100.0%) |
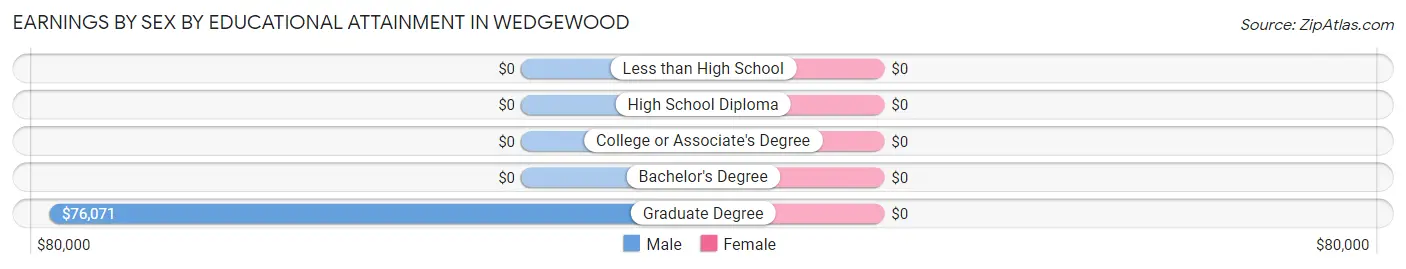
Earnings by Sex by Educational Attainment in Wedgewood
| Educational Attainment | Male Income | Female Income |
| Less than High School | - | - |
| High School Diploma | - | - |
| College or Associate's Degree | - | - |
| Bachelor's Degree | - | - |
| Graduate Degree | $76,071 | $0 |
| Total | $75,714 | $90,938 |
Family Income in Wedgewood
Family Income Brackets in Wedgewood
According to the Wedgewood family income data, there are 21 families falling into the $100,000 to $149,999 income range, which is the most common income bracket and makes up 28.4% of all families.
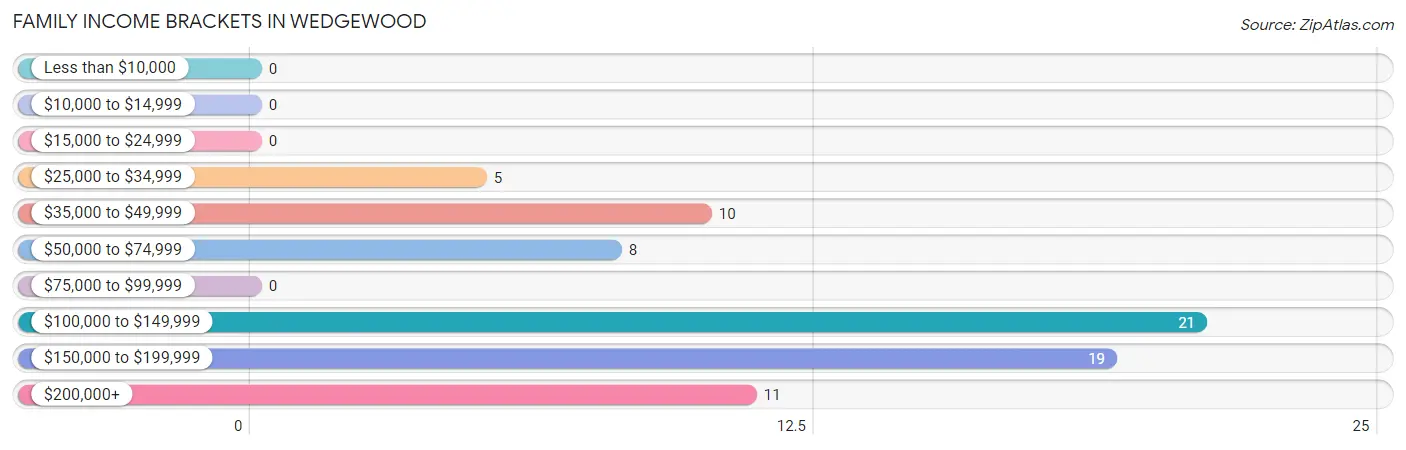
| Income Bracket | # Families | % Families |
| Less than $10,000 | 0 | 0.0% |
| $10,000 to $14,999 | 0 | 0.0% |
| $15,000 to $24,999 | 0 | 0.0% |
| $25,000 to $34,999 | 5 | 6.8% |
| $35,000 to $49,999 | 10 | 13.5% |
| $50,000 to $74,999 | 8 | 10.8% |
| $75,000 to $99,999 | 0 | 0.0% |
| $100,000 to $149,999 | 21 | 28.4% |
| $150,000 to $199,999 | 19 | 25.7% |
| $200,000+ | 11 | 14.9% |
Family Income by Famaliy Size in Wedgewood
3-person families (19 | 25.7%) account for the highest median family income in Wedgewood with $168,958 per family, while 3-person families (19 | 25.7%) have the highest median income of $56,319 per family member.
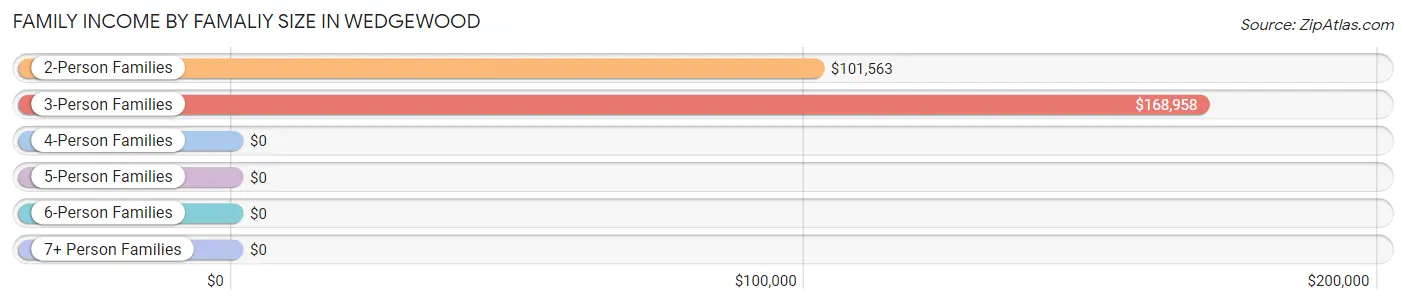
| Income Bracket | # Families | Median Income |
| 2-Person Families | 35 (47.3%) | $101,563 |
| 3-Person Families | 19 (25.7%) | $168,958 |
| 4-Person Families | 12 (16.2%) | $0 |
| 5-Person Families | 8 (10.8%) | $0 |
| 6-Person Families | 0 (0.0%) | $0 |
| 7+ Person Families | 0 (0.0%) | $0 |
| Total | 74 (100.0%) | $129,167 |
Family Income by Number of Earners in Wedgewood
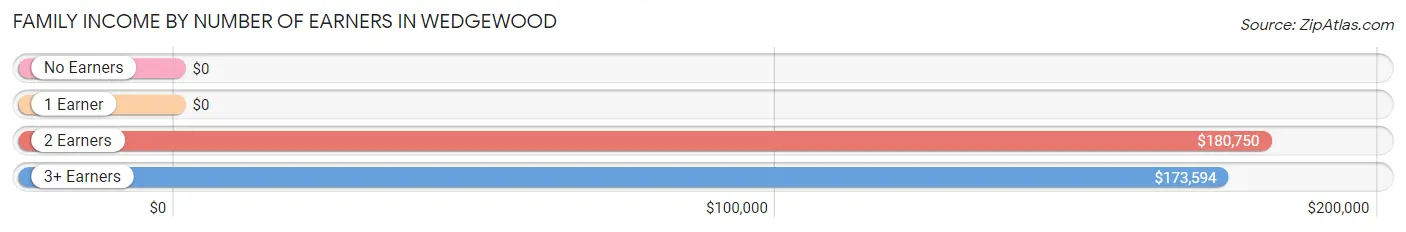
| Number of Earners | # Families | Median Income |
| No Earners | 26 (35.1%) | $0 |
| 1 Earner | 10 (13.5%) | $0 |
| 2 Earners | 15 (20.3%) | $180,750 |
| 3+ Earners | 23 (31.1%) | $173,594 |
| Total | 74 (100.0%) | $129,167 |
Household Income in Wedgewood
Household Income Brackets in Wedgewood
With 21 households falling in the category, the $100,000 to $149,999 income range is the most frequent in Wedgewood, accounting for 25.3% of all households.
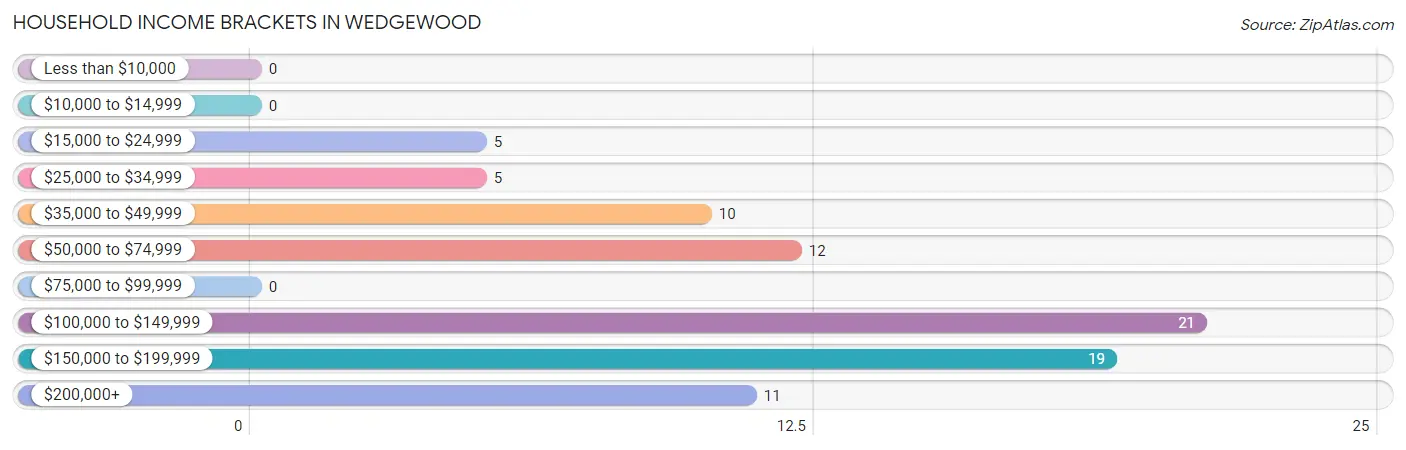
| Income Bracket | # Households | % Households |
| Less than $10,000 | 0 | 0.0% |
| $10,000 to $14,999 | 0 | 0.0% |
| $15,000 to $24,999 | 5 | 6.0% |
| $25,000 to $34,999 | 5 | 6.0% |
| $35,000 to $49,999 | 10 | 12.0% |
| $50,000 to $74,999 | 12 | 14.5% |
| $75,000 to $99,999 | 0 | 0.0% |
| $100,000 to $149,999 | 21 | 25.3% |
| $150,000 to $199,999 | 19 | 22.9% |
| $200,000+ | 11 | 13.3% |
Household Income by Householder Age in Wedgewood
The median household income in Wedgewood is $125,938, with the highest median household income of $153,750 found in the 45 to 64 years age bracket for the primary householder. A total of 36 households (43.4%) fall into this category.
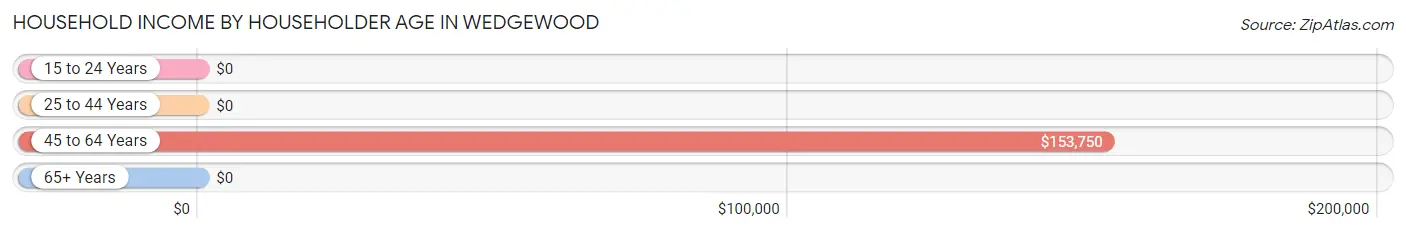
| Income Bracket | # Households | Median Income |
| 15 to 24 Years | 0 (0.0%) | $0 |
| 25 to 44 Years | 8 (9.6%) | $0 |
| 45 to 64 Years | 36 (43.4%) | $153,750 |
| 65+ Years | 39 (47.0%) | $0 |
| Total | 83 (100.0%) | $125,938 |
Poverty in Wedgewood
Income Below Poverty by Sex and Age in Wedgewood
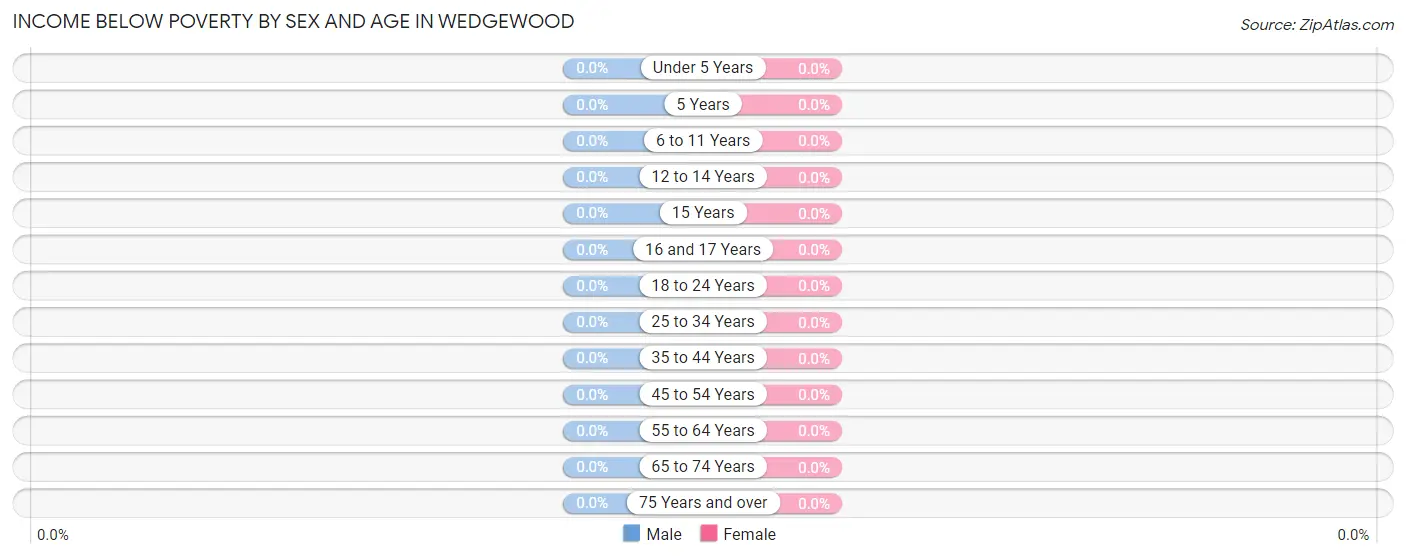
| Age Bracket | Male | Female |
| Under 5 Years | 0 (0.0%) | 0 (0.0%) |
| 5 Years | 0 (0.0%) | 0 (0.0%) |
| 6 to 11 Years | 0 (0.0%) | 0 (0.0%) |
| 12 to 14 Years | 0 (0.0%) | 0 (0.0%) |
| 15 Years | 0 (0.0%) | 0 (0.0%) |
| 16 and 17 Years | 0 (0.0%) | 0 (0.0%) |
| 18 to 24 Years | 0 (0.0%) | 0 (0.0%) |
| 25 to 34 Years | 0 (0.0%) | 0 (0.0%) |
| 35 to 44 Years | 0 (0.0%) | 0 (0.0%) |
| 45 to 54 Years | 0 (0.0%) | 0 (0.0%) |
| 55 to 64 Years | 0 (0.0%) | 0 (0.0%) |
| 65 to 74 Years | 0 (0.0%) | 0 (0.0%) |
| 75 Years and over | 0 (0.0%) | 0 (0.0%) |
| Total | 0 (0.0%) | 0 (0.0%) |
Income Above Poverty by Sex and Age in Wedgewood
According to the poverty statistics in Wedgewood, males aged 6 to 11 years and females aged 12 to 14 years are the age groups that are most secure financially, with 100.0% of males and 100.0% of females in these age groups living above the poverty line.
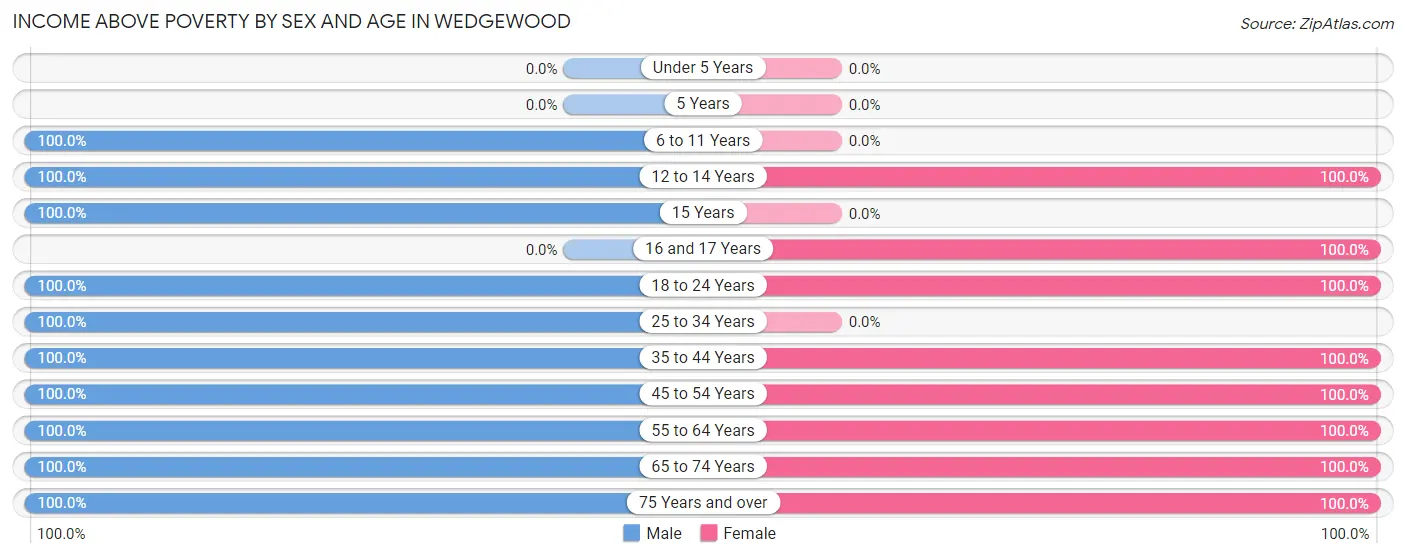
| Age Bracket | Male | Female |
| Under 5 Years | 0 (0.0%) | 0 (0.0%) |
| 5 Years | 0 (0.0%) | 0 (0.0%) |
| 6 to 11 Years | 8 (100.0%) | 0 (0.0%) |
| 12 to 14 Years | 7 (100.0%) | 5 (100.0%) |
| 15 Years | 10 (100.0%) | 0 (0.0%) |
| 16 and 17 Years | 0 (0.0%) | 19 (100.0%) |
| 18 to 24 Years | 10 (100.0%) | 8 (100.0%) |
| 25 to 34 Years | 6 (100.0%) | 0 (0.0%) |
| 35 to 44 Years | 8 (100.0%) | 8 (100.0%) |
| 45 to 54 Years | 7 (100.0%) | 22 (100.0%) |
| 55 to 64 Years | 31 (100.0%) | 16 (100.0%) |
| 65 to 74 Years | 15 (100.0%) | 25 (100.0%) |
| 75 Years and over | 15 (100.0%) | 14 (100.0%) |
| Total | 117 (100.0%) | 117 (100.0%) |
Income Below Poverty Among Married-Couple Families in Wedgewood
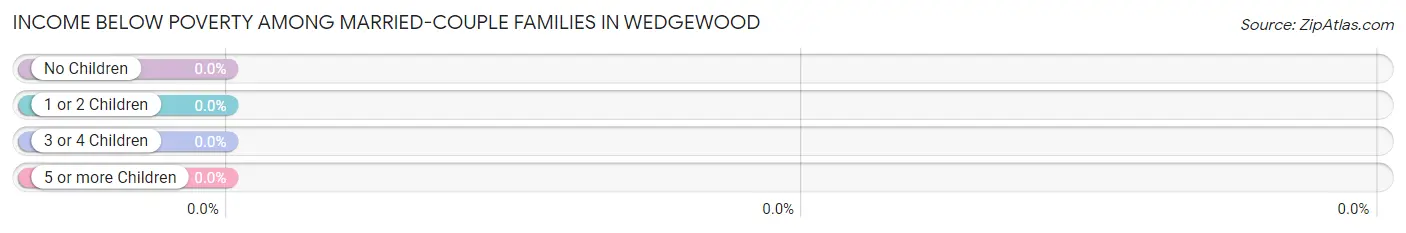
| Children | Above Poverty | Below Poverty |
| No Children | 45 (100.0%) | 0 (0.0%) |
| 1 or 2 Children | 21 (100.0%) | 0 (0.0%) |
| 3 or 4 Children | 8 (100.0%) | 0 (0.0%) |
| 5 or more Children | 0 (0.0%) | 0 (0.0%) |
| Total | 74 (100.0%) | 0 (0.0%) |
Income Below Poverty Among Single-Parent Households in Wedgewood
| Children | Single Father | Single Mother |
| No Children | 0 (0.0%) | 0 (0.0%) |
| 1 or 2 Children | 0 (0.0%) | 0 (0.0%) |
| 3 or 4 Children | 0 (0.0%) | 0 (0.0%) |
| 5 or more Children | 0 (0.0%) | 0 (0.0%) |
| Total | 0 (0.0%) | 0 (0.0%) |
Income Below Poverty Among Married-Couple vs Single-Parent Households in Wedgewood
| Children | Married-Couple Families | Single-Parent Households |
| No Children | 0 (0.0%) | 0 (0.0%) |
| 1 or 2 Children | 0 (0.0%) | 0 (0.0%) |
| 3 or 4 Children | 0 (0.0%) | 0 (0.0%) |
| 5 or more Children | 0 (0.0%) | 0 (0.0%) |
| Total | 0 (0.0%) | 0 (0.0%) |
Race in Wedgewood
The most populous races in Wedgewood are White / Caucasian (234 | 93.6%), and Black / African American (16 | 6.4%).
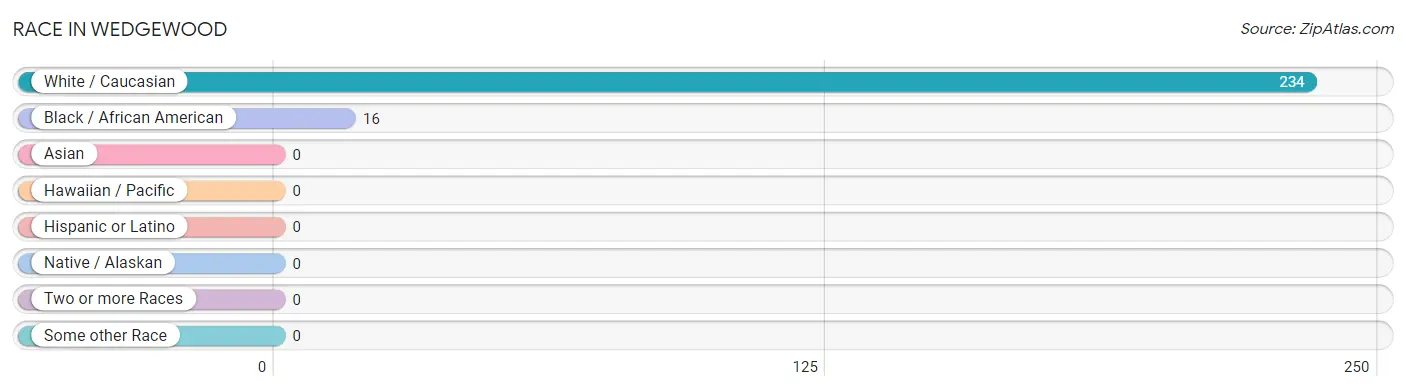
| Race | # Population | % Population |
| Asian | 0 | 0.0% |
| Black / African American | 16 | 6.4% |
| Hawaiian / Pacific | 0 | 0.0% |
| Hispanic or Latino | 0 | 0.0% |
| Native / Alaskan | 0 | 0.0% |
| White / Caucasian | 234 | 93.6% |
| Two or more Races | 0 | 0.0% |
| Some other Race | 0 | 0.0% |
| Total | 250 | 100.0% |
Ancestry in Wedgewood
The most populous ancestries reported in Wedgewood are German (59 | 23.6%), Polish (39 | 15.6%), English (28 | 11.2%), European (22 | 8.8%), and British (21 | 8.4%), together accounting for 67.6% of all Wedgewood residents.
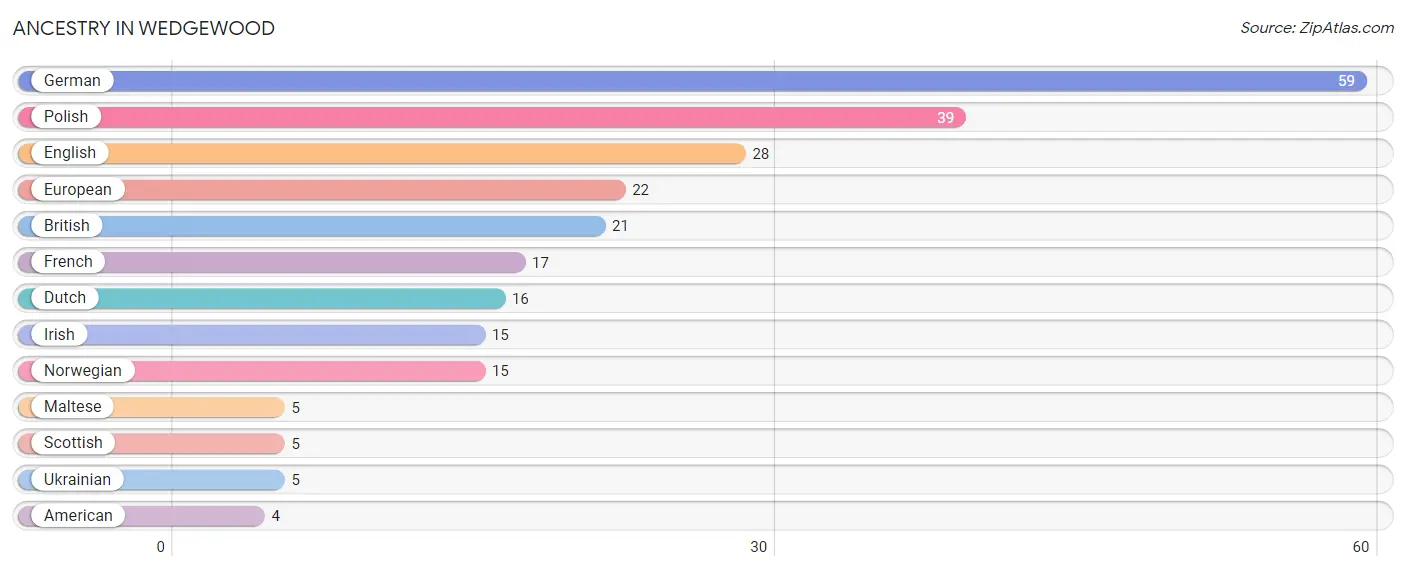
| Ancestry | # Population | % Population |
| American | 4 | 1.6% |
| British | 21 | 8.4% |
| Dutch | 16 | 6.4% |
| English | 28 | 11.2% |
| European | 22 | 8.8% |
| French | 17 | 6.8% |
| German | 59 | 23.6% |
| Irish | 15 | 6.0% |
| Maltese | 5 | 2.0% |
| Norwegian | 15 | 6.0% |
| Polish | 39 | 15.6% |
| Scottish | 5 | 2.0% |
| Ukrainian | 5 | 2.0% | View All 13 Rows |
Immigrants in Wedgewood
The most numerous immigrant groups reported in Wedgewood came from England (6 | 2.4%), Europe (6 | 2.4%), and Northern Europe (6 | 2.4%), together accounting for 7.2% of all Wedgewood residents.
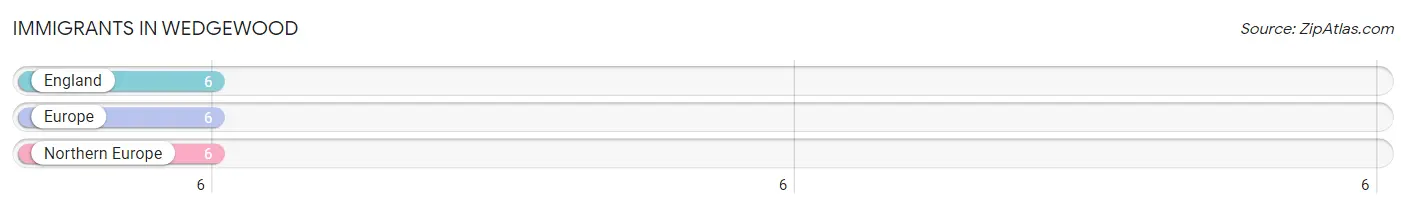
| Immigration Origin | # Population | % Population |
| England | 6 | 2.4% |
| Europe | 6 | 2.4% |
| Northern Europe | 6 | 2.4% | View All 3 Rows |
Sex and Age in Wedgewood
Sex and Age in Wedgewood
The most populous age groups in Wedgewood are 55 to 59 Years (17 | 14.5%) for men and 70 to 74 Years (29 | 21.8%) for women.
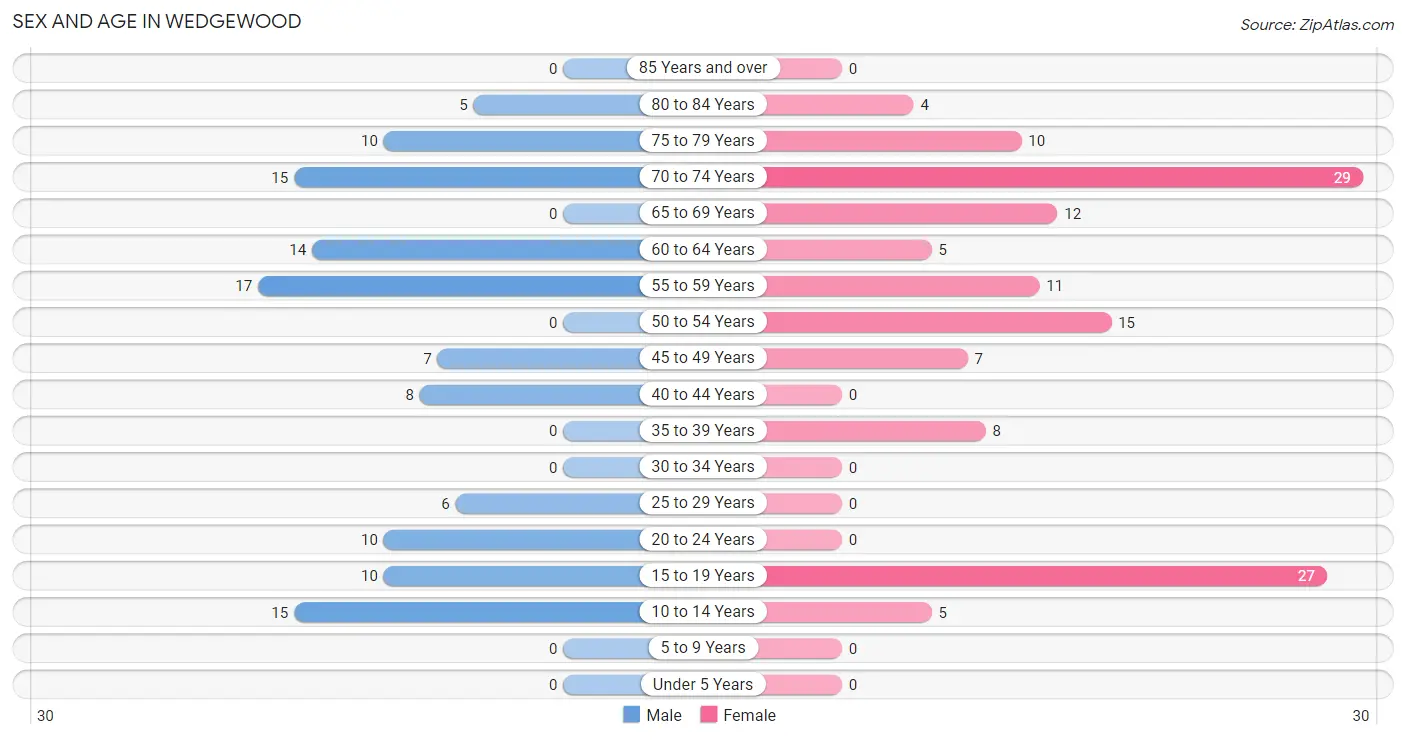
| Age Bracket | Male | Female |
| Under 5 Years | 0 (0.0%) | 0 (0.0%) |
| 5 to 9 Years | 0 (0.0%) | 0 (0.0%) |
| 10 to 14 Years | 15 (12.8%) | 5 (3.8%) |
| 15 to 19 Years | 10 (8.6%) | 27 (20.3%) |
| 20 to 24 Years | 10 (8.6%) | 0 (0.0%) |
| 25 to 29 Years | 6 (5.1%) | 0 (0.0%) |
| 30 to 34 Years | 0 (0.0%) | 0 (0.0%) |
| 35 to 39 Years | 0 (0.0%) | 8 (6.0%) |
| 40 to 44 Years | 8 (6.8%) | 0 (0.0%) |
| 45 to 49 Years | 7 (6.0%) | 7 (5.3%) |
| 50 to 54 Years | 0 (0.0%) | 15 (11.3%) |
| 55 to 59 Years | 17 (14.5%) | 11 (8.3%) |
| 60 to 64 Years | 14 (12.0%) | 5 (3.8%) |
| 65 to 69 Years | 0 (0.0%) | 12 (9.0%) |
| 70 to 74 Years | 15 (12.8%) | 29 (21.8%) |
| 75 to 79 Years | 10 (8.6%) | 10 (7.5%) |
| 80 to 84 Years | 5 (4.3%) | 4 (3.0%) |
| 85 Years and over | 0 (0.0%) | 0 (0.0%) |
| Total | 117 (100.0%) | 133 (100.0%) |
Families and Households in Wedgewood
Median Family Size in Wedgewood
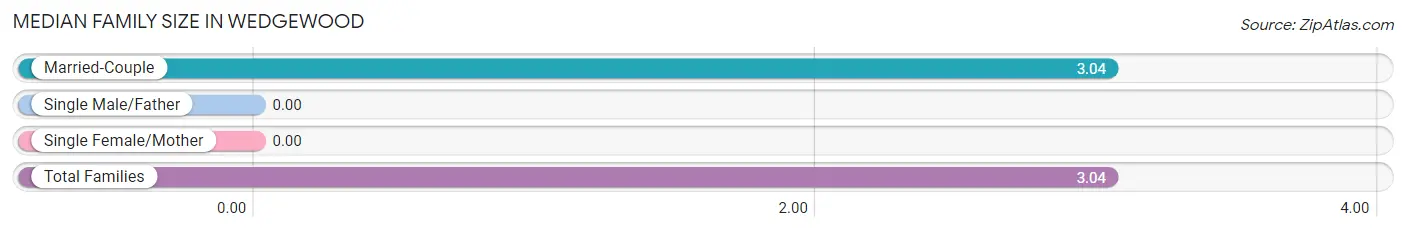
| Family Type | # Families | Family Size |
| Married-Couple | 74 (100.0%) | 3.04 |
| Single Male/Father | 0 (0.0%) | - |
| Single Female/Mother | 0 (0.0%) | - |
| Total Families | 74 (100.0%) | 3.04 |
Median Household Size in Wedgewood
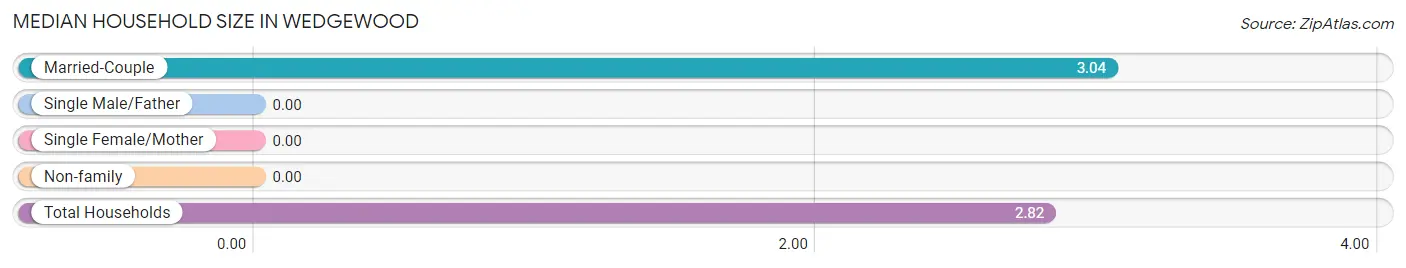
| Household Type | # Households | Household Size |
| Married-Couple | 74 (89.2%) | 3.04 |
| Single Male/Father | 0 (0.0%) | - |
| Single Female/Mother | 0 (0.0%) | - |
| Non-family | 9 (10.8%) | - |
| Total Households | 83 (100.0%) | 2.82 |
Household Size by Marriage Status in Wedgewood
Out of a total of 83 households in Wedgewood, 74 (89.2%) are family households, while 9 (10.8%) are nonfamily households. The most numerous type of family households are 2-person households, comprising 35, and the most common type of nonfamily households are 1-person households, comprising 9.
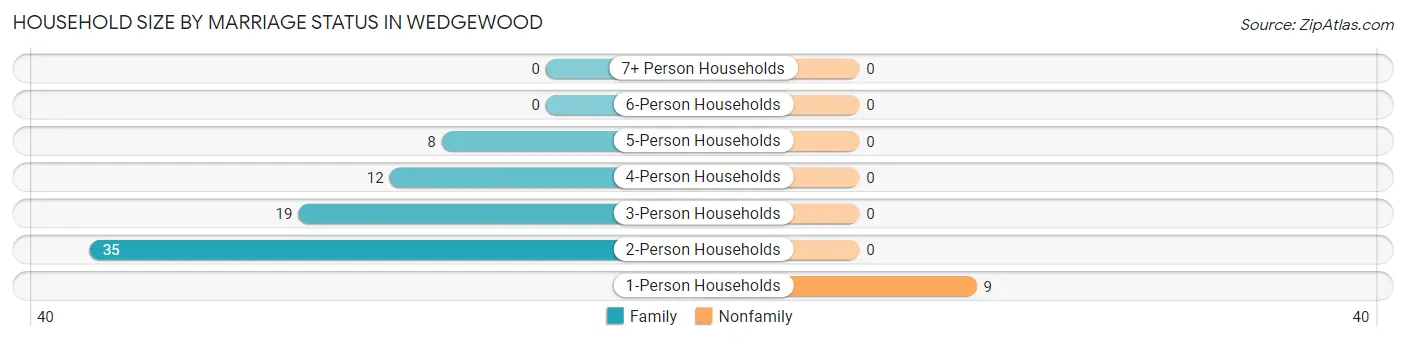
| Household Size | Family Households | Nonfamily Households |
| 1-Person Households | - | 9 (10.8%) |
| 2-Person Households | 35 (42.2%) | 0 (0.0%) |
| 3-Person Households | 19 (22.9%) | 0 (0.0%) |
| 4-Person Households | 12 (14.5%) | 0 (0.0%) |
| 5-Person Households | 8 (9.6%) | 0 (0.0%) |
| 6-Person Households | 0 (0.0%) | 0 (0.0%) |
| 7+ Person Households | 0 (0.0%) | 0 (0.0%) |
| Total | 74 (89.2%) | 9 (10.8%) |
Female Fertility in Wedgewood
Fertility by Age in Wedgewood
| Age Bracket | Women with Births | Births / 1,000 Women |
| 15 to 19 years | 0 (0.0%) | 0.0 |
| 20 to 34 years | 0 (0.0%) | 0.0 |
| 35 to 50 years | 0 (0.0%) | 0.0 |
| Total | 0 (0.0%) | 0.0 |
Fertility by Age by Marriage Status in Wedgewood
| Age Bracket | Married | Unmarried |
| 15 to 19 years | 0 (0.0%) | 0 (0.0%) |
| 20 to 34 years | 0 (0.0%) | 0 (0.0%) |
| 35 to 50 years | 0 (0.0%) | 0 (0.0%) |
| Total | 0 (0.0%) | 0 (0.0%) |
Fertility by Education in Wedgewood
| Educational Attainment | Women with Births | Births / 1,000 Women |
| Less than High School | 0 (0.0%) | 0.0 |
| High School Diploma | 0 (0.0%) | 0.0 |
| College or Associate's Degree | 0 (0.0%) | 0.0 |
| Bachelor's Degree | 0 (0.0%) | 0.0 |
| Graduate Degree | 0 (0.0%) | 0.0 |
| Total | 0 (0.0%) | 0.0 |
Fertility by Education by Marriage Status in Wedgewood
| Educational Attainment | Married | Unmarried |
| Less than High School | 0 (0.0%) | 0 (0.0%) |
| High School Diploma | 0 (0.0%) | 0 (0.0%) |
| College or Associate's Degree | 0 (0.0%) | 0 (0.0%) |
| Bachelor's Degree | 0 (0.0%) | 0 (0.0%) |
| Graduate Degree | 0 (0.0%) | 0 (0.0%) |
| Total | 0 (0.0%) | 0 (0.0%) |
Employment Characteristics in Wedgewood
Employment by Class of Employer in Wedgewood
Among the 98 employed individuals in Wedgewood, private company employees (58 | 59.2%), local government employees (15 | 15.3%), and unpaid family workers (8 | 8.2%) make up the most common classes of employment.
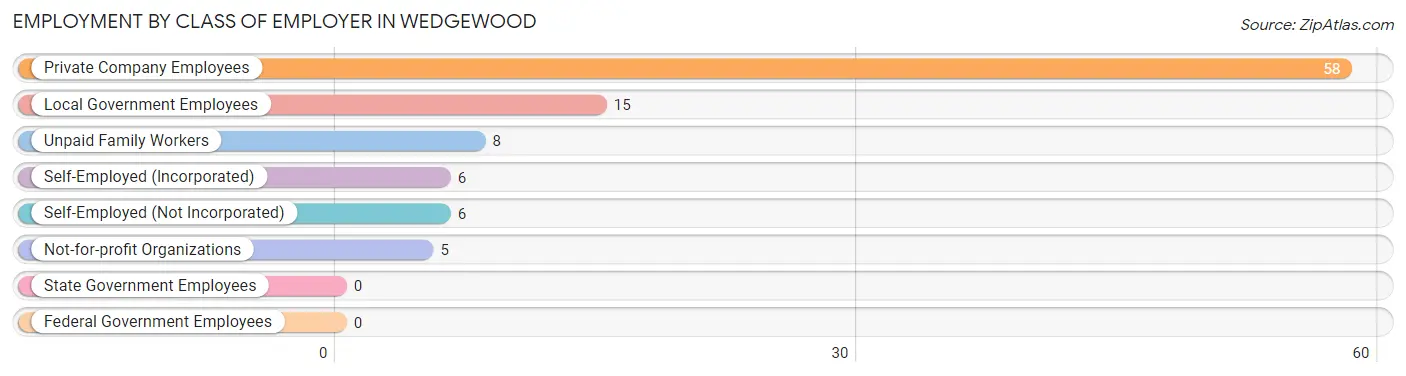
| Employer Class | # Employees | % Employees |
| Private Company Employees | 58 | 59.2% |
| Self-Employed (Incorporated) | 6 | 6.1% |
| Self-Employed (Not Incorporated) | 6 | 6.1% |
| Not-for-profit Organizations | 5 | 5.1% |
| Local Government Employees | 15 | 15.3% |
| State Government Employees | 0 | 0.0% |
| Federal Government Employees | 0 | 0.0% |
| Unpaid Family Workers | 8 | 8.2% |
| Total | 98 | 100.0% |
Employment Status by Age in Wedgewood
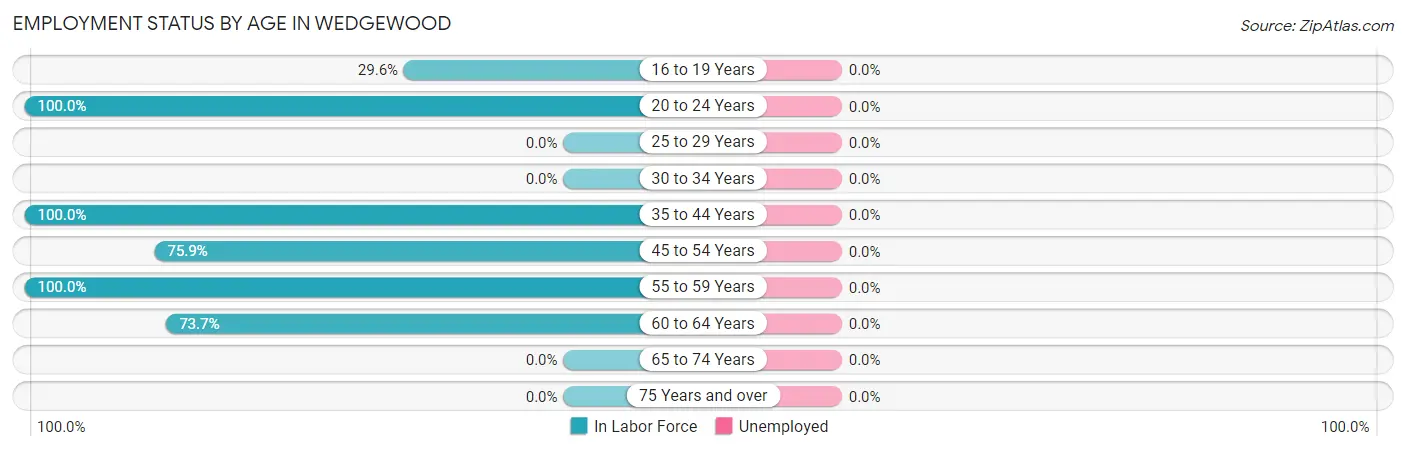
| Age Bracket | In Labor Force | Unemployed |
| 16 to 19 Years | 8 (29.6%) | 0 (0.0%) |
| 20 to 24 Years | 10 (100.0%) | 0 (0.0%) |
| 25 to 29 Years | 0 (0.0%) | 0 (0.0%) |
| 30 to 34 Years | 0 (0.0%) | 0 (0.0%) |
| 35 to 44 Years | 16 (100.0%) | 0 (0.0%) |
| 45 to 54 Years | 22 (75.9%) | 0 (0.0%) |
| 55 to 59 Years | 28 (100.0%) | 0 (0.0%) |
| 60 to 64 Years | 14 (73.7%) | 0 (0.0%) |
| 65 to 74 Years | 0 (0.0%) | 0 (0.0%) |
| 75 Years and over | 0 (0.0%) | 0 (0.0%) |
| Total | 98 (44.5%) | 0 (0.0%) |
Employment Status by Educational Attainment in Wedgewood
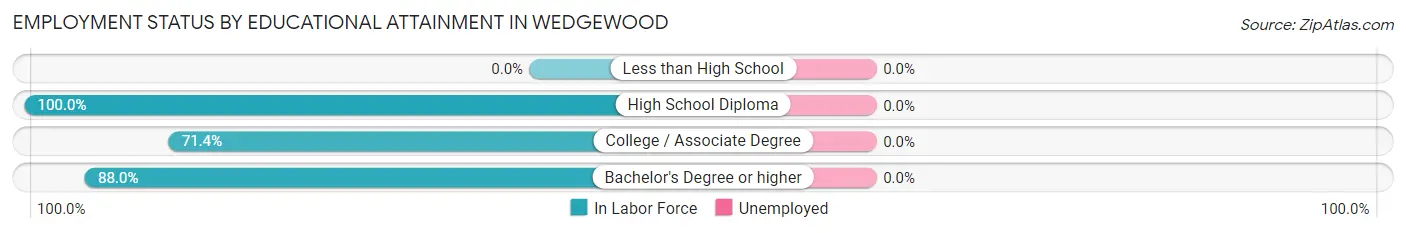
| Educational Attainment | In Labor Force | Unemployed |
| Less than High School | 0 (0.0%) | 0 (0.0%) |
| High School Diploma | 6 (100.0%) | 0 (0.0%) |
| College / Associate Degree | 30 (71.4%) | 0 (0.0%) |
| Bachelor's Degree or higher | 44 (88.0%) | 0 (0.0%) |
| Total | 80 (81.6%) | 0 (0.0%) |
Employment Occupations by Sex in Wedgewood
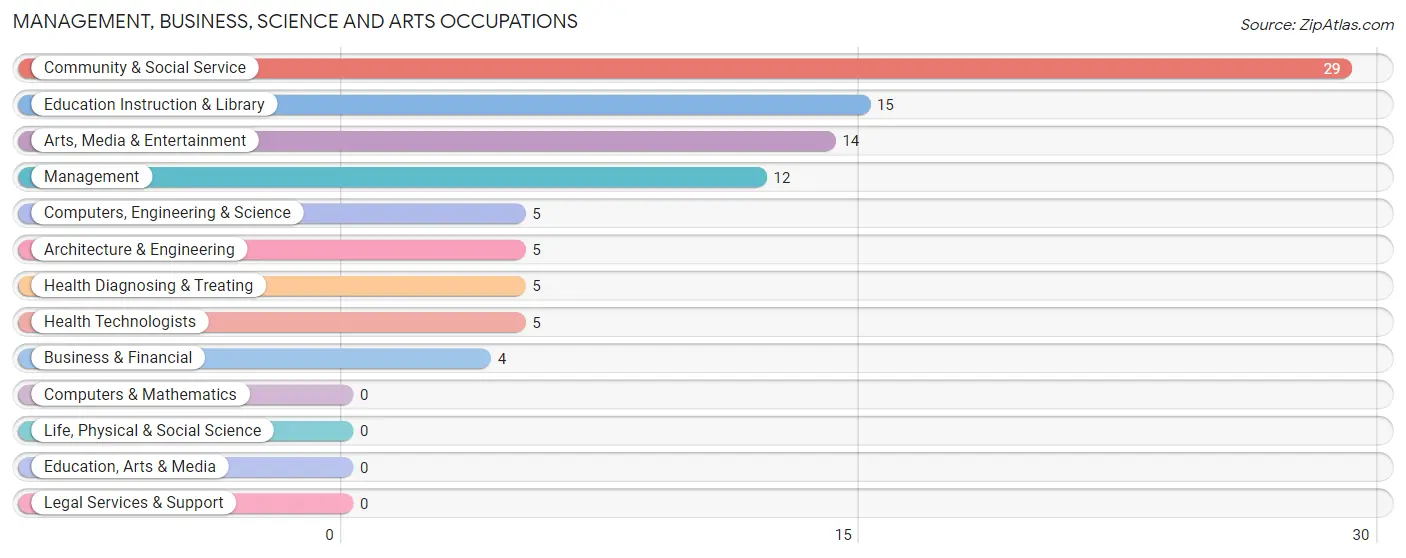
Management, Business, Science and Arts Occupations
The most common Management, Business, Science and Arts occupations in Wedgewood are Community & Social Service (29 | 29.6%), Education Instruction & Library (15 | 15.3%), Arts, Media & Entertainment (14 | 14.3%), Management (12 | 12.2%), and Computers, Engineering & Science (5 | 5.1%).
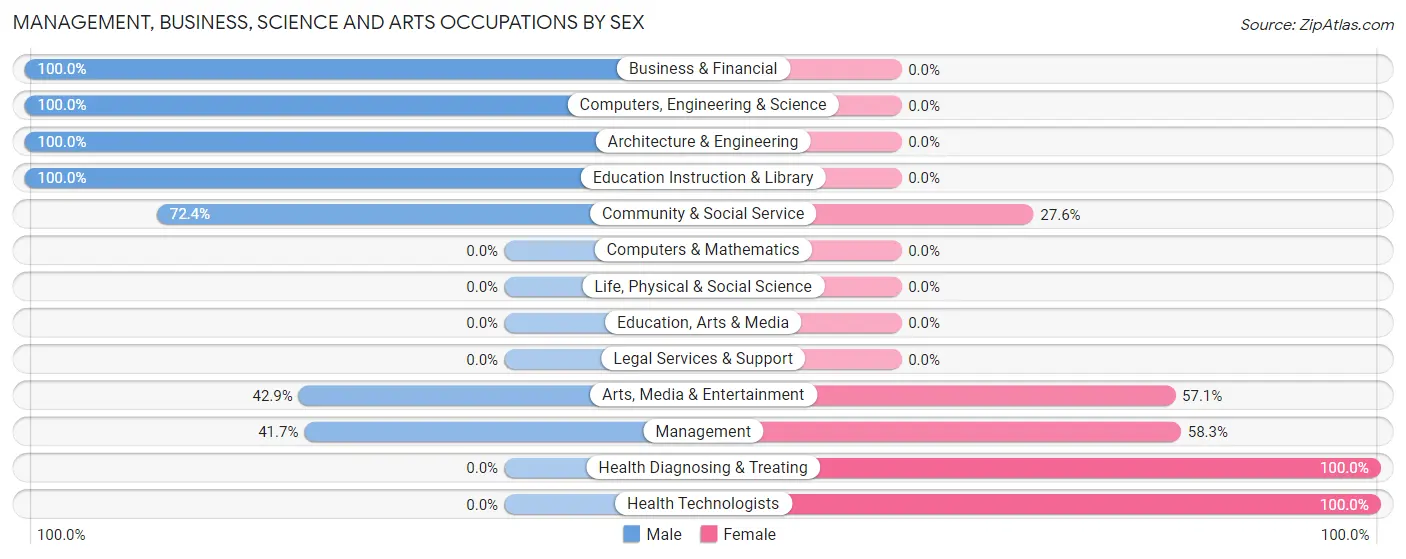
Management, Business, Science and Arts Occupations by Sex
Within the Management, Business, Science and Arts occupations in Wedgewood, the most male-oriented occupations are Business & Financial (100.0%), Computers, Engineering & Science (100.0%), and Architecture & Engineering (100.0%), while the most female-oriented occupations are Health Diagnosing & Treating (100.0%), Health Technologists (100.0%), and Management (58.3%).
| Occupation | Male | Female |
| Management | 5 (41.7%) | 7 (58.3%) |
| Business & Financial | 4 (100.0%) | 0 (0.0%) |
| Computers, Engineering & Science | 5 (100.0%) | 0 (0.0%) |
| Computers & Mathematics | 0 (0.0%) | 0 (0.0%) |
| Architecture & Engineering | 5 (100.0%) | 0 (0.0%) |
| Life, Physical & Social Science | 0 (0.0%) | 0 (0.0%) |
| Community & Social Service | 21 (72.4%) | 8 (27.6%) |
| Education, Arts & Media | 0 (0.0%) | 0 (0.0%) |
| Legal Services & Support | 0 (0.0%) | 0 (0.0%) |
| Education Instruction & Library | 15 (100.0%) | 0 (0.0%) |
| Arts, Media & Entertainment | 6 (42.9%) | 8 (57.1%) |
| Health Diagnosing & Treating | 0 (0.0%) | 5 (100.0%) |
| Health Technologists | 0 (0.0%) | 5 (100.0%) |
| Total (Category) | 35 (63.6%) | 20 (36.4%) |
| Total (Overall) | 56 (57.1%) | 42 (42.9%) |
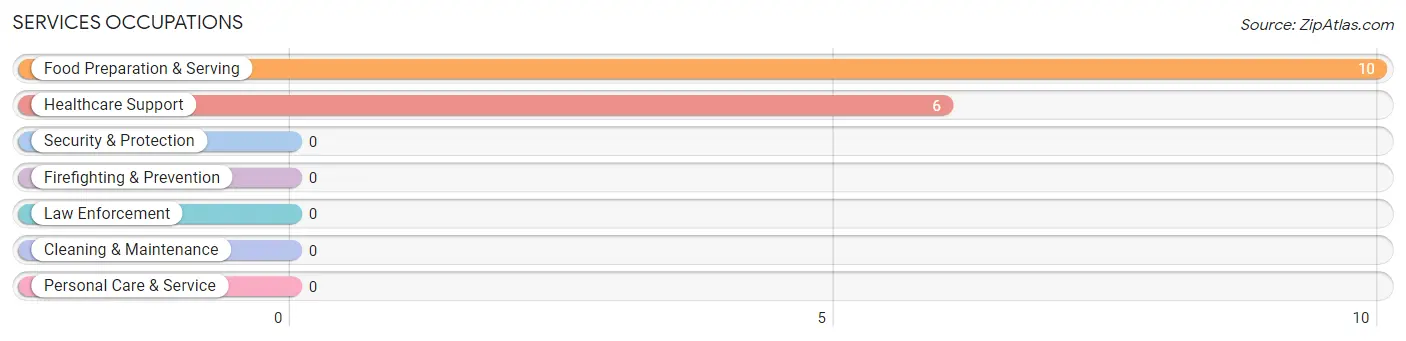
Services Occupations
The most common Services occupations in Wedgewood are Food Preparation & Serving (10 | 10.2%), and Healthcare Support (6 | 6.1%).
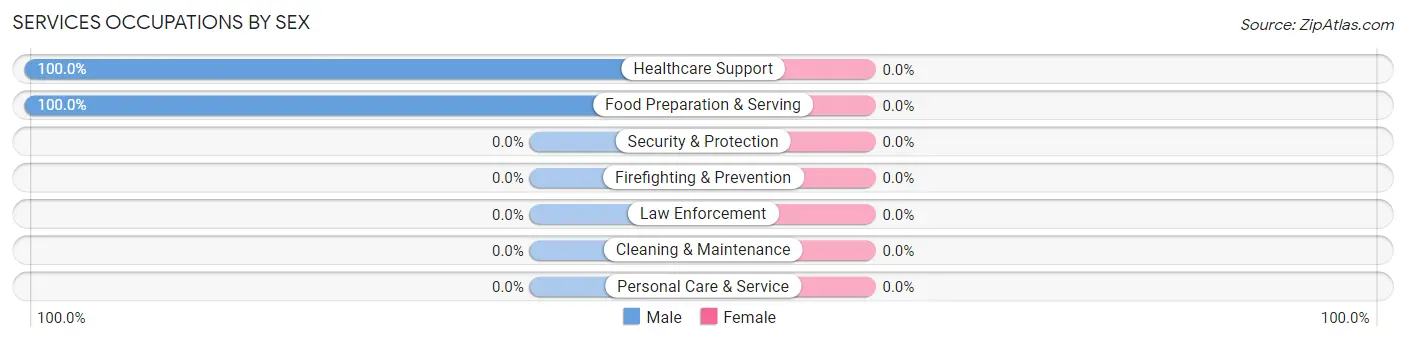
Services Occupations by Sex
| Occupation | Male | Female |
| Healthcare Support | 6 (100.0%) | 0 (0.0%) |
| Security & Protection | 0 (0.0%) | 0 (0.0%) |
| Firefighting & Prevention | 0 (0.0%) | 0 (0.0%) |
| Law Enforcement | 0 (0.0%) | 0 (0.0%) |
| Food Preparation & Serving | 10 (100.0%) | 0 (0.0%) |
| Cleaning & Maintenance | 0 (0.0%) | 0 (0.0%) |
| Personal Care & Service | 0 (0.0%) | 0 (0.0%) |
| Total (Category) | 16 (100.0%) | 0 (0.0%) |
| Total (Overall) | 56 (57.1%) | 42 (42.9%) |
Sales and Office Occupations
The most common Sales and Office occupations in Wedgewood are , and Sales & Related (22 | 22.5%).
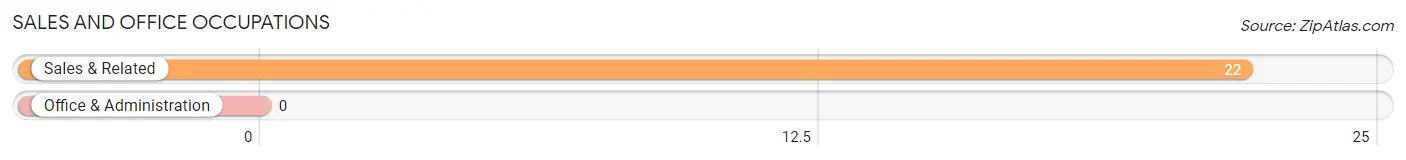
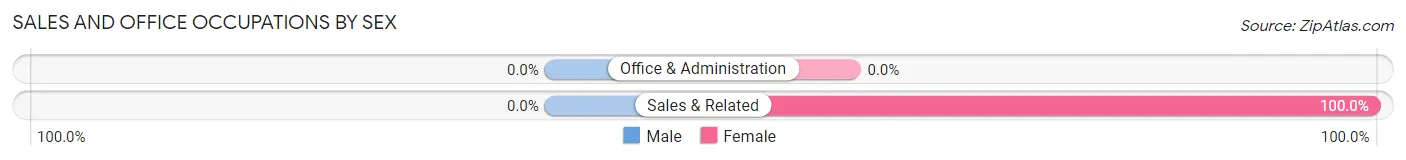
Sales and Office Occupations by Sex
| Occupation | Male | Female |
| Sales & Related | 0 (0.0%) | 22 (100.0%) |
| Office & Administration | 0 (0.0%) | 0 (0.0%) |
| Total (Category) | 0 (0.0%) | 22 (100.0%) |
| Total (Overall) | 56 (57.1%) | 42 (42.9%) |
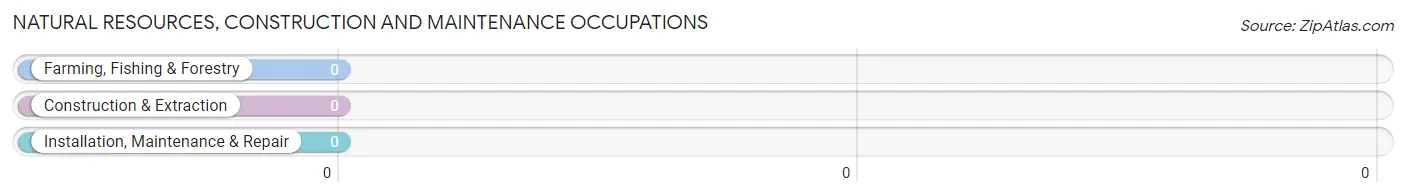
Natural Resources, Construction and Maintenance Occupations
Natural Resources, Construction and Maintenance Occupations by Sex
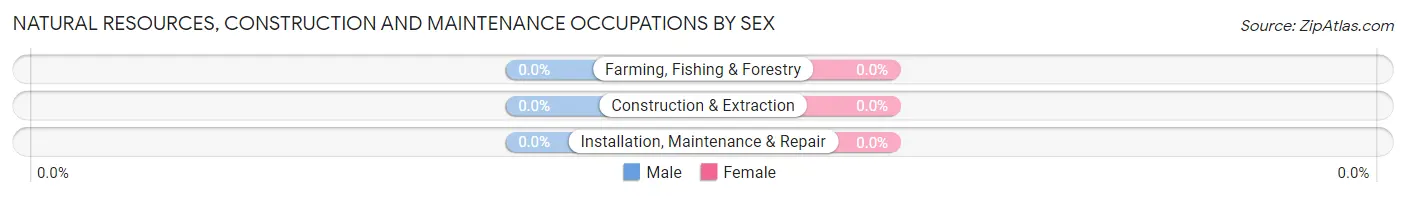
| Occupation | Male | Female |
| Farming, Fishing & Forestry | 0 (0.0%) | 0 (0.0%) |
| Construction & Extraction | 0 (0.0%) | 0 (0.0%) |
| Installation, Maintenance & Repair | 0 (0.0%) | 0 (0.0%) |
| Total (Category) | 0 (0.0%) | 0 (0.0%) |
| Total (Overall) | 56 (57.1%) | 42 (42.9%) |
Production, Transportation and Moving Occupations
The most common Production, Transportation and Moving occupations in Wedgewood are , and Production (5 | 5.1%).
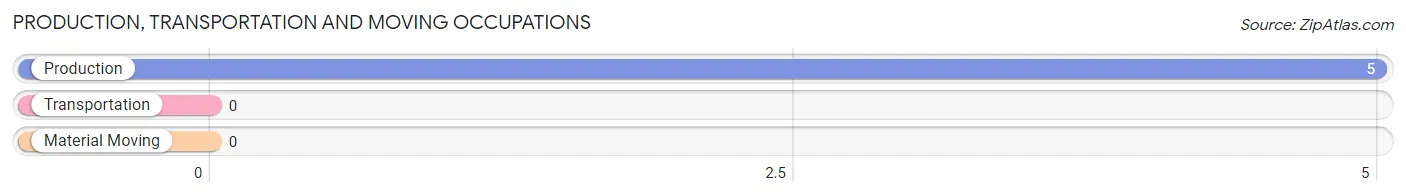
Production, Transportation and Moving Occupations by Sex
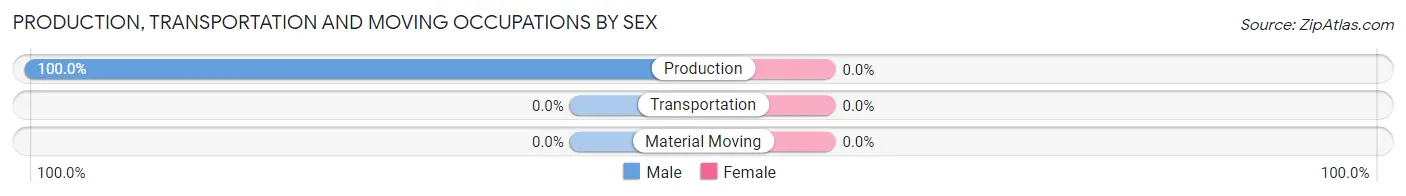
| Occupation | Male | Female |
| Production | 5 (100.0%) | 0 (0.0%) |
| Transportation | 0 (0.0%) | 0 (0.0%) |
| Material Moving | 0 (0.0%) | 0 (0.0%) |
| Total (Category) | 5 (100.0%) | 0 (0.0%) |
| Total (Overall) | 56 (57.1%) | 42 (42.9%) |
Employment Industries by Sex in Wedgewood
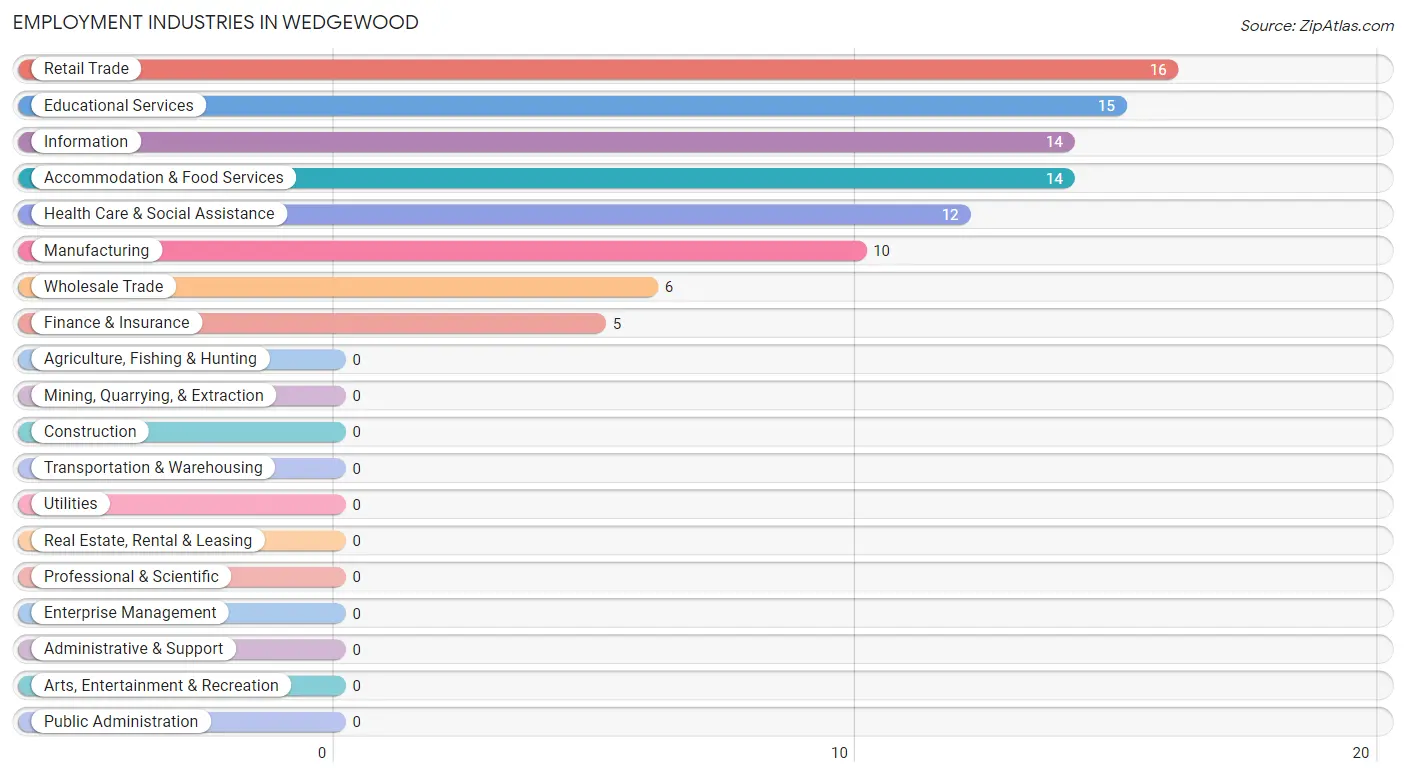
Employment Industries in Wedgewood
The major employment industries in Wedgewood include Retail Trade (16 | 16.3%), Educational Services (15 | 15.3%), Information (14 | 14.3%), Accommodation & Food Services (14 | 14.3%), and Health Care & Social Assistance (12 | 12.2%).
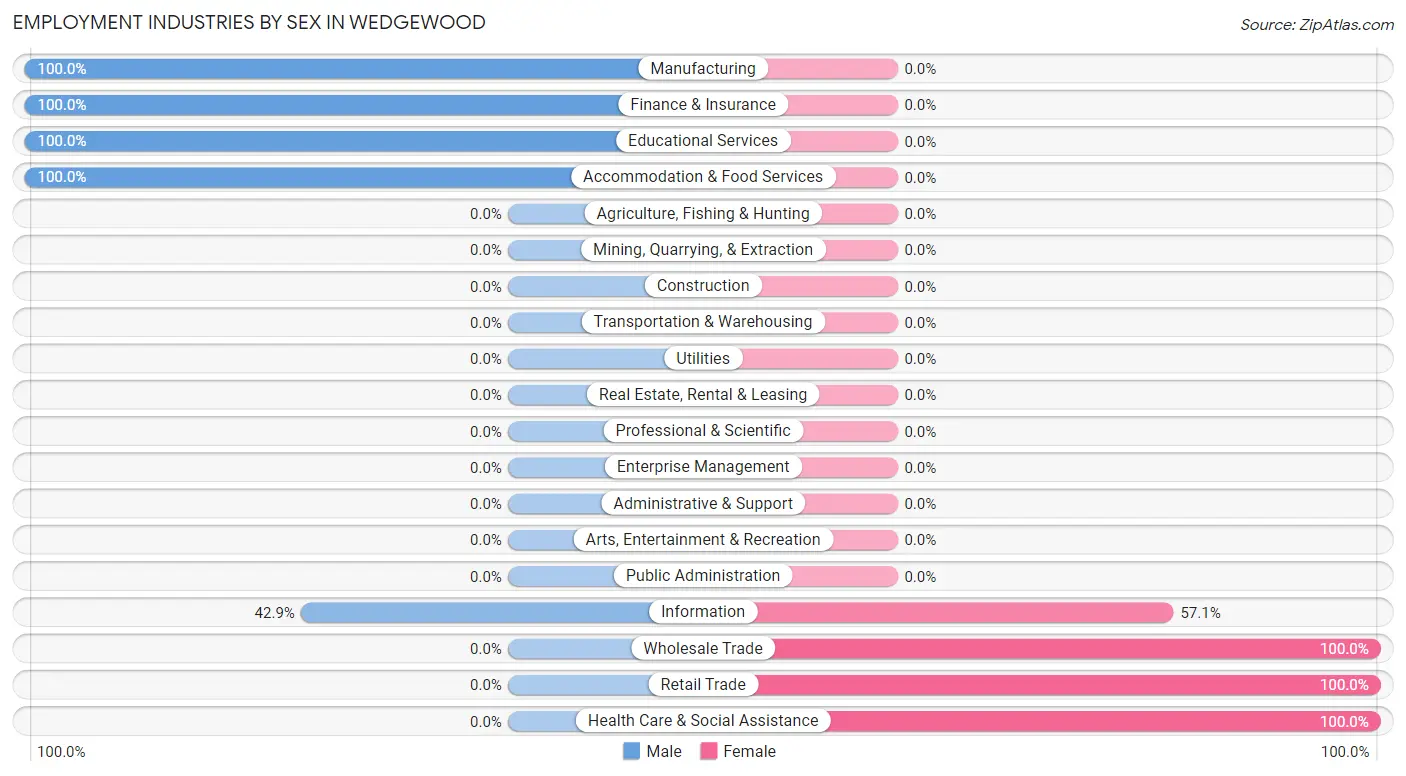
Employment Industries by Sex in Wedgewood
The Wedgewood industries that see more men than women are Manufacturing (100.0%), Finance & Insurance (100.0%), and Educational Services (100.0%), whereas the industries that tend to have a higher number of women are Wholesale Trade (100.0%), Retail Trade (100.0%), and Health Care & Social Assistance (100.0%).
| Industry | Male | Female |
| Agriculture, Fishing & Hunting | 0 (0.0%) | 0 (0.0%) |
| Mining, Quarrying, & Extraction | 0 (0.0%) | 0 (0.0%) |
| Construction | 0 (0.0%) | 0 (0.0%) |
| Manufacturing | 10 (100.0%) | 0 (0.0%) |
| Wholesale Trade | 0 (0.0%) | 6 (100.0%) |
| Retail Trade | 0 (0.0%) | 16 (100.0%) |
| Transportation & Warehousing | 0 (0.0%) | 0 (0.0%) |
| Utilities | 0 (0.0%) | 0 (0.0%) |
| Information | 6 (42.9%) | 8 (57.1%) |
| Finance & Insurance | 5 (100.0%) | 0 (0.0%) |
| Real Estate, Rental & Leasing | 0 (0.0%) | 0 (0.0%) |
| Professional & Scientific | 0 (0.0%) | 0 (0.0%) |
| Enterprise Management | 0 (0.0%) | 0 (0.0%) |
| Administrative & Support | 0 (0.0%) | 0 (0.0%) |
| Educational Services | 15 (100.0%) | 0 (0.0%) |
| Health Care & Social Assistance | 0 (0.0%) | 12 (100.0%) |
| Arts, Entertainment & Recreation | 0 (0.0%) | 0 (0.0%) |
| Accommodation & Food Services | 14 (100.0%) | 0 (0.0%) |
| Public Administration | 0 (0.0%) | 0 (0.0%) |
| Total | 56 (57.1%) | 42 (42.9%) |
Education in Wedgewood
School Enrollment in Wedgewood
The most common levels of schooling among the 55 students in Wedgewood are high school (29 | 52.7%), middle school (20 | 36.4%), and graduate / professional (6 | 10.9%).
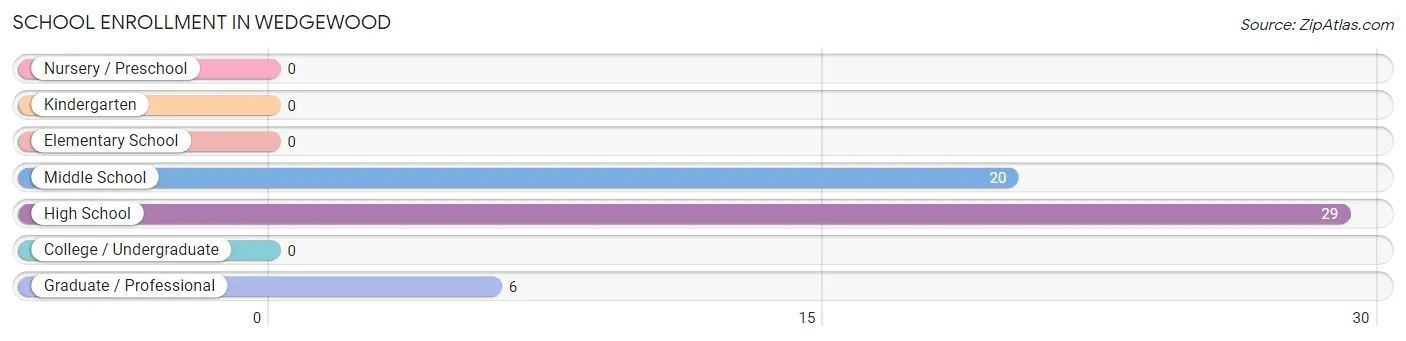
| School Level | # Students | % Students |
| Nursery / Preschool | 0 | 0.0% |
| Kindergarten | 0 | 0.0% |
| Elementary School | 0 | 0.0% |
| Middle School | 20 | 36.4% |
| High School | 29 | 52.7% |
| College / Undergraduate | 0 | 0.0% |
| Graduate / Professional | 6 | 10.9% |
| Total | 55 | 100.0% |
School Enrollment by Age by Funding Source in Wedgewood
Out of a total of 55 students who are enrolled in schools in Wedgewood, 6 (10.9%) attend a private institution, while the remaining 49 (89.1%) are enrolled in public schools. The age group of 25 to 34 year olds has the highest likelihood of being enrolled in private schools, with 6 (100.0% in the age bracket) enrolled. Conversely, the age group of 10 to 14 year olds has the lowest likelihood of being enrolled in a private school, with 20 (100.0% in the age bracket) attending a public institution.
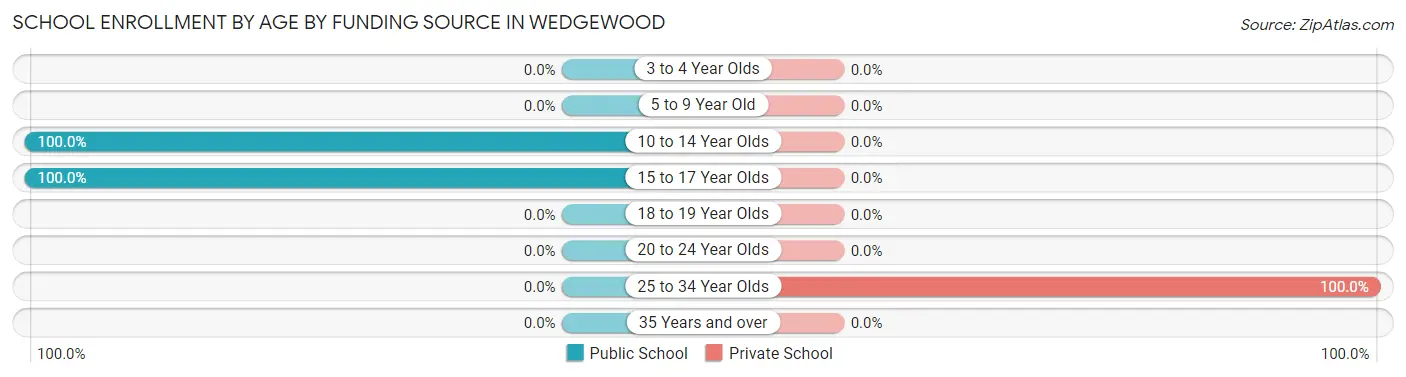
| Age Bracket | Public School | Private School |
| 3 to 4 Year Olds | 0 (0.0%) | 0 (0.0%) |
| 5 to 9 Year Old | 0 (0.0%) | 0 (0.0%) |
| 10 to 14 Year Olds | 20 (100.0%) | 0 (0.0%) |
| 15 to 17 Year Olds | 29 (100.0%) | 0 (0.0%) |
| 18 to 19 Year Olds | 0 (0.0%) | 0 (0.0%) |
| 20 to 24 Year Olds | 0 (0.0%) | 0 (0.0%) |
| 25 to 34 Year Olds | 0 (0.0%) | 6 (100.0%) |
| 35 Years and over | 0 (0.0%) | 0 (0.0%) |
| Total | 49 (89.1%) | 6 (10.9%) |
Educational Attainment by Field of Study in Wedgewood
Education (45 | 45.5%), science & technology (20 | 20.2%), business (14 | 14.1%), arts & humanities (11 | 11.1%), and social sciences (9 | 9.1%) are the most common fields of study among 99 individuals in Wedgewood who have obtained a bachelor's degree or higher.
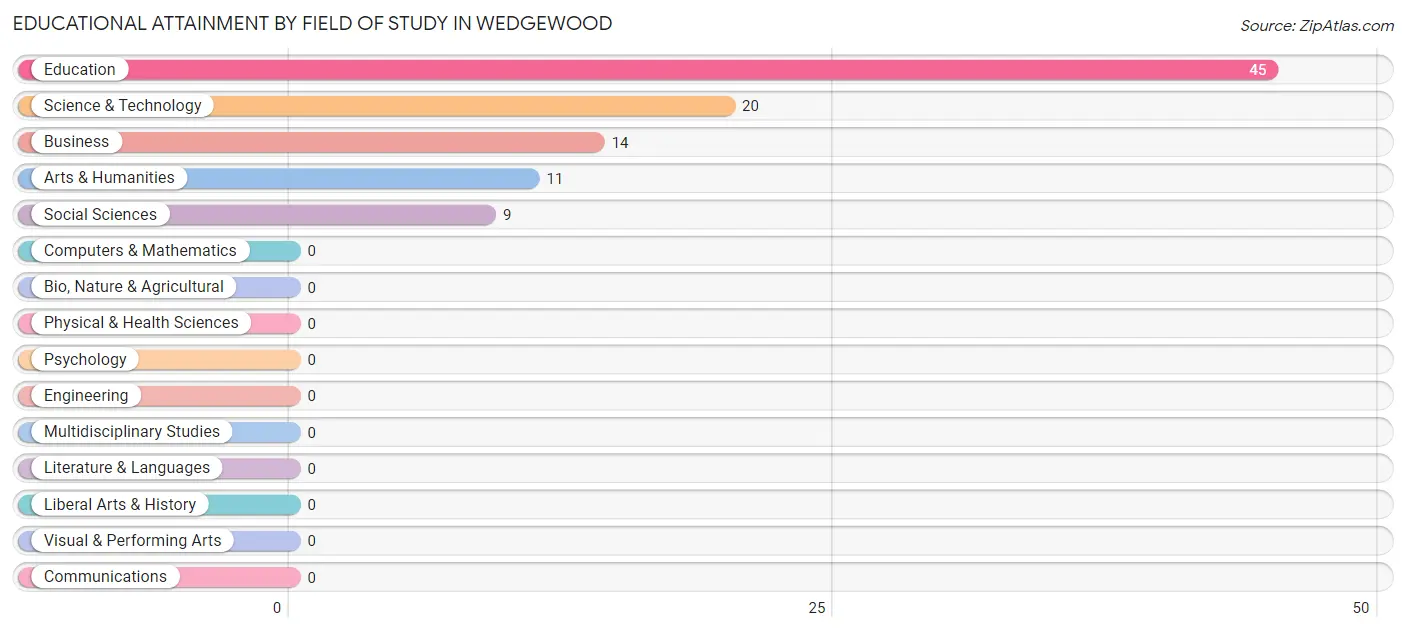
| Field of Study | # Graduates | % Graduates |
| Computers & Mathematics | 0 | 0.0% |
| Bio, Nature & Agricultural | 0 | 0.0% |
| Physical & Health Sciences | 0 | 0.0% |
| Psychology | 0 | 0.0% |
| Social Sciences | 9 | 9.1% |
| Engineering | 0 | 0.0% |
| Multidisciplinary Studies | 0 | 0.0% |
| Science & Technology | 20 | 20.2% |
| Business | 14 | 14.1% |
| Education | 45 | 45.5% |
| Literature & Languages | 0 | 0.0% |
| Liberal Arts & History | 0 | 0.0% |
| Visual & Performing Arts | 0 | 0.0% |
| Communications | 0 | 0.0% |
| Arts & Humanities | 11 | 11.1% |
| Total | 99 | 100.0% |
Transportation & Commute in Wedgewood
Vehicle Availability by Sex in Wedgewood
The most prevalent vehicle ownership categories in Wedgewood are males with 4 vehicles (23, accounting for 41.1%) and females with 4 vehicles (7, making up 54.8%).
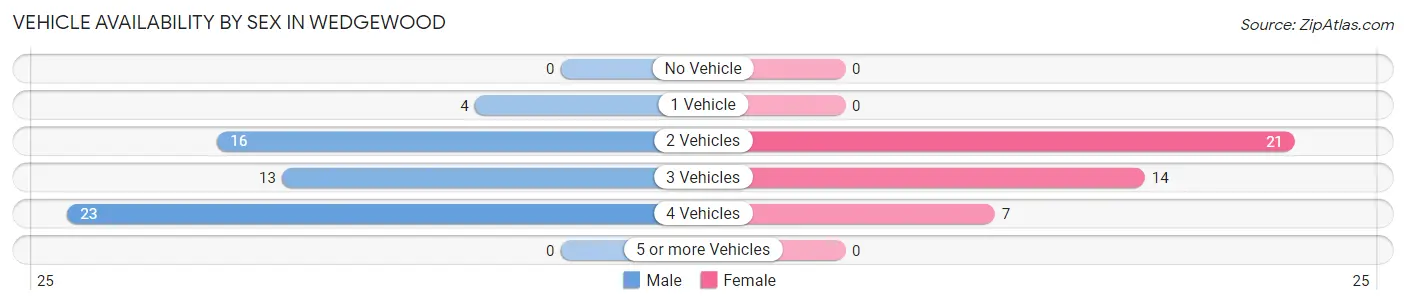
| Vehicles Available | Male | Female |
| No Vehicle | 0 (0.0%) | 0 (0.0%) |
| 1 Vehicle | 4 (7.1%) | 0 (0.0%) |
| 2 Vehicles | 16 (28.6%) | 21 (50.0%) |
| 3 Vehicles | 13 (23.2%) | 14 (33.3%) |
| 4 Vehicles | 23 (41.1%) | 7 (16.7%) |
| 5 or more Vehicles | 0 (0.0%) | 0 (0.0%) |
| Total | 56 (100.0%) | 42 (100.0%) |
Commute Time in Wedgewood
The most frequently occuring commute durations in Wedgewood are 15 to 19 minutes (44 commuters, 58.7%), 20 to 24 minutes (18 commuters, 24.0%), and 5 to 9 minutes (8 commuters, 10.7%).
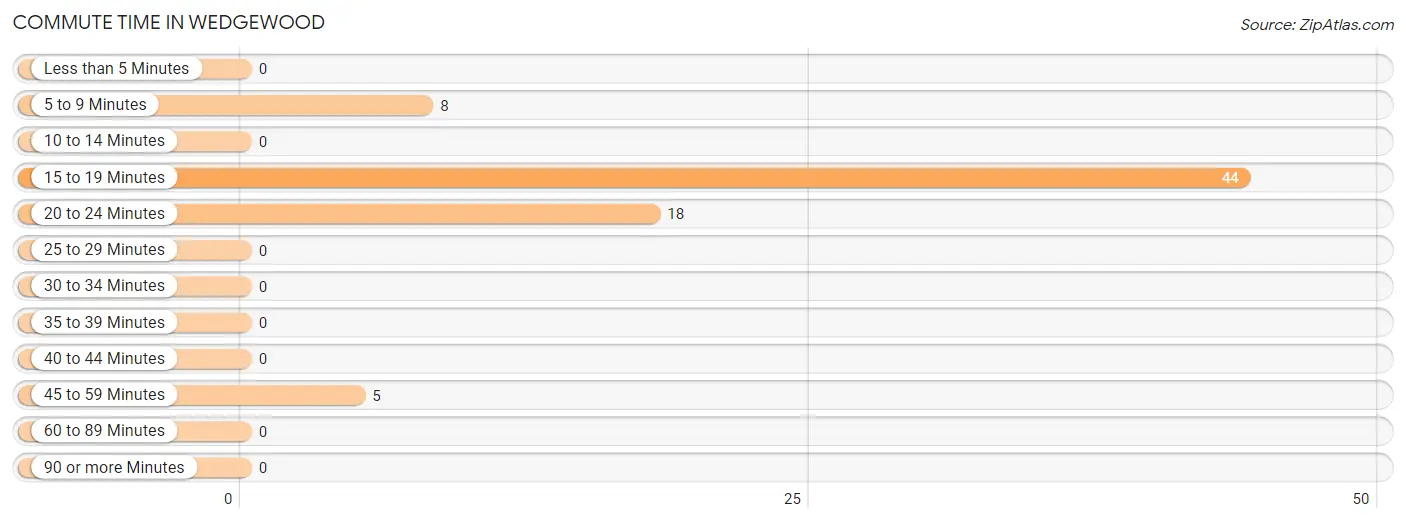
| Commute Time | # Commuters | % Commuters |
| Less than 5 Minutes | 0 | 0.0% |
| 5 to 9 Minutes | 8 | 10.7% |
| 10 to 14 Minutes | 0 | 0.0% |
| 15 to 19 Minutes | 44 | 58.7% |
| 20 to 24 Minutes | 18 | 24.0% |
| 25 to 29 Minutes | 0 | 0.0% |
| 30 to 34 Minutes | 0 | 0.0% |
| 35 to 39 Minutes | 0 | 0.0% |
| 40 to 44 Minutes | 0 | 0.0% |
| 45 to 59 Minutes | 5 | 6.7% |
| 60 to 89 Minutes | 0 | 0.0% |
| 90 or more Minutes | 0 | 0.0% |
Commute Time by Sex in Wedgewood
The most common commute times in Wedgewood are 15 to 19 minutes (30 commuters, 75.0%) for males and 15 to 19 minutes (14 commuters, 40.0%) for females.
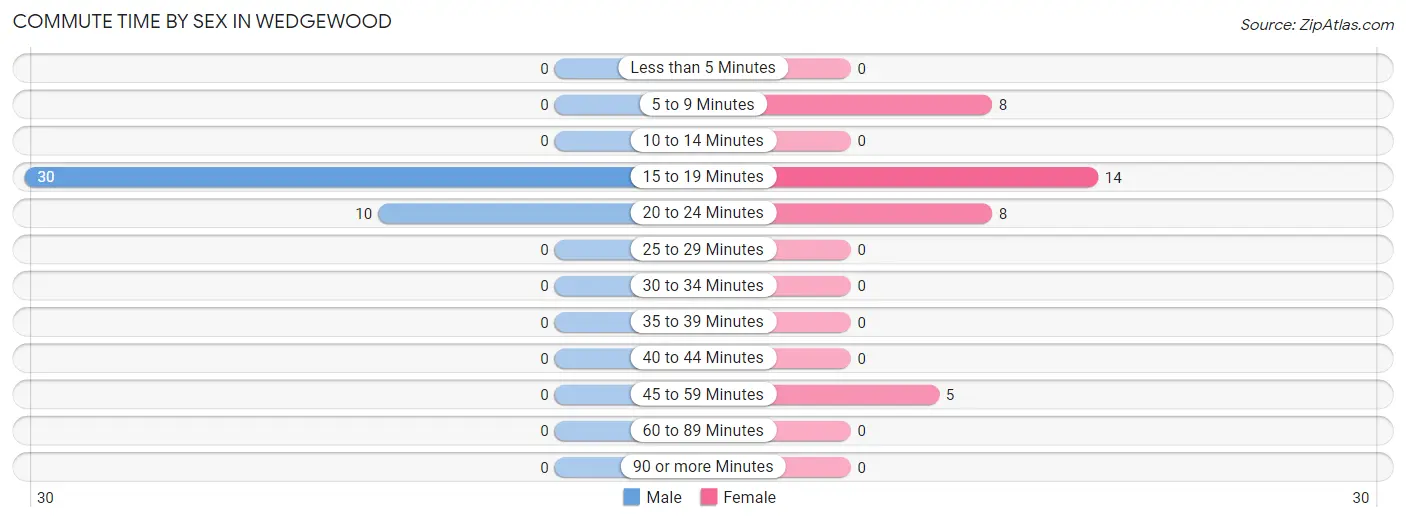
| Commute Time | Male | Female |
| Less than 5 Minutes | 0 (0.0%) | 0 (0.0%) |
| 5 to 9 Minutes | 0 (0.0%) | 8 (22.9%) |
| 10 to 14 Minutes | 0 (0.0%) | 0 (0.0%) |
| 15 to 19 Minutes | 30 (75.0%) | 14 (40.0%) |
| 20 to 24 Minutes | 10 (25.0%) | 8 (22.9%) |
| 25 to 29 Minutes | 0 (0.0%) | 0 (0.0%) |
| 30 to 34 Minutes | 0 (0.0%) | 0 (0.0%) |
| 35 to 39 Minutes | 0 (0.0%) | 0 (0.0%) |
| 40 to 44 Minutes | 0 (0.0%) | 0 (0.0%) |
| 45 to 59 Minutes | 0 (0.0%) | 5 (14.3%) |
| 60 to 89 Minutes | 0 (0.0%) | 0 (0.0%) |
| 90 or more Minutes | 0 (0.0%) | 0 (0.0%) |
Time of Departure to Work by Sex in Wedgewood
The most frequent times of departure to work in Wedgewood are 7:00 AM to 7:29 AM (13, 32.5%) for males and 6:30 AM to 6:59 AM (19, 54.3%) for females.
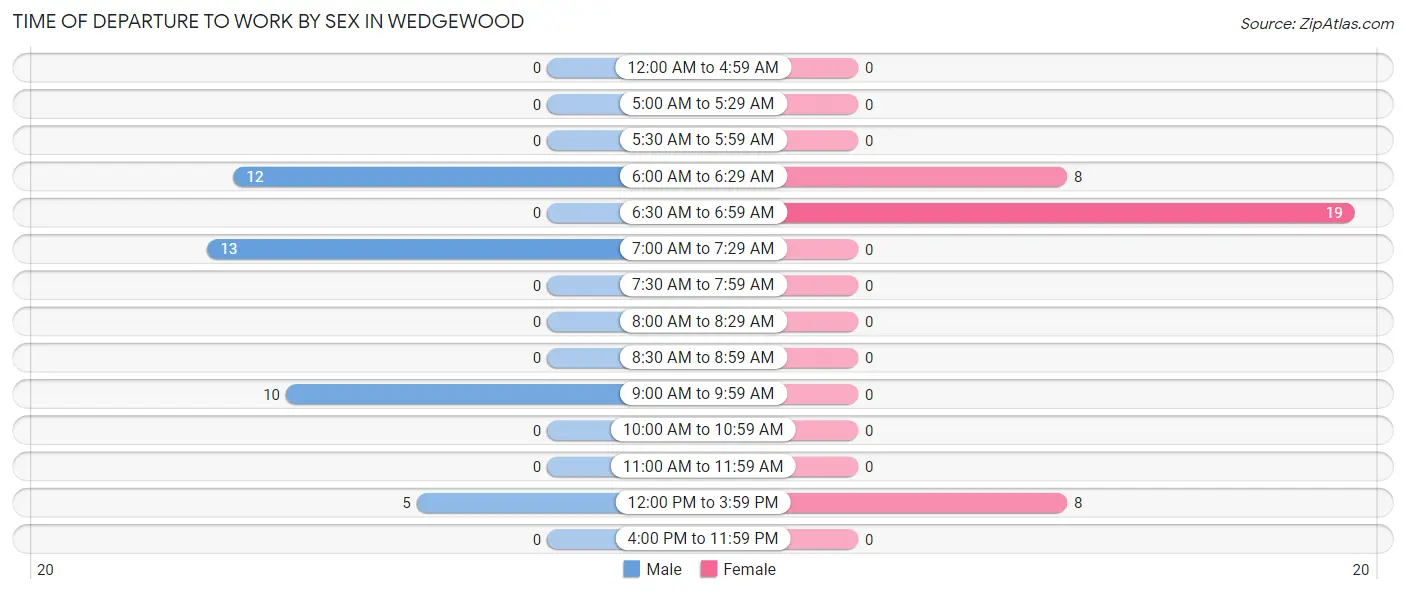
| Time of Departure | Male | Female |
| 12:00 AM to 4:59 AM | 0 (0.0%) | 0 (0.0%) |
| 5:00 AM to 5:29 AM | 0 (0.0%) | 0 (0.0%) |
| 5:30 AM to 5:59 AM | 0 (0.0%) | 0 (0.0%) |
| 6:00 AM to 6:29 AM | 12 (30.0%) | 8 (22.9%) |
| 6:30 AM to 6:59 AM | 0 (0.0%) | 19 (54.3%) |
| 7:00 AM to 7:29 AM | 13 (32.5%) | 0 (0.0%) |
| 7:30 AM to 7:59 AM | 0 (0.0%) | 0 (0.0%) |
| 8:00 AM to 8:29 AM | 0 (0.0%) | 0 (0.0%) |
| 8:30 AM to 8:59 AM | 0 (0.0%) | 0 (0.0%) |
| 9:00 AM to 9:59 AM | 10 (25.0%) | 0 (0.0%) |
| 10:00 AM to 10:59 AM | 0 (0.0%) | 0 (0.0%) |
| 11:00 AM to 11:59 AM | 0 (0.0%) | 0 (0.0%) |
| 12:00 PM to 3:59 PM | 5 (12.5%) | 8 (22.9%) |
| 4:00 PM to 11:59 PM | 0 (0.0%) | 0 (0.0%) |
| Total | 40 (100.0%) | 35 (100.0%) |
Housing Occupancy in Wedgewood
Occupancy by Ownership in Wedgewood
Of the total 83 dwellings in Wedgewood, owner-occupied units account for 83 (100.0%), while renter-occupied units make up 0 (0.0%).
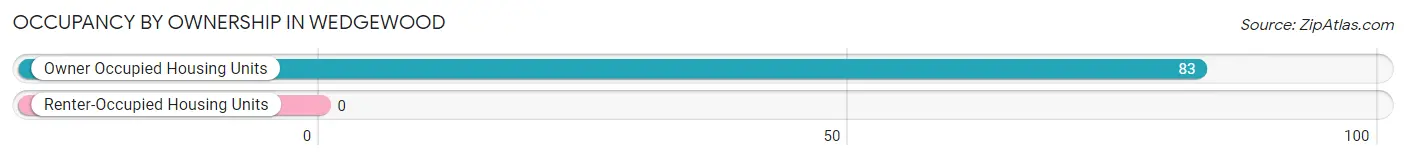
| Occupancy | # Housing Units | % Housing Units |
| Owner Occupied Housing Units | 83 | 100.0% |
| Renter-Occupied Housing Units | 0 | 0.0% |
| Total Occupied Housing Units | 83 | 100.0% |
Occupancy by Household Size in Wedgewood
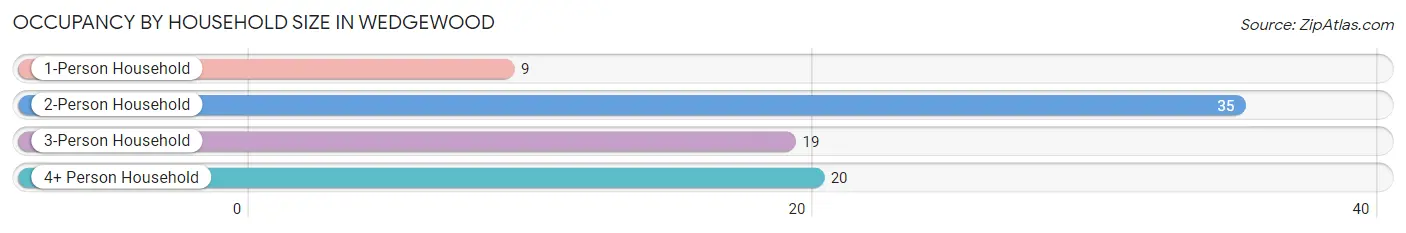
| Household Size | # Housing Units | % Housing Units |
| 1-Person Household | 9 | 10.8% |
| 2-Person Household | 35 | 42.2% |
| 3-Person Household | 19 | 22.9% |
| 4+ Person Household | 20 | 24.1% |
| Total Housing Units | 83 | 100.0% |
Occupancy by Ownership by Household Size in Wedgewood
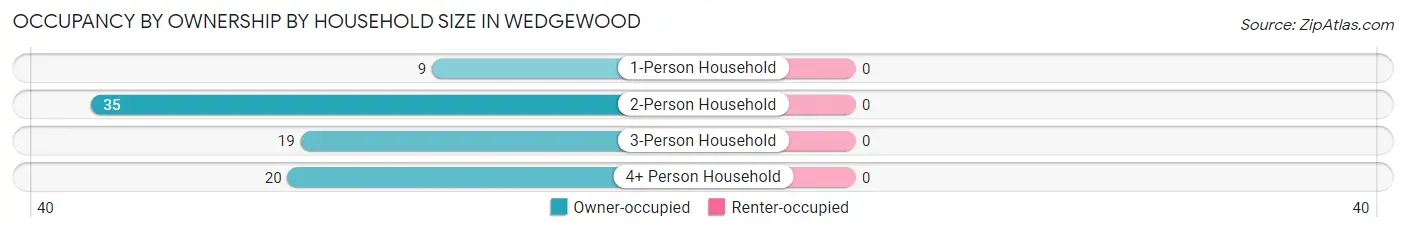
| Household Size | Owner-occupied | Renter-occupied |
| 1-Person Household | 9 (100.0%) | 0 (0.0%) |
| 2-Person Household | 35 (100.0%) | 0 (0.0%) |
| 3-Person Household | 19 (100.0%) | 0 (0.0%) |
| 4+ Person Household | 20 (100.0%) | 0 (0.0%) |
| Total Housing Units | 83 (100.0%) | 0 (0.0%) |
Occupancy by Educational Attainment in Wedgewood
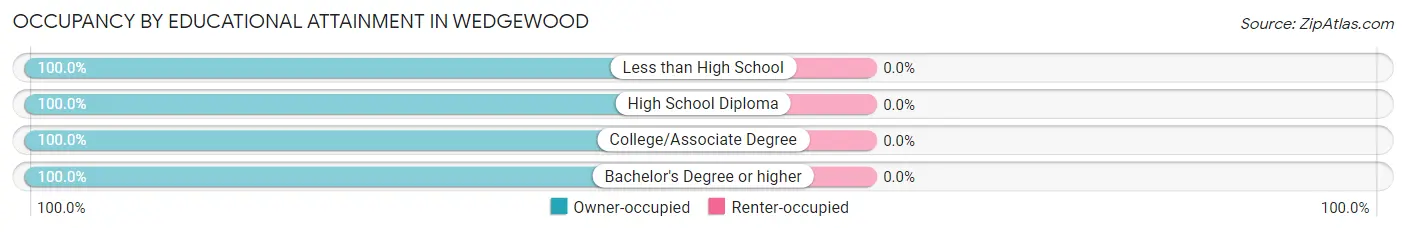
| Household Size | Owner-occupied | Renter-occupied |
| Less than High School | 4 (100.0%) | 0 (0.0%) |
| High School Diploma | 11 (100.0%) | 0 (0.0%) |
| College/Associate Degree | 24 (100.0%) | 0 (0.0%) |
| Bachelor's Degree or higher | 44 (100.0%) | 0 (0.0%) |
Occupancy by Age of Householder in Wedgewood
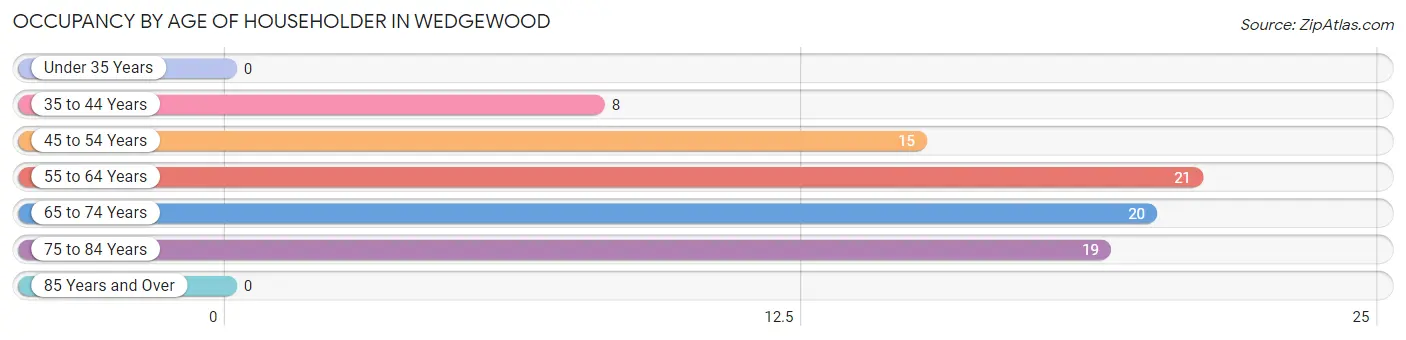
| Age Bracket | # Households | % Households |
| Under 35 Years | 0 | 0.0% |
| 35 to 44 Years | 8 | 9.6% |
| 45 to 54 Years | 15 | 18.1% |
| 55 to 64 Years | 21 | 25.3% |
| 65 to 74 Years | 20 | 24.1% |
| 75 to 84 Years | 19 | 22.9% |
| 85 Years and Over | 0 | 0.0% |
| Total | 83 | 100.0% |
Housing Finances in Wedgewood
Median Income by Occupancy in Wedgewood
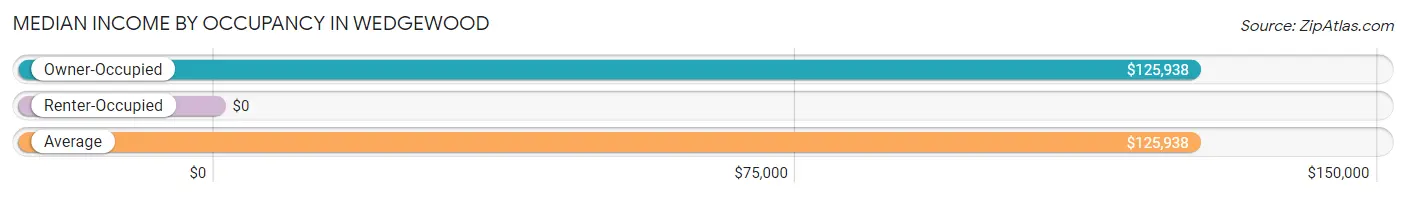
| Occupancy Type | # Households | Median Income |
| Owner-Occupied | 83 (100.0%) | $125,938 |
| Renter-Occupied | 0 (0.0%) | $0 |
| Average | 83 (100.0%) | $125,938 |
Occupancy by Householder Income Bracket in Wedgewood
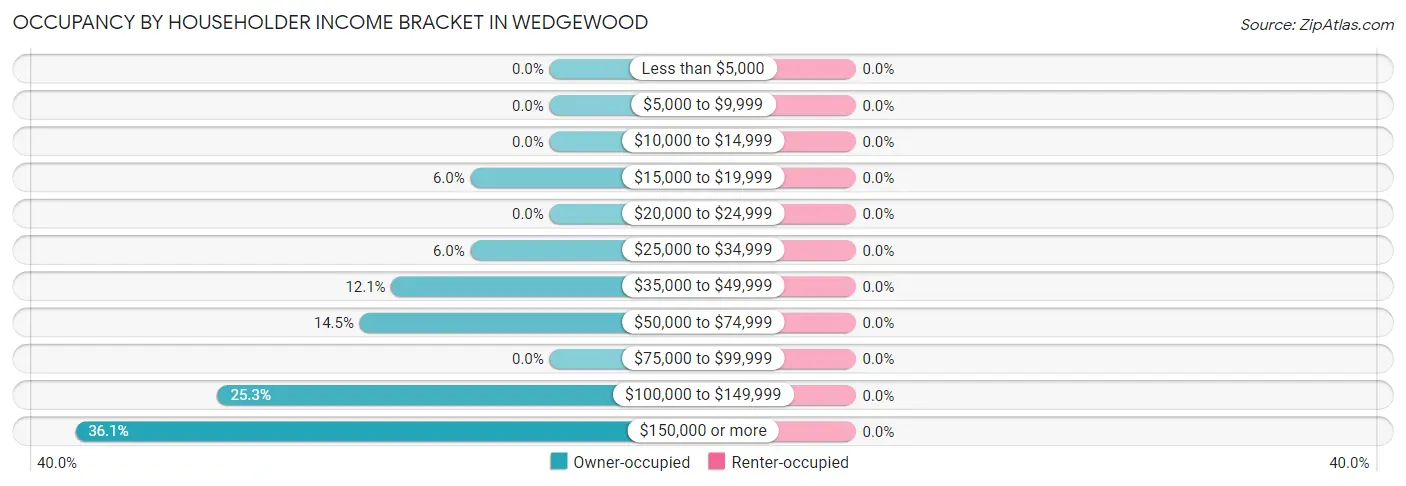
| Income Bracket | Owner-occupied | Renter-occupied |
| Less than $5,000 | 0 (0.0%) | 0 (0.0%) |
| $5,000 to $9,999 | 0 (0.0%) | 0 (0.0%) |
| $10,000 to $14,999 | 0 (0.0%) | 0 (0.0%) |
| $15,000 to $19,999 | 5 (6.0%) | 0 (0.0%) |
| $20,000 to $24,999 | 0 (0.0%) | 0 (0.0%) |
| $25,000 to $34,999 | 5 (6.0%) | 0 (0.0%) |
| $35,000 to $49,999 | 10 (12.0%) | 0 (0.0%) |
| $50,000 to $74,999 | 12 (14.5%) | 0 (0.0%) |
| $75,000 to $99,999 | 0 (0.0%) | 0 (0.0%) |
| $100,000 to $149,999 | 21 (25.3%) | 0 (0.0%) |
| $150,000 or more | 30 (36.1%) | 0 (0.0%) |
| Total | 83 (100.0%) | 0 (0.0%) |
Monthly Housing Cost Tiers in Wedgewood
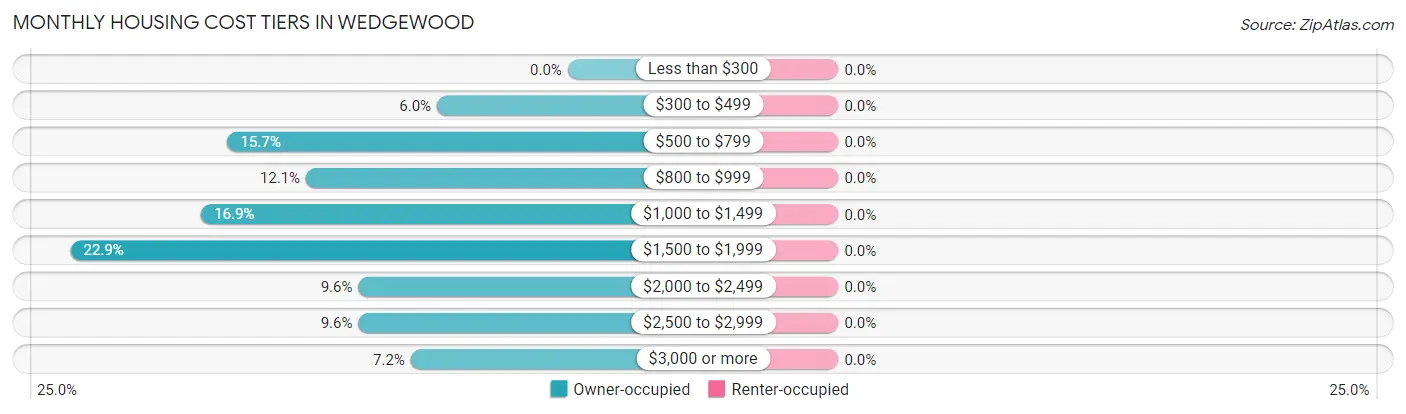
| Monthly Cost | Owner-occupied | Renter-occupied |
| Less than $300 | 0 (0.0%) | 0 (0.0%) |
| $300 to $499 | 5 (6.0%) | 0 (0.0%) |
| $500 to $799 | 13 (15.7%) | 0 (0.0%) |
| $800 to $999 | 10 (12.0%) | 0 (0.0%) |
| $1,000 to $1,499 | 14 (16.9%) | 0 (0.0%) |
| $1,500 to $1,999 | 19 (22.9%) | 0 (0.0%) |
| $2,000 to $2,499 | 8 (9.6%) | 0 (0.0%) |
| $2,500 to $2,999 | 8 (9.6%) | 0 (0.0%) |
| $3,000 or more | 6 (7.2%) | 0 (0.0%) |
| Total | 83 (100.0%) | 0 (0.0%) |
Physical Housing Characteristics in Wedgewood
Housing Structures in Wedgewood
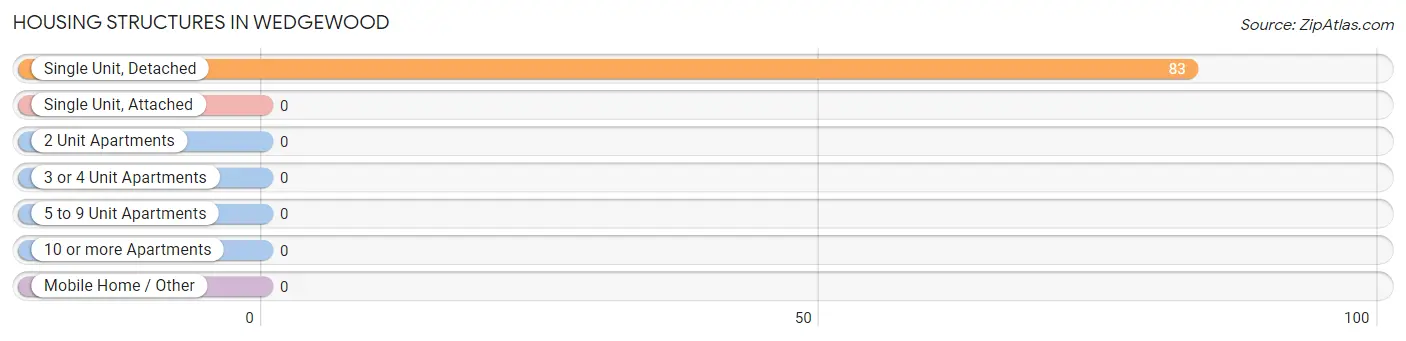
| Structure Type | # Housing Units | % Housing Units |
| Single Unit, Detached | 83 | 100.0% |
| Single Unit, Attached | 0 | 0.0% |
| 2 Unit Apartments | 0 | 0.0% |
| 3 or 4 Unit Apartments | 0 | 0.0% |
| 5 to 9 Unit Apartments | 0 | 0.0% |
| 10 or more Apartments | 0 | 0.0% |
| Mobile Home / Other | 0 | 0.0% |
| Total | 83 | 100.0% |
Housing Structures by Occupancy in Wedgewood
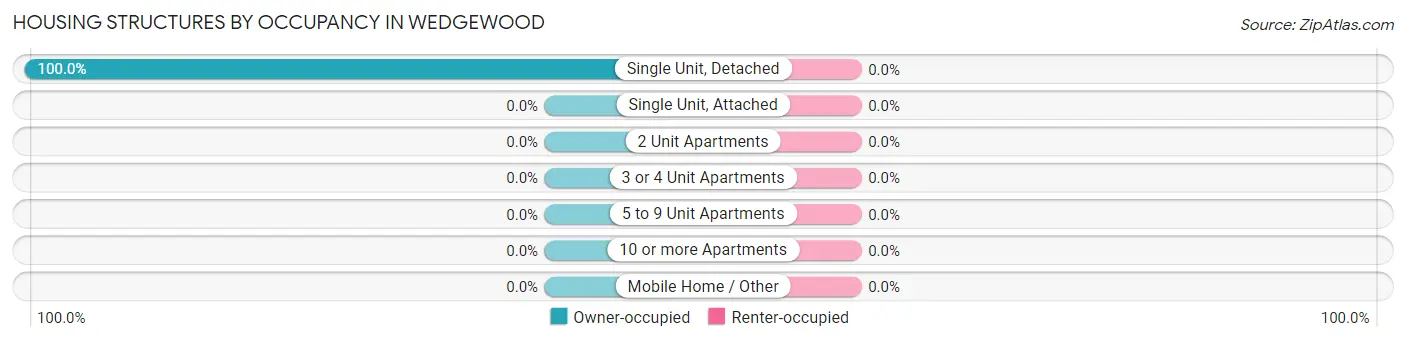
| Structure Type | Owner-occupied | Renter-occupied |
| Single Unit, Detached | 83 (100.0%) | 0 (0.0%) |
| Single Unit, Attached | 0 (0.0%) | 0 (0.0%) |
| 2 Unit Apartments | 0 (0.0%) | 0 (0.0%) |
| 3 or 4 Unit Apartments | 0 (0.0%) | 0 (0.0%) |
| 5 to 9 Unit Apartments | 0 (0.0%) | 0 (0.0%) |
| 10 or more Apartments | 0 (0.0%) | 0 (0.0%) |
| Mobile Home / Other | 0 (0.0%) | 0 (0.0%) |
| Total | 83 (100.0%) | 0 (0.0%) |
Housing Structures by Number of Rooms in Wedgewood
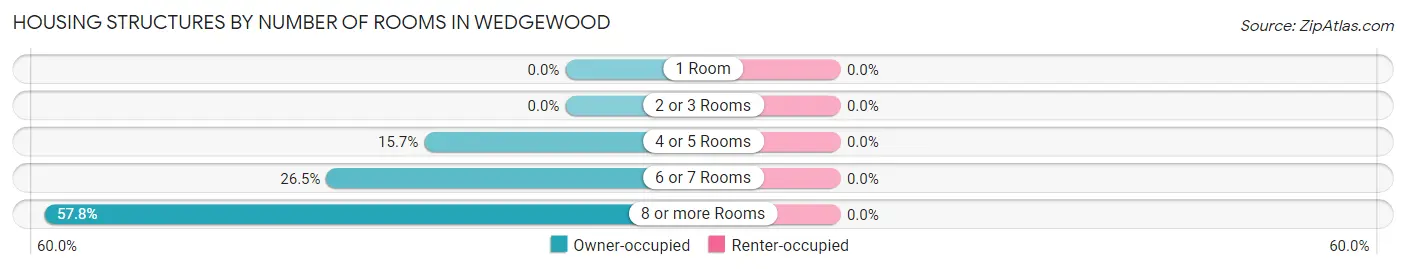
| Number of Rooms | Owner-occupied | Renter-occupied |
| 1 Room | 0 (0.0%) | 0 (0.0%) |
| 2 or 3 Rooms | 0 (0.0%) | 0 (0.0%) |
| 4 or 5 Rooms | 13 (15.7%) | 0 (0.0%) |
| 6 or 7 Rooms | 22 (26.5%) | 0 (0.0%) |
| 8 or more Rooms | 48 (57.8%) | 0 (0.0%) |
| Total | 83 (100.0%) | 0 (0.0%) |
Housing Structure by Heating Type in Wedgewood
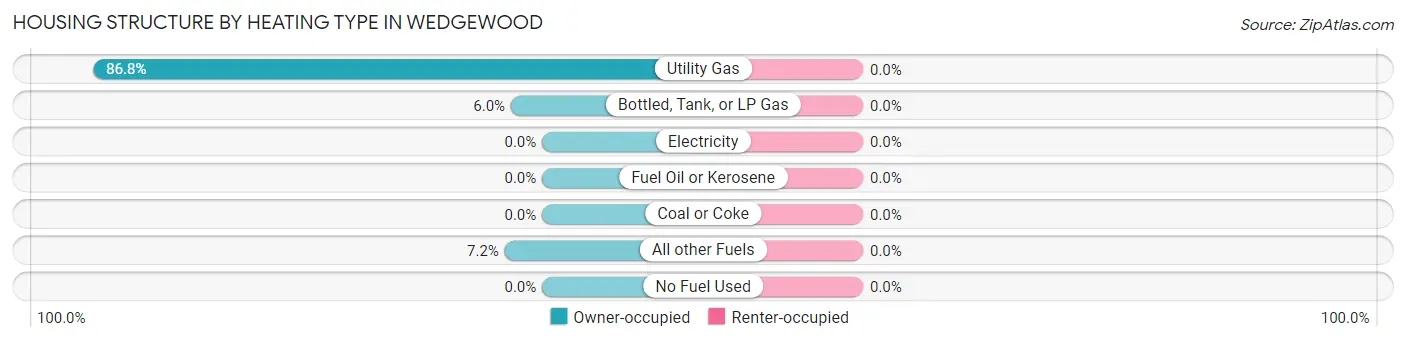
| Heating Type | Owner-occupied | Renter-occupied |
| Utility Gas | 72 (86.8%) | 0 (0.0%) |
| Bottled, Tank, or LP Gas | 5 (6.0%) | 0 (0.0%) |
| Electricity | 0 (0.0%) | 0 (0.0%) |
| Fuel Oil or Kerosene | 0 (0.0%) | 0 (0.0%) |
| Coal or Coke | 0 (0.0%) | 0 (0.0%) |
| All other Fuels | 6 (7.2%) | 0 (0.0%) |
| No Fuel Used | 0 (0.0%) | 0 (0.0%) |
| Total | 83 (100.0%) | 0 (0.0%) |
Household Vehicle Usage in Wedgewood
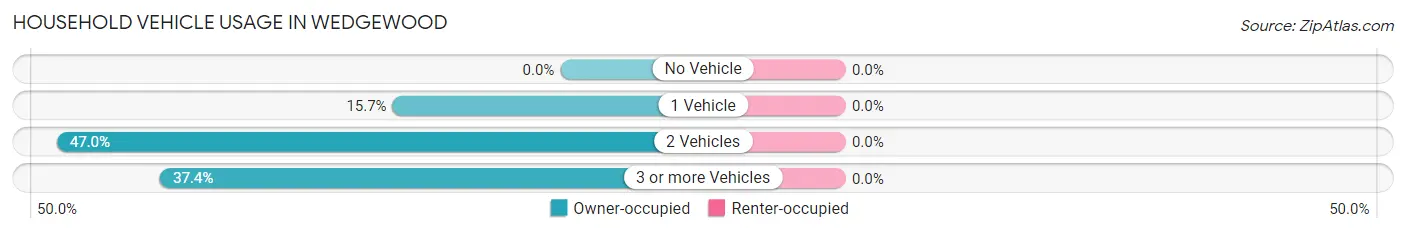
| Vehicles per Household | Owner-occupied | Renter-occupied |
| No Vehicle | 0 (0.0%) | 0 (0.0%) |
| 1 Vehicle | 13 (15.7%) | 0 (0.0%) |
| 2 Vehicles | 39 (47.0%) | 0 (0.0%) |
| 3 or more Vehicles | 31 (37.3%) | 0 (0.0%) |
| Total | 83 (100.0%) | 0 (0.0%) |
Real Estate & Mortgages in Wedgewood
Real Estate and Mortgage Overview in Wedgewood
| Characteristic | Without Mortgage | With Mortgage |
| Housing Units | 31 | 52 |
| Median Property Value | $311,500 | $296,200 |
| Median Household Income | - | - |
| Monthly Housing Costs | $672 | $6 |
| Real Estate Taxes | $4,115 | $6 |
Property Value by Mortgage Status in Wedgewood
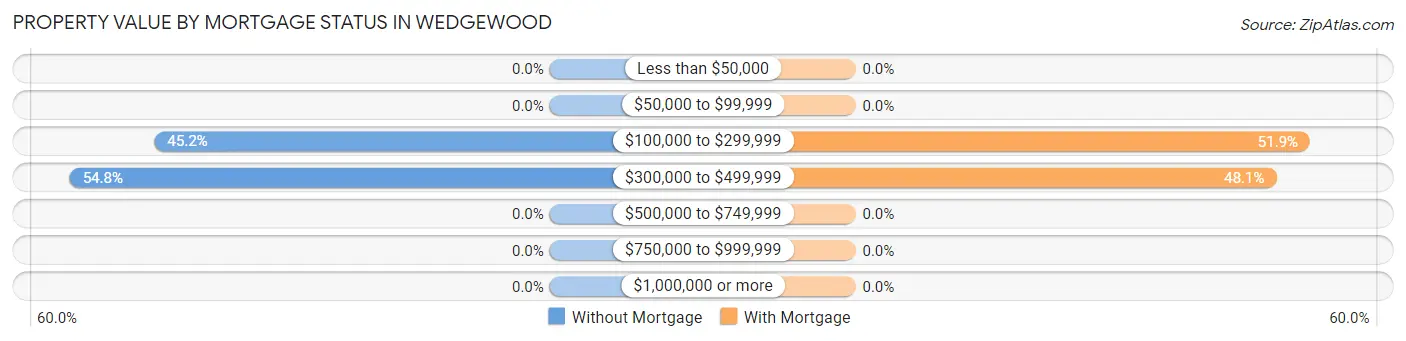
| Property Value | Without Mortgage | With Mortgage |
| Less than $50,000 | 0 (0.0%) | 0 (0.0%) |
| $50,000 to $99,999 | 0 (0.0%) | 0 (0.0%) |
| $100,000 to $299,999 | 14 (45.2%) | 27 (51.9%) |
| $300,000 to $499,999 | 17 (54.8%) | 25 (48.1%) |
| $500,000 to $749,999 | 0 (0.0%) | 0 (0.0%) |
| $750,000 to $999,999 | 0 (0.0%) | 0 (0.0%) |
| $1,000,000 or more | 0 (0.0%) | 0 (0.0%) |
| Total | 31 (100.0%) | 52 (100.0%) |
Household Income by Mortgage Status in Wedgewood
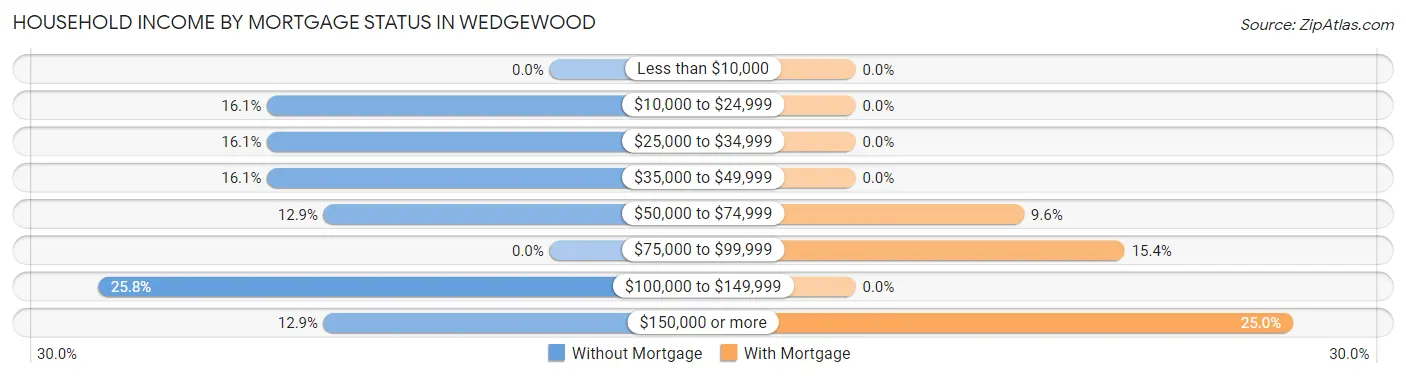
| Household Income | Without Mortgage | With Mortgage |
| Less than $10,000 | 0 (0.0%) | 0 (0.0%) |
| $10,000 to $24,999 | 5 (16.1%) | 0 (0.0%) |
| $25,000 to $34,999 | 5 (16.1%) | 0 (0.0%) |
| $35,000 to $49,999 | 5 (16.1%) | 0 (0.0%) |
| $50,000 to $74,999 | 4 (12.9%) | 5 (9.6%) |
| $75,000 to $99,999 | 0 (0.0%) | 8 (15.4%) |
| $100,000 to $149,999 | 8 (25.8%) | 0 (0.0%) |
| $150,000 or more | 4 (12.9%) | 13 (25.0%) |
| Total | 31 (100.0%) | 52 (100.0%) |
Property Value to Household Income Ratio in Wedgewood
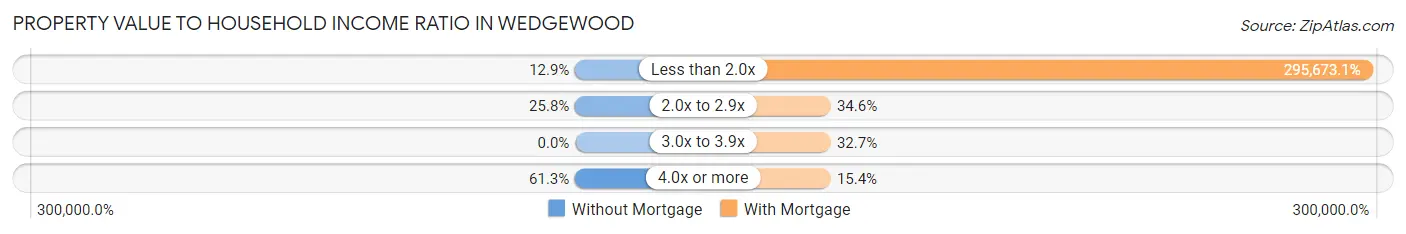
| Value-to-Income Ratio | Without Mortgage | With Mortgage |
| Less than 2.0x | 4 (12.9%) | 153,750 (295,673.1%) |
| 2.0x to 2.9x | 8 (25.8%) | 18 (34.6%) |
| 3.0x to 3.9x | 0 (0.0%) | 17 (32.7%) |
| 4.0x or more | 19 (61.3%) | 8 (15.4%) |
| Total | 31 (100.0%) | 52 (100.0%) |
Real Estate Taxes by Mortgage Status in Wedgewood
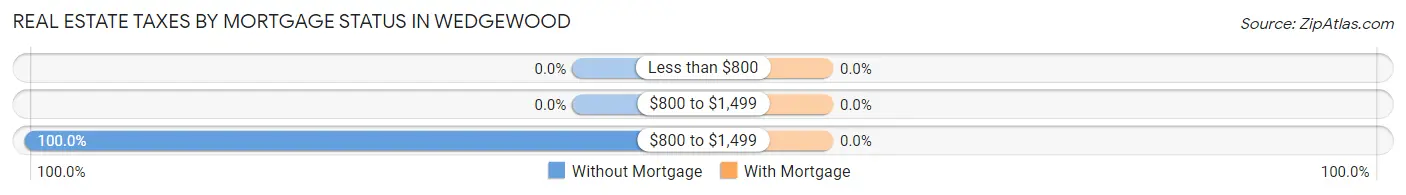
| Property Taxes | Without Mortgage | With Mortgage |
| Less than $800 | 0 (0.0%) | 0 (0.0%) |
| $800 to $1,499 | 0 (0.0%) | 0 (0.0%) |
| $800 to $1,499 | 31 (100.0%) | 0 (0.0%) |
| Total | 31 (100.0%) | 52 (100.0%) |
Health & Disability in Wedgewood
Health Insurance Coverage by Age in Wedgewood
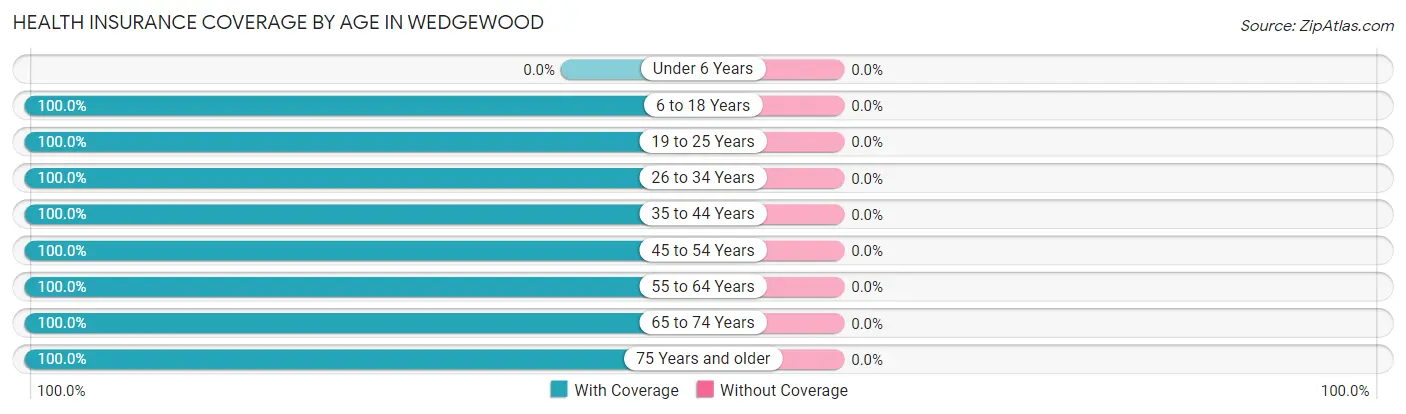
| Age Bracket | With Coverage | Without Coverage |
| Under 6 Years | 0 (0.0%) | 0 (0.0%) |
| 6 to 18 Years | 57 (100.0%) | 0 (0.0%) |
| 19 to 25 Years | 10 (100.0%) | 0 (0.0%) |
| 26 to 34 Years | 6 (100.0%) | 0 (0.0%) |
| 35 to 44 Years | 16 (100.0%) | 0 (0.0%) |
| 45 to 54 Years | 29 (100.0%) | 0 (0.0%) |
| 55 to 64 Years | 47 (100.0%) | 0 (0.0%) |
| 65 to 74 Years | 40 (100.0%) | 0 (0.0%) |
| 75 Years and older | 29 (100.0%) | 0 (0.0%) |
| Total | 234 (100.0%) | 0 (0.0%) |
Health Insurance Coverage by Citizenship Status in Wedgewood
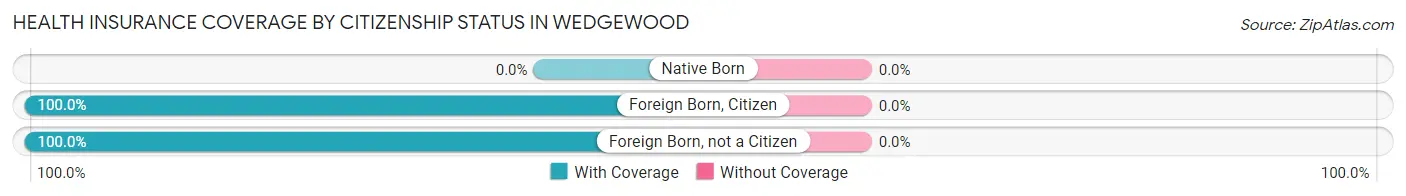
| Citizenship Status | With Coverage | Without Coverage |
| Native Born | 0 (0.0%) | 0 (0.0%) |
| Foreign Born, Citizen | 57 (100.0%) | 0 (0.0%) |
| Foreign Born, not a Citizen | 10 (100.0%) | 0 (0.0%) |
Health Insurance Coverage by Household Income in Wedgewood
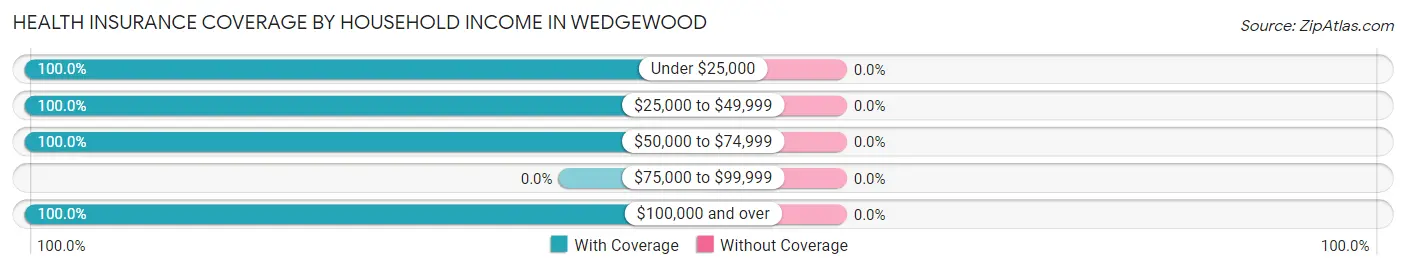
| Household Income | With Coverage | Without Coverage |
| Under $25,000 | 5 (100.0%) | 0 (0.0%) |
| $25,000 to $49,999 | 29 (100.0%) | 0 (0.0%) |
| $50,000 to $74,999 | 33 (100.0%) | 0 (0.0%) |
| $75,000 to $99,999 | 0 (0.0%) | 0 (0.0%) |
| $100,000 and over | 167 (100.0%) | 0 (0.0%) |
Public vs Private Health Insurance Coverage by Age in Wedgewood
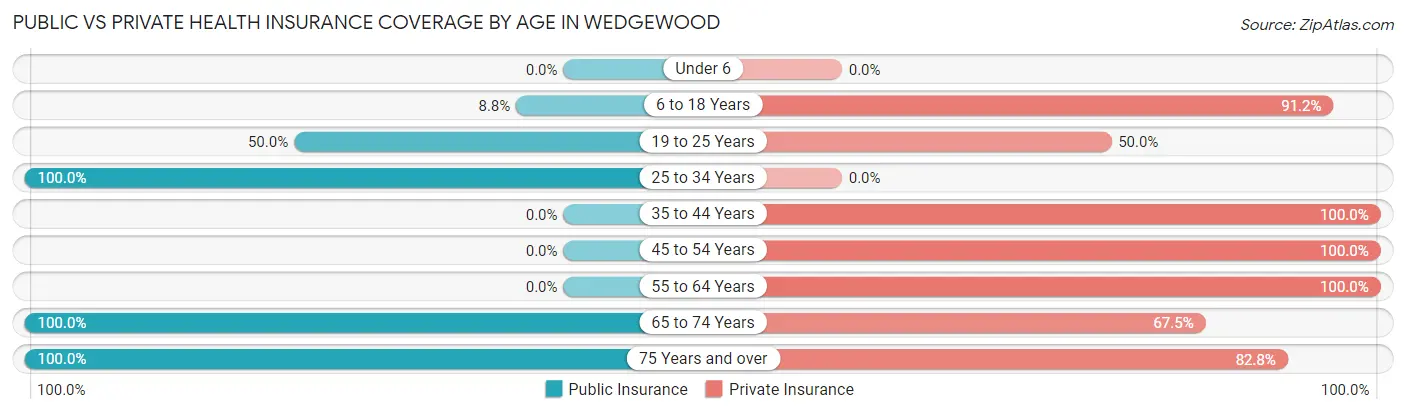
| Age Bracket | Public Insurance | Private Insurance |
| Under 6 | 0 (0.0%) | 0 (0.0%) |
| 6 to 18 Years | 5 (8.8%) | 52 (91.2%) |
| 19 to 25 Years | 5 (50.0%) | 5 (50.0%) |
| 25 to 34 Years | 6 (100.0%) | 0 (0.0%) |
| 35 to 44 Years | 0 (0.0%) | 16 (100.0%) |
| 45 to 54 Years | 0 (0.0%) | 29 (100.0%) |
| 55 to 64 Years | 0 (0.0%) | 47 (100.0%) |
| 65 to 74 Years | 40 (100.0%) | 27 (67.5%) |
| 75 Years and over | 29 (100.0%) | 24 (82.8%) |
| Total | 85 (36.3%) | 200 (85.5%) |
Disability Status by Sex by Age in Wedgewood
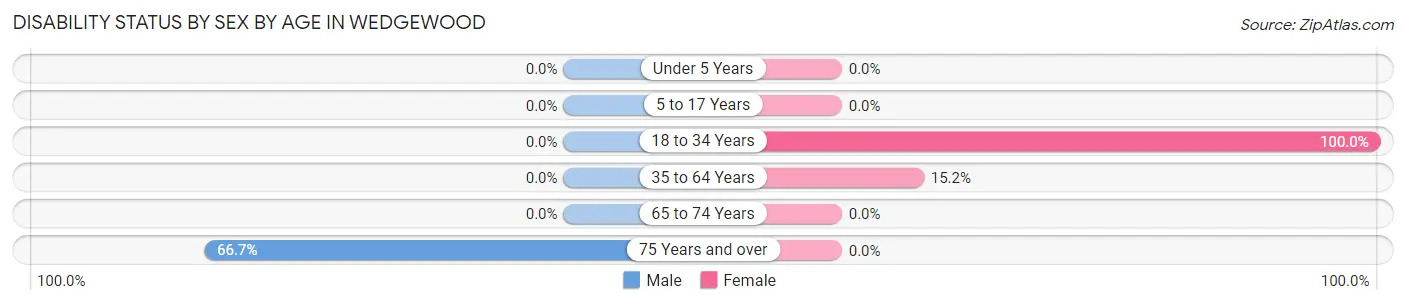
| Age Bracket | Male | Female |
| Under 5 Years | 0 (0.0%) | 0 (0.0%) |
| 5 to 17 Years | 0 (0.0%) | 0 (0.0%) |
| 18 to 34 Years | 0 (0.0%) | 8 (100.0%) |
| 35 to 64 Years | 0 (0.0%) | 7 (15.2%) |
| 65 to 74 Years | 0 (0.0%) | 0 (0.0%) |
| 75 Years and over | 10 (66.7%) | 0 (0.0%) |
Disability Class by Sex by Age in Wedgewood
Disability Class: Hearing Difficulty
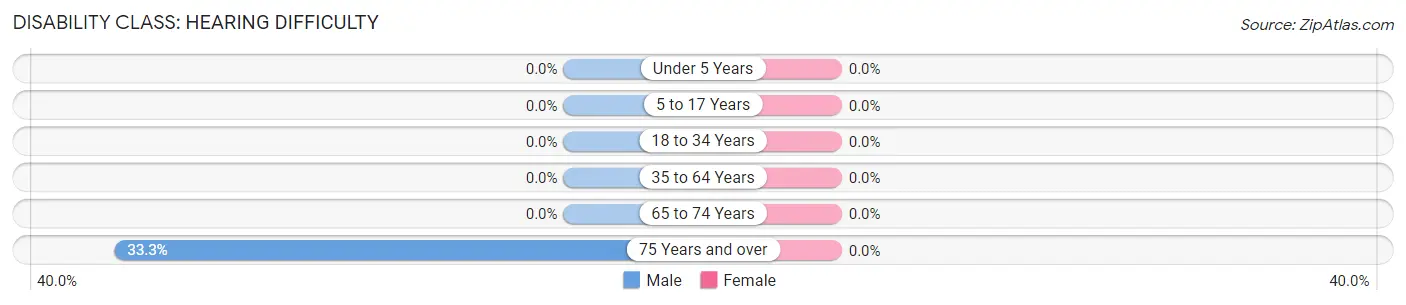
| Age Bracket | Male | Female |
| Under 5 Years | 0 (0.0%) | 0 (0.0%) |
| 5 to 17 Years | 0 (0.0%) | 0 (0.0%) |
| 18 to 34 Years | 0 (0.0%) | 0 (0.0%) |
| 35 to 64 Years | 0 (0.0%) | 0 (0.0%) |
| 65 to 74 Years | 0 (0.0%) | 0 (0.0%) |
| 75 Years and over | 5 (33.3%) | 0 (0.0%) |
Disability Class: Vision Difficulty
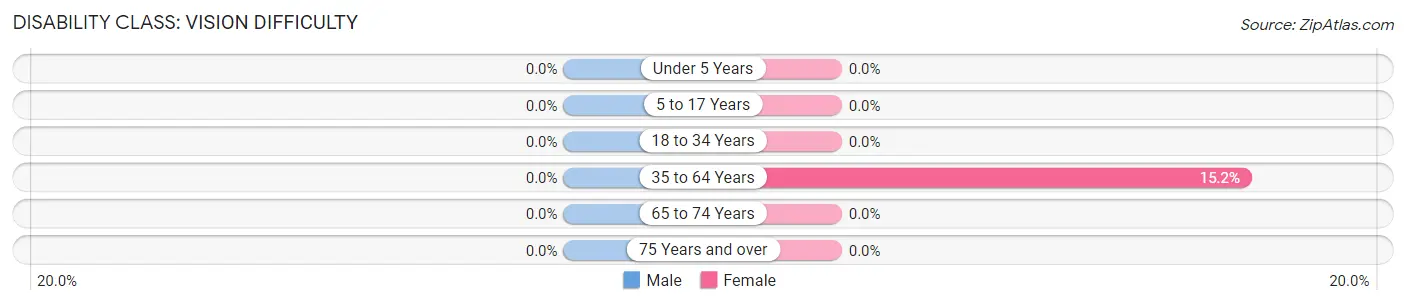
| Age Bracket | Male | Female |
| Under 5 Years | 0 (0.0%) | 0 (0.0%) |
| 5 to 17 Years | 0 (0.0%) | 0 (0.0%) |
| 18 to 34 Years | 0 (0.0%) | 0 (0.0%) |
| 35 to 64 Years | 0 (0.0%) | 7 (15.2%) |
| 65 to 74 Years | 0 (0.0%) | 0 (0.0%) |
| 75 Years and over | 0 (0.0%) | 0 (0.0%) |
Disability Class: Cognitive Difficulty
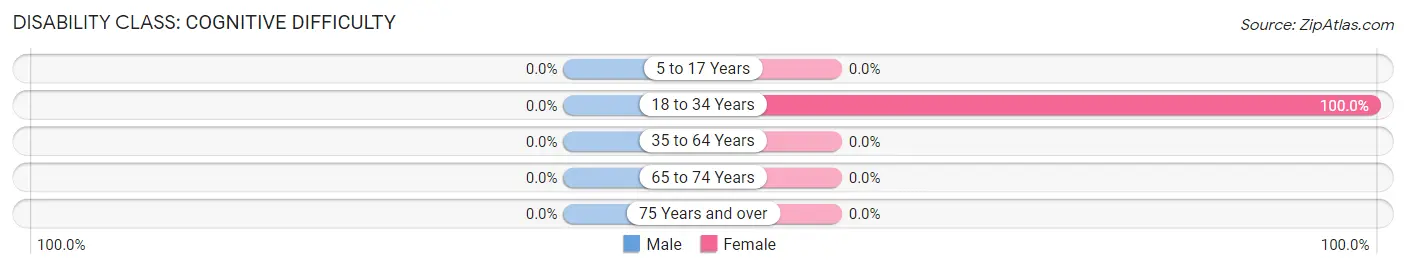
| Age Bracket | Male | Female |
| 5 to 17 Years | 0 (0.0%) | 0 (0.0%) |
| 18 to 34 Years | 0 (0.0%) | 8 (100.0%) |
| 35 to 64 Years | 0 (0.0%) | 0 (0.0%) |
| 65 to 74 Years | 0 (0.0%) | 0 (0.0%) |
| 75 Years and over | 0 (0.0%) | 0 (0.0%) |
Disability Class: Ambulatory Difficulty
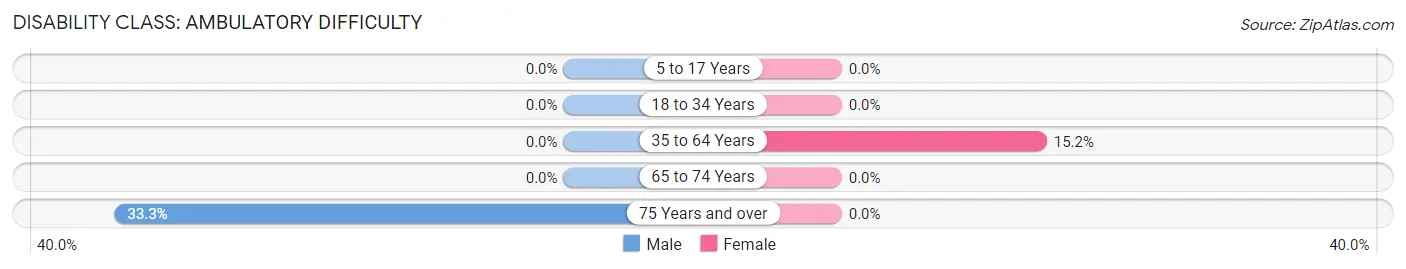
| Age Bracket | Male | Female |
| 5 to 17 Years | 0 (0.0%) | 0 (0.0%) |
| 18 to 34 Years | 0 (0.0%) | 0 (0.0%) |
| 35 to 64 Years | 0 (0.0%) | 7 (15.2%) |
| 65 to 74 Years | 0 (0.0%) | 0 (0.0%) |
| 75 Years and over | 5 (33.3%) | 0 (0.0%) |
Disability Class: Self-Care Difficulty
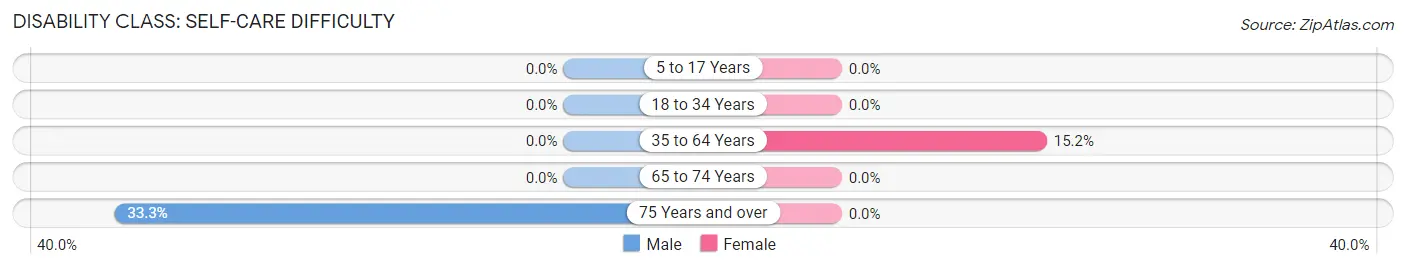
| Age Bracket | Male | Female |
| 5 to 17 Years | 0 (0.0%) | 0 (0.0%) |
| 18 to 34 Years | 0 (0.0%) | 0 (0.0%) |
| 35 to 64 Years | 0 (0.0%) | 7 (15.2%) |
| 65 to 74 Years | 0 (0.0%) | 0 (0.0%) |
| 75 Years and over | 5 (33.3%) | 0 (0.0%) |
Technology Access in Wedgewood
Computing Device Access in Wedgewood
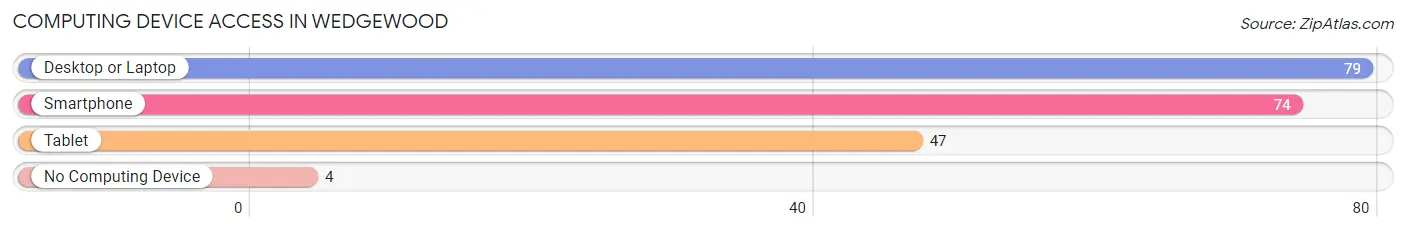
| Device Type | # Households | % Households |
| Desktop or Laptop | 79 | 95.2% |
| Smartphone | 74 | 89.2% |
| Tablet | 47 | 56.6% |
| No Computing Device | 4 | 4.8% |
| Total | 83 | 100.0% |
Internet Access in Wedgewood
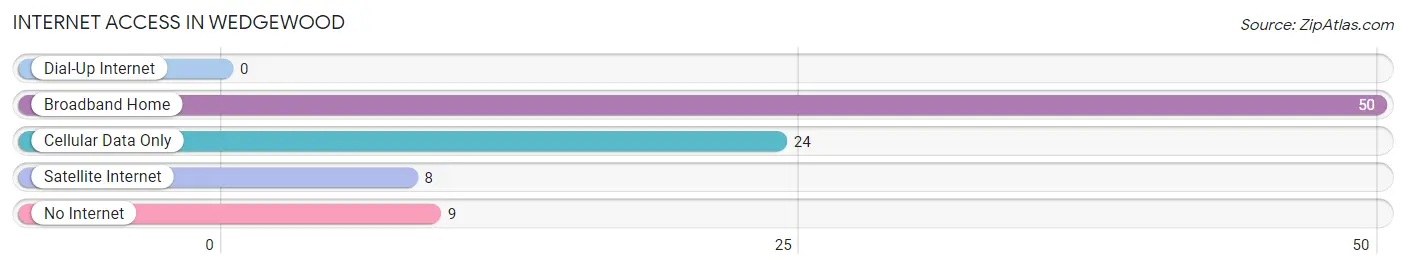
| Internet Type | # Households | % Households |
| Dial-Up Internet | 0 | 0.0% |
| Broadband Home | 50 | 60.2% |
| Cellular Data Only | 24 | 28.9% |
| Satellite Internet | 8 | 9.6% |
| No Internet | 9 | 10.8% |
| Total | 83 | 100.0% |
Wedgewood Summary
Wedgewood is a small unincorporated community located in the Upper Peninsula of Michigan. It is situated in the western part of the state, in the county of Menominee. The population of Wedgewood is estimated to be around 200 people.
History
Wedgewood was first settled in the late 1800s by a group of Finnish immigrants. The town was originally called “Kivimaki”, which means “stone hill” in Finnish. The town was renamed Wedgewood in the early 1900s, after a local landowner.
Wedgewood was a small farming community for many years, with the main crops being potatoes and hay. The town also had a sawmill and a few small businesses. In the 1950s, the town began to decline as many of the residents moved away in search of better economic opportunities.
Geography
Wedgewood is located in the western part of the Upper Peninsula of Michigan. It is situated in the county of Menominee, about 25 miles east of the city of Escanaba. The town is surrounded by forests and lakes, and is located near the Menominee River.
The climate in Wedgewood is typical of the Upper Peninsula, with cold winters and warm summers. The average temperature in the winter is around 20 degrees Fahrenheit, and the average temperature in the summer is around 70 degrees Fahrenheit.
Economy
Wedgewood’s economy is largely based on tourism. The town is home to several small businesses, including a restaurant, a general store, and a few bed and breakfasts. The town also has a few small farms, which produce hay and potatoes.
Demographics
Wedgewood has a population of around 200 people. The town is predominantly white, with a small percentage of Native American and African American residents. The median household income in Wedgewood is around $30,000, and the median home value is around $90,000.
Wedgewood is a small, rural community with a rich history and a unique culture. The town is a popular destination for tourists, and is a great place to live for those who enjoy the outdoors and a slower pace of life.
Common Questions
What is Per Capita Income in Wedgewood?
Per Capita income in Wedgewood is $43,606.
What is the Median Family Income in Wedgewood?
Median Family Income in Wedgewood is $129,167.
What is the Median Household income in Wedgewood?
Median Household Income in Wedgewood is $125,938.
What is Inequality or Gini Index in Wedgewood?
Inequality or Gini Index in Wedgewood is 0.34.
What is the Total Population of Wedgewood?
Total Population of Wedgewood is 250.
What is the Total Male Population of Wedgewood?
Total Male Population of Wedgewood is 117.
What is the Total Female Population of Wedgewood?
Total Female Population of Wedgewood is 133.
What is the Ratio of Males per 100 Females in Wedgewood?
There are 87.97 Males per 100 Females in Wedgewood.
What is the Ratio of Females per 100 Males in Wedgewood?
There are 113.68 Females per 100 Males in Wedgewood.
What is the Median Population Age in Wedgewood?
Median Population Age in Wedgewood is 58.3 Years.
What is the Average Family Size in Wedgewood
Average Family Size in Wedgewood is 3.0 People.
What is the Average Household Size in Wedgewood
Average Household Size in Wedgewood is 2.8 People.
How Large is the Labor Force in Wedgewood?
There are 98 People in the Labor Forcein in Wedgewood.
What is the Percentage of People in the Labor Force in Wedgewood?
44.5% of People are in the Labor Force in Wedgewood.