Cities with the Highest Percentage of Scandinavian Population in Michigan
RELATED REPORTS & OPTIONS
Scandinavian
Michigan
Compare Cities
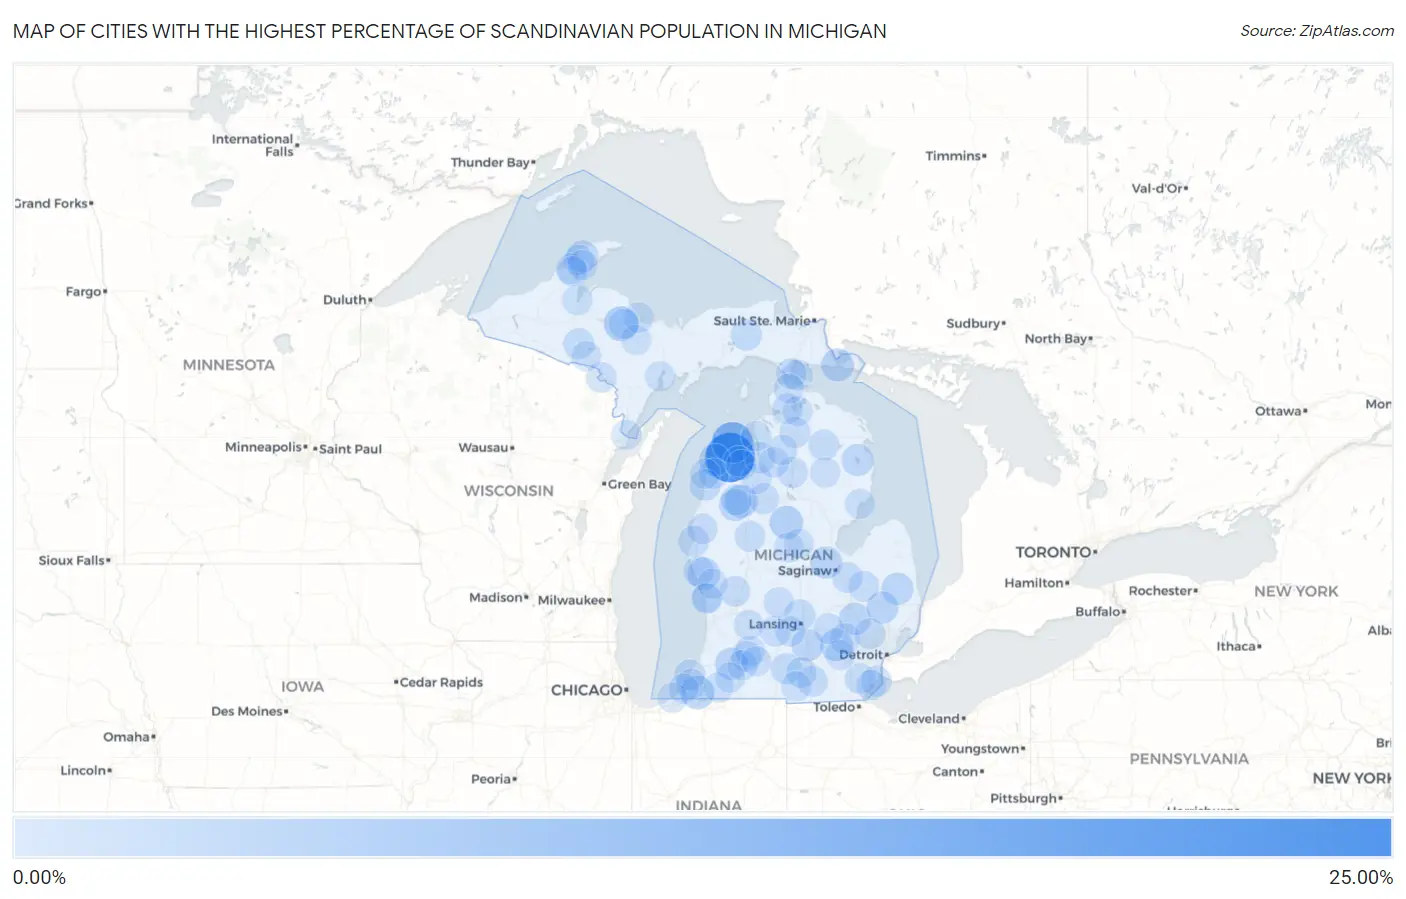
Map of Cities with the Highest Percentage of Scandinavian Population in Michigan
0.00%
25.00%
Cities with the Highest Percentage of Scandinavian Population in Michigan
| City | Scandinavian | vs State | vs National | |
| 1. | Cedar | 21.95% | 0.26%(+21.7)#1 | 0.30%(+21.6)#30 |
| 2. | Leland | 12.50% | 0.26%(+12.2)#2 | 0.30%(+12.2)#82 |
| 3. | Skanee | 7.37% | 0.26%(+7.11)#3 | 0.30%(+7.06)#186 |
| 4. | West Ishpeming | 5.46% | 0.26%(+5.20)#4 | 0.30%(+5.15)#295 |
| 5. | Buchanan | 4.23% | 0.26%(+3.97)#5 | 0.30%(+3.93)#440 |
| 6. | Harrison | 4.11% | 0.26%(+3.85)#6 | 0.30%(+3.81)#458 |
| 7. | Boon | 3.57% | 0.26%(+3.31)#7 | 0.30%(+3.27)#574 |
| 8. | De Tour Village | 3.54% | 0.26%(+3.28)#8 | 0.30%(+3.24)#576 |
| 9. | Pinckney | 3.23% | 0.26%(+2.97)#9 | 0.30%(+2.93)#669 |
| 10. | Lakewood Club | 3.20% | 0.26%(+2.95)#10 | 0.30%(+2.90)#676 |
| 11. | Ruby | 3.05% | 0.26%(+2.79)#11 | 0.30%(+2.75)#721 |
| 12. | Mattawan | 2.92% | 0.26%(+2.66)#12 | 0.30%(+2.62)#770 |
| 13. | Leslie | 2.83% | 0.26%(+2.57)#13 | 0.30%(+2.53)#810 |
| 14. | Freeland | 2.83% | 0.26%(+2.57)#14 | 0.30%(+2.52)#814 |
| 15. | Empire | 2.81% | 0.26%(+2.55)#15 | 0.30%(+2.50)#825 |
| 16. | Caberfae | 2.78% | 0.26%(+2.52)#16 | 0.30%(+2.47)#835 |
| 17. | Holly | 2.68% | 0.26%(+2.43)#17 | 0.30%(+2.38)#880 |
| 18. | Melvin | 2.66% | 0.26%(+2.40)#18 | 0.30%(+2.36)#891 |
| 19. | Dryden | 2.63% | 0.26%(+2.37)#19 | 0.30%(+2.32)#904 |
| 20. | Hubbard Lake | 2.54% | 0.26%(+2.28)#20 | 0.30%(+2.23)#952 |
| 21. | Ahmeek | 2.30% | 0.26%(+2.04)#21 | 0.30%(+1.99)#1,082 |
| 22. | Arcadia | 2.01% | 0.26%(+1.76)#22 | 0.30%(+1.71)#1,302 |
| 23. | Newberry | 1.85% | 0.26%(+1.59)#23 | 0.30%(+1.54)#1,443 |
| 24. | Rapid City | 1.76% | 0.26%(+1.50)#24 | 0.30%(+1.45)#1,546 |
| 25. | Homer | 1.74% | 0.26%(+1.49)#25 | 0.30%(+1.44)#1,559 |
| 26. | Lake Gogebic | 1.71% | 0.26%(+1.45)#26 | 0.30%(+1.41)#1,597 |
| 27. | Dewitt | 1.63% | 0.26%(+1.37)#27 | 0.30%(+1.33)#1,692 |
| 28. | Tower | 1.60% | 0.26%(+1.34)#28 | 0.30%(+1.29)#1,738 |
| 29. | Amasa | 1.56% | 0.26%(+1.30)#29 | 0.30%(+1.25)#1,781 |
| 30. | Shoreham | 1.52% | 0.26%(+1.26)#30 | 0.30%(+1.22)#1,824 |
| 31. | Painesdale | 1.52% | 0.26%(+1.26)#31 | 0.30%(+1.21)#1,834 |
| 32. | Brighton | 1.47% | 0.26%(+1.21)#32 | 0.30%(+1.17)#1,887 |
| 33. | Pentwater | 1.45% | 0.26%(+1.19)#33 | 0.30%(+1.14)#1,920 |
| 34. | Mackinac Island | 1.44% | 0.26%(+1.18)#34 | 0.30%(+1.13)#1,938 |
| 35. | Harrietta | 1.43% | 0.26%(+1.17)#35 | 0.30%(+1.12)#1,949 |
| 36. | Addison | 1.42% | 0.26%(+1.17)#36 | 0.30%(+1.12)#1,955 |
| 37. | Vanderbilt | 1.41% | 0.26%(+1.16)#37 | 0.30%(+1.11)#1,971 |
| 38. | Keego Harbor | 1.41% | 0.26%(+1.15)#38 | 0.30%(+1.10)#1,985 |
| 39. | Hersey | 1.40% | 0.26%(+1.15)#39 | 0.30%(+1.10)#1,988 |
| 40. | Atlanta | 1.39% | 0.26%(+1.13)#40 | 0.30%(+1.08)#2,007 |
| 41. | Otter Lake | 1.39% | 0.26%(+1.13)#41 | 0.30%(+1.08)#2,017 |
| 42. | Grayling | 1.37% | 0.26%(+1.11)#42 | 0.30%(+1.06)#2,045 |
| 43. | Frankenmuth | 1.32% | 0.26%(+1.06)#43 | 0.30%(+1.02)#2,126 |
| 44. | Lake City | 1.28% | 0.26%(+1.02)#44 | 0.30%(+0.978)#2,204 |
| 45. | Alanson | 1.28% | 0.26%(+1.02)#45 | 0.30%(+0.972)#2,218 |
| 46. | Hanover | 1.26% | 0.26%(+1.00)#46 | 0.30%(+0.955)#2,251 |
| 47. | Sparta | 1.25% | 0.26%(+0.990)#47 | 0.30%(+0.944)#2,280 |
| 48. | Lake Leann | 1.25% | 0.26%(+0.987)#48 | 0.30%(+0.941)#2,287 |
| 49. | Hancock | 1.24% | 0.26%(+0.979)#49 | 0.30%(+0.933)#2,304 |
| 50. | Maybee | 1.21% | 0.26%(+0.954)#50 | 0.30%(+0.908)#2,354 |
| 51. | Estral Beach | 1.21% | 0.26%(+0.952)#51 | 0.30%(+0.906)#2,358 |
| 52. | Whitehall | 1.19% | 0.26%(+0.934)#52 | 0.30%(+0.888)#2,392 |
| 53. | Fife Lake | 1.18% | 0.26%(+0.925)#53 | 0.30%(+0.879)#2,415 |
| 54. | Fowlerville | 1.15% | 0.26%(+0.894)#54 | 0.30%(+0.848)#2,485 |
| 55. | Comstock Northwest | 1.13% | 0.26%(+0.872)#55 | 0.30%(+0.826)#2,530 |
| 56. | Scottville | 1.12% | 0.26%(+0.866)#56 | 0.30%(+0.820)#2,542 |
| 57. | St Ignace | 1.12% | 0.26%(+0.861)#57 | 0.30%(+0.815)#2,553 |
| 58. | Vermontville | 1.12% | 0.26%(+0.857)#58 | 0.30%(+0.811)#2,564 |
| 59. | Manistee Lake | 1.09% | 0.26%(+0.835)#59 | 0.30%(+0.789)#2,627 |
| 60. | Iron Mountain | 1.08% | 0.26%(+0.819)#60 | 0.30%(+0.773)#2,667 |
| 61. | Baraga | 1.04% | 0.26%(+0.781)#61 | 0.30%(+0.735)#2,753 |
| 62. | Richland | 1.02% | 0.26%(+0.763)#62 | 0.30%(+0.717)#2,804 |
| 63. | Woodland Beach | 1.00% | 0.26%(+0.743)#63 | 0.30%(+0.696)#2,851 |
| 64. | Beulah | 1.00% | 0.26%(+0.742)#64 | 0.30%(+0.696)#2,856 |
| 65. | Chassell | 1.00% | 0.26%(+0.740)#65 | 0.30%(+0.694)#2,861 |
| 66. | Calumet | 0.97% | 0.26%(+0.715)#66 | 0.30%(+0.669)#2,926 |
| 67. | Greilickville | 0.95% | 0.26%(+0.696)#67 | 0.30%(+0.650)#2,970 |
| 68. | Potterville | 0.92% | 0.26%(+0.664)#68 | 0.30%(+0.618)#3,062 |
| 69. | Marquette | 0.89% | 0.26%(+0.627)#69 | 0.30%(+0.581)#3,179 |
| 70. | Lakes Of The North | 0.87% | 0.26%(+0.615)#70 | 0.30%(+0.569)#3,230 |
| 71. | Traverse City | 0.86% | 0.26%(+0.602)#71 | 0.30%(+0.556)#3,270 |
| 72. | Eastport | 0.85% | 0.26%(+0.596)#72 | 0.30%(+0.550)#3,284 |
| 73. | Muir | 0.85% | 0.26%(+0.588)#73 | 0.30%(+0.542)#3,316 |
| 74. | Spring Lake | 0.83% | 0.26%(+0.572)#74 | 0.30%(+0.526)#3,380 |
| 75. | Wolf Lake | 0.82% | 0.26%(+0.565)#75 | 0.30%(+0.519)#3,406 |
| 76. | Frankfort | 0.82% | 0.26%(+0.557)#76 | 0.30%(+0.511)#3,443 |
| 77. | Menominee | 0.81% | 0.26%(+0.548)#77 | 0.30%(+0.502)#3,475 |
| 78. | Tawas City | 0.80% | 0.26%(+0.542)#78 | 0.30%(+0.496)#3,502 |
| 79. | Baroda | 0.78% | 0.26%(+0.523)#79 | 0.30%(+0.477)#3,584 |
| 80. | Dexter | 0.78% | 0.26%(+0.519)#80 | 0.30%(+0.473)#3,610 |
| 81. | Indian River | 0.77% | 0.26%(+0.512)#81 | 0.30%(+0.466)#3,635 |
| 82. | Portage | 0.76% | 0.26%(+0.506)#82 | 0.30%(+0.460)#3,659 |
| 83. | Lake Linden | 0.76% | 0.26%(+0.503)#83 | 0.30%(+0.456)#3,672 |
| 84. | Climax | 0.75% | 0.26%(+0.495)#84 | 0.30%(+0.449)#3,697 |
| 85. | Hillsdale | 0.75% | 0.26%(+0.491)#85 | 0.30%(+0.445)#3,711 |
| 86. | Rosebush | 0.74% | 0.26%(+0.481)#86 | 0.30%(+0.435)#3,754 |
| 87. | Gwinn | 0.73% | 0.26%(+0.472)#87 | 0.30%(+0.426)#3,782 |
| 88. | Ishpeming | 0.73% | 0.26%(+0.469)#88 | 0.30%(+0.423)#3,808 |
| 89. | Gladstone | 0.73% | 0.26%(+0.468)#89 | 0.30%(+0.422)#3,811 |
| 90. | Carp Lake | 0.71% | 0.26%(+0.453)#90 | 0.30%(+0.407)#3,885 |
| 91. | Houghton | 0.71% | 0.26%(+0.452)#91 | 0.30%(+0.406)#3,888 |
| 92. | Grand Haven | 0.70% | 0.26%(+0.444)#92 | 0.30%(+0.398)#3,914 |
| 93. | Michiana | 0.70% | 0.26%(+0.443)#93 | 0.30%(+0.397)#3,917 |
| 94. | Coleman | 0.69% | 0.26%(+0.433)#94 | 0.30%(+0.387)#3,968 |
| 95. | Cassopolis | 0.69% | 0.26%(+0.427)#95 | 0.30%(+0.381)#3,994 |
| 96. | Middleville | 0.68% | 0.26%(+0.423)#96 | 0.30%(+0.377)#4,012 |
| 97. | Crystal Falls | 0.68% | 0.26%(+0.419)#97 | 0.30%(+0.373)#4,027 |
| 98. | Shorewood Tower Hills Harbert | 0.67% | 0.26%(+0.408)#98 | 0.30%(+0.362)#4,077 |
| 99. | Marcellus | 0.67% | 0.26%(+0.407)#99 | 0.30%(+0.361)#4,081 |
| 100. | Mio | 0.66% | 0.26%(+0.404)#100 | 0.30%(+0.358)#4,091 |
Common Questions
What are the Top 10 Cities with the Highest Percentage of Scandinavian Population in Michigan?
Top 10 Cities with the Highest Percentage of Scandinavian Population in Michigan are:
#1
21.95%
#2
12.50%
#3
5.46%
#4
4.23%
#5
4.11%
#6
3.57%
#7
3.54%
#8
3.23%
#9
3.20%
#10
2.92%
What city has the Highest Percentage of Scandinavian Population in Michigan?
Cedar has the Highest Percentage of Scandinavian Population in Michigan with 21.95%.
What is the Percentage of Scandinavian Population in the State of Michigan?
Percentage of Scandinavian Population in Michigan is 0.26%.
What is the Percentage of Scandinavian Population in the United States?
Percentage of Scandinavian Population in the United States is 0.30%.