Livonia, MI Map & Demographics
Livonia Map
Livonia Overview
$44,853
PER CAPITA INCOME
$112,225
AVG FAMILY INCOME
$92,458
AVG HOUSEHOLD INCOME
33.7%
WAGE / INCOME GAP [ % ]
66.3¢/ $1
WAGE / INCOME GAP [ $ ]
$8,618
FAMILY INCOME DEFICIT
0.38
INEQUALITY / GINI INDEX
94,928
TOTAL POPULATION
46,905
MALE POPULATION
48,023
FEMALE POPULATION
97.67
MALES / 100 FEMALES
102.38
FEMALES / 100 MALES
45.2
MEDIAN AGE
3.0
AVG FAMILY SIZE
2.5
AVG HOUSEHOLD SIZE
50,559
LABOR FORCE [ PEOPLE ]
63.4%
PERCENT IN LABOR FORCE
5.0%
UNEMPLOYMENT RATE
Income in Livonia
Income Overview in Livonia
Per Capita Income in Livonia is $44,853, while median incomes of families and households are $112,225 and $92,458 respectively.
| Characteristic | Number | Measure |
| Per Capita Income | 94,928 | $44,853 |
| Median Family Income | 25,335 | $112,225 |
| Mean Family Income | 25,335 | $128,050 |
| Median Household Income | 37,789 | $92,458 |
| Mean Household Income | 37,789 | $109,282 |
| Income Deficit | 25,335 | $8,618 |
| Wage / Income Gap (%) | 94,928 | 33.66% |
| Wage / Income Gap ($) | 94,928 | 66.34¢ per $1 |
| Gini / Inequality Index | 94,928 | 0.38 |
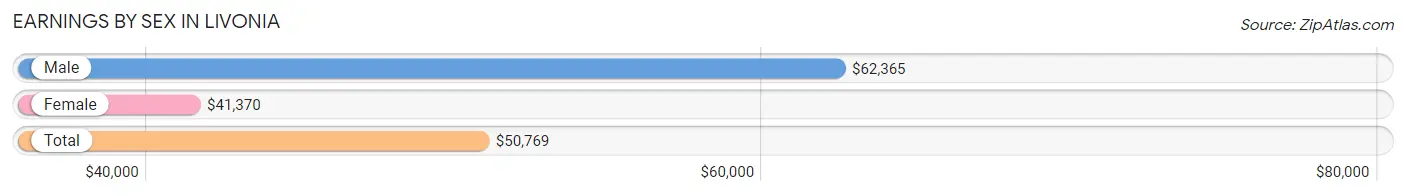
Earnings by Sex in Livonia
Average Earnings in Livonia are $50,769, $62,365 for men and $41,370 for women, a difference of 33.7%.
| Sex | Number | Average Earnings |
| Male | 28,044 (53.4%) | $62,365 |
| Female | 24,466 (46.6%) | $41,370 |
| Total | 52,510 (100.0%) | $50,769 |
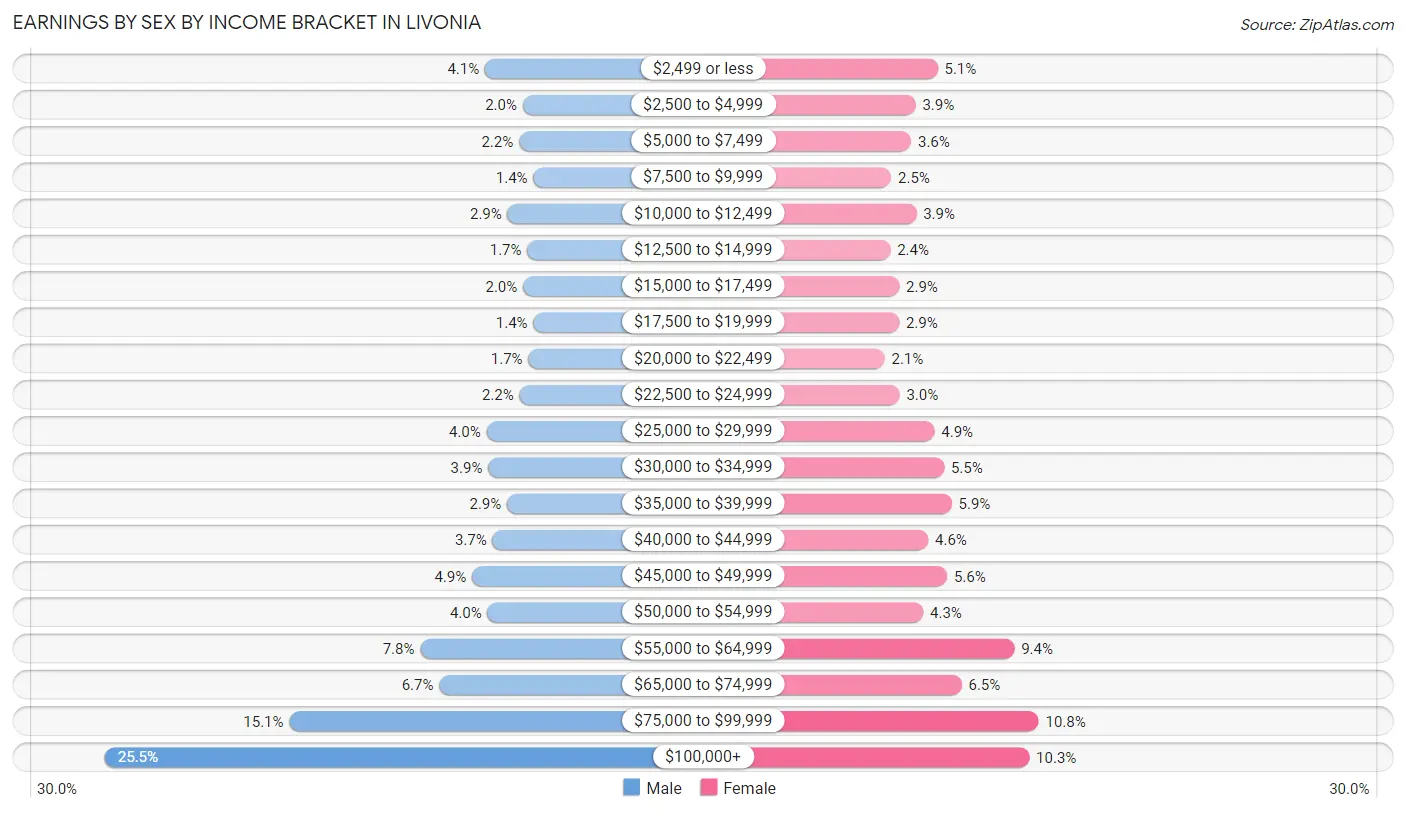
Earnings by Sex by Income Bracket in Livonia
The most common earnings brackets in Livonia are $100,000+ for men (7,148 | 25.5%) and $75,000 to $99,999 for women (2,638 | 10.8%).
| Income | Male | Female |
| $2,499 or less | 1,156 (4.1%) | 1,247 (5.1%) |
| $2,500 to $4,999 | 560 (2.0%) | 945 (3.9%) |
| $5,000 to $7,499 | 621 (2.2%) | 882 (3.6%) |
| $7,500 to $9,999 | 392 (1.4%) | 609 (2.5%) |
| $10,000 to $12,499 | 799 (2.9%) | 955 (3.9%) |
| $12,500 to $14,999 | 487 (1.7%) | 597 (2.4%) |
| $15,000 to $17,499 | 556 (2.0%) | 720 (2.9%) |
| $17,500 to $19,999 | 393 (1.4%) | 716 (2.9%) |
| $20,000 to $22,499 | 472 (1.7%) | 518 (2.1%) |
| $22,500 to $24,999 | 611 (2.2%) | 725 (3.0%) |
| $25,000 to $29,999 | 1,130 (4.0%) | 1,203 (4.9%) |
| $30,000 to $34,999 | 1,106 (3.9%) | 1,337 (5.5%) |
| $35,000 to $39,999 | 808 (2.9%) | 1,441 (5.9%) |
| $40,000 to $44,999 | 1,038 (3.7%) | 1,119 (4.6%) |
| $45,000 to $49,999 | 1,359 (4.9%) | 1,377 (5.6%) |
| $50,000 to $54,999 | 1,116 (4.0%) | 1,049 (4.3%) |
| $55,000 to $64,999 | 2,175 (7.8%) | 2,303 (9.4%) |
| $65,000 to $74,999 | 1,876 (6.7%) | 1,578 (6.5%) |
| $75,000 to $99,999 | 4,241 (15.1%) | 2,638 (10.8%) |
| $100,000+ | 7,148 (25.5%) | 2,507 (10.2%) |
| Total | 28,044 (100.0%) | 24,466 (100.0%) |
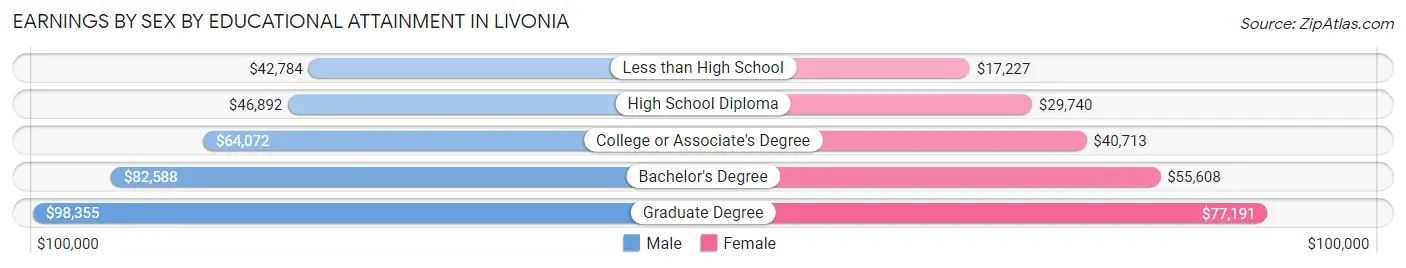
Earnings by Sex by Educational Attainment in Livonia
Average earnings in Livonia are $70,108 for men and $47,554 for women, a difference of 32.2%. Men with an educational attainment of graduate degree enjoy the highest average annual earnings of $98,355, while those with less than high school education earn the least with $42,784. Women with an educational attainment of graduate degree earn the most with the average annual earnings of $77,191, while those with less than high school education have the smallest earnings of $17,227.
| Educational Attainment | Male Income | Female Income |
| Less than High School | $42,784 | $17,227 |
| High School Diploma | $46,892 | $29,740 |
| College or Associate's Degree | $64,072 | $40,713 |
| Bachelor's Degree | $82,588 | $55,608 |
| Graduate Degree | $98,355 | $77,191 |
| Total | $70,108 | $47,554 |
Family Income in Livonia
Family Income Brackets in Livonia
According to the Livonia family income data, there are 6,714 families falling into the $100,000 to $149,999 income range, which is the most common income bracket and makes up 26.5% of all families. Conversely, the less than $10,000 income bracket is the least frequent group with only 127 families (0.5%) belonging to this category.
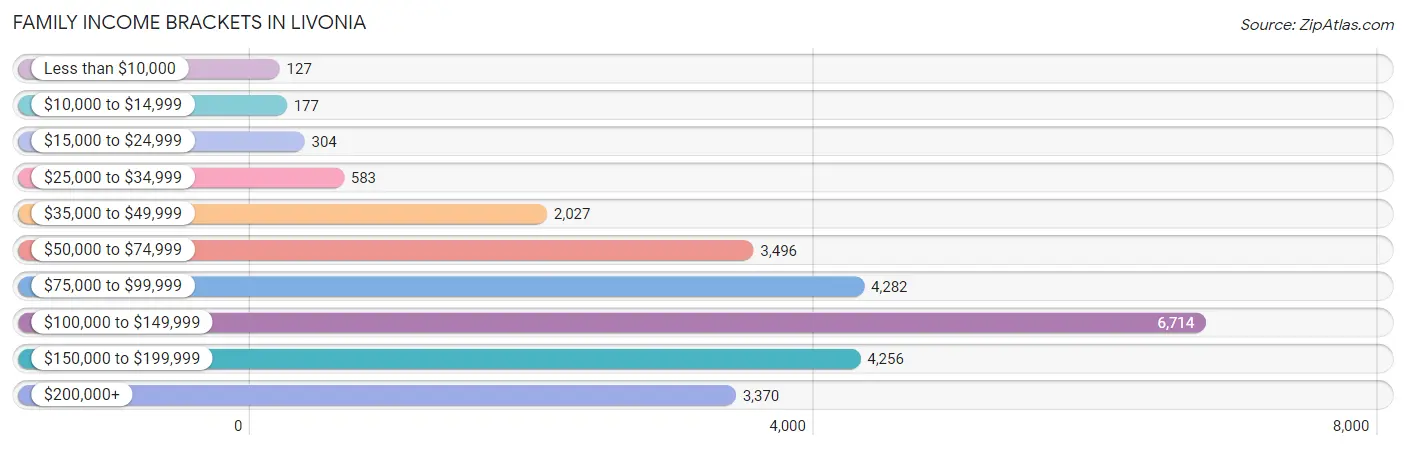
| Income Bracket | # Families | % Families |
| Less than $10,000 | 127 | 0.5% |
| $10,000 to $14,999 | 177 | 0.7% |
| $15,000 to $24,999 | 304 | 1.2% |
| $25,000 to $34,999 | 583 | 2.3% |
| $35,000 to $49,999 | 2,027 | 8.0% |
| $50,000 to $74,999 | 3,496 | 13.8% |
| $75,000 to $99,999 | 4,282 | 16.9% |
| $100,000 to $149,999 | 6,714 | 26.5% |
| $150,000 to $199,999 | 4,256 | 16.8% |
| $200,000+ | 3,370 | 13.3% |
Family Income by Famaliy Size in Livonia
7+ person families (150 | 0.6%) account for the highest median family income in Livonia with $163,026 per family, while 2-person families (12,768 | 50.4%) have the highest median income of $48,059 per family member.
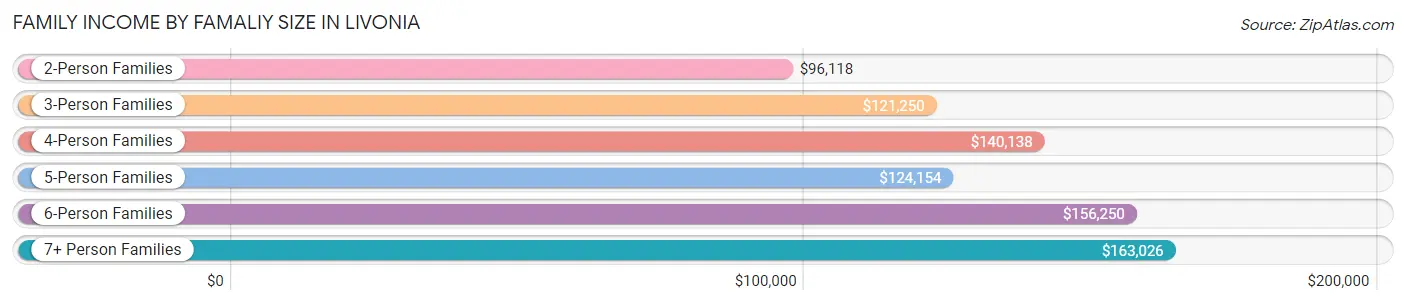
| Income Bracket | # Families | Median Income |
| 2-Person Families | 12,768 (50.4%) | $96,118 |
| 3-Person Families | 5,678 (22.4%) | $121,250 |
| 4-Person Families | 4,684 (18.5%) | $140,138 |
| 5-Person Families | 1,625 (6.4%) | $124,154 |
| 6-Person Families | 430 (1.7%) | $156,250 |
| 7+ Person Families | 150 (0.6%) | $163,026 |
| Total | 25,335 (100.0%) | $112,225 |
Family Income by Number of Earners in Livonia
The median family income in Livonia is $112,225, with families comprising 3+ earners (3,989) having the highest median family income of $169,702, while families with no earners (4,144) have the lowest median family income of $69,815, accounting for 15.8% and 16.4% of families, respectively.
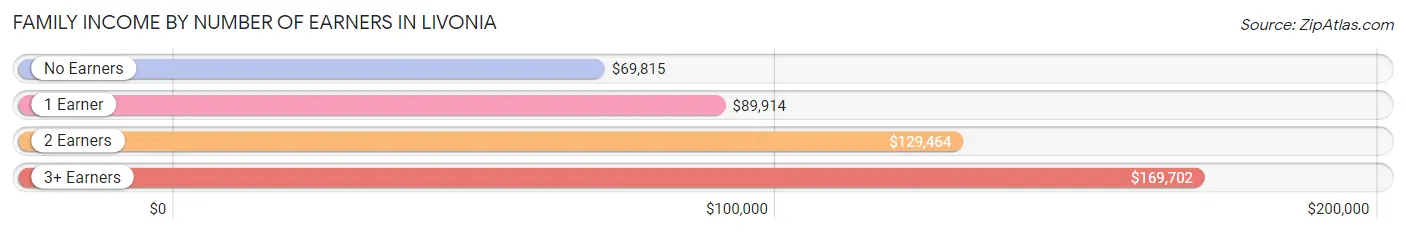
| Number of Earners | # Families | Median Income |
| No Earners | 4,144 (16.4%) | $69,815 |
| 1 Earner | 6,634 (26.2%) | $89,914 |
| 2 Earners | 10,568 (41.7%) | $129,464 |
| 3+ Earners | 3,989 (15.8%) | $169,702 |
| Total | 25,335 (100.0%) | $112,225 |
Household Income in Livonia
Household Income Brackets in Livonia
With 8,578 households falling in the category, the $100,000 to $149,999 income range is the most frequent in Livonia, accounting for 22.7% of all households. In contrast, only 718 households (1.9%) fall into the $10,000 to $14,999 income bracket, making it the least populous group.
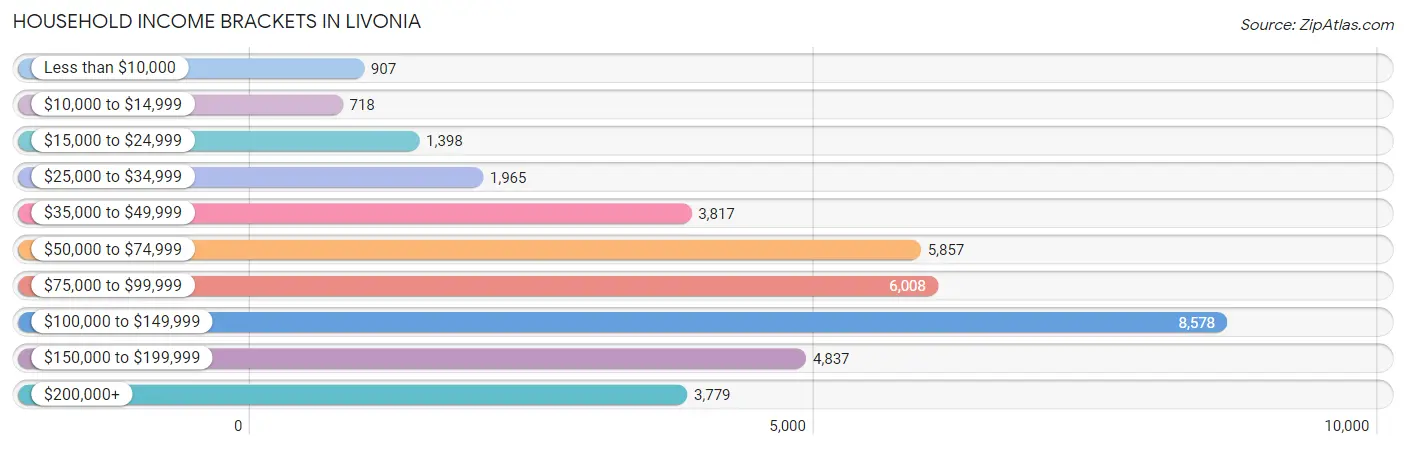
| Income Bracket | # Households | % Households |
| Less than $10,000 | 907 | 2.4% |
| $10,000 to $14,999 | 718 | 1.9% |
| $15,000 to $24,999 | 1,398 | 3.7% |
| $25,000 to $34,999 | 1,965 | 5.2% |
| $35,000 to $49,999 | 3,817 | 10.1% |
| $50,000 to $74,999 | 5,857 | 15.5% |
| $75,000 to $99,999 | 6,008 | 15.9% |
| $100,000 to $149,999 | 8,578 | 22.7% |
| $150,000 to $199,999 | 4,837 | 12.8% |
| $200,000+ | 3,779 | 10.0% |
Household Income by Householder Age in Livonia
The median household income in Livonia is $92,458, with the highest median household income of $116,223 found in the 45 to 64 years age bracket for the primary householder. A total of 14,875 households (39.4%) fall into this category. Meanwhile, the 65+ years age bracket for the primary householder has the lowest median household income of $61,788, with 12,417 households (32.9%) in this group.
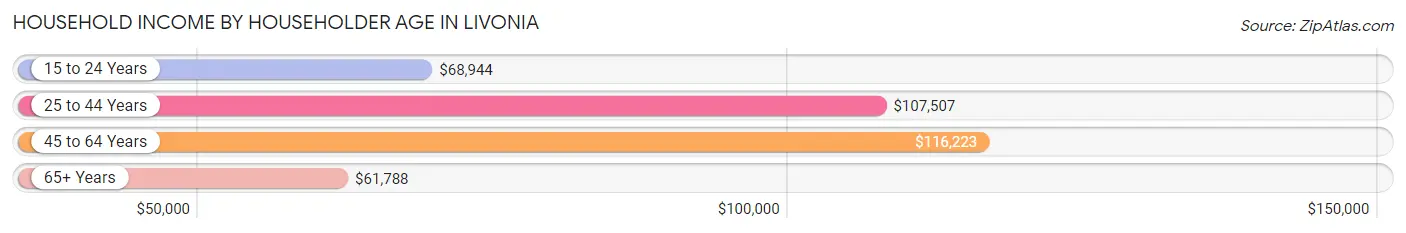
| Income Bracket | # Households | Median Income |
| 15 to 24 Years | 368 (1.0%) | $68,944 |
| 25 to 44 Years | 10,129 (26.8%) | $107,507 |
| 45 to 64 Years | 14,875 (39.4%) | $116,223 |
| 65+ Years | 12,417 (32.9%) | $61,788 |
| Total | 37,789 (100.0%) | $92,458 |
Poverty in Livonia
Income Below Poverty by Sex and Age in Livonia
With 3.9% poverty level for males and 5.1% for females among the residents of Livonia, 5 year old males and 15 year old females are the most vulnerable to poverty, with 37 males (11.6%) and 53 females (10.4%) in their respective age groups living below the poverty level.
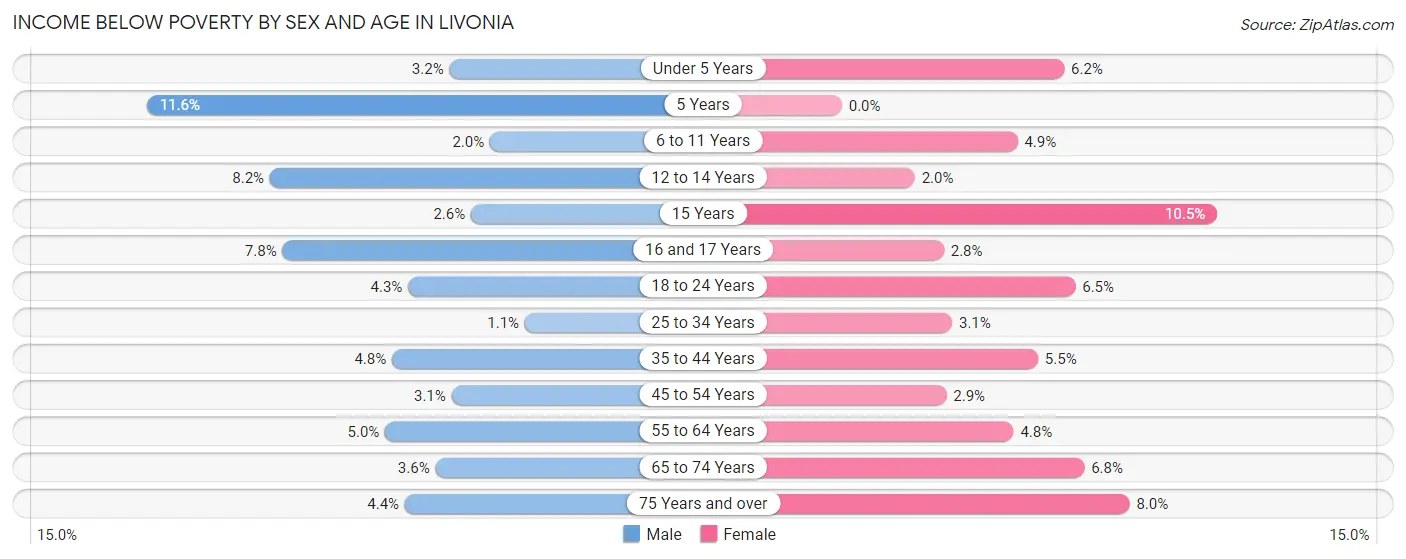
| Age Bracket | Male | Female |
| Under 5 Years | 75 (3.2%) | 136 (6.2%) |
| 5 Years | 37 (11.6%) | 0 (0.0%) |
| 6 to 11 Years | 52 (2.0%) | 148 (4.9%) |
| 12 to 14 Years | 127 (8.2%) | 31 (2.0%) |
| 15 Years | 14 (2.6%) | 53 (10.4%) |
| 16 and 17 Years | 91 (7.8%) | 26 (2.8%) |
| 18 to 24 Years | 150 (4.3%) | 213 (6.5%) |
| 25 to 34 Years | 67 (1.1%) | 193 (3.1%) |
| 35 to 44 Years | 266 (4.8%) | 270 (5.5%) |
| 45 to 54 Years | 187 (3.1%) | 168 (2.9%) |
| 55 to 64 Years | 366 (5.0%) | 365 (4.8%) |
| 65 to 74 Years | 199 (3.6%) | 387 (6.8%) |
| 75 Years and over | 159 (4.4%) | 399 (8.0%) |
| Total | 1,790 (3.9%) | 2,389 (5.1%) |
Income Above Poverty by Sex and Age in Livonia
According to the poverty statistics in Livonia, males aged 25 to 34 years and females aged 5 years are the age groups that are most secure financially, with 98.9% of males and 100.0% of females in these age groups living above the poverty line.
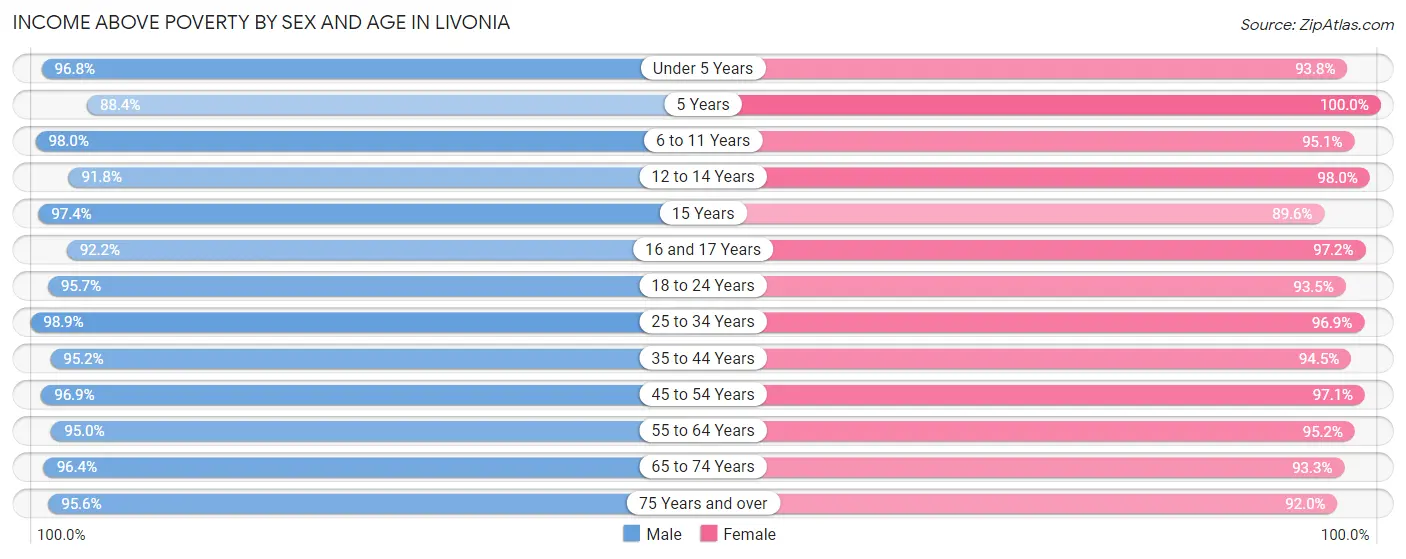
| Age Bracket | Male | Female |
| Under 5 Years | 2,288 (96.8%) | 2,062 (93.8%) |
| 5 Years | 282 (88.4%) | 423 (100.0%) |
| 6 to 11 Years | 2,499 (98.0%) | 2,878 (95.1%) |
| 12 to 14 Years | 1,428 (91.8%) | 1,493 (98.0%) |
| 15 Years | 531 (97.4%) | 454 (89.5%) |
| 16 and 17 Years | 1,073 (92.2%) | 889 (97.2%) |
| 18 to 24 Years | 3,319 (95.7%) | 3,064 (93.5%) |
| 25 to 34 Years | 6,175 (98.9%) | 6,092 (96.9%) |
| 35 to 44 Years | 5,308 (95.2%) | 4,671 (94.5%) |
| 45 to 54 Years | 5,819 (96.9%) | 5,614 (97.1%) |
| 55 to 64 Years | 7,012 (95.0%) | 7,266 (95.2%) |
| 65 to 74 Years | 5,387 (96.4%) | 5,350 (93.2%) |
| 75 Years and over | 3,444 (95.6%) | 4,584 (92.0%) |
| Total | 44,565 (96.1%) | 44,840 (94.9%) |
Income Below Poverty Among Married-Couple Families in Livonia
The poverty statistics for married-couple families in Livonia show that 1.3% or 259 of the total 20,426 families live below the poverty line. Families with 3 or 4 children have the highest poverty rate of 2.8%, comprising of 30 families. On the other hand, families with 5 or more children have the lowest poverty rate of 0.0%, which includes 0 families.
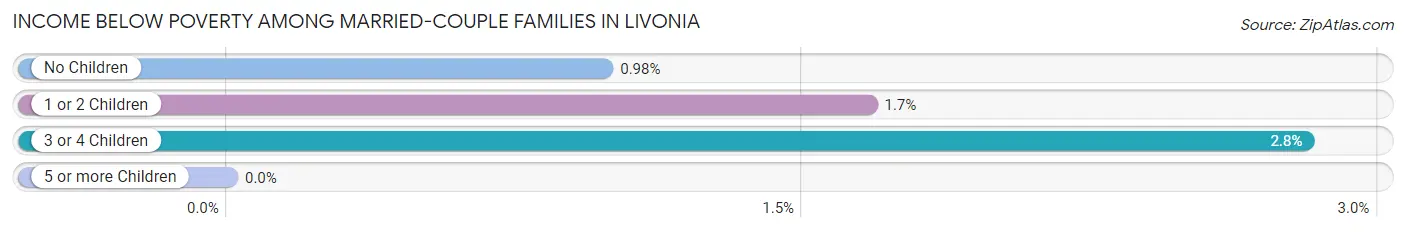
| Children | Above Poverty | Below Poverty |
| No Children | 13,415 (99.0%) | 133 (1.0%) |
| 1 or 2 Children | 5,666 (98.3%) | 96 (1.7%) |
| 3 or 4 Children | 1,039 (97.2%) | 30 (2.8%) |
| 5 or more Children | 47 (100.0%) | 0 (0.0%) |
| Total | 20,167 (98.7%) | 259 (1.3%) |
Income Below Poverty Among Single-Parent Households in Livonia
According to the poverty data in Livonia, 3.0% or 46 single-father households and 7.6% or 257 single-mother households are living below the poverty line. Among single-father households, those with 1 or 2 children have the highest poverty rate, with 29 households (4.4%) experiencing poverty. Likewise, among single-mother households, those with 3 or 4 children have the highest poverty rate, with 29 households (25.2%) falling below the poverty line.
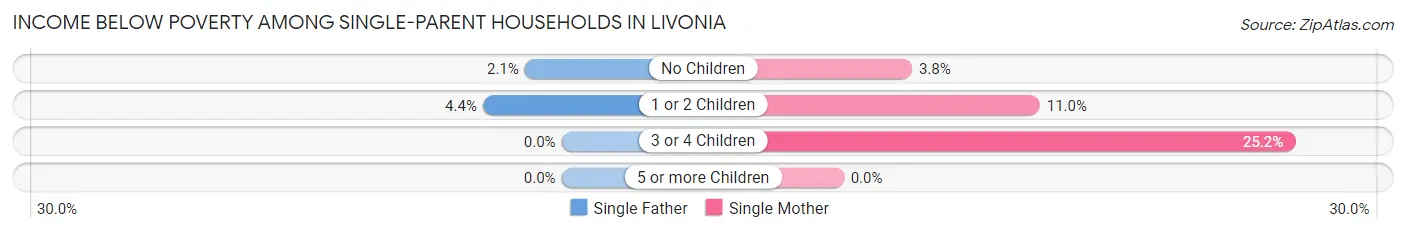
| Children | Single Father | Single Mother |
| No Children | 17 (2.1%) | 70 (3.8%) |
| 1 or 2 Children | 29 (4.4%) | 158 (11.0%) |
| 3 or 4 Children | 0 (0.0%) | 29 (25.2%) |
| 5 or more Children | 0 (0.0%) | 0 (0.0%) |
| Total | 46 (3.0%) | 257 (7.6%) |
Income Below Poverty Among Married-Couple vs Single-Parent Households in Livonia
The poverty data for Livonia shows that 259 of the married-couple family households (1.3%) and 303 of the single-parent households (6.2%) are living below the poverty level. Within the married-couple family households, those with 3 or 4 children have the highest poverty rate, with 30 households (2.8%) falling below the poverty line. Among the single-parent households, those with 3 or 4 children have the highest poverty rate, with 29 household (19.6%) living below poverty.
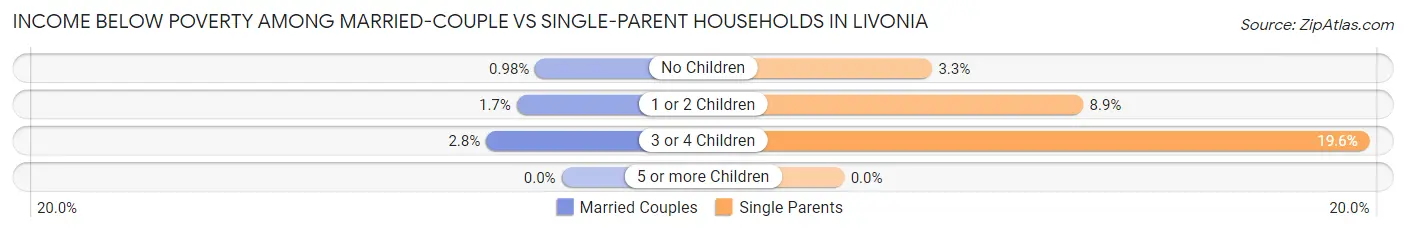
| Children | Married-Couple Families | Single-Parent Households |
| No Children | 133 (1.0%) | 87 (3.3%) |
| 1 or 2 Children | 96 (1.7%) | 187 (8.9%) |
| 3 or 4 Children | 30 (2.8%) | 29 (19.6%) |
| 5 or more Children | 0 (0.0%) | 0 (0.0%) |
| Total | 259 (1.3%) | 303 (6.2%) |
Race in Livonia
The most populous races in Livonia are White / Caucasian (81,169 | 85.5%), Two or more Races (4,608 | 4.9%), and Black / African American (4,283 | 4.5%).
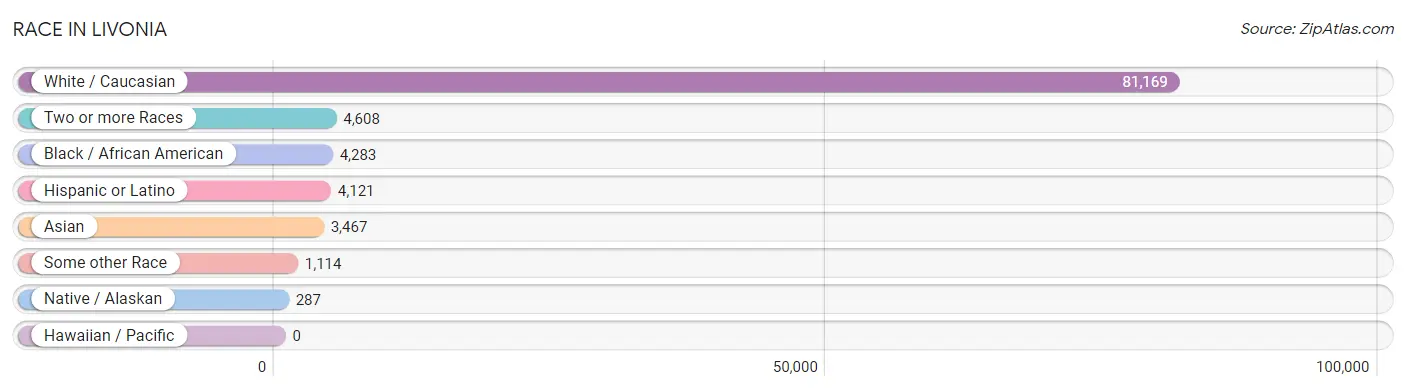
| Race | # Population | % Population |
| Asian | 3,467 | 3.6% |
| Black / African American | 4,283 | 4.5% |
| Hawaiian / Pacific | 0 | 0.0% |
| Hispanic or Latino | 4,121 | 4.3% |
| Native / Alaskan | 287 | 0.3% |
| White / Caucasian | 81,169 | 85.5% |
| Two or more Races | 4,608 | 4.9% |
| Some other Race | 1,114 | 1.2% |
| Total | 94,928 | 100.0% |
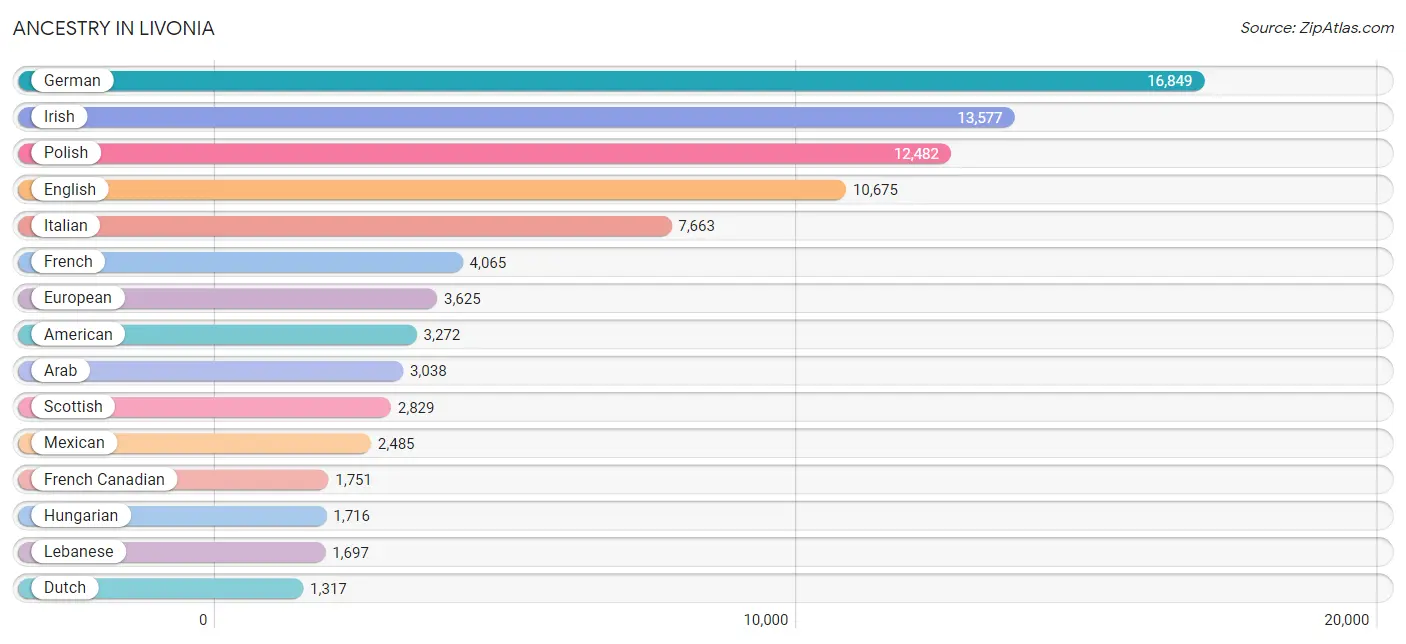
Ancestry in Livonia
The most populous ancestries reported in Livonia are German (16,849 | 17.7%), Irish (13,577 | 14.3%), Polish (12,482 | 13.2%), English (10,675 | 11.3%), and Italian (7,663 | 8.1%), together accounting for 64.5% of all Livonia residents.
| Ancestry | # Population | % Population |
| Afghan | 21 | 0.0% |
| African | 994 | 1.1% |
| Albanian | 904 | 0.9% |
| American | 3,272 | 3.5% |
| Apache | 17 | 0.0% |
| Arab | 3,038 | 3.2% |
| Argentinean | 104 | 0.1% |
| Armenian | 644 | 0.7% |
| Assyrian / Chaldean / Syriac | 68 | 0.1% |
| Austrian | 362 | 0.4% |
| Bangladeshi | 33 | 0.0% |
| Belgian | 292 | 0.3% |
| Belizean | 26 | 0.0% |
| Bermudan | 17 | 0.0% |
| Bhutanese | 431 | 0.4% |
| Blackfeet | 36 | 0.0% |
| Brazilian | 128 | 0.1% |
| British | 521 | 0.5% |
| Bulgarian | 67 | 0.1% |
| Burmese | 415 | 0.4% |
| Canadian | 510 | 0.5% |
| Carpatho Rusyn | 19 | 0.0% |
| Central American | 249 | 0.3% |
| Central American Indian | 112 | 0.1% |
| Cherokee | 250 | 0.3% |
| Chilean | 75 | 0.1% |
| Chippewa | 165 | 0.2% |
| Colombian | 41 | 0.0% |
| Creek | 52 | 0.1% |
| Croatian | 261 | 0.3% |
| Cuban | 126 | 0.1% |
| Cypriot | 10 | 0.0% |
| Czech | 214 | 0.2% |
| Czechoslovakian | 194 | 0.2% |
| Danish | 191 | 0.2% |
| Delaware | 5 | 0.0% |
| Dominican | 77 | 0.1% |
| Dutch | 1,317 | 1.4% |
| Eastern European | 356 | 0.4% |
| Egyptian | 180 | 0.2% |
| English | 10,675 | 11.3% |
| European | 3,625 | 3.8% |
| Filipino | 9 | 0.0% |
| Finnish | 1,191 | 1.3% |
| French | 4,065 | 4.3% |
| French American Indian | 3 | 0.0% |
| French Canadian | 1,751 | 1.8% |
| German | 16,849 | 17.7% |
| Ghanaian | 30 | 0.0% |
| Greek | 904 | 0.9% |
| Guamanian / Chamorro | 38 | 0.0% |
| Guatemalan | 88 | 0.1% |
| Honduran | 29 | 0.0% |
| Hungarian | 1,716 | 1.8% |
| Icelander | 30 | 0.0% |
| Indian (Asian) | 641 | 0.7% |
| Iranian | 31 | 0.0% |
| Iraqi | 71 | 0.1% |
| Irish | 13,577 | 14.3% |
| Iroquois | 31 | 0.0% |
| Italian | 7,663 | 8.1% |
| Jamaican | 35 | 0.0% |
| Japanese | 1 | 0.0% |
| Jordanian | 34 | 0.0% |
| Korean | 1,023 | 1.1% |
| Laotian | 23 | 0.0% |
| Latvian | 73 | 0.1% |
| Lebanese | 1,697 | 1.8% |
| Lithuanian | 377 | 0.4% |
| Lumbee | 22 | 0.0% |
| Macedonian | 218 | 0.2% |
| Malaysian | 115 | 0.1% |
| Maltese | 677 | 0.7% |
| Mexican | 2,485 | 2.6% |
| Mexican American Indian | 111 | 0.1% |
| Mongolian | 1 | 0.0% |
| Moroccan | 29 | 0.0% |
| Native Hawaiian | 9 | 0.0% |
| Navajo | 7 | 0.0% |
| New Zealander | 15 | 0.0% |
| Nicaraguan | 92 | 0.1% |
| Nigerian | 15 | 0.0% |
| Northern European | 40 | 0.0% |
| Norwegian | 457 | 0.5% |
| Ottawa | 14 | 0.0% |
| Pakistani | 16 | 0.0% |
| Palestinian | 412 | 0.4% |
| Peruvian | 139 | 0.2% |
| Polish | 12,482 | 13.2% |
| Portuguese | 142 | 0.2% |
| Potawatomi | 38 | 0.0% |
| Pueblo | 3 | 0.0% |
| Puerto Rican | 484 | 0.5% |
| Romanian | 662 | 0.7% |
| Russian | 603 | 0.6% |
| Salvadoran | 40 | 0.0% |
| Scandinavian | 270 | 0.3% |
| Scotch-Irish | 975 | 1.0% |
| Scottish | 2,829 | 3.0% |
| Serbian | 198 | 0.2% |
| Slavic | 76 | 0.1% |
| Slovak | 630 | 0.7% |
| Slovene | 75 | 0.1% |
| South American | 389 | 0.4% |
| Spaniard | 91 | 0.1% |
| Spanish | 161 | 0.2% |
| Sri Lankan | 487 | 0.5% |
| Subsaharan African | 1,052 | 1.1% |
| Swedish | 1,029 | 1.1% |
| Swiss | 111 | 0.1% |
| Syrian | 246 | 0.3% |
| Thai | 1,115 | 1.2% |
| Turkish | 36 | 0.0% |
| Ukrainian | 562 | 0.6% |
| Uruguayan | 10 | 0.0% |
| Venezuelan | 20 | 0.0% |
| Welsh | 584 | 0.6% |
| Yugoslavian | 91 | 0.1% | View All 118 Rows |
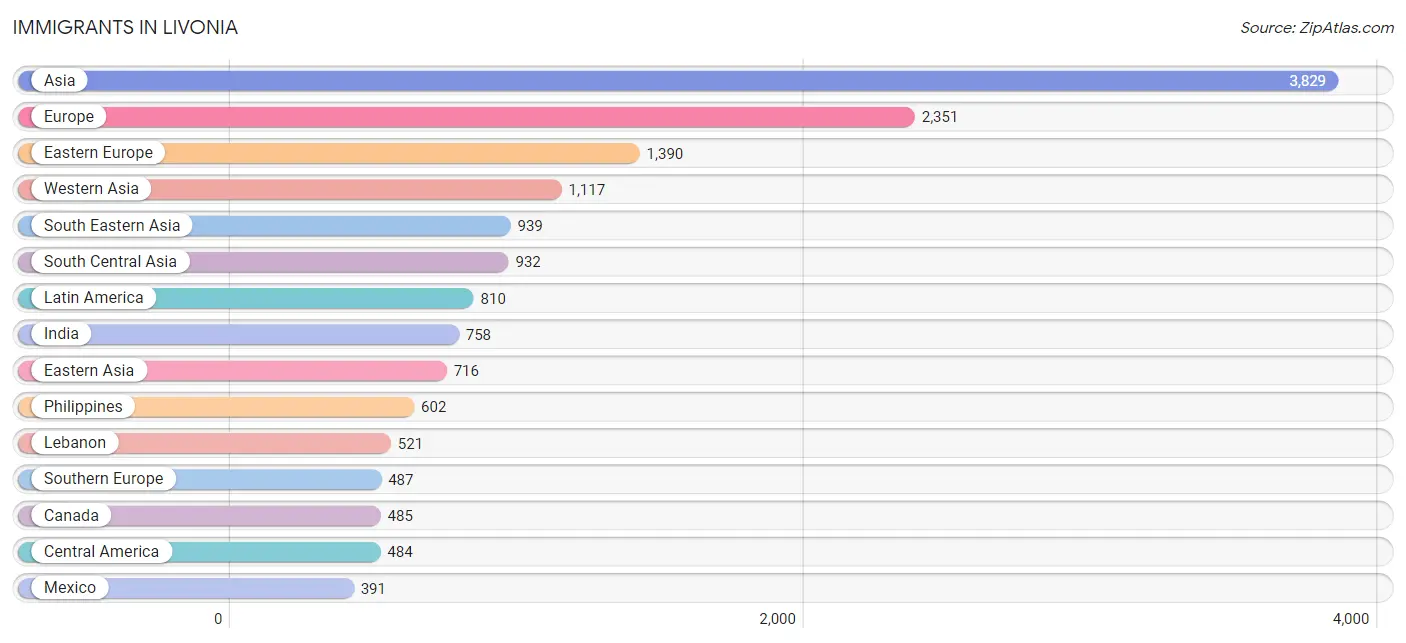
Immigrants in Livonia
The most numerous immigrant groups reported in Livonia came from Asia (3,829 | 4.0%), Europe (2,351 | 2.5%), Eastern Europe (1,390 | 1.5%), Western Asia (1,117 | 1.2%), and South Eastern Asia (939 | 1.0%), together accounting for 10.1% of all Livonia residents.
| Immigration Origin | # Population | % Population |
| Afghanistan | 31 | 0.0% |
| Africa | 187 | 0.2% |
| Albania | 375 | 0.4% |
| Argentina | 5 | 0.0% |
| Armenia | 54 | 0.1% |
| Asia | 3,829 | 4.0% |
| Australia | 3 | 0.0% |
| Belarus | 7 | 0.0% |
| Brazil | 73 | 0.1% |
| Bulgaria | 59 | 0.1% |
| Cambodia | 1 | 0.0% |
| Canada | 485 | 0.5% |
| Caribbean | 94 | 0.1% |
| Central America | 484 | 0.5% |
| Chile | 72 | 0.1% |
| China | 275 | 0.3% |
| Croatia | 5 | 0.0% |
| Cuba | 38 | 0.0% |
| Czechoslovakia | 22 | 0.0% |
| Denmark | 22 | 0.0% |
| Dominican Republic | 26 | 0.0% |
| Eastern Africa | 17 | 0.0% |
| Eastern Asia | 716 | 0.7% |
| Eastern Europe | 1,390 | 1.5% |
| Egypt | 70 | 0.1% |
| England | 47 | 0.1% |
| Europe | 2,351 | 2.5% |
| France | 24 | 0.0% |
| Germany | 189 | 0.2% |
| Ghana | 20 | 0.0% |
| Greece | 128 | 0.1% |
| Guatemala | 70 | 0.1% |
| Guyana | 6 | 0.0% |
| Honduras | 23 | 0.0% |
| Hong Kong | 21 | 0.0% |
| Hungary | 21 | 0.0% |
| India | 758 | 0.8% |
| Indonesia | 8 | 0.0% |
| Iran | 93 | 0.1% |
| Iraq | 142 | 0.2% |
| Ireland | 53 | 0.1% |
| Israel | 37 | 0.0% |
| Italy | 247 | 0.3% |
| Jamaica | 30 | 0.0% |
| Japan | 185 | 0.2% |
| Jordan | 146 | 0.2% |
| Korea | 256 | 0.3% |
| Kuwait | 55 | 0.1% |
| Laos | 16 | 0.0% |
| Latin America | 810 | 0.9% |
| Latvia | 11 | 0.0% |
| Lebanon | 521 | 0.5% |
| Liberia | 12 | 0.0% |
| Lithuania | 10 | 0.0% |
| Malaysia | 24 | 0.0% |
| Mexico | 391 | 0.4% |
| Morocco | 17 | 0.0% |
| Nigeria | 6 | 0.0% |
| North Macedonia | 142 | 0.2% |
| Northern Africa | 96 | 0.1% |
| Northern Europe | 253 | 0.3% |
| Norway | 11 | 0.0% |
| Oceania | 24 | 0.0% |
| Pakistan | 50 | 0.1% |
| Peru | 48 | 0.1% |
| Philippines | 602 | 0.6% |
| Poland | 226 | 0.2% |
| Portugal | 18 | 0.0% |
| Romania | 350 | 0.4% |
| Russia | 27 | 0.0% |
| Saudi Arabia | 7 | 0.0% |
| Scotland | 54 | 0.1% |
| Serbia | 5 | 0.0% |
| Sierra Leone | 7 | 0.0% |
| South America | 232 | 0.2% |
| South Central Asia | 932 | 1.0% |
| South Eastern Asia | 939 | 1.0% |
| Southern Europe | 487 | 0.5% |
| Spain | 23 | 0.0% |
| Sweden | 9 | 0.0% |
| Switzerland | 8 | 0.0% |
| Syria | 91 | 0.1% |
| Taiwan | 37 | 0.0% |
| Thailand | 20 | 0.0% |
| Turkey | 15 | 0.0% |
| Ukraine | 32 | 0.0% |
| Venezuela | 23 | 0.0% |
| Vietnam | 268 | 0.3% |
| Western Africa | 45 | 0.1% |
| Western Asia | 1,117 | 1.2% |
| Western Europe | 221 | 0.2% |
| Yemen | 32 | 0.0% | View All 92 Rows |
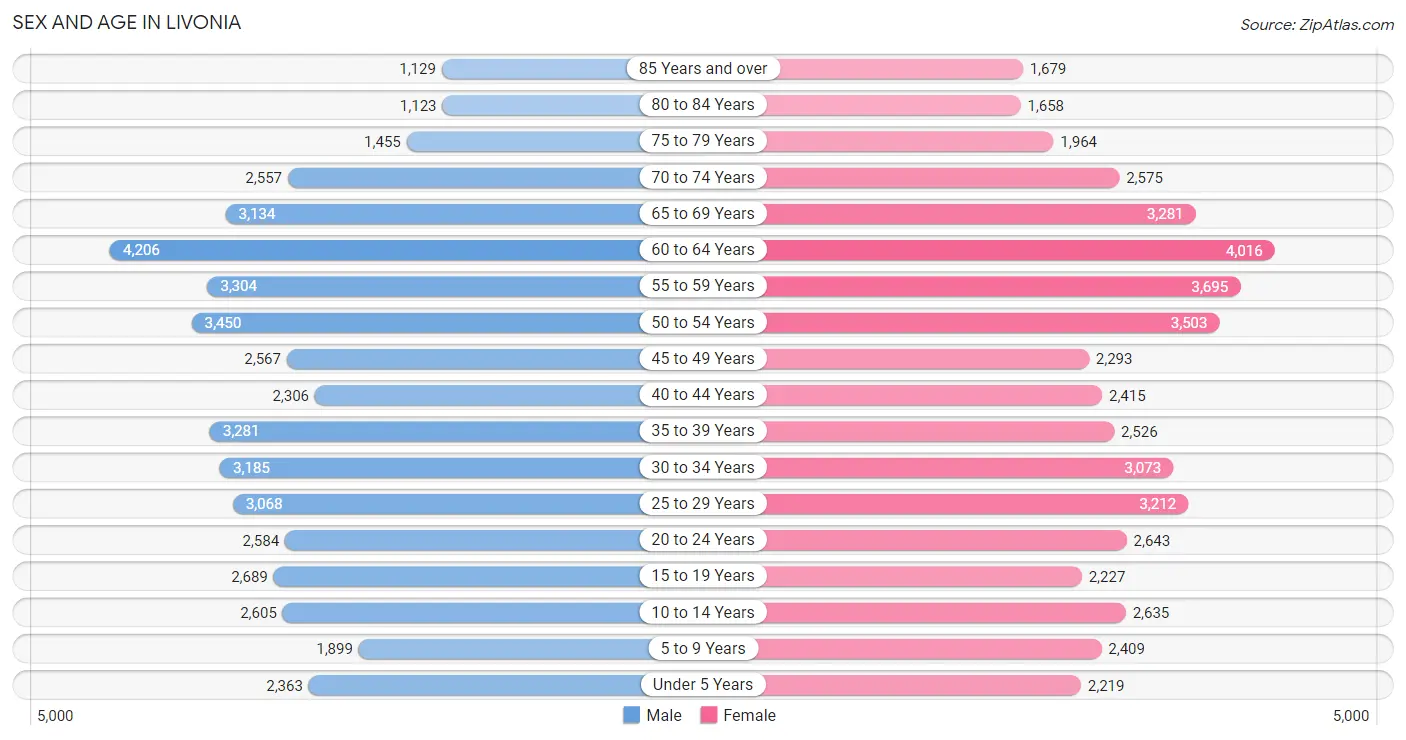
Sex and Age in Livonia
Sex and Age in Livonia
The most populous age groups in Livonia are 60 to 64 Years (4,206 | 9.0%) for men and 60 to 64 Years (4,016 | 8.4%) for women.
| Age Bracket | Male | Female |
| Under 5 Years | 2,363 (5.0%) | 2,219 (4.6%) |
| 5 to 9 Years | 1,899 (4.1%) | 2,409 (5.0%) |
| 10 to 14 Years | 2,605 (5.6%) | 2,635 (5.5%) |
| 15 to 19 Years | 2,689 (5.7%) | 2,227 (4.6%) |
| 20 to 24 Years | 2,584 (5.5%) | 2,643 (5.5%) |
| 25 to 29 Years | 3,068 (6.5%) | 3,212 (6.7%) |
| 30 to 34 Years | 3,185 (6.8%) | 3,073 (6.4%) |
| 35 to 39 Years | 3,281 (7.0%) | 2,526 (5.3%) |
| 40 to 44 Years | 2,306 (4.9%) | 2,415 (5.0%) |
| 45 to 49 Years | 2,567 (5.5%) | 2,293 (4.8%) |
| 50 to 54 Years | 3,450 (7.4%) | 3,503 (7.3%) |
| 55 to 59 Years | 3,304 (7.0%) | 3,695 (7.7%) |
| 60 to 64 Years | 4,206 (9.0%) | 4,016 (8.4%) |
| 65 to 69 Years | 3,134 (6.7%) | 3,281 (6.8%) |
| 70 to 74 Years | 2,557 (5.4%) | 2,575 (5.4%) |
| 75 to 79 Years | 1,455 (3.1%) | 1,964 (4.1%) |
| 80 to 84 Years | 1,123 (2.4%) | 1,658 (3.5%) |
| 85 Years and over | 1,129 (2.4%) | 1,679 (3.5%) |
| Total | 46,905 (100.0%) | 48,023 (100.0%) |
Families and Households in Livonia
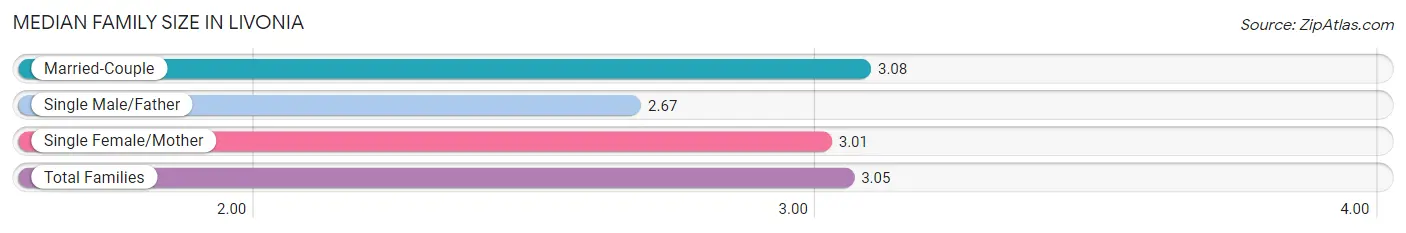
Median Family Size in Livonia
The median family size in Livonia is 3.05 persons per family, with married-couple families (20,426 | 80.6%) accounting for the largest median family size of 3.08 persons per family. On the other hand, single male/father families (1,518 | 6.0%) represent the smallest median family size with 2.67 persons per family.
| Family Type | # Families | Family Size |
| Married-Couple | 20,426 (80.6%) | 3.08 |
| Single Male/Father | 1,518 (6.0%) | 2.67 |
| Single Female/Mother | 3,391 (13.4%) | 3.01 |
| Total Families | 25,335 (100.0%) | 3.05 |
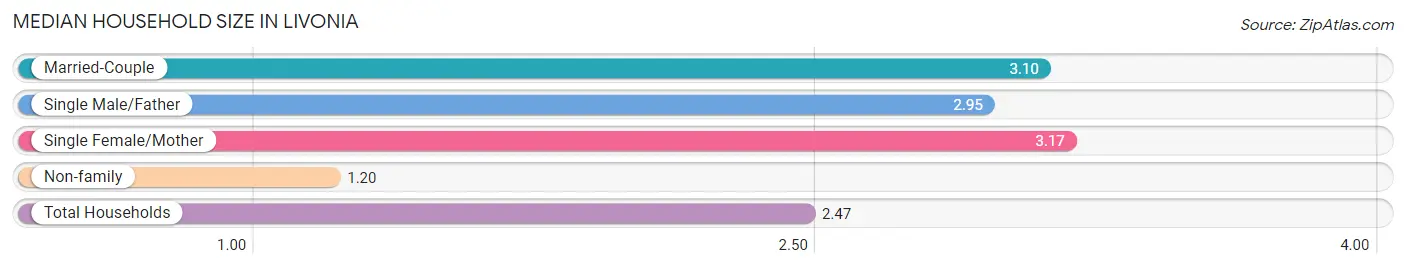
Median Household Size in Livonia
The median household size in Livonia is 2.47 persons per household, with single female/mother households (3,391 | 9.0%) accounting for the largest median household size of 3.17 persons per household. non-family households (12,454 | 33.0%) represent the smallest median household size with 1.20 persons per household.
| Household Type | # Households | Household Size |
| Married-Couple | 20,426 (54.0%) | 3.10 |
| Single Male/Father | 1,518 (4.0%) | 2.95 |
| Single Female/Mother | 3,391 (9.0%) | 3.17 |
| Non-family | 12,454 (33.0%) | 1.20 |
| Total Households | 37,789 (100.0%) | 2.47 |
Household Size by Marriage Status in Livonia
Out of a total of 37,789 households in Livonia, 25,335 (67.0%) are family households, while 12,454 (33.0%) are nonfamily households. The most numerous type of family households are 2-person households, comprising 12,409, and the most common type of nonfamily households are 1-person households, comprising 10,632.
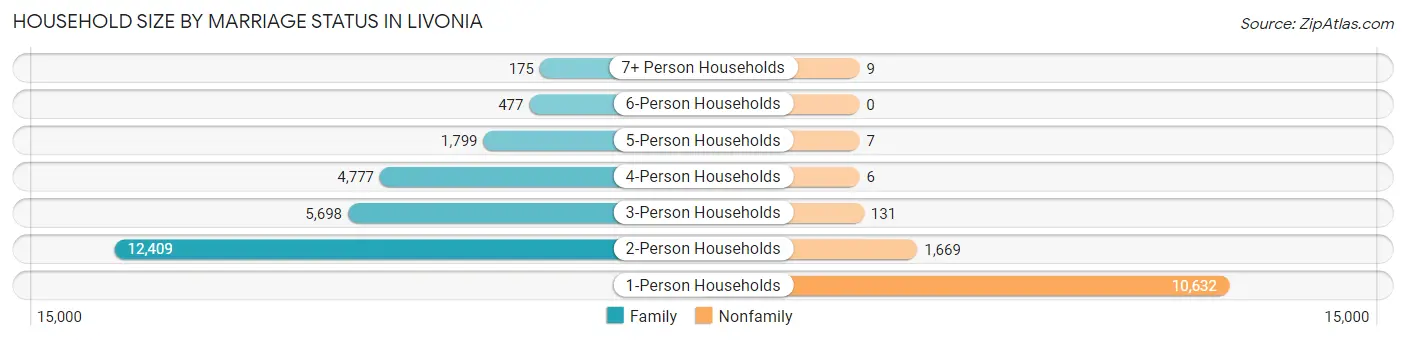
| Household Size | Family Households | Nonfamily Households |
| 1-Person Households | - | 10,632 (28.1%) |
| 2-Person Households | 12,409 (32.8%) | 1,669 (4.4%) |
| 3-Person Households | 5,698 (15.1%) | 131 (0.4%) |
| 4-Person Households | 4,777 (12.6%) | 6 (0.0%) |
| 5-Person Households | 1,799 (4.8%) | 7 (0.0%) |
| 6-Person Households | 477 (1.3%) | 0 (0.0%) |
| 7+ Person Households | 175 (0.5%) | 9 (0.0%) |
| Total | 25,335 (67.0%) | 12,454 (33.0%) |
Female Fertility in Livonia
Fertility by Age in Livonia
Average fertility rate in Livonia is 43.0 births per 1,000 women. Women in the age bracket of 20 to 34 years have the highest fertility rate with 60.0 births per 1,000 women. Women in the age bracket of 20 to 34 years acount for 65.4% of all women with births.
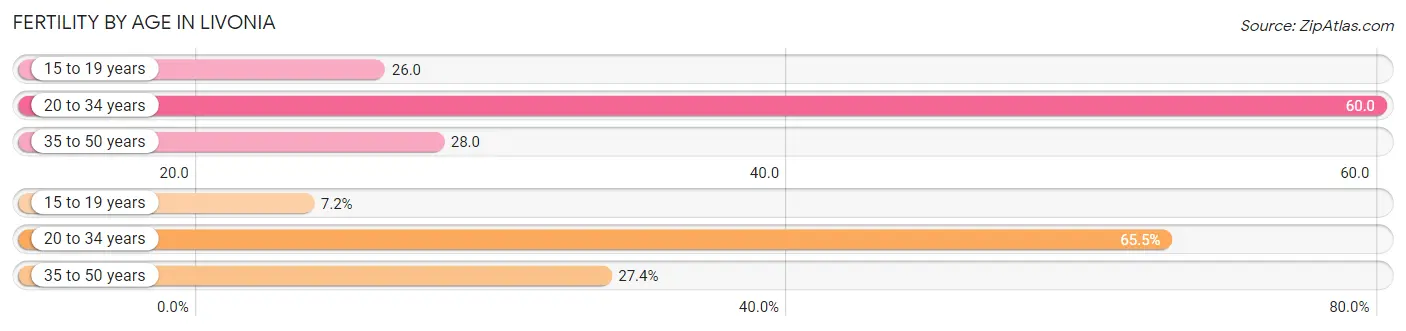
| Age Bracket | Women with Births | Births / 1,000 Women |
| 15 to 19 years | 59 (7.2%) | 26.0 |
| 20 to 34 years | 538 (65.4%) | 60.0 |
| 35 to 50 years | 225 (27.4%) | 28.0 |
| Total | 822 (100.0%) | 43.0 |
Fertility by Age by Marriage Status in Livonia
79.2% of women with births (822) in Livonia are married. The highest percentage of unmarried women with births falls into 15 to 19 years age bracket with 64.4% of them unmarried at the time of birth, while the lowest percentage of unmarried women with births belong to 20 to 34 years age bracket with 16.5% of them unmarried.
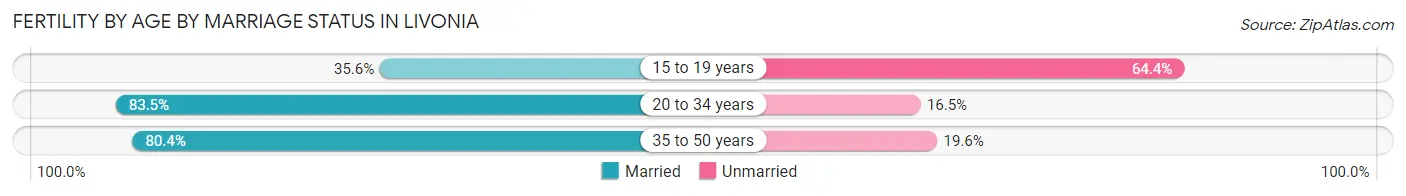
| Age Bracket | Married | Unmarried |
| 15 to 19 years | 21 (35.6%) | 38 (64.4%) |
| 20 to 34 years | 449 (83.5%) | 89 (16.5%) |
| 35 to 50 years | 181 (80.4%) | 44 (19.6%) |
| Total | 651 (79.2%) | 171 (20.8%) |
Fertility by Education in Livonia
Average fertility rate in Livonia is 43.0 births per 1,000 women. Women with the education attainment of graduate degree have the highest fertility rate of 69.0 births per 1,000 women, while women with the education attainment of less than high school have the lowest fertility at 18.0 births per 1,000 women. Women with the education attainment of bachelor's degree represent 43.2% of all women with births.
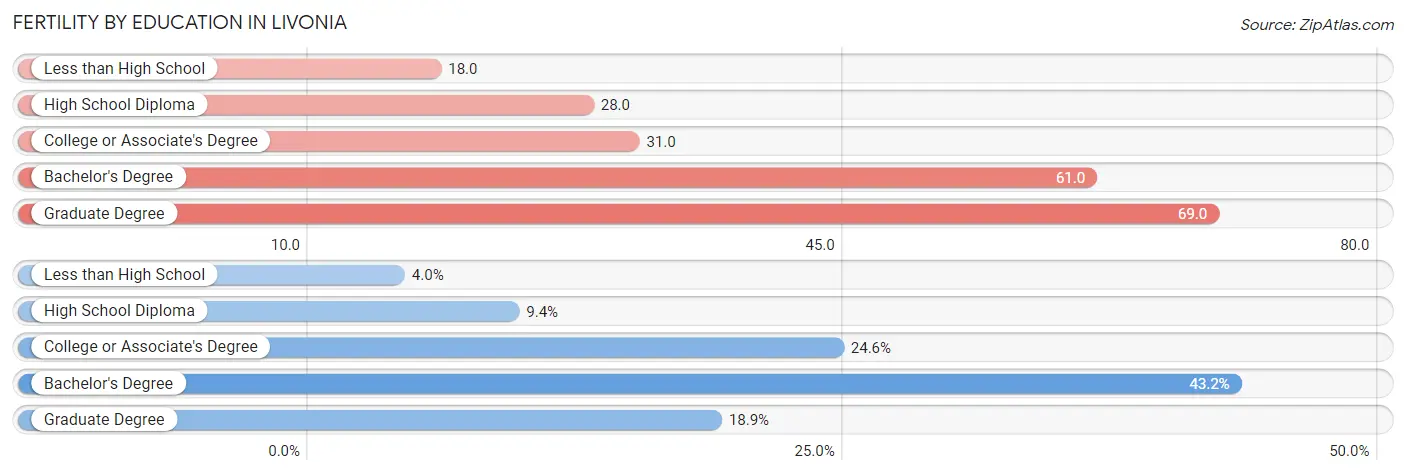
| Educational Attainment | Women with Births | Births / 1,000 Women |
| Less than High School | 33 (4.0%) | 18.0 |
| High School Diploma | 77 (9.4%) | 28.0 |
| College or Associate's Degree | 202 (24.6%) | 31.0 |
| Bachelor's Degree | 355 (43.2%) | 61.0 |
| Graduate Degree | 155 (18.9%) | 69.0 |
| Total | 822 (100.0%) | 43.0 |
Fertility by Education by Marriage Status in Livonia
20.8% of women with births in Livonia are unmarried. Women with the educational attainment of graduate degree are most likely to be married with 100.0% of them married at childbirth, while women with the educational attainment of less than high school are least likely to be married with 75.8% of them unmarried at childbirth.
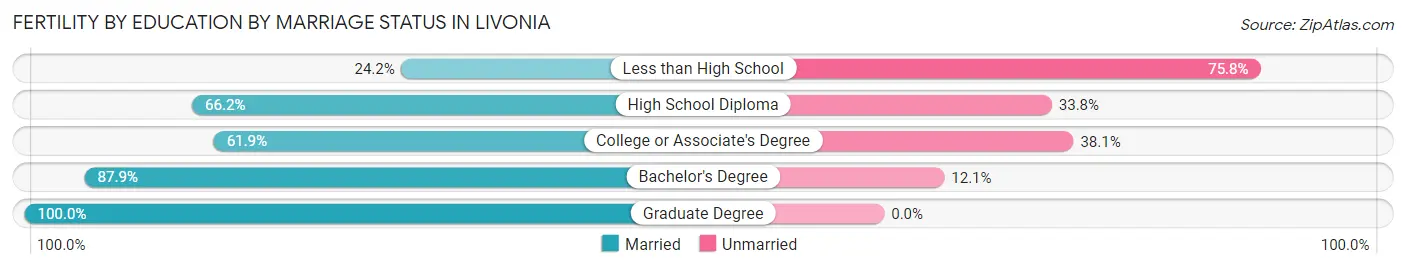
| Educational Attainment | Married | Unmarried |
| Less than High School | 8 (24.2%) | 25 (75.8%) |
| High School Diploma | 51 (66.2%) | 26 (33.8%) |
| College or Associate's Degree | 125 (61.9%) | 77 (38.1%) |
| Bachelor's Degree | 312 (87.9%) | 43 (12.1%) |
| Graduate Degree | 155 (100.0%) | 0 (0.0%) |
| Total | 651 (79.2%) | 171 (20.8%) |
Employment Characteristics in Livonia
Employment by Class of Employer in Livonia
Among the 47,118 employed individuals in Livonia, private company employees (34,547 | 73.3%), not-for-profit organizations (3,939 | 8.4%), and local government employees (2,701 | 5.7%) make up the most common classes of employment.
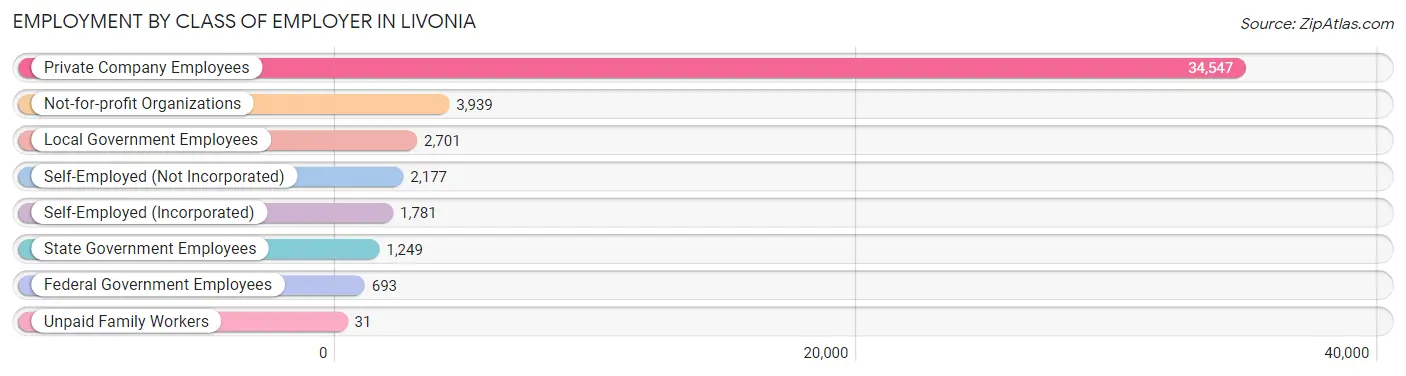
| Employer Class | # Employees | % Employees |
| Private Company Employees | 34,547 | 73.3% |
| Self-Employed (Incorporated) | 1,781 | 3.8% |
| Self-Employed (Not Incorporated) | 2,177 | 4.6% |
| Not-for-profit Organizations | 3,939 | 8.4% |
| Local Government Employees | 2,701 | 5.7% |
| State Government Employees | 1,249 | 2.6% |
| Federal Government Employees | 693 | 1.5% |
| Unpaid Family Workers | 31 | 0.1% |
| Total | 47,118 | 100.0% |
Employment Status by Age in Livonia
According to the labor force statistics for Livonia, out of the total population over 16 years of age (79,746), 63.4% or 50,559 individuals are in the labor force, with 5.0% or 2,528 of them unemployed. The age group with the highest labor force participation rate is 25 to 29 years, with 90.2% or 5,665 individuals in the labor force. Within the labor force, the 20 to 24 years age range has the highest percentage of unemployed individuals, with 11.0% or 486 of them being unemployed.
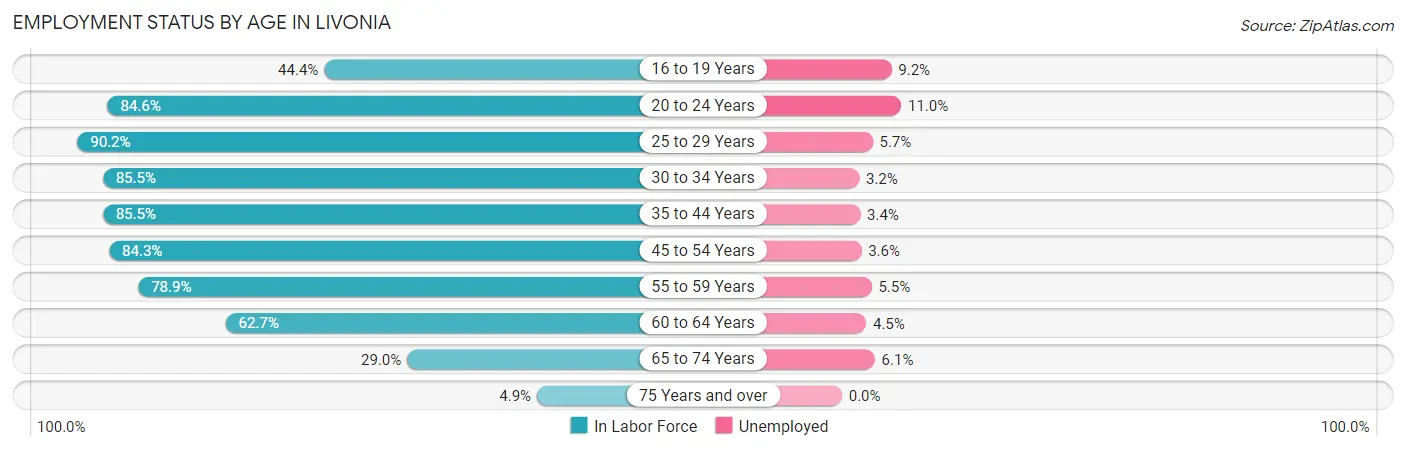
| Age Bracket | In Labor Force | Unemployed |
| 16 to 19 Years | 1,716 (44.4%) | 158 (9.2%) |
| 20 to 24 Years | 4,422 (84.6%) | 486 (11.0%) |
| 25 to 29 Years | 5,665 (90.2%) | 323 (5.7%) |
| 30 to 34 Years | 5,351 (85.5%) | 171 (3.2%) |
| 35 to 44 Years | 9,001 (85.5%) | 306 (3.4%) |
| 45 to 54 Years | 9,958 (84.3%) | 358 (3.6%) |
| 55 to 59 Years | 5,522 (78.9%) | 304 (5.5%) |
| 60 to 64 Years | 5,155 (62.7%) | 232 (4.5%) |
| 65 to 74 Years | 3,349 (29.0%) | 204 (6.1%) |
| 75 Years and over | 441 (4.9%) | 0 (0.0%) |
| Total | 50,559 (63.4%) | 2,528 (5.0%) |
Employment Status by Educational Attainment in Livonia
According to labor force statistics for Livonia, 81.1% of individuals (40,631) out of the total population between 25 and 64 years of age (50,100) are in the labor force, with 4.2% or 1,707 of them being unemployed. The group with the highest labor force participation rate are those with the educational attainment of bachelor's degree or higher, with 88.1% or 18,948 individuals in the labor force. Within the labor force, individuals with high school diploma education have the highest percentage of unemployment, with 6.9% or 463 of them being unemployed.
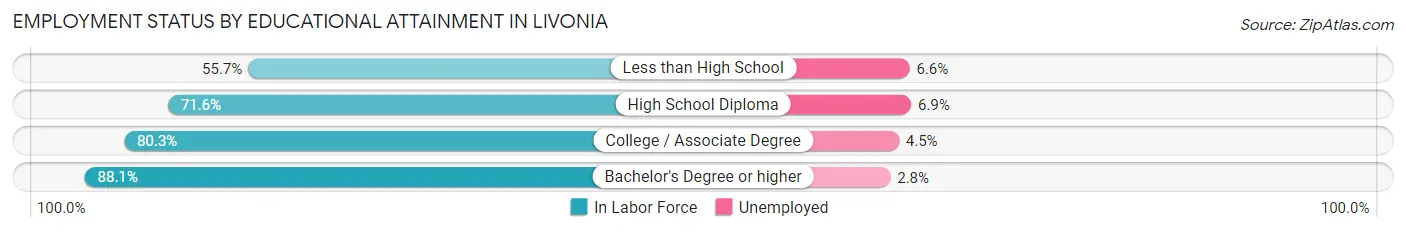
| Educational Attainment | In Labor Force | Unemployed |
| Less than High School | 999 (55.7%) | 118 (6.6%) |
| High School Diploma | 6,705 (71.6%) | 646 (6.9%) |
| College / Associate Degree | 14,000 (80.3%) | 785 (4.5%) |
| Bachelor's Degree or higher | 18,948 (88.1%) | 602 (2.8%) |
| Total | 40,631 (81.1%) | 2,104 (4.2%) |
Employment Occupations by Sex in Livonia
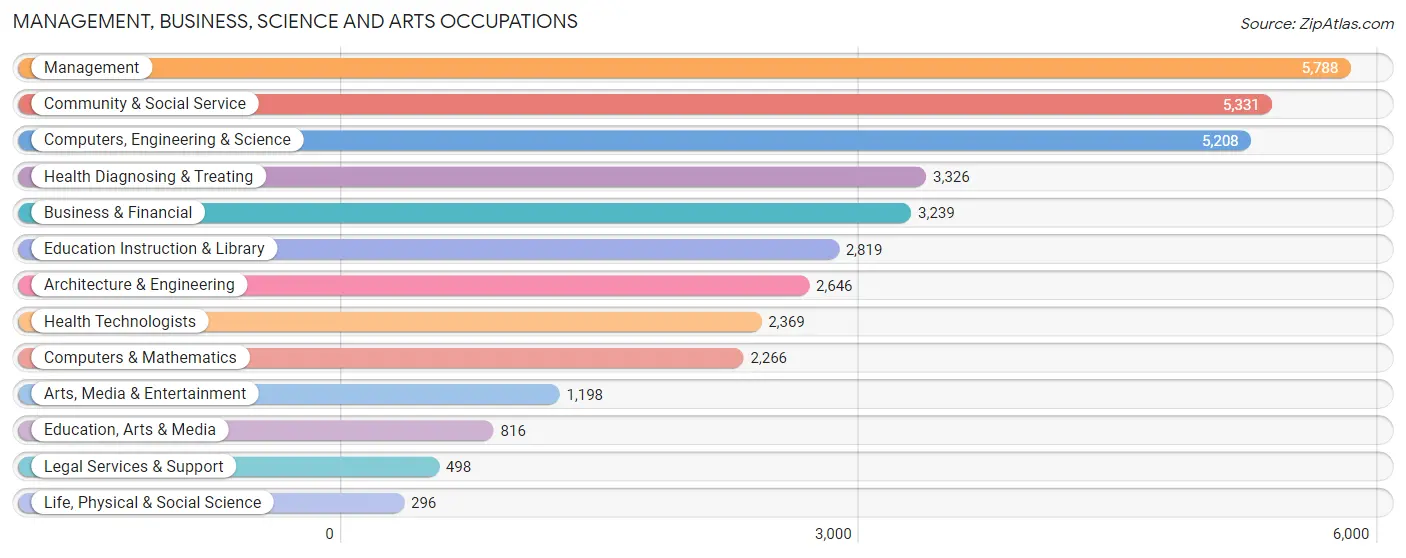
Management, Business, Science and Arts Occupations
The most common Management, Business, Science and Arts occupations in Livonia are Management (5,788 | 12.0%), Community & Social Service (5,331 | 11.1%), Computers, Engineering & Science (5,208 | 10.8%), Health Diagnosing & Treating (3,326 | 6.9%), and Business & Financial (3,239 | 6.8%).
Management, Business, Science and Arts Occupations by Sex
Within the Management, Business, Science and Arts occupations in Livonia, the most male-oriented occupations are Architecture & Engineering (81.9%), Computers, Engineering & Science (76.8%), and Computers & Mathematics (76.6%), while the most female-oriented occupations are Health Technologists (84.2%), Health Diagnosing & Treating (81.8%), and Legal Services & Support (71.9%).

| Occupation | Male | Female |
| Management | 3,306 (57.1%) | 2,482 (42.9%) |
| Business & Financial | 1,594 (49.2%) | 1,645 (50.8%) |
| Computers, Engineering & Science | 4,002 (76.8%) | 1,206 (23.2%) |
| Computers & Mathematics | 1,736 (76.6%) | 530 (23.4%) |
| Architecture & Engineering | 2,166 (81.9%) | 480 (18.1%) |
| Life, Physical & Social Science | 100 (33.8%) | 196 (66.2%) |
| Community & Social Service | 1,872 (35.1%) | 3,459 (64.9%) |
| Education, Arts & Media | 261 (32.0%) | 555 (68.0%) |
| Legal Services & Support | 140 (28.1%) | 358 (71.9%) |
| Education Instruction & Library | 833 (29.5%) | 1,986 (70.5%) |
| Arts, Media & Entertainment | 638 (53.3%) | 560 (46.7%) |
| Health Diagnosing & Treating | 605 (18.2%) | 2,721 (81.8%) |
| Health Technologists | 374 (15.8%) | 1,995 (84.2%) |
| Total (Category) | 11,379 (49.7%) | 11,513 (50.3%) |
| Total (Overall) | 25,853 (53.8%) | 22,167 (46.2%) |
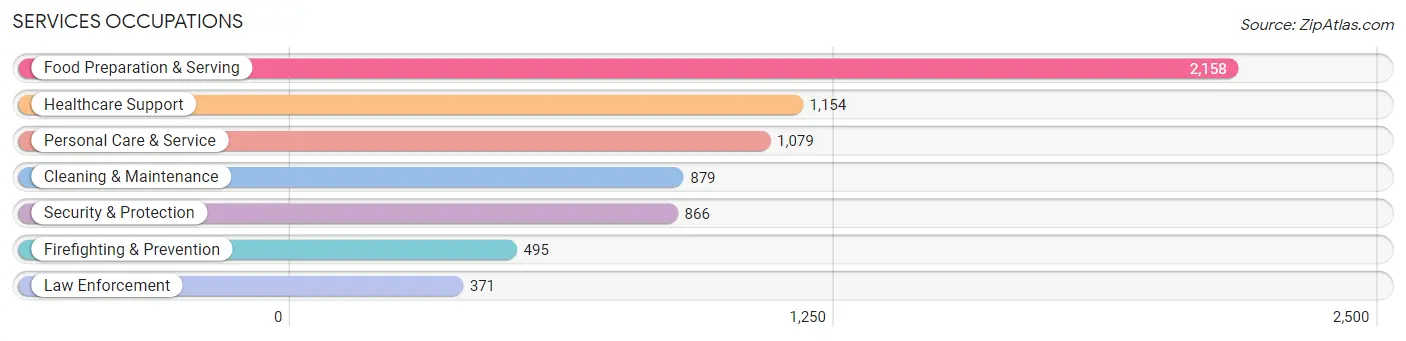
Services Occupations
The most common Services occupations in Livonia are Food Preparation & Serving (2,158 | 4.5%), Healthcare Support (1,154 | 2.4%), Personal Care & Service (1,079 | 2.2%), Cleaning & Maintenance (879 | 1.8%), and Security & Protection (866 | 1.8%).
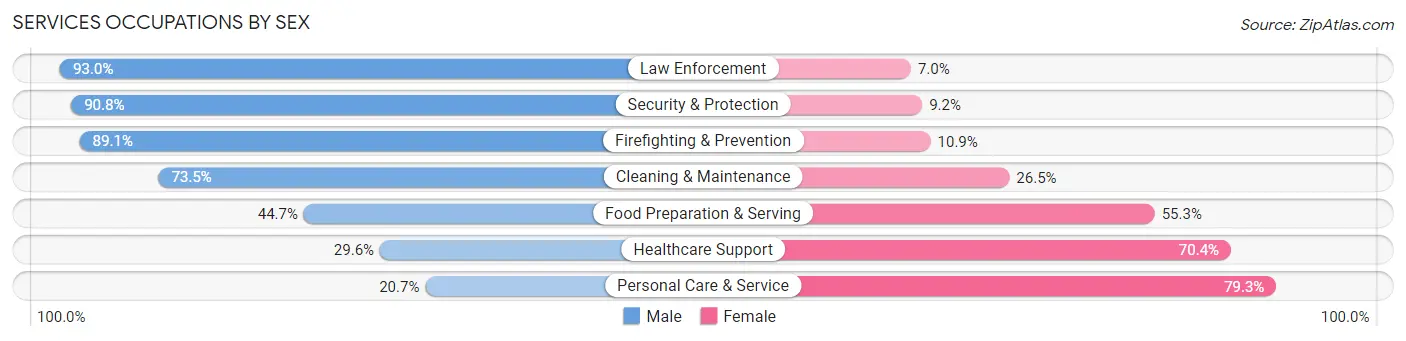
Services Occupations by Sex
Within the Services occupations in Livonia, the most male-oriented occupations are Law Enforcement (93.0%), Security & Protection (90.8%), and Firefighting & Prevention (89.1%), while the most female-oriented occupations are Personal Care & Service (79.3%), Healthcare Support (70.4%), and Food Preparation & Serving (55.3%).
| Occupation | Male | Female |
| Healthcare Support | 342 (29.6%) | 812 (70.4%) |
| Security & Protection | 786 (90.8%) | 80 (9.2%) |
| Firefighting & Prevention | 441 (89.1%) | 54 (10.9%) |
| Law Enforcement | 345 (93.0%) | 26 (7.0%) |
| Food Preparation & Serving | 965 (44.7%) | 1,193 (55.3%) |
| Cleaning & Maintenance | 646 (73.5%) | 233 (26.5%) |
| Personal Care & Service | 223 (20.7%) | 856 (79.3%) |
| Total (Category) | 2,962 (48.3%) | 3,174 (51.7%) |
| Total (Overall) | 25,853 (53.8%) | 22,167 (46.2%) |
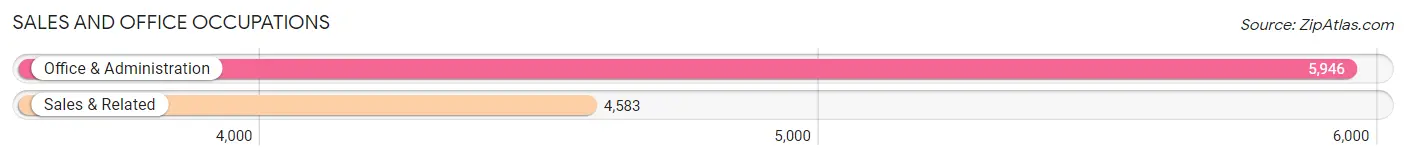
Sales and Office Occupations
The most common Sales and Office occupations in Livonia are Office & Administration (5,946 | 12.4%), and Sales & Related (4,583 | 9.5%).
Sales and Office Occupations by Sex
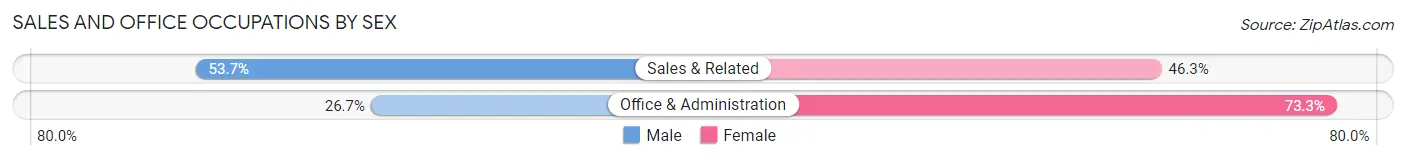
| Occupation | Male | Female |
| Sales & Related | 2,460 (53.7%) | 2,123 (46.3%) |
| Office & Administration | 1,590 (26.7%) | 4,356 (73.3%) |
| Total (Category) | 4,050 (38.5%) | 6,479 (61.5%) |
| Total (Overall) | 25,853 (53.8%) | 22,167 (46.2%) |
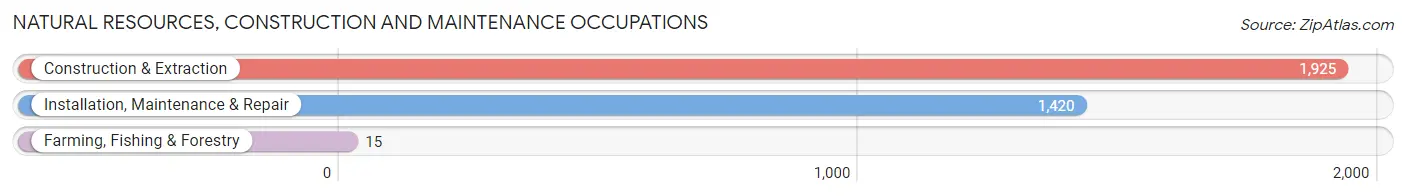
Natural Resources, Construction and Maintenance Occupations
The most common Natural Resources, Construction and Maintenance occupations in Livonia are Construction & Extraction (1,925 | 4.0%), Installation, Maintenance & Repair (1,420 | 3.0%), and Farming, Fishing & Forestry (15 | 0.0%).
Natural Resources, Construction and Maintenance Occupations by Sex
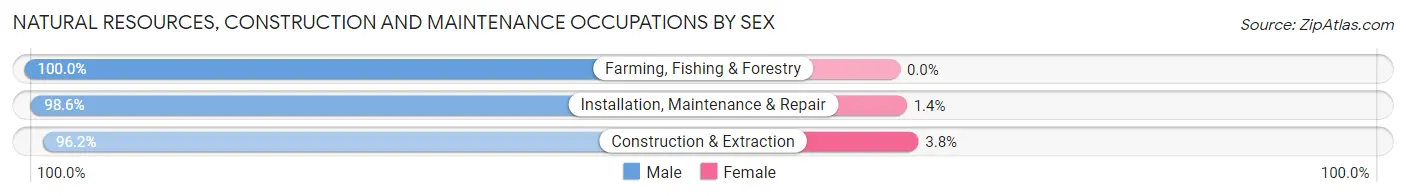
| Occupation | Male | Female |
| Farming, Fishing & Forestry | 15 (100.0%) | 0 (0.0%) |
| Construction & Extraction | 1,851 (96.2%) | 74 (3.8%) |
| Installation, Maintenance & Repair | 1,400 (98.6%) | 20 (1.4%) |
| Total (Category) | 3,266 (97.2%) | 94 (2.8%) |
| Total (Overall) | 25,853 (53.8%) | 22,167 (46.2%) |
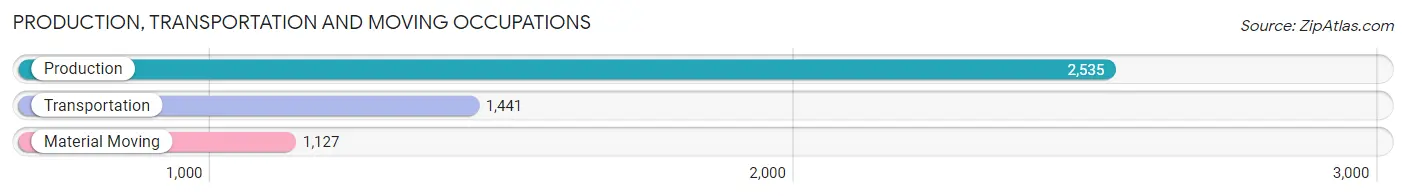
Production, Transportation and Moving Occupations
The most common Production, Transportation and Moving occupations in Livonia are Production (2,535 | 5.3%), Transportation (1,441 | 3.0%), and Material Moving (1,127 | 2.4%).
Production, Transportation and Moving Occupations by Sex
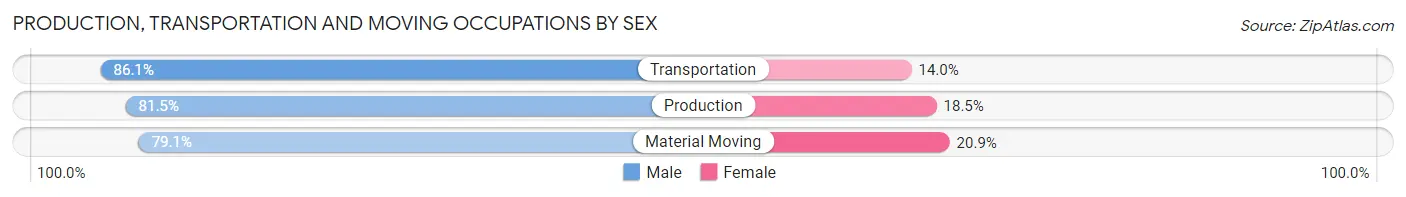
| Occupation | Male | Female |
| Production | 2,065 (81.5%) | 470 (18.5%) |
| Transportation | 1,240 (86.1%) | 201 (14.0%) |
| Material Moving | 891 (79.1%) | 236 (20.9%) |
| Total (Category) | 4,196 (82.2%) | 907 (17.8%) |
| Total (Overall) | 25,853 (53.8%) | 22,167 (46.2%) |
Employment Industries by Sex in Livonia
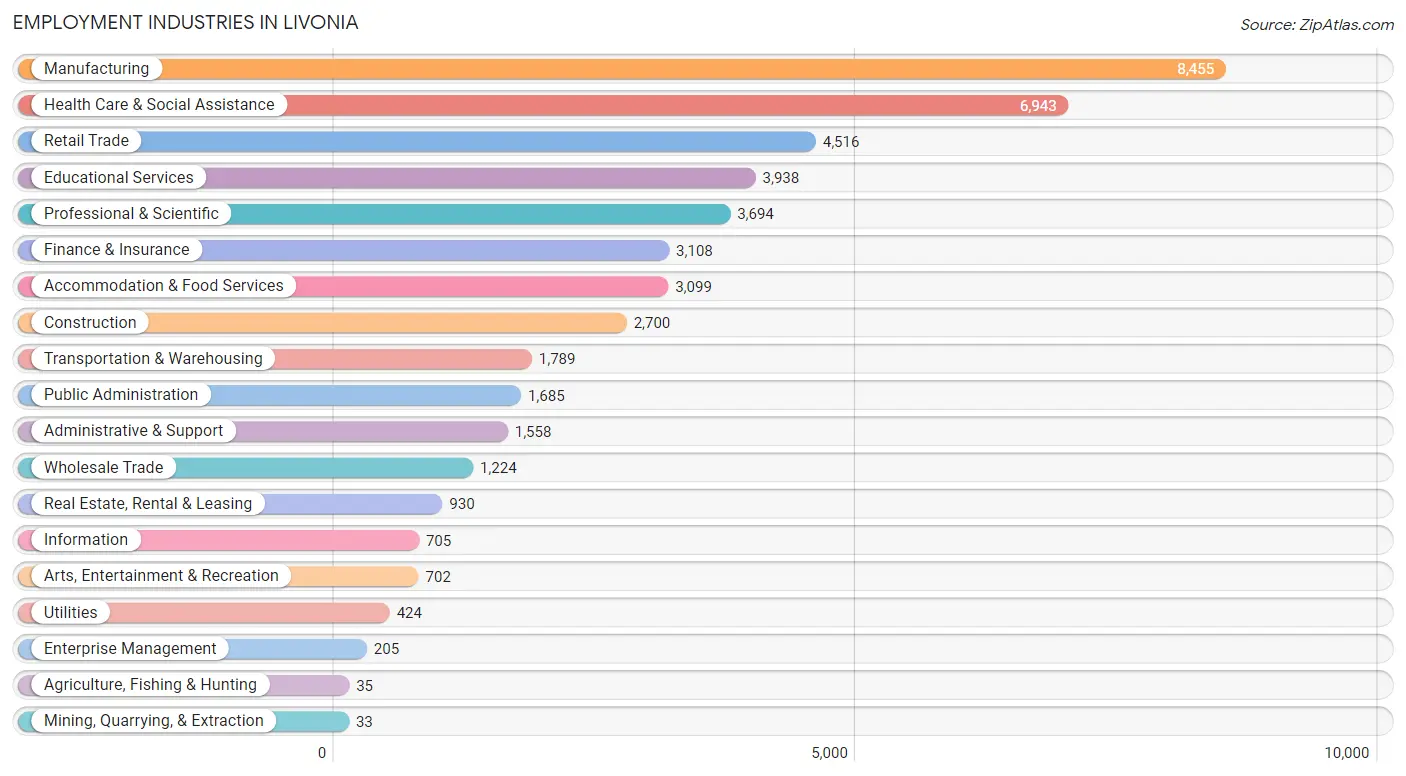
Employment Industries in Livonia
The major employment industries in Livonia include Manufacturing (8,455 | 17.6%), Health Care & Social Assistance (6,943 | 14.5%), Retail Trade (4,516 | 9.4%), Educational Services (3,938 | 8.2%), and Professional & Scientific (3,694 | 7.7%).
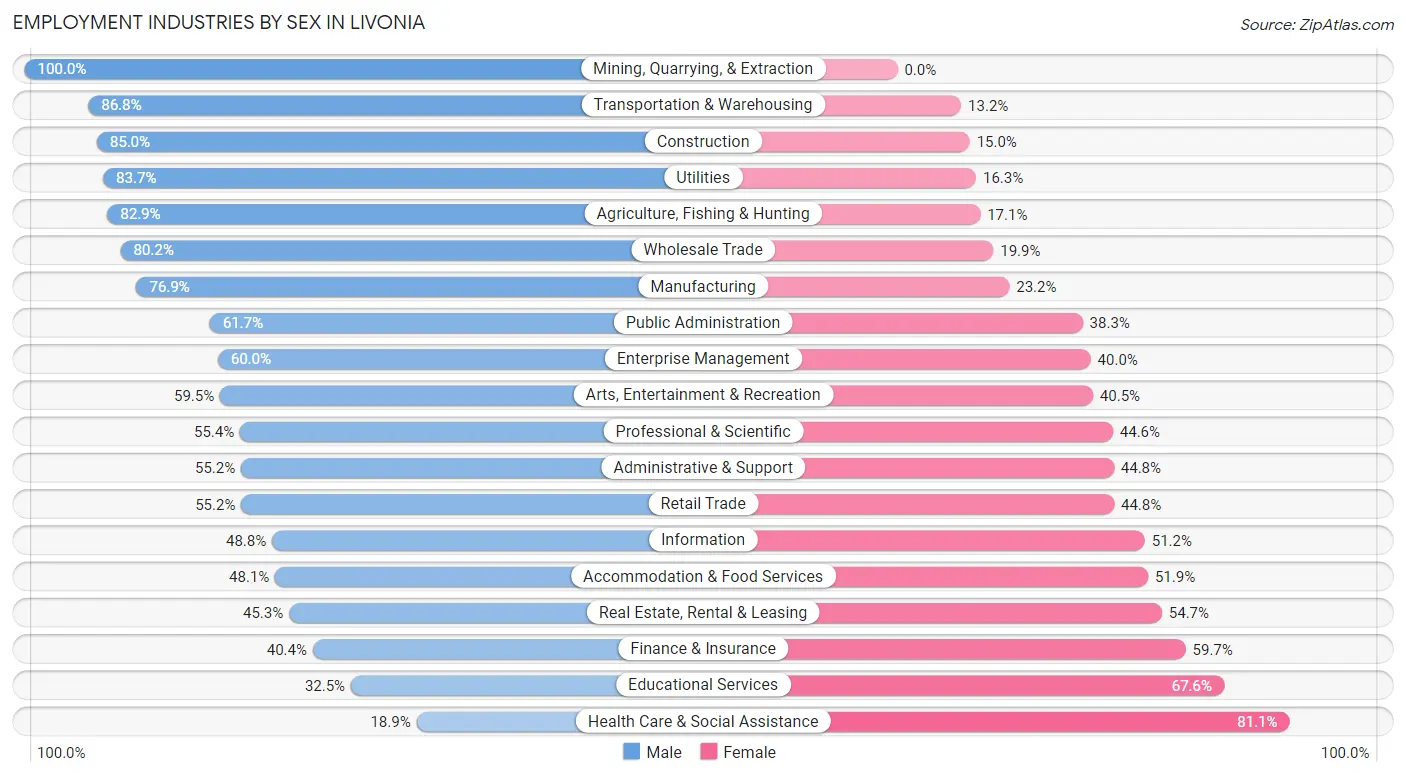
Employment Industries by Sex in Livonia
The Livonia industries that see more men than women are Mining, Quarrying, & Extraction (100.0%), Transportation & Warehousing (86.8%), and Construction (85.0%), whereas the industries that tend to have a higher number of women are Health Care & Social Assistance (81.1%), Educational Services (67.5%), and Finance & Insurance (59.7%).
| Industry | Male | Female |
| Agriculture, Fishing & Hunting | 29 (82.9%) | 6 (17.1%) |
| Mining, Quarrying, & Extraction | 33 (100.0%) | 0 (0.0%) |
| Construction | 2,296 (85.0%) | 404 (15.0%) |
| Manufacturing | 6,498 (76.8%) | 1,957 (23.2%) |
| Wholesale Trade | 981 (80.1%) | 243 (19.9%) |
| Retail Trade | 2,491 (55.2%) | 2,025 (44.8%) |
| Transportation & Warehousing | 1,553 (86.8%) | 236 (13.2%) |
| Utilities | 355 (83.7%) | 69 (16.3%) |
| Information | 344 (48.8%) | 361 (51.2%) |
| Finance & Insurance | 1,254 (40.4%) | 1,854 (59.7%) |
| Real Estate, Rental & Leasing | 421 (45.3%) | 509 (54.7%) |
| Professional & Scientific | 2,047 (55.4%) | 1,647 (44.6%) |
| Enterprise Management | 123 (60.0%) | 82 (40.0%) |
| Administrative & Support | 860 (55.2%) | 698 (44.8%) |
| Educational Services | 1,278 (32.5%) | 2,660 (67.5%) |
| Health Care & Social Assistance | 1,311 (18.9%) | 5,632 (81.1%) |
| Arts, Entertainment & Recreation | 418 (59.5%) | 284 (40.5%) |
| Accommodation & Food Services | 1,492 (48.1%) | 1,607 (51.9%) |
| Public Administration | 1,039 (61.7%) | 646 (38.3%) |
| Total | 25,853 (53.8%) | 22,167 (46.2%) |
Education in Livonia
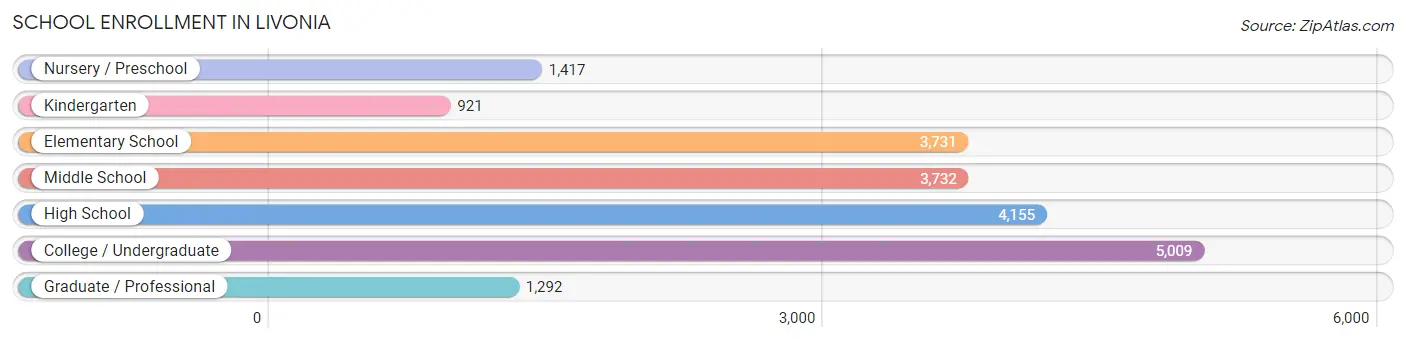
School Enrollment in Livonia
The most common levels of schooling among the 20,257 students in Livonia are college / undergraduate (5,009 | 24.7%), high school (4,155 | 20.5%), and middle school (3,732 | 18.4%).
| School Level | # Students | % Students |
| Nursery / Preschool | 1,417 | 7.0% |
| Kindergarten | 921 | 4.5% |
| Elementary School | 3,731 | 18.4% |
| Middle School | 3,732 | 18.4% |
| High School | 4,155 | 20.5% |
| College / Undergraduate | 5,009 | 24.7% |
| Graduate / Professional | 1,292 | 6.4% |
| Total | 20,257 | 100.0% |
School Enrollment by Age by Funding Source in Livonia
Out of a total of 20,257 students who are enrolled in schools in Livonia, 3,687 (18.2%) attend a private institution, while the remaining 16,570 (81.8%) are enrolled in public schools. The age group of 3 to 4 year olds has the highest likelihood of being enrolled in private schools, with 507 (43.6% in the age bracket) enrolled. Conversely, the age group of 10 to 14 year olds has the lowest likelihood of being enrolled in a private school, with 4,475 (86.5% in the age bracket) attending a public institution.
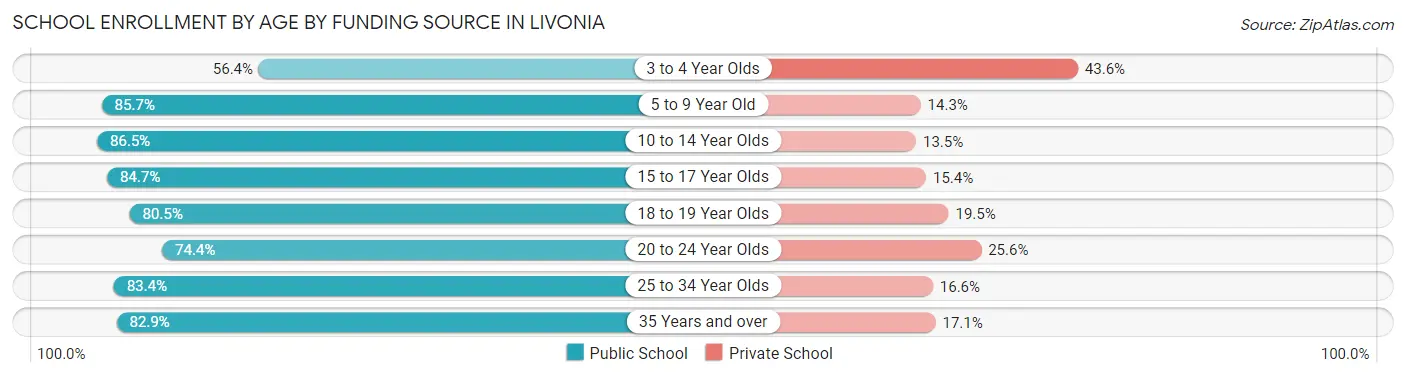
| Age Bracket | Public School | Private School |
| 3 to 4 Year Olds | 655 (56.4%) | 507 (43.6%) |
| 5 to 9 Year Old | 3,583 (85.7%) | 600 (14.3%) |
| 10 to 14 Year Olds | 4,475 (86.5%) | 697 (13.5%) |
| 15 to 17 Year Olds | 2,586 (84.7%) | 469 (15.3%) |
| 18 to 19 Year Olds | 1,075 (80.5%) | 261 (19.5%) |
| 20 to 24 Year Olds | 2,108 (74.4%) | 726 (25.6%) |
| 25 to 34 Year Olds | 1,069 (83.4%) | 213 (16.6%) |
| 35 Years and over | 1,022 (82.9%) | 211 (17.1%) |
| Total | 16,570 (81.8%) | 3,687 (18.2%) |
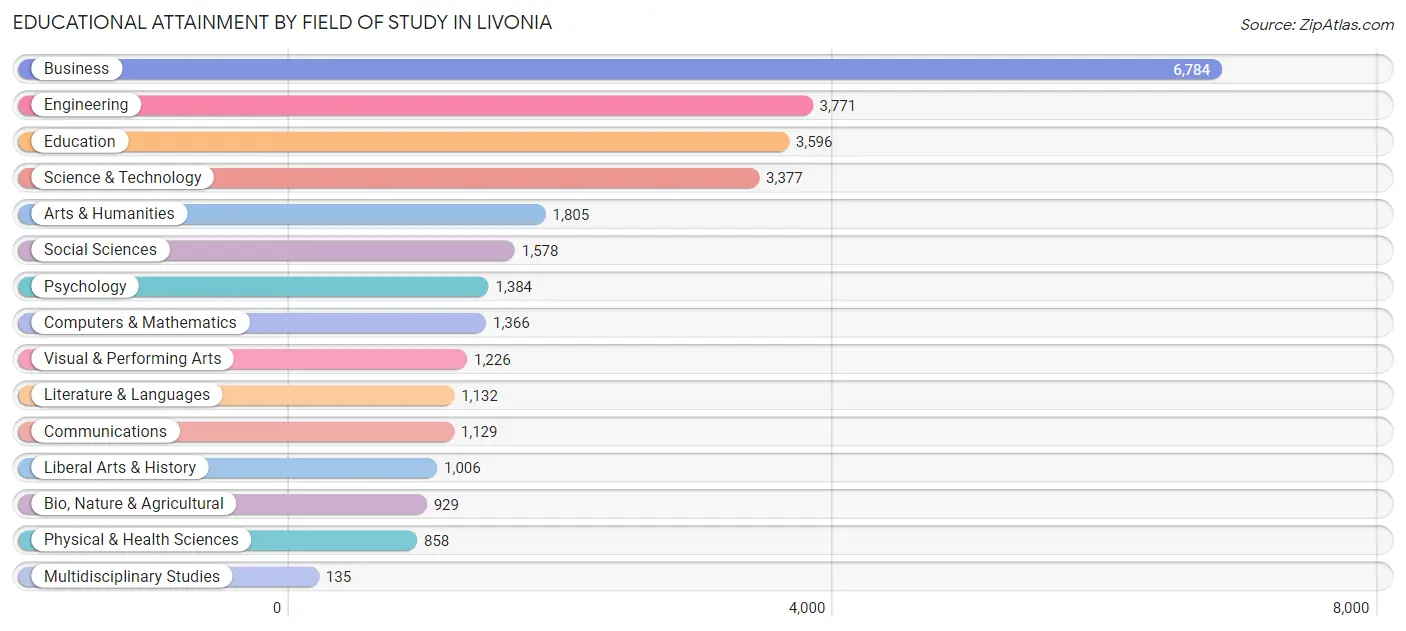
Educational Attainment by Field of Study in Livonia
Business (6,784 | 22.6%), engineering (3,771 | 12.5%), education (3,596 | 12.0%), science & technology (3,377 | 11.2%), and arts & humanities (1,805 | 6.0%) are the most common fields of study among 30,076 individuals in Livonia who have obtained a bachelor's degree or higher.
| Field of Study | # Graduates | % Graduates |
| Computers & Mathematics | 1,366 | 4.5% |
| Bio, Nature & Agricultural | 929 | 3.1% |
| Physical & Health Sciences | 858 | 2.9% |
| Psychology | 1,384 | 4.6% |
| Social Sciences | 1,578 | 5.2% |
| Engineering | 3,771 | 12.5% |
| Multidisciplinary Studies | 135 | 0.4% |
| Science & Technology | 3,377 | 11.2% |
| Business | 6,784 | 22.6% |
| Education | 3,596 | 12.0% |
| Literature & Languages | 1,132 | 3.8% |
| Liberal Arts & History | 1,006 | 3.3% |
| Visual & Performing Arts | 1,226 | 4.1% |
| Communications | 1,129 | 3.7% |
| Arts & Humanities | 1,805 | 6.0% |
| Total | 30,076 | 100.0% |
Transportation & Commute in Livonia
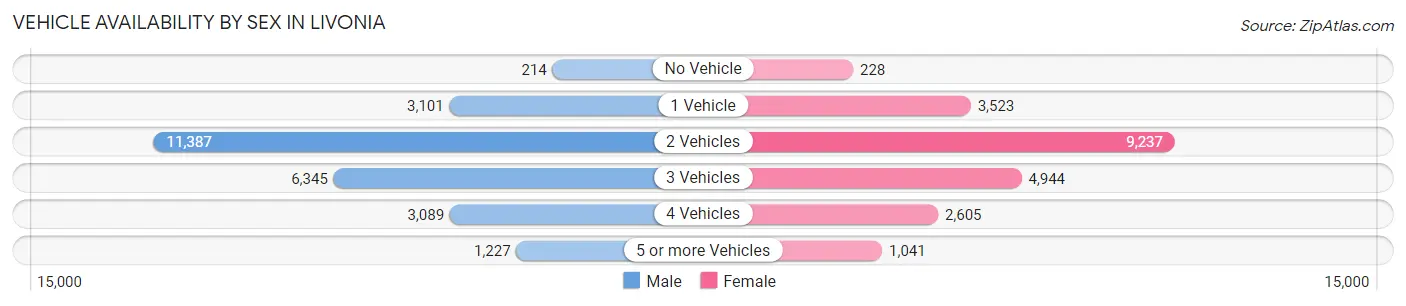
Vehicle Availability by Sex in Livonia
The most prevalent vehicle ownership categories in Livonia are males with 2 vehicles (11,387, accounting for 44.9%) and females with 2 vehicles (9,237, making up 52.8%).
| Vehicles Available | Male | Female |
| No Vehicle | 214 (0.8%) | 228 (1.1%) |
| 1 Vehicle | 3,101 (12.2%) | 3,523 (16.3%) |
| 2 Vehicles | 11,387 (44.9%) | 9,237 (42.8%) |
| 3 Vehicles | 6,345 (25.0%) | 4,944 (22.9%) |
| 4 Vehicles | 3,089 (12.2%) | 2,605 (12.1%) |
| 5 or more Vehicles | 1,227 (4.8%) | 1,041 (4.8%) |
| Total | 25,363 (100.0%) | 21,578 (100.0%) |
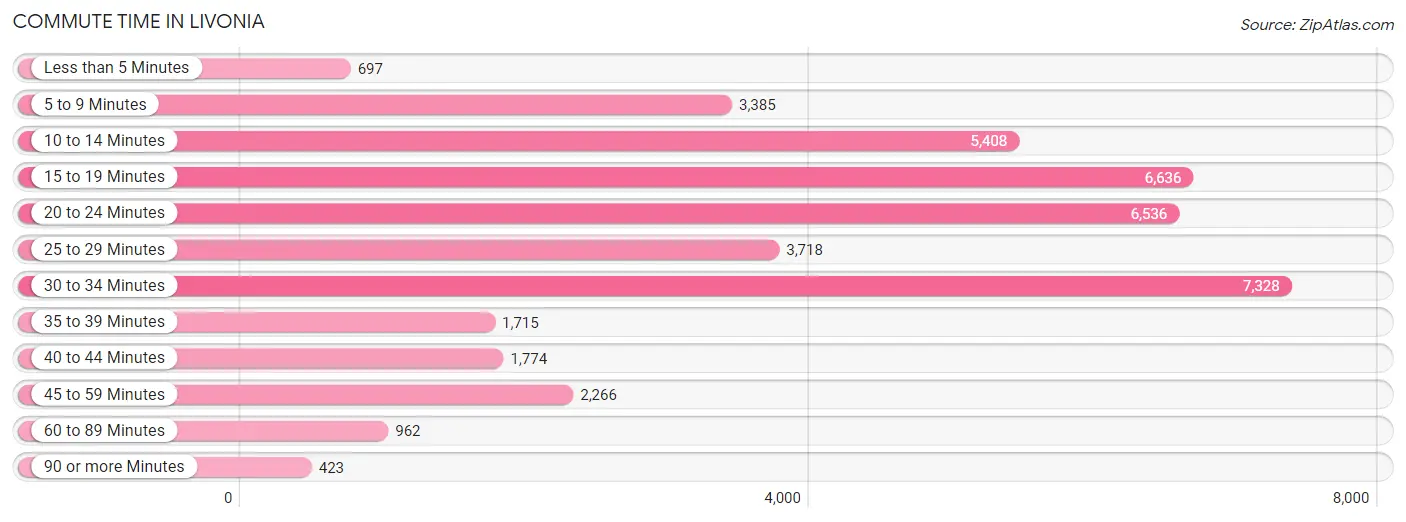
Commute Time in Livonia
The most frequently occuring commute durations in Livonia are 30 to 34 minutes (7,328 commuters, 17.9%), 15 to 19 minutes (6,636 commuters, 16.3%), and 20 to 24 minutes (6,536 commuters, 16.0%).
| Commute Time | # Commuters | % Commuters |
| Less than 5 Minutes | 697 | 1.7% |
| 5 to 9 Minutes | 3,385 | 8.3% |
| 10 to 14 Minutes | 5,408 | 13.2% |
| 15 to 19 Minutes | 6,636 | 16.3% |
| 20 to 24 Minutes | 6,536 | 16.0% |
| 25 to 29 Minutes | 3,718 | 9.1% |
| 30 to 34 Minutes | 7,328 | 17.9% |
| 35 to 39 Minutes | 1,715 | 4.2% |
| 40 to 44 Minutes | 1,774 | 4.3% |
| 45 to 59 Minutes | 2,266 | 5.6% |
| 60 to 89 Minutes | 962 | 2.4% |
| 90 or more Minutes | 423 | 1.0% |
Commute Time by Sex in Livonia
The most common commute times in Livonia are 30 to 34 minutes (4,255 commuters, 19.2%) for males and 20 to 24 minutes (3,098 commuters, 16.6%) for females.
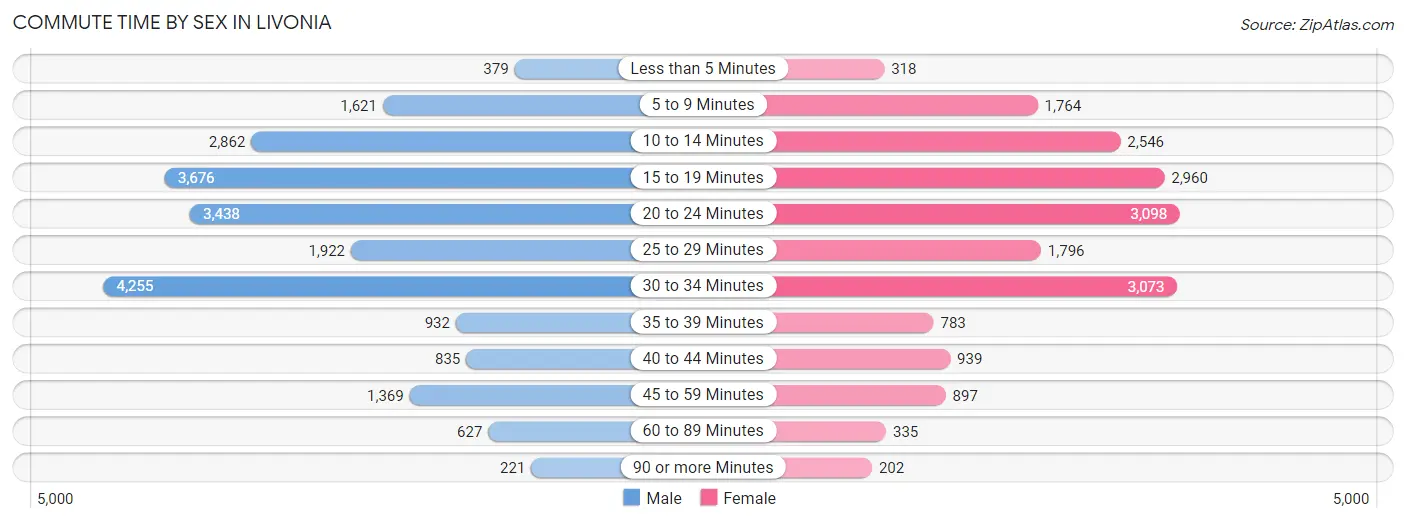
| Commute Time | Male | Female |
| Less than 5 Minutes | 379 (1.7%) | 318 (1.7%) |
| 5 to 9 Minutes | 1,621 (7.3%) | 1,764 (9.4%) |
| 10 to 14 Minutes | 2,862 (12.9%) | 2,546 (13.6%) |
| 15 to 19 Minutes | 3,676 (16.6%) | 2,960 (15.8%) |
| 20 to 24 Minutes | 3,438 (15.5%) | 3,098 (16.6%) |
| 25 to 29 Minutes | 1,922 (8.7%) | 1,796 (9.6%) |
| 30 to 34 Minutes | 4,255 (19.2%) | 3,073 (16.4%) |
| 35 to 39 Minutes | 932 (4.2%) | 783 (4.2%) |
| 40 to 44 Minutes | 835 (3.8%) | 939 (5.0%) |
| 45 to 59 Minutes | 1,369 (6.2%) | 897 (4.8%) |
| 60 to 89 Minutes | 627 (2.8%) | 335 (1.8%) |
| 90 or more Minutes | 221 (1.0%) | 202 (1.1%) |
Time of Departure to Work by Sex in Livonia
The most frequent times of departure to work in Livonia are 7:30 AM to 7:59 AM (2,958, 13.4%) for males and 7:30 AM to 7:59 AM (3,092, 16.5%) for females.
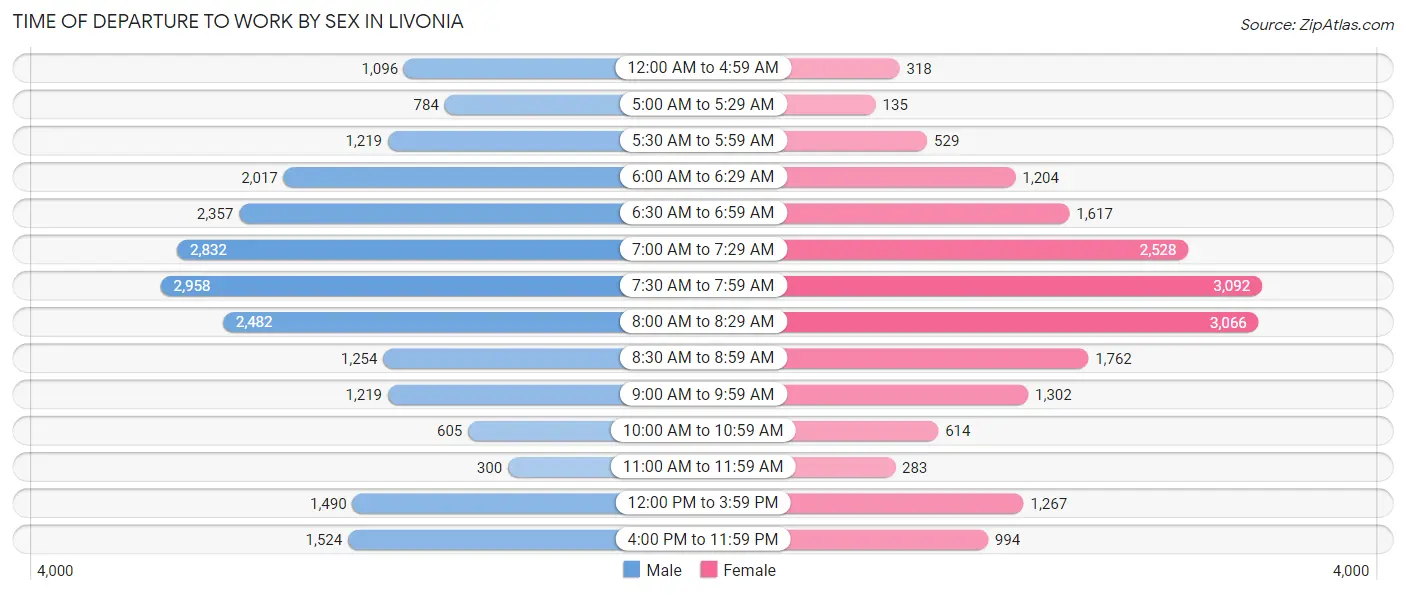
| Time of Departure | Male | Female |
| 12:00 AM to 4:59 AM | 1,096 (5.0%) | 318 (1.7%) |
| 5:00 AM to 5:29 AM | 784 (3.5%) | 135 (0.7%) |
| 5:30 AM to 5:59 AM | 1,219 (5.5%) | 529 (2.8%) |
| 6:00 AM to 6:29 AM | 2,017 (9.1%) | 1,204 (6.4%) |
| 6:30 AM to 6:59 AM | 2,357 (10.6%) | 1,617 (8.6%) |
| 7:00 AM to 7:29 AM | 2,832 (12.8%) | 2,528 (13.5%) |
| 7:30 AM to 7:59 AM | 2,958 (13.4%) | 3,092 (16.5%) |
| 8:00 AM to 8:29 AM | 2,482 (11.2%) | 3,066 (16.4%) |
| 8:30 AM to 8:59 AM | 1,254 (5.7%) | 1,762 (9.4%) |
| 9:00 AM to 9:59 AM | 1,219 (5.5%) | 1,302 (7.0%) |
| 10:00 AM to 10:59 AM | 605 (2.7%) | 614 (3.3%) |
| 11:00 AM to 11:59 AM | 300 (1.4%) | 283 (1.5%) |
| 12:00 PM to 3:59 PM | 1,490 (6.7%) | 1,267 (6.8%) |
| 4:00 PM to 11:59 PM | 1,524 (6.9%) | 994 (5.3%) |
| Total | 22,137 (100.0%) | 18,711 (100.0%) |
Housing Occupancy in Livonia
Occupancy by Ownership in Livonia
Of the total 37,789 dwellings in Livonia, owner-occupied units account for 32,962 (87.2%), while renter-occupied units make up 4,827 (12.8%).
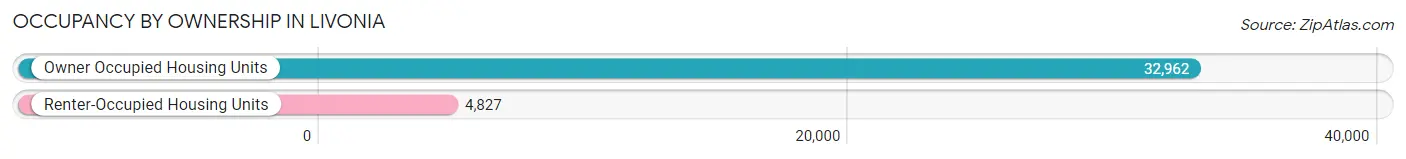
| Occupancy | # Housing Units | % Housing Units |
| Owner Occupied Housing Units | 32,962 | 87.2% |
| Renter-Occupied Housing Units | 4,827 | 12.8% |
| Total Occupied Housing Units | 37,789 | 100.0% |
Occupancy by Household Size in Livonia
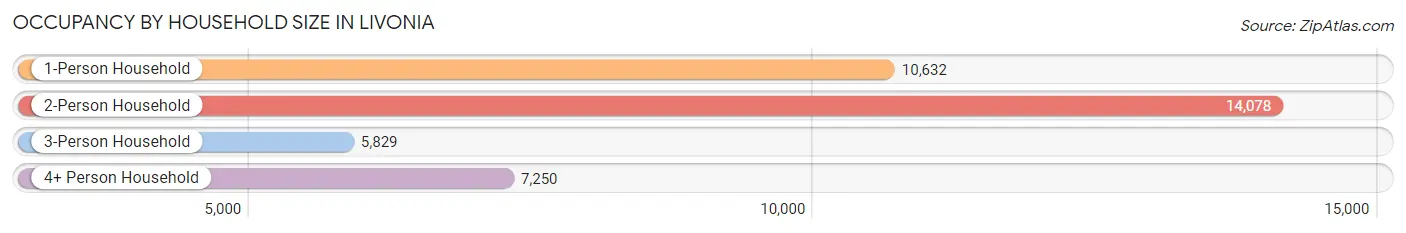
| Household Size | # Housing Units | % Housing Units |
| 1-Person Household | 10,632 | 28.1% |
| 2-Person Household | 14,078 | 37.2% |
| 3-Person Household | 5,829 | 15.4% |
| 4+ Person Household | 7,250 | 19.2% |
| Total Housing Units | 37,789 | 100.0% |
Occupancy by Ownership by Household Size in Livonia
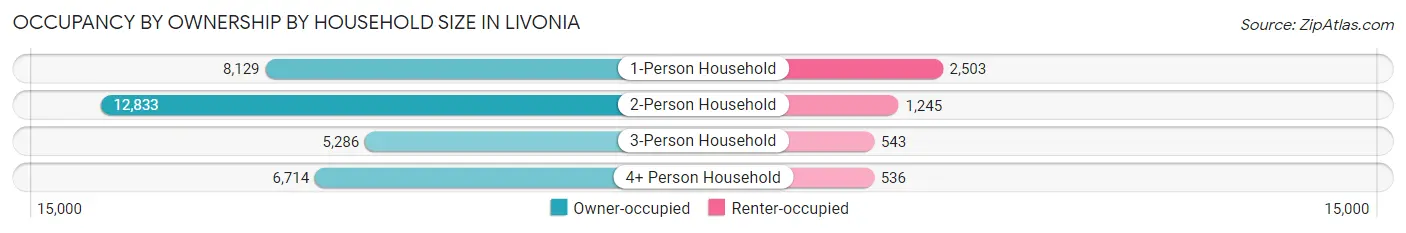
| Household Size | Owner-occupied | Renter-occupied |
| 1-Person Household | 8,129 (76.5%) | 2,503 (23.5%) |
| 2-Person Household | 12,833 (91.2%) | 1,245 (8.8%) |
| 3-Person Household | 5,286 (90.7%) | 543 (9.3%) |
| 4+ Person Household | 6,714 (92.6%) | 536 (7.4%) |
| Total Housing Units | 32,962 (87.2%) | 4,827 (12.8%) |
Occupancy by Educational Attainment in Livonia
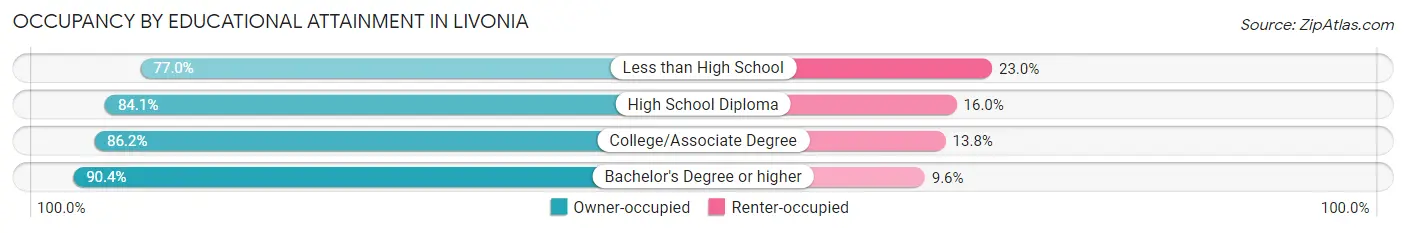
| Household Size | Owner-occupied | Renter-occupied |
| Less than High School | 1,174 (77.0%) | 350 (23.0%) |
| High School Diploma | 5,911 (84.1%) | 1,122 (16.0%) |
| College/Associate Degree | 11,183 (86.2%) | 1,788 (13.8%) |
| Bachelor's Degree or higher | 14,694 (90.4%) | 1,567 (9.6%) |
Occupancy by Age of Householder in Livonia
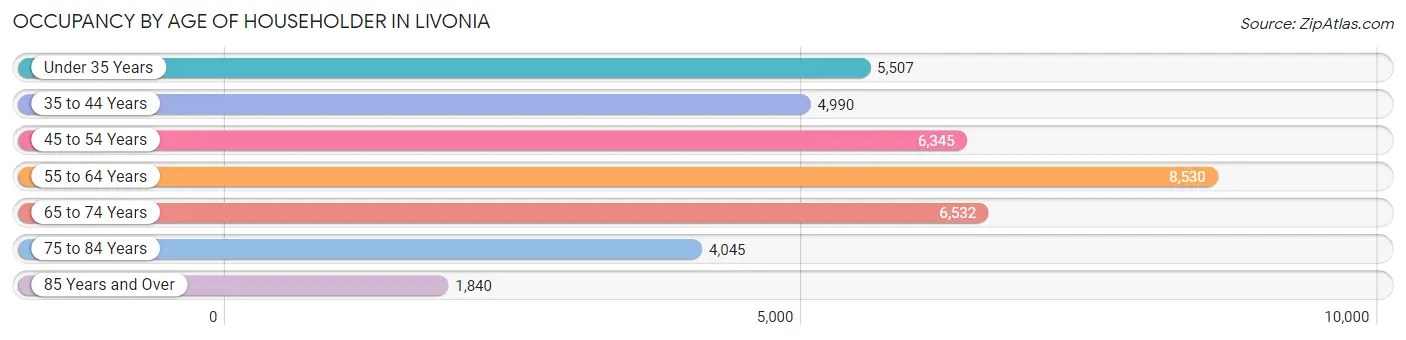
| Age Bracket | # Households | % Households |
| Under 35 Years | 5,507 | 14.6% |
| 35 to 44 Years | 4,990 | 13.2% |
| 45 to 54 Years | 6,345 | 16.8% |
| 55 to 64 Years | 8,530 | 22.6% |
| 65 to 74 Years | 6,532 | 17.3% |
| 75 to 84 Years | 4,045 | 10.7% |
| 85 Years and Over | 1,840 | 4.9% |
| Total | 37,789 | 100.0% |
Housing Finances in Livonia
Median Income by Occupancy in Livonia
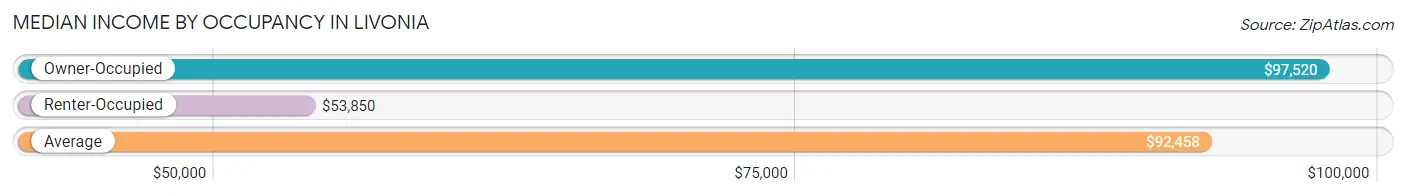
| Occupancy Type | # Households | Median Income |
| Owner-Occupied | 32,962 (87.2%) | $97,520 |
| Renter-Occupied | 4,827 (12.8%) | $53,850 |
| Average | 37,789 (100.0%) | $92,458 |
Occupancy by Householder Income Bracket in Livonia
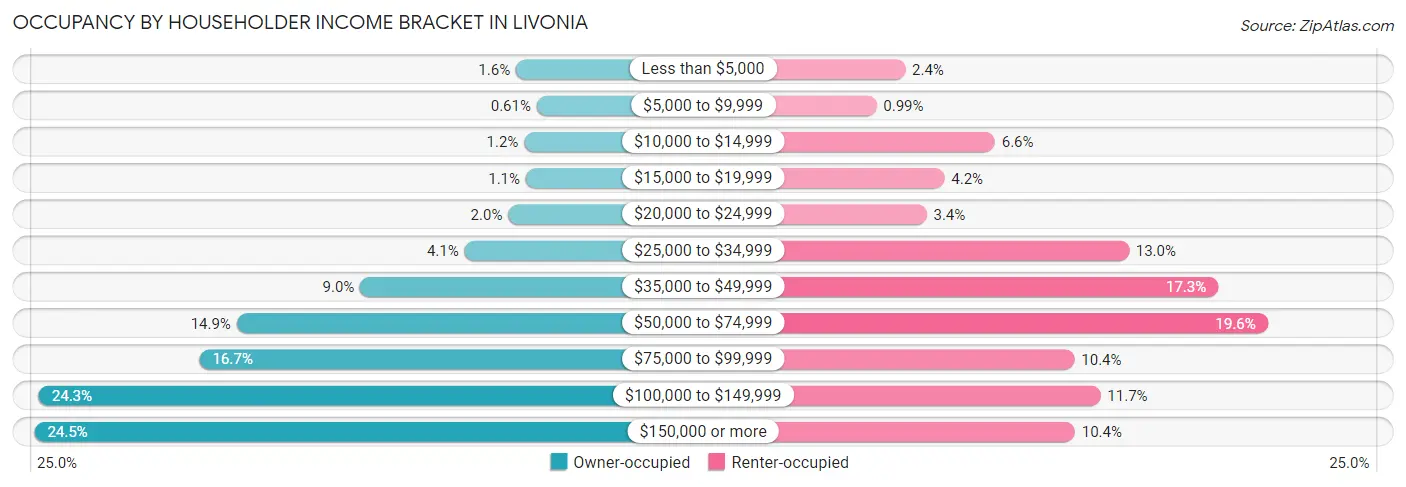
| Income Bracket | Owner-occupied | Renter-occupied |
| Less than $5,000 | 529 (1.6%) | 114 (2.4%) |
| $5,000 to $9,999 | 202 (0.6%) | 48 (1.0%) |
| $10,000 to $14,999 | 400 (1.2%) | 320 (6.6%) |
| $15,000 to $19,999 | 371 (1.1%) | 204 (4.2%) |
| $20,000 to $24,999 | 649 (2.0%) | 163 (3.4%) |
| $25,000 to $34,999 | 1,334 (4.1%) | 628 (13.0%) |
| $35,000 to $49,999 | 2,972 (9.0%) | 833 (17.3%) |
| $50,000 to $74,999 | 4,911 (14.9%) | 947 (19.6%) |
| $75,000 to $99,999 | 5,494 (16.7%) | 503 (10.4%) |
| $100,000 to $149,999 | 8,016 (24.3%) | 563 (11.7%) |
| $150,000 or more | 8,084 (24.5%) | 504 (10.4%) |
| Total | 32,962 (100.0%) | 4,827 (100.0%) |
Monthly Housing Cost Tiers in Livonia
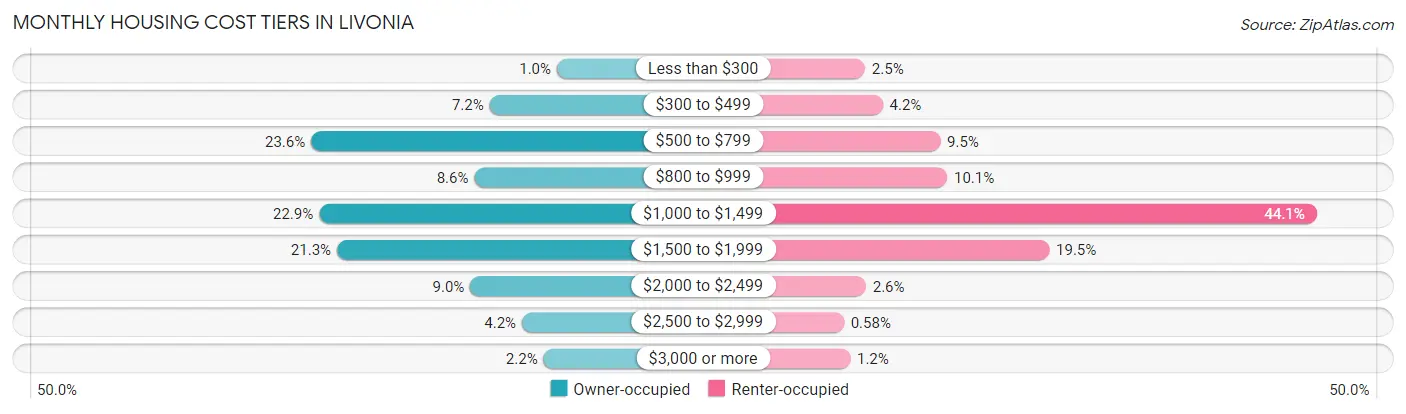
| Monthly Cost | Owner-occupied | Renter-occupied |
| Less than $300 | 328 (1.0%) | 122 (2.5%) |
| $300 to $499 | 2,373 (7.2%) | 201 (4.2%) |
| $500 to $799 | 7,790 (23.6%) | 456 (9.5%) |
| $800 to $999 | 2,836 (8.6%) | 487 (10.1%) |
| $1,000 to $1,499 | 7,546 (22.9%) | 2,129 (44.1%) |
| $1,500 to $1,999 | 7,004 (21.2%) | 941 (19.5%) |
| $2,000 to $2,499 | 2,959 (9.0%) | 126 (2.6%) |
| $2,500 to $2,999 | 1,390 (4.2%) | 28 (0.6%) |
| $3,000 or more | 736 (2.2%) | 56 (1.2%) |
| Total | 32,962 (100.0%) | 4,827 (100.0%) |
Physical Housing Characteristics in Livonia
Housing Structures in Livonia
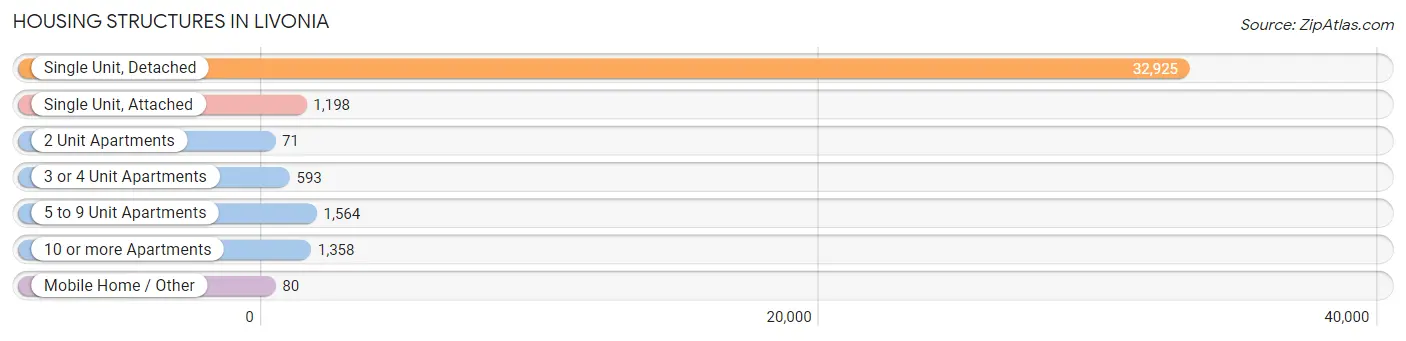
| Structure Type | # Housing Units | % Housing Units |
| Single Unit, Detached | 32,925 | 87.1% |
| Single Unit, Attached | 1,198 | 3.2% |
| 2 Unit Apartments | 71 | 0.2% |
| 3 or 4 Unit Apartments | 593 | 1.6% |
| 5 to 9 Unit Apartments | 1,564 | 4.1% |
| 10 or more Apartments | 1,358 | 3.6% |
| Mobile Home / Other | 80 | 0.2% |
| Total | 37,789 | 100.0% |
Housing Structures by Occupancy in Livonia
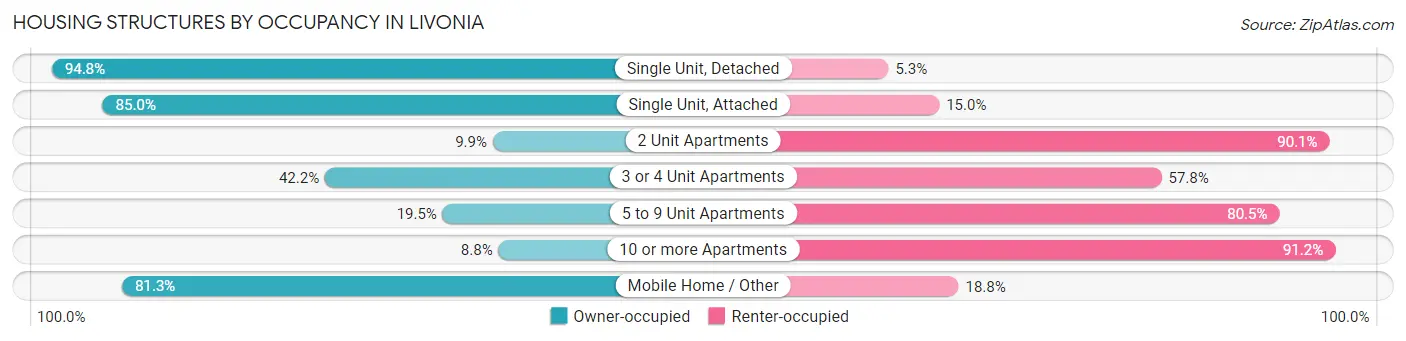
| Structure Type | Owner-occupied | Renter-occupied |
| Single Unit, Detached | 31,198 (94.8%) | 1,727 (5.2%) |
| Single Unit, Attached | 1,018 (85.0%) | 180 (15.0%) |
| 2 Unit Apartments | 7 (9.9%) | 64 (90.1%) |
| 3 or 4 Unit Apartments | 250 (42.2%) | 343 (57.8%) |
| 5 to 9 Unit Apartments | 305 (19.5%) | 1,259 (80.5%) |
| 10 or more Apartments | 119 (8.8%) | 1,239 (91.2%) |
| Mobile Home / Other | 65 (81.2%) | 15 (18.8%) |
| Total | 32,962 (87.2%) | 4,827 (12.8%) |
Housing Structures by Number of Rooms in Livonia
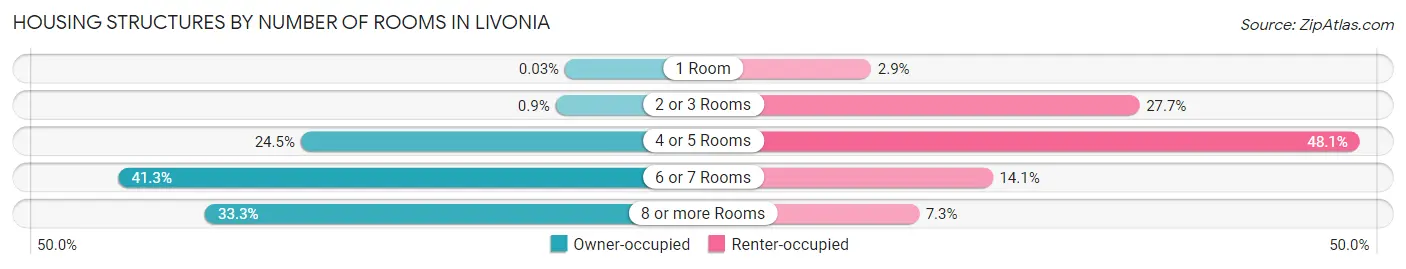
| Number of Rooms | Owner-occupied | Renter-occupied |
| 1 Room | 11 (0.0%) | 138 (2.9%) |
| 2 or 3 Rooms | 296 (0.9%) | 1,336 (27.7%) |
| 4 or 5 Rooms | 8,061 (24.5%) | 2,320 (48.1%) |
| 6 or 7 Rooms | 13,617 (41.3%) | 681 (14.1%) |
| 8 or more Rooms | 10,977 (33.3%) | 352 (7.3%) |
| Total | 32,962 (100.0%) | 4,827 (100.0%) |
Housing Structure by Heating Type in Livonia
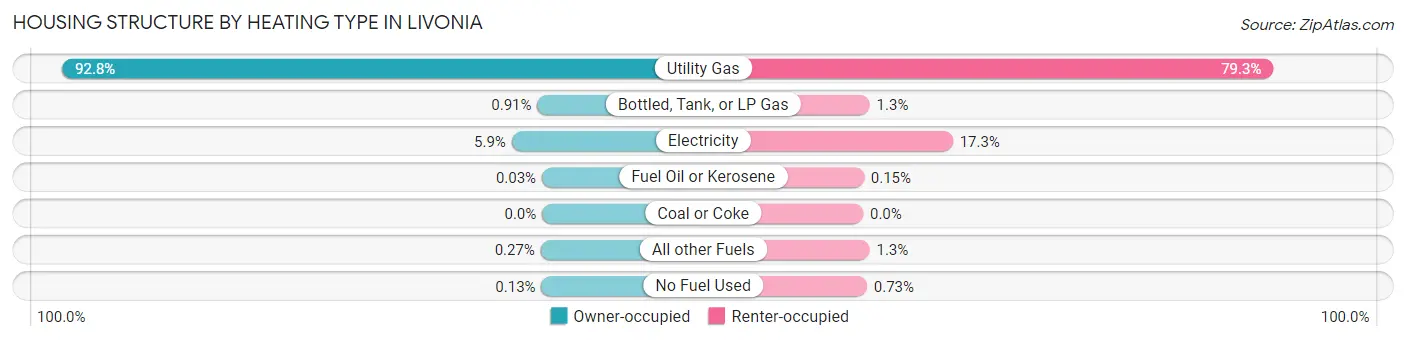
| Heating Type | Owner-occupied | Renter-occupied |
| Utility Gas | 30,581 (92.8%) | 3,826 (79.3%) |
| Bottled, Tank, or LP Gas | 301 (0.9%) | 62 (1.3%) |
| Electricity | 1,938 (5.9%) | 836 (17.3%) |
| Fuel Oil or Kerosene | 9 (0.0%) | 7 (0.2%) |
| Coal or Coke | 0 (0.0%) | 0 (0.0%) |
| All other Fuels | 90 (0.3%) | 61 (1.3%) |
| No Fuel Used | 43 (0.1%) | 35 (0.7%) |
| Total | 32,962 (100.0%) | 4,827 (100.0%) |
Household Vehicle Usage in Livonia
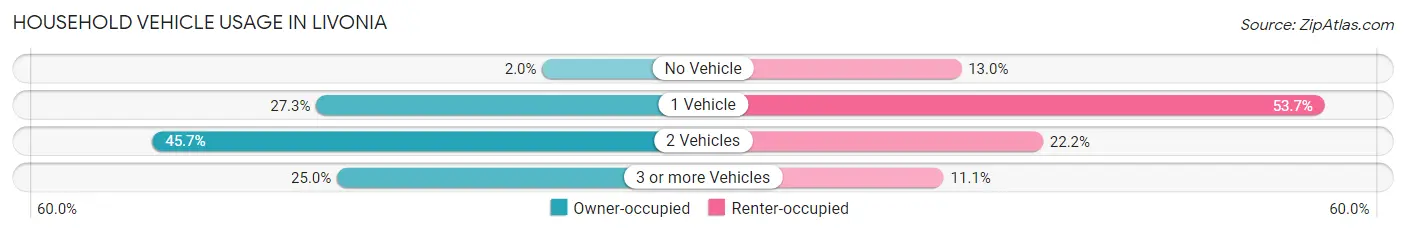
| Vehicles per Household | Owner-occupied | Renter-occupied |
| No Vehicle | 660 (2.0%) | 629 (13.0%) |
| 1 Vehicle | 9,005 (27.3%) | 2,594 (53.7%) |
| 2 Vehicles | 15,061 (45.7%) | 1,070 (22.2%) |
| 3 or more Vehicles | 8,236 (25.0%) | 534 (11.1%) |
| Total | 32,962 (100.0%) | 4,827 (100.0%) |
Real Estate & Mortgages in Livonia
Real Estate and Mortgage Overview in Livonia
| Characteristic | Without Mortgage | With Mortgage |
| Housing Units | 12,599 | 20,363 |
| Median Property Value | $246,000 | $251,100 |
| Median Household Income | $79,580 | $5,997 |
| Monthly Housing Costs | $643 | $720 |
| Real Estate Taxes | $3,577 | $355 |
Property Value by Mortgage Status in Livonia
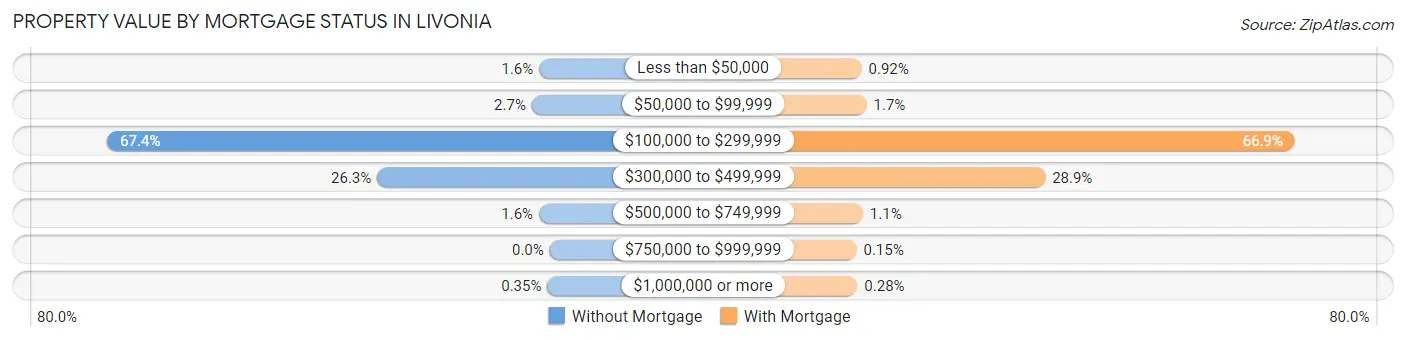
| Property Value | Without Mortgage | With Mortgage |
| Less than $50,000 | 202 (1.6%) | 188 (0.9%) |
| $50,000 to $99,999 | 343 (2.7%) | 344 (1.7%) |
| $100,000 to $299,999 | 8,495 (67.4%) | 13,632 (66.9%) |
| $300,000 to $499,999 | 3,311 (26.3%) | 5,884 (28.9%) |
| $500,000 to $749,999 | 204 (1.6%) | 229 (1.1%) |
| $750,000 to $999,999 | 0 (0.0%) | 30 (0.2%) |
| $1,000,000 or more | 44 (0.4%) | 56 (0.3%) |
| Total | 12,599 (100.0%) | 20,363 (100.0%) |
Household Income by Mortgage Status in Livonia
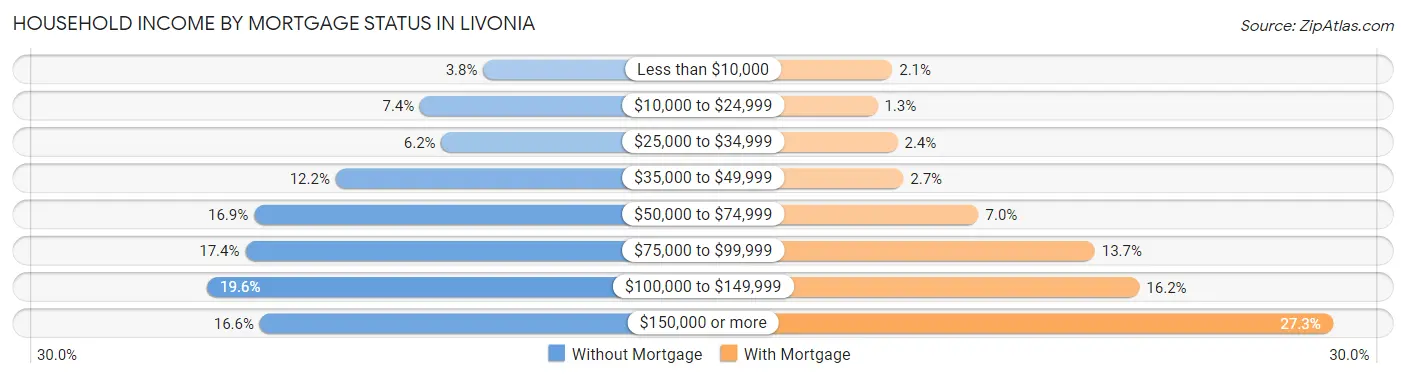
| Household Income | Without Mortgage | With Mortgage |
| Less than $10,000 | 477 (3.8%) | 428 (2.1%) |
| $10,000 to $24,999 | 932 (7.4%) | 254 (1.3%) |
| $25,000 to $34,999 | 778 (6.2%) | 488 (2.4%) |
| $35,000 to $49,999 | 1,540 (12.2%) | 556 (2.7%) |
| $50,000 to $74,999 | 2,128 (16.9%) | 1,432 (7.0%) |
| $75,000 to $99,999 | 2,191 (17.4%) | 2,783 (13.7%) |
| $100,000 to $149,999 | 2,466 (19.6%) | 3,303 (16.2%) |
| $150,000 or more | 2,087 (16.6%) | 5,550 (27.3%) |
| Total | 12,599 (100.0%) | 20,363 (100.0%) |
Property Value to Household Income Ratio in Livonia
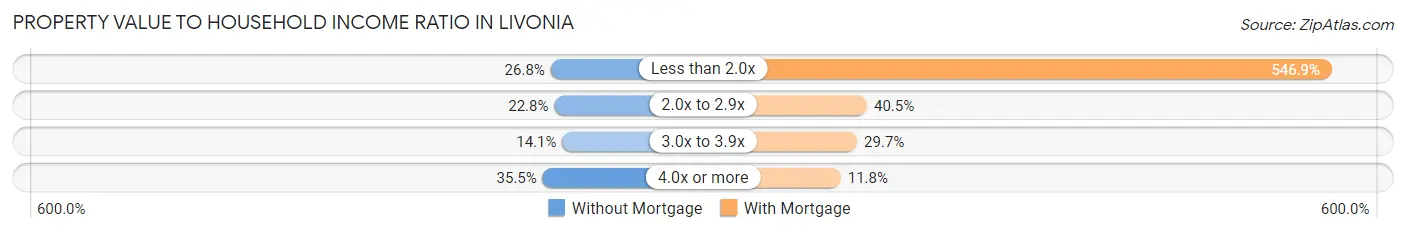
| Value-to-Income Ratio | Without Mortgage | With Mortgage |
| Less than 2.0x | 3,371 (26.8%) | 111,372 (546.9%) |
| 2.0x to 2.9x | 2,873 (22.8%) | 8,247 (40.5%) |
| 3.0x to 3.9x | 1,773 (14.1%) | 6,041 (29.7%) |
| 4.0x or more | 4,476 (35.5%) | 2,410 (11.8%) |
| Total | 12,599 (100.0%) | 20,363 (100.0%) |
Real Estate Taxes by Mortgage Status in Livonia
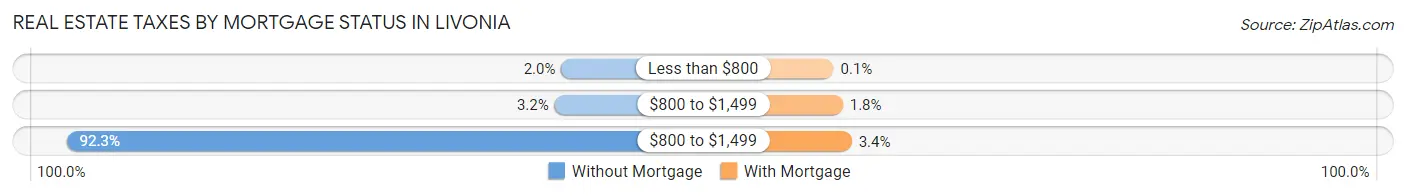
| Property Taxes | Without Mortgage | With Mortgage |
| Less than $800 | 248 (2.0%) | 21 (0.1%) |
| $800 to $1,499 | 404 (3.2%) | 363 (1.8%) |
| $800 to $1,499 | 11,632 (92.3%) | 694 (3.4%) |
| Total | 12,599 (100.0%) | 20,363 (100.0%) |
Health & Disability in Livonia
Health Insurance Coverage by Age in Livonia
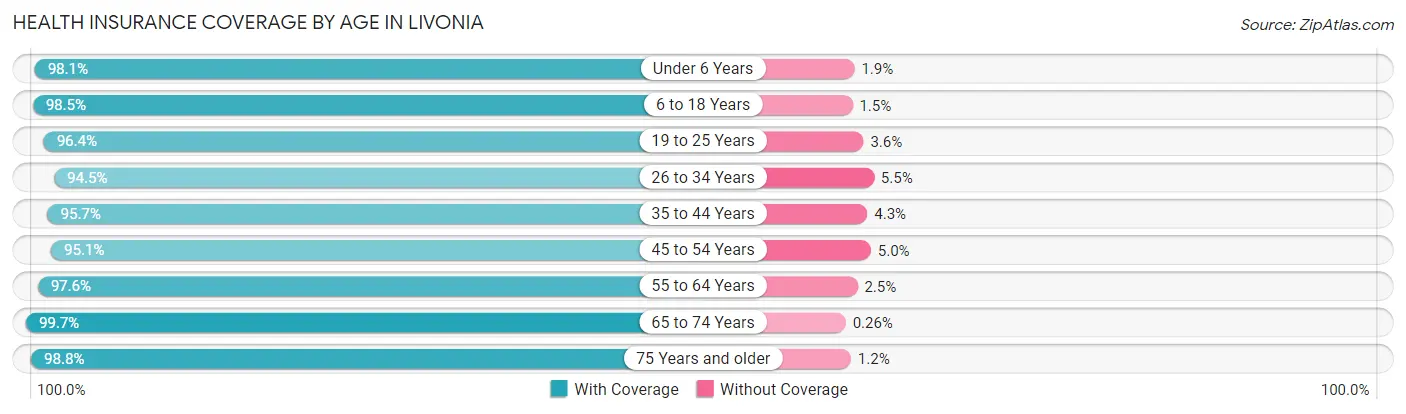
| Age Bracket | With Coverage | Without Coverage |
| Under 6 Years | 5,223 (98.1%) | 101 (1.9%) |
| 6 to 18 Years | 12,442 (98.5%) | 192 (1.5%) |
| 19 to 25 Years | 7,232 (96.4%) | 268 (3.6%) |
| 26 to 34 Years | 10,710 (94.5%) | 626 (5.5%) |
| 35 to 44 Years | 10,053 (95.7%) | 452 (4.3%) |
| 45 to 54 Years | 11,204 (95.1%) | 584 (5.0%) |
| 55 to 64 Years | 14,642 (97.6%) | 367 (2.5%) |
| 65 to 74 Years | 11,294 (99.7%) | 29 (0.3%) |
| 75 Years and older | 8,480 (98.8%) | 106 (1.2%) |
| Total | 91,280 (97.1%) | 2,725 (2.9%) |
Health Insurance Coverage by Citizenship Status in Livonia
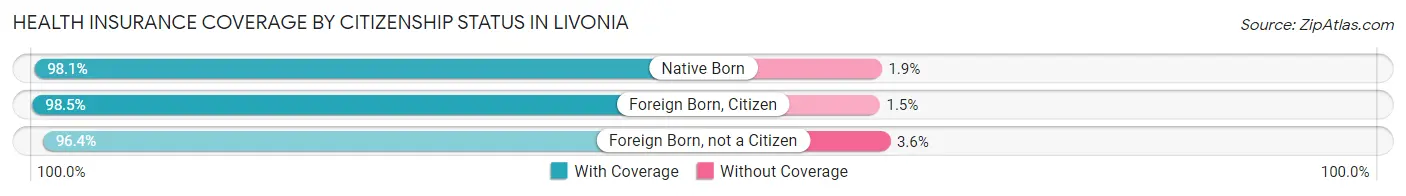
| Citizenship Status | With Coverage | Without Coverage |
| Native Born | 5,223 (98.1%) | 101 (1.9%) |
| Foreign Born, Citizen | 12,442 (98.5%) | 192 (1.5%) |
| Foreign Born, not a Citizen | 7,232 (96.4%) | 268 (3.6%) |
Health Insurance Coverage by Household Income in Livonia
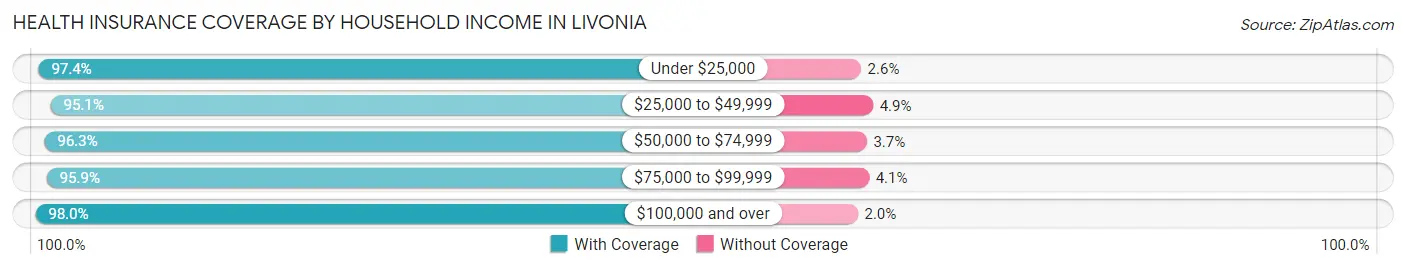
| Household Income | With Coverage | Without Coverage |
| Under $25,000 | 4,050 (97.4%) | 108 (2.6%) |
| $25,000 to $49,999 | 9,649 (95.1%) | 493 (4.9%) |
| $50,000 to $74,999 | 12,161 (96.3%) | 466 (3.7%) |
| $75,000 to $99,999 | 14,060 (95.9%) | 602 (4.1%) |
| $100,000 and over | 50,808 (98.0%) | 1,042 (2.0%) |
Public vs Private Health Insurance Coverage by Age in Livonia
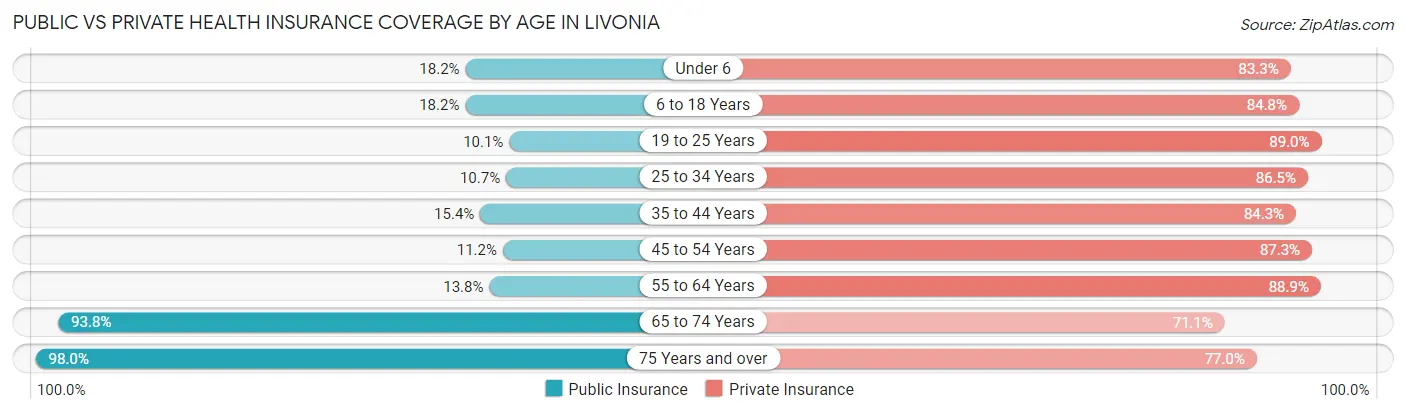
| Age Bracket | Public Insurance | Private Insurance |
| Under 6 | 968 (18.2%) | 4,435 (83.3%) |
| 6 to 18 Years | 2,301 (18.2%) | 10,717 (84.8%) |
| 19 to 25 Years | 754 (10.1%) | 6,676 (89.0%) |
| 25 to 34 Years | 1,207 (10.6%) | 9,806 (86.5%) |
| 35 to 44 Years | 1,622 (15.4%) | 8,855 (84.3%) |
| 45 to 54 Years | 1,325 (11.2%) | 10,286 (87.3%) |
| 55 to 64 Years | 2,063 (13.8%) | 13,342 (88.9%) |
| 65 to 74 Years | 10,618 (93.8%) | 8,048 (71.1%) |
| 75 Years and over | 8,411 (98.0%) | 6,612 (77.0%) |
| Total | 29,269 (31.1%) | 78,777 (83.8%) |
Disability Status by Sex by Age in Livonia
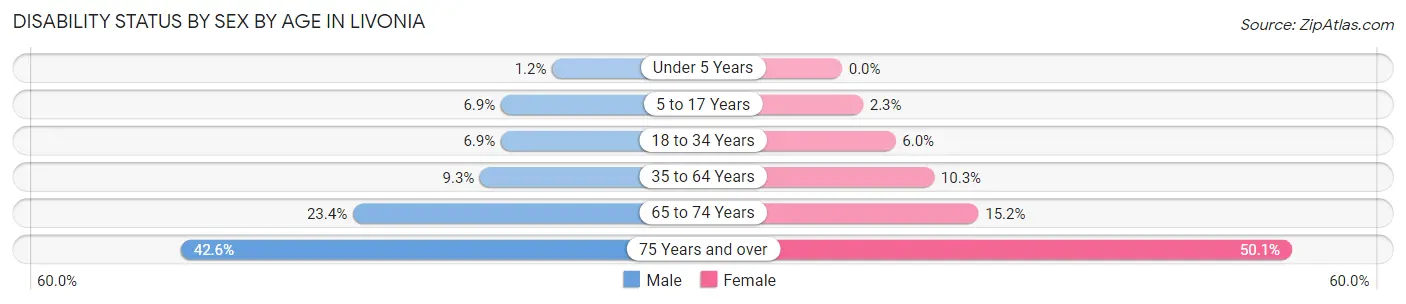
| Age Bracket | Male | Female |
| Under 5 Years | 29 (1.2%) | 0 (0.0%) |
| 5 to 17 Years | 431 (6.9%) | 151 (2.3%) |
| 18 to 34 Years | 680 (6.9%) | 580 (6.0%) |
| 35 to 64 Years | 1,755 (9.3%) | 1,883 (10.3%) |
| 65 to 74 Years | 1,309 (23.4%) | 872 (15.2%) |
| 75 Years and over | 1,535 (42.6%) | 2,498 (50.1%) |
Disability Class by Sex by Age in Livonia
Disability Class: Hearing Difficulty
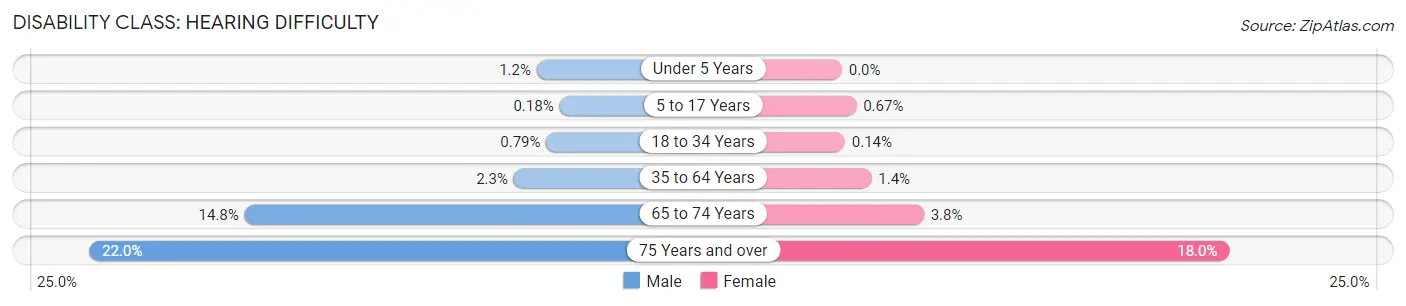
| Age Bracket | Male | Female |
| Under 5 Years | 29 (1.2%) | 0 (0.0%) |
| 5 to 17 Years | 11 (0.2%) | 43 (0.7%) |
| 18 to 34 Years | 77 (0.8%) | 14 (0.1%) |
| 35 to 64 Years | 436 (2.3%) | 252 (1.4%) |
| 65 to 74 Years | 826 (14.8%) | 218 (3.8%) |
| 75 Years and over | 793 (22.0%) | 896 (18.0%) |
Disability Class: Vision Difficulty
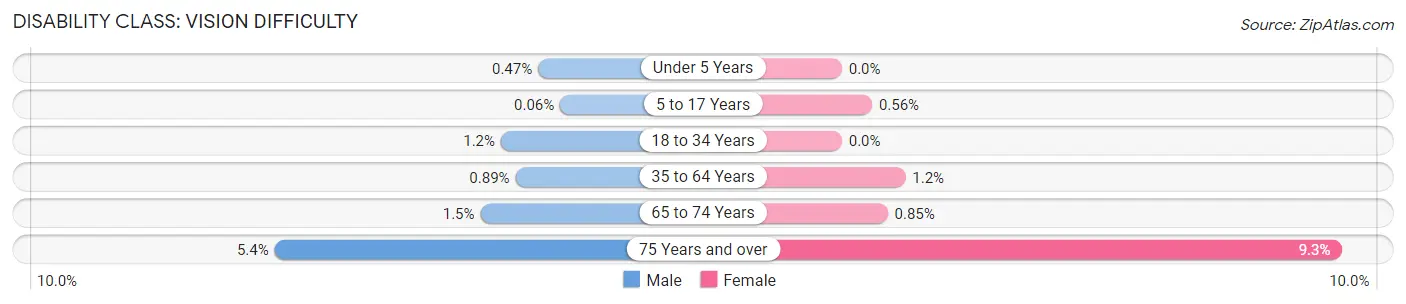
| Age Bracket | Male | Female |
| Under 5 Years | 11 (0.5%) | 0 (0.0%) |
| 5 to 17 Years | 4 (0.1%) | 36 (0.6%) |
| 18 to 34 Years | 114 (1.2%) | 0 (0.0%) |
| 35 to 64 Years | 168 (0.9%) | 216 (1.2%) |
| 65 to 74 Years | 86 (1.5%) | 49 (0.9%) |
| 75 Years and over | 193 (5.4%) | 463 (9.3%) |
Disability Class: Cognitive Difficulty
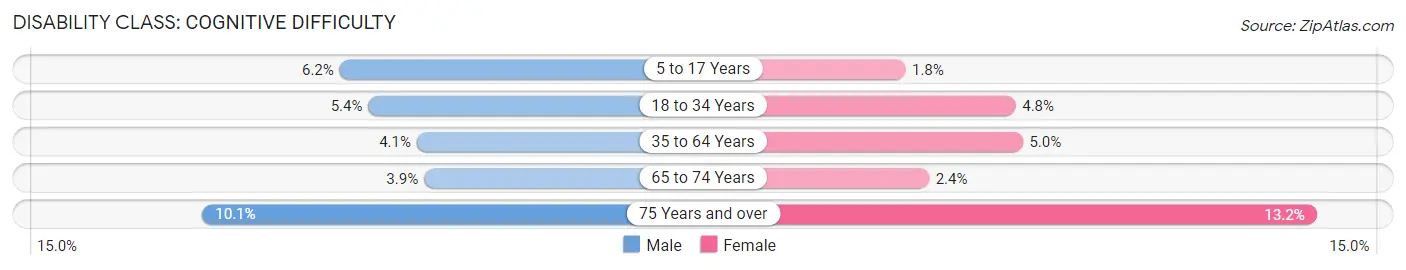
| Age Bracket | Male | Female |
| 5 to 17 Years | 387 (6.2%) | 114 (1.8%) |
| 18 to 34 Years | 532 (5.4%) | 470 (4.8%) |
| 35 to 64 Years | 773 (4.1%) | 923 (5.0%) |
| 65 to 74 Years | 217 (3.9%) | 139 (2.4%) |
| 75 Years and over | 362 (10.1%) | 659 (13.2%) |
Disability Class: Ambulatory Difficulty
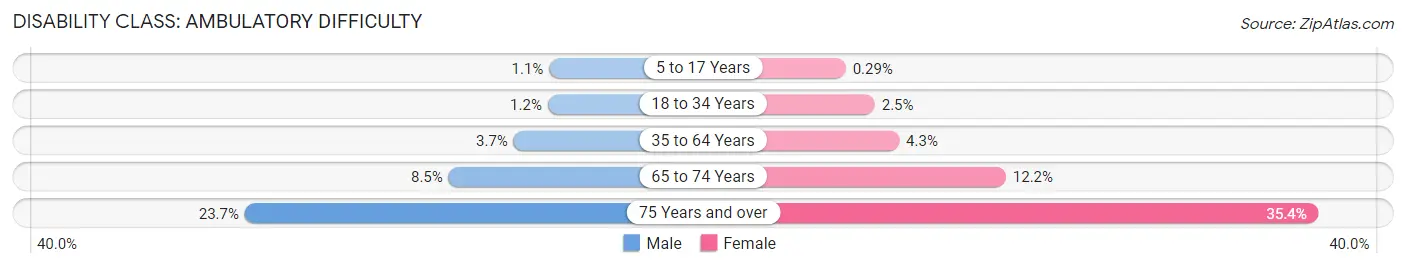
| Age Bracket | Male | Female |
| 5 to 17 Years | 65 (1.1%) | 19 (0.3%) |
| 18 to 34 Years | 114 (1.2%) | 238 (2.5%) |
| 35 to 64 Years | 699 (3.7%) | 782 (4.3%) |
| 65 to 74 Years | 476 (8.5%) | 699 (12.2%) |
| 75 Years and over | 852 (23.6%) | 1,764 (35.4%) |
Disability Class: Self-Care Difficulty
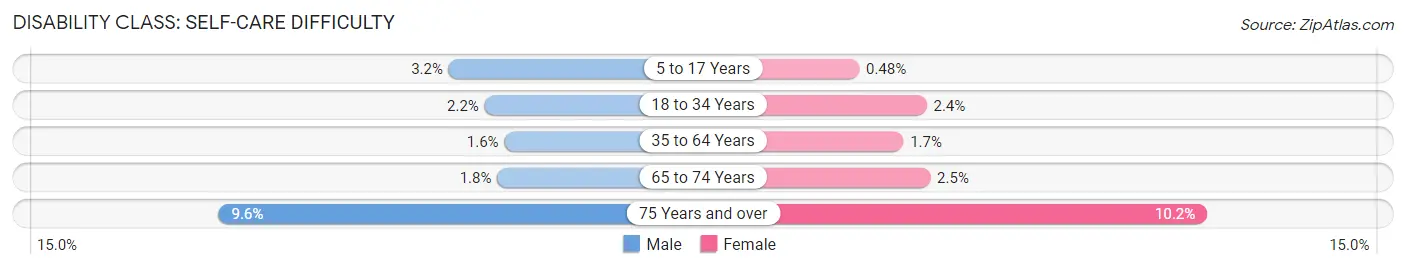
| Age Bracket | Male | Female |
| 5 to 17 Years | 198 (3.2%) | 31 (0.5%) |
| 18 to 34 Years | 215 (2.2%) | 230 (2.4%) |
| 35 to 64 Years | 311 (1.6%) | 313 (1.7%) |
| 65 to 74 Years | 103 (1.8%) | 141 (2.5%) |
| 75 Years and over | 346 (9.6%) | 507 (10.2%) |
Technology Access in Livonia
Computing Device Access in Livonia
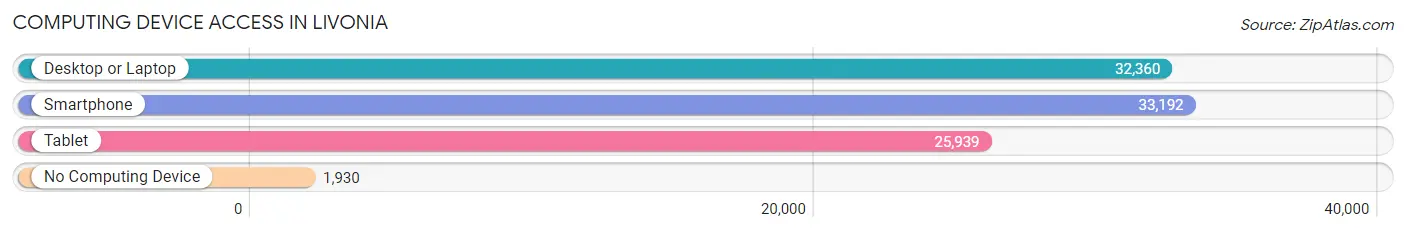
| Device Type | # Households | % Households |
| Desktop or Laptop | 32,360 | 85.6% |
| Smartphone | 33,192 | 87.8% |
| Tablet | 25,939 | 68.6% |
| No Computing Device | 1,930 | 5.1% |
| Total | 37,789 | 100.0% |
Internet Access in Livonia
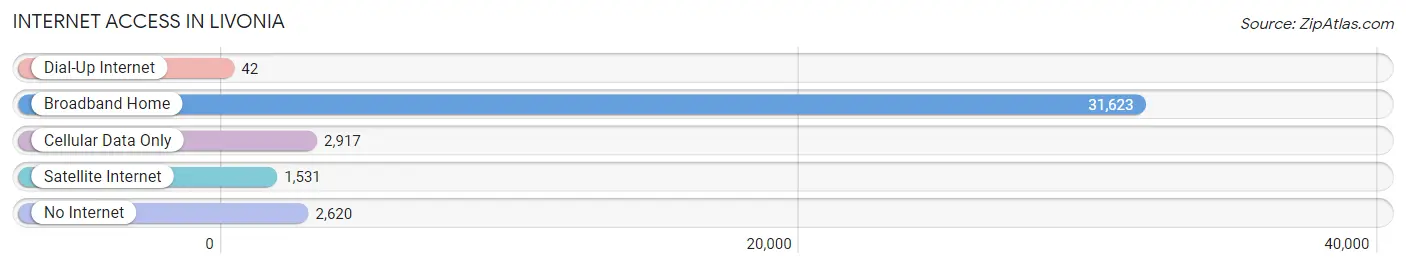
| Internet Type | # Households | % Households |
| Dial-Up Internet | 42 | 0.1% |
| Broadband Home | 31,623 | 83.7% |
| Cellular Data Only | 2,917 | 7.7% |
| Satellite Internet | 1,531 | 4.1% |
| No Internet | 2,620 | 6.9% |
| Total | 37,789 | 100.0% |
Livonia Summary
Livonia is a city located in the western part of Wayne County, Michigan, United States. It is a suburb of Detroit and is part of the Metro Detroit area. As of the 2010 census, the city had a total population of 96,942, making it Michigan's ninth largest municipality. The city is the largest in the county and the second largest in the Metro Detroit area.
History
Livonia was first settled in 1835 by George and William Dibble, two brothers from New York. The brothers purchased land in the area and began farming. The area was known as Dibbleville until 1837 when the name was changed to Livonia. The name was chosen in honor of the city of Livonia in New York, which was the hometown of the Dibble brothers.
In the late 19th century, the area began to grow rapidly as Detroit's population increased. The city was incorporated in 1950 and has since grown to become one of the largest cities in Michigan.
Geography
Livonia is located in western Wayne County, Michigan. It is bordered by the cities of Redford Township to the north, Farmington Hills to the east, Northville to the south, and Plymouth Township to the west. The city is located approximately 20 miles (32 km) west of downtown Detroit.
The city has a total area of 36.2 square miles (93.8 km2), of which 35.9 square miles (93.1 km2) is land and 0.3 square miles (0.7 km2) is water.
Economy
Livonia is home to a variety of businesses and industries. The city is home to several large employers, including Ford Motor Company, St. John Providence Health System, and the Livonia Public Schools. The city is also home to several smaller businesses, including restaurants, retail stores, and professional services.
The city's economy is largely driven by the automotive industry. Ford Motor Company has a large presence in the city, with several plants and offices located in Livonia. The city is also home to several automotive suppliers, including Delphi Automotive and Lear Corporation.
Demographics
As of the 2010 census, there were 96,942 people, 38,845 households, and 25,945 families residing in the city. The population density was 2,711.2 people per square mile (1,045.2/km2). There were 40,845 housing units at an average density of 1,139.3 per square mile (439.2/km2). The racial makeup of the city was 87.2% White, 6.3% African American, 0.3% Native American, 3.2% Asian, 0.7% from other races, and 2.4% from two or more races. Hispanic or Latino of any race were 2.7% of the population.
The median income for a household in the city was $60,945, and the median income for a family was $76,945. Males had a median income of $51,945 versus $37,945 for females. The per capita income for the city was $29,945. About 3.2% of families and 4.9% of the population were below the poverty line, including 5.3% of those under age 18 and 4.2% of those age 65 or over.
Common Questions
What is Per Capita Income in Livonia?
Per Capita income in Livonia is $44,853.
What is the Median Family Income in Livonia?
Median Family Income in Livonia is $112,225.
What is the Median Household income in Livonia?
Median Household Income in Livonia is $92,458.
What is Income or Wage Gap in Livonia?
Income or Wage Gap in Livonia is 33.7%.
Women in Livonia earn 66.3 cents for every dollar earned by a man.
What is Family Income Deficit in Livonia?
Family Income Deficit in Livonia is $8,618.
Families that are below poverty line in Livonia earn $8,618 less on average than the poverty threshold level.
What is Inequality or Gini Index in Livonia?
Inequality or Gini Index in Livonia is 0.38.
What is the Total Population of Livonia?
Total Population of Livonia is 94,928.
What is the Total Male Population of Livonia?
Total Male Population of Livonia is 46,905.
What is the Total Female Population of Livonia?
Total Female Population of Livonia is 48,023.
What is the Ratio of Males per 100 Females in Livonia?
There are 97.67 Males per 100 Females in Livonia.
What is the Ratio of Females per 100 Males in Livonia?
There are 102.38 Females per 100 Males in Livonia.
What is the Median Population Age in Livonia?
Median Population Age in Livonia is 45.2 Years.
What is the Average Family Size in Livonia
Average Family Size in Livonia is 3.0 People.
What is the Average Household Size in Livonia
Average Household Size in Livonia is 2.5 People.
How Large is the Labor Force in Livonia?
There are 50,559 People in the Labor Forcein in Livonia.
What is the Percentage of People in the Labor Force in Livonia?
63.4% of People are in the Labor Force in Livonia.
What is the Unemployment Rate in Livonia?
Unemployment Rate in Livonia is 5.0%.