Lake Michigan Beach, MI Map & Demographics
Lake Michigan Beach Map
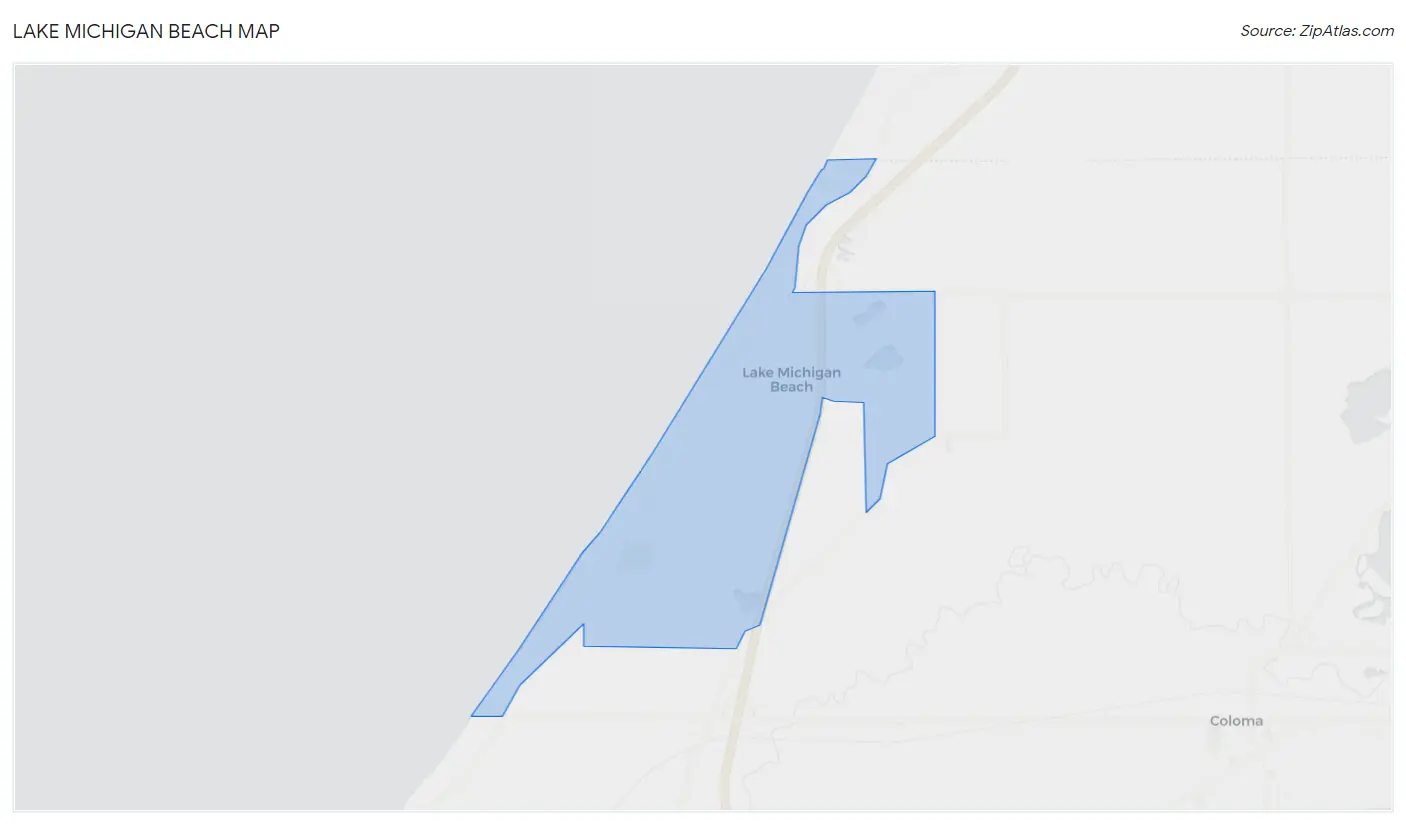
Lake Michigan Beach Overview
$67,609
PER CAPITA INCOME
$81,955
AVG FAMILY INCOME
$81,023
AVG HOUSEHOLD INCOME
24.8%
WAGE / INCOME GAP [ % ]
75.2¢/ $1
WAGE / INCOME GAP [ $ ]
0.57
INEQUALITY / GINI INDEX
918
TOTAL POPULATION
501
MALE POPULATION
417
FEMALE POPULATION
120.14
MALES / 100 FEMALES
83.23
FEMALES / 100 MALES
49.1
MEDIAN AGE
2.7
AVG FAMILY SIZE
2.0
AVG HOUSEHOLD SIZE
488
LABOR FORCE [ PEOPLE ]
59.9%
PERCENT IN LABOR FORCE
Income in Lake Michigan Beach
Income Overview in Lake Michigan Beach
Per Capita Income in Lake Michigan Beach is $67,609, while median incomes of families and households are $81,955 and $81,023 respectively.
| Characteristic | Number | Measure |
| Per Capita Income | 918 | $67,609 |
| Median Family Income | 266 | $81,955 |
| Mean Family Income | 266 | $181,588 |
| Median Household Income | 451 | $81,023 |
| Mean Household Income | 451 | $135,157 |
| Income Deficit | 266 | $0 |
| Wage / Income Gap (%) | 918 | 24.80% |
| Wage / Income Gap ($) | 918 | 75.20¢ per $1 |
| Gini / Inequality Index | 918 | 0.57 |
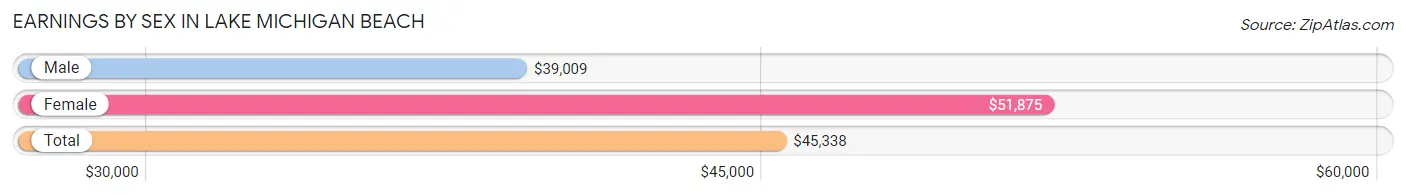
Earnings by Sex in Lake Michigan Beach
Average Earnings in Lake Michigan Beach are $45,338, $39,009 for men and $51,875 for women, a difference of 24.8%.
| Sex | Number | Average Earnings |
| Male | 305 (59.3%) | $39,009 |
| Female | 209 (40.7%) | $51,875 |
| Total | 514 (100.0%) | $45,338 |
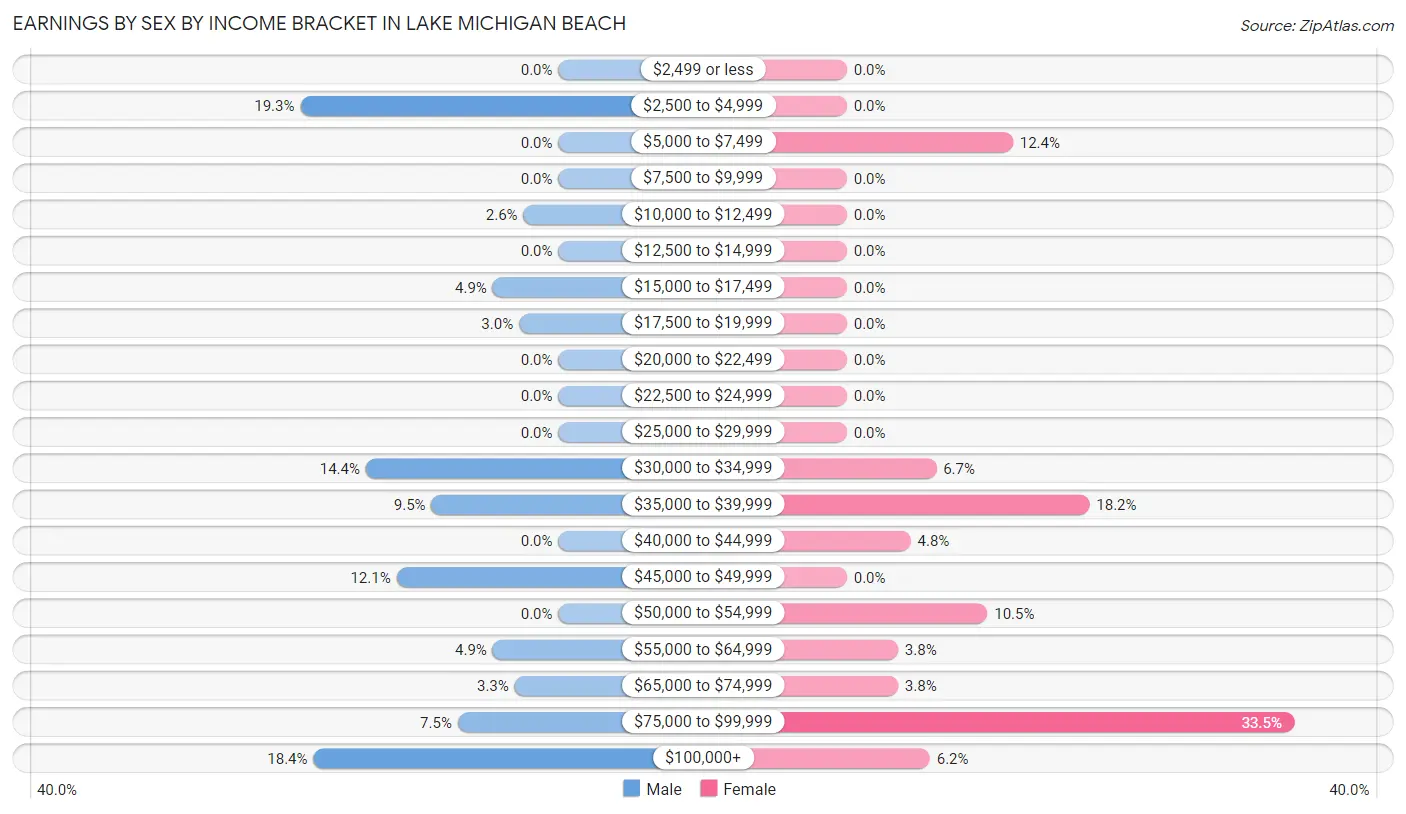
Earnings by Sex by Income Bracket in Lake Michigan Beach
The most common earnings brackets in Lake Michigan Beach are $2,500 to $4,999 for men (59 | 19.3%) and $75,000 to $99,999 for women (70 | 33.5%).
| Income | Male | Female |
| $2,499 or less | 0 (0.0%) | 0 (0.0%) |
| $2,500 to $4,999 | 59 (19.3%) | 0 (0.0%) |
| $5,000 to $7,499 | 0 (0.0%) | 26 (12.4%) |
| $7,500 to $9,999 | 0 (0.0%) | 0 (0.0%) |
| $10,000 to $12,499 | 8 (2.6%) | 0 (0.0%) |
| $12,500 to $14,999 | 0 (0.0%) | 0 (0.0%) |
| $15,000 to $17,499 | 15 (4.9%) | 0 (0.0%) |
| $17,500 to $19,999 | 9 (2.9%) | 0 (0.0%) |
| $20,000 to $22,499 | 0 (0.0%) | 0 (0.0%) |
| $22,500 to $24,999 | 0 (0.0%) | 0 (0.0%) |
| $25,000 to $29,999 | 0 (0.0%) | 0 (0.0%) |
| $30,000 to $34,999 | 44 (14.4%) | 14 (6.7%) |
| $35,000 to $39,999 | 29 (9.5%) | 38 (18.2%) |
| $40,000 to $44,999 | 0 (0.0%) | 10 (4.8%) |
| $45,000 to $49,999 | 37 (12.1%) | 0 (0.0%) |
| $50,000 to $54,999 | 0 (0.0%) | 22 (10.5%) |
| $55,000 to $64,999 | 15 (4.9%) | 8 (3.8%) |
| $65,000 to $74,999 | 10 (3.3%) | 8 (3.8%) |
| $75,000 to $99,999 | 23 (7.5%) | 70 (33.5%) |
| $100,000+ | 56 (18.4%) | 13 (6.2%) |
| Total | 305 (100.0%) | 209 (100.0%) |
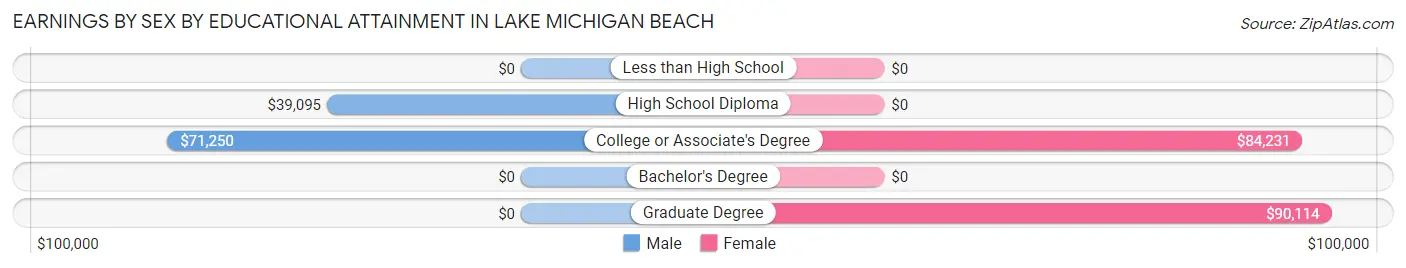
Earnings by Sex by Educational Attainment in Lake Michigan Beach
Average earnings in Lake Michigan Beach are $46,723 for men and $51,875 for women, a difference of 9.9%. Men with an educational attainment of college or associate's degree enjoy the highest average annual earnings of $71,250, while those with high school diploma education earn the least with $39,095. Women with an educational attainment of graduate degree earn the most with the average annual earnings of $90,114, while those with college or associate's degree education have the smallest earnings of $84,231.
| Educational Attainment | Male Income | Female Income |
| Less than High School | - | - |
| High School Diploma | $39,095 | $0 |
| College or Associate's Degree | $71,250 | $84,231 |
| Bachelor's Degree | - | - |
| Graduate Degree | - | - |
| Total | $46,723 | $51,875 |
Family Income in Lake Michigan Beach
Family Income Brackets in Lake Michigan Beach
According to the Lake Michigan Beach family income data, there are 77 families falling into the $75,000 to $99,999 income range, which is the most common income bracket and makes up 28.9% of all families.
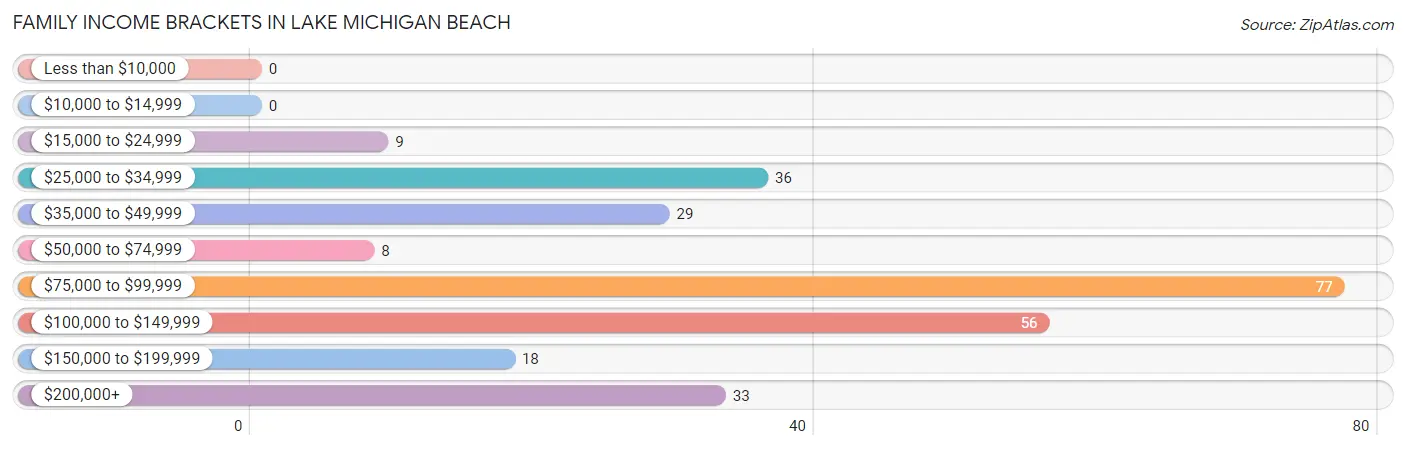
| Income Bracket | # Families | % Families |
| Less than $10,000 | 0 | 0.0% |
| $10,000 to $14,999 | 0 | 0.0% |
| $15,000 to $24,999 | 9 | 3.4% |
| $25,000 to $34,999 | 36 | 13.5% |
| $35,000 to $49,999 | 29 | 10.9% |
| $50,000 to $74,999 | 8 | 3.0% |
| $75,000 to $99,999 | 77 | 28.9% |
| $100,000 to $149,999 | 56 | 21.1% |
| $150,000 to $199,999 | 18 | 6.8% |
| $200,000+ | 33 | 12.4% |
Family Income by Famaliy Size in Lake Michigan Beach
3-person families (82 | 30.8%) account for the highest median family income in Lake Michigan Beach with $110,556 per family, while 3-person families (82 | 30.8%) have the highest median income of $36,852 per family member.
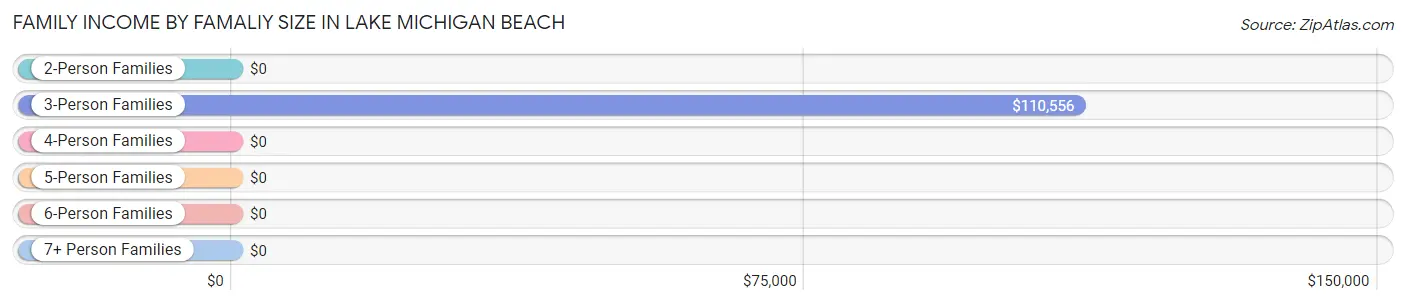
| Income Bracket | # Families | Median Income |
| 2-Person Families | 147 (55.3%) | $0 |
| 3-Person Families | 82 (30.8%) | $110,556 |
| 4-Person Families | 10 (3.8%) | $0 |
| 5-Person Families | 27 (10.2%) | $0 |
| 6-Person Families | 0 (0.0%) | $0 |
| 7+ Person Families | 0 (0.0%) | $0 |
| Total | 266 (100.0%) | $81,955 |
Family Income by Number of Earners in Lake Michigan Beach
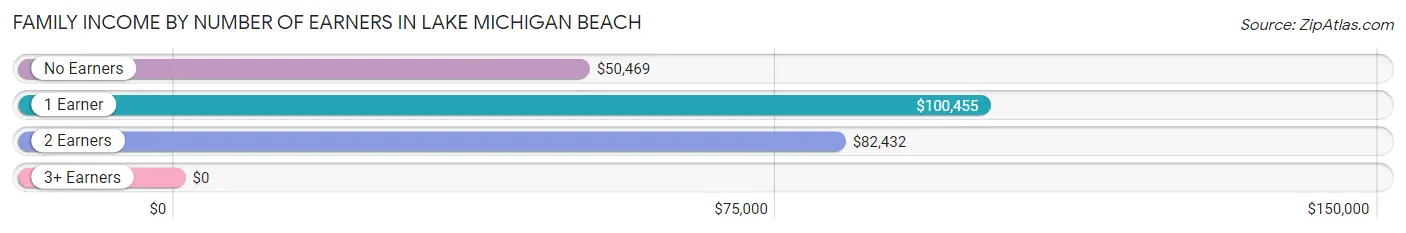
| Number of Earners | # Families | Median Income |
| No Earners | 41 (15.4%) | $50,469 |
| 1 Earner | 72 (27.1%) | $100,455 |
| 2 Earners | 130 (48.9%) | $82,432 |
| 3+ Earners | 23 (8.6%) | $0 |
| Total | 266 (100.0%) | $81,955 |
Household Income in Lake Michigan Beach
Household Income Brackets in Lake Michigan Beach
With 118 households falling in the category, the $75,000 to $99,999 income range is the most frequent in Lake Michigan Beach, accounting for 26.2% of all households.
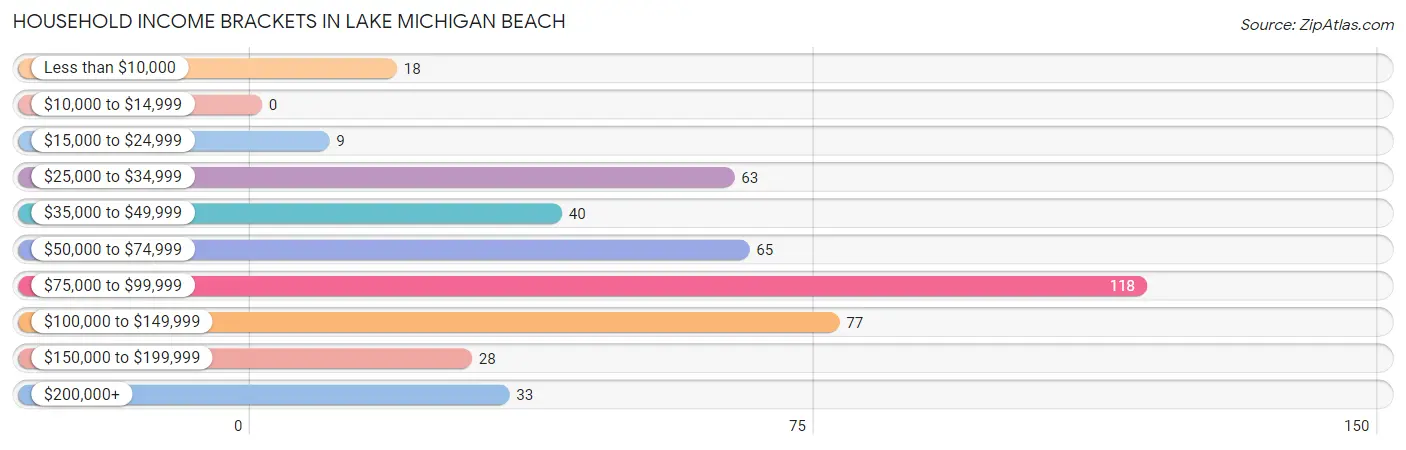
| Income Bracket | # Households | % Households |
| Less than $10,000 | 18 | 4.0% |
| $10,000 to $14,999 | 0 | 0.0% |
| $15,000 to $24,999 | 9 | 2.0% |
| $25,000 to $34,999 | 63 | 14.0% |
| $35,000 to $49,999 | 40 | 8.9% |
| $50,000 to $74,999 | 65 | 14.4% |
| $75,000 to $99,999 | 118 | 26.2% |
| $100,000 to $149,999 | 77 | 17.1% |
| $150,000 to $199,999 | 28 | 6.2% |
| $200,000+ | 33 | 7.3% |
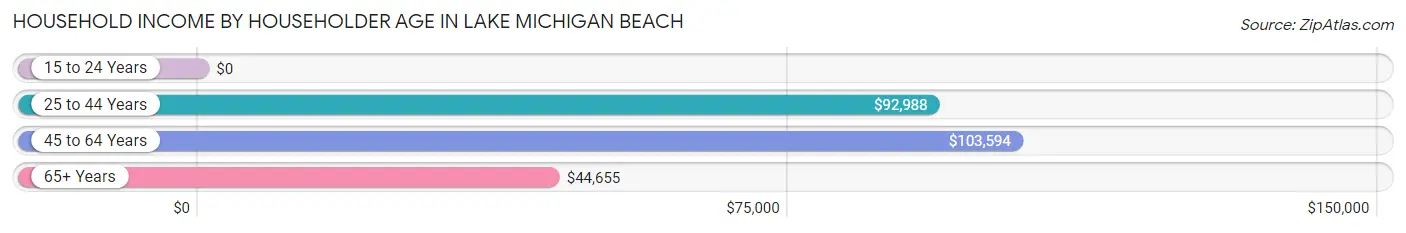
Household Income by Householder Age in Lake Michigan Beach
The median household income in Lake Michigan Beach is $81,023, with the highest median household income of $103,594 found in the 45 to 64 years age bracket for the primary householder. A total of 107 households (23.7%) fall into this category.
| Income Bracket | # Households | Median Income |
| 15 to 24 Years | 0 (0.0%) | $0 |
| 25 to 44 Years | 128 (28.4%) | $92,988 |
| 45 to 64 Years | 107 (23.7%) | $103,594 |
| 65+ Years | 216 (47.9%) | $44,655 |
| Total | 451 (100.0%) | $81,023 |
Poverty in Lake Michigan Beach
Income Below Poverty by Sex and Age in Lake Michigan Beach
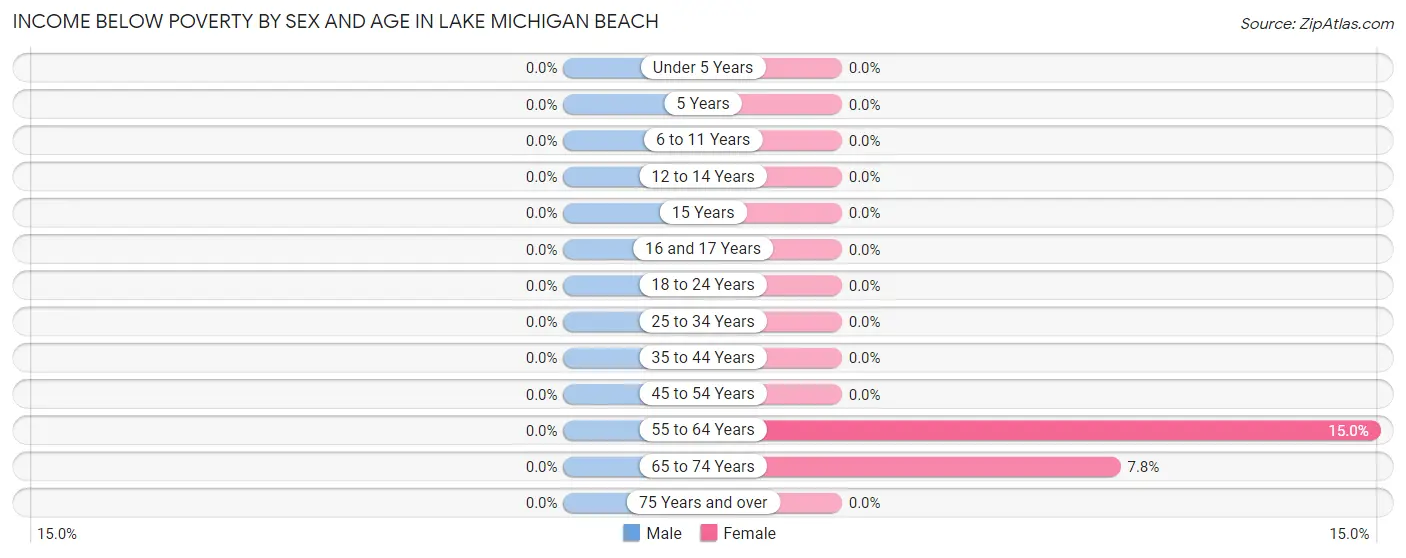
| Age Bracket | Male | Female |
| Under 5 Years | 0 (0.0%) | 0 (0.0%) |
| 5 Years | 0 (0.0%) | 0 (0.0%) |
| 6 to 11 Years | 0 (0.0%) | 0 (0.0%) |
| 12 to 14 Years | 0 (0.0%) | 0 (0.0%) |
| 15 Years | 0 (0.0%) | 0 (0.0%) |
| 16 and 17 Years | 0 (0.0%) | 0 (0.0%) |
| 18 to 24 Years | 0 (0.0%) | 0 (0.0%) |
| 25 to 34 Years | 0 (0.0%) | 0 (0.0%) |
| 35 to 44 Years | 0 (0.0%) | 0 (0.0%) |
| 45 to 54 Years | 0 (0.0%) | 0 (0.0%) |
| 55 to 64 Years | 0 (0.0%) | 9 (15.0%) |
| 65 to 74 Years | 0 (0.0%) | 9 (7.8%) |
| 75 Years and over | 0 (0.0%) | 0 (0.0%) |
| Total | 0 (0.0%) | 18 (4.3%) |
Income Above Poverty by Sex and Age in Lake Michigan Beach
According to the poverty statistics in Lake Michigan Beach, males aged 5 years and females aged under 5 years are the age groups that are most secure financially, with 100.0% of males and 100.0% of females in these age groups living above the poverty line.
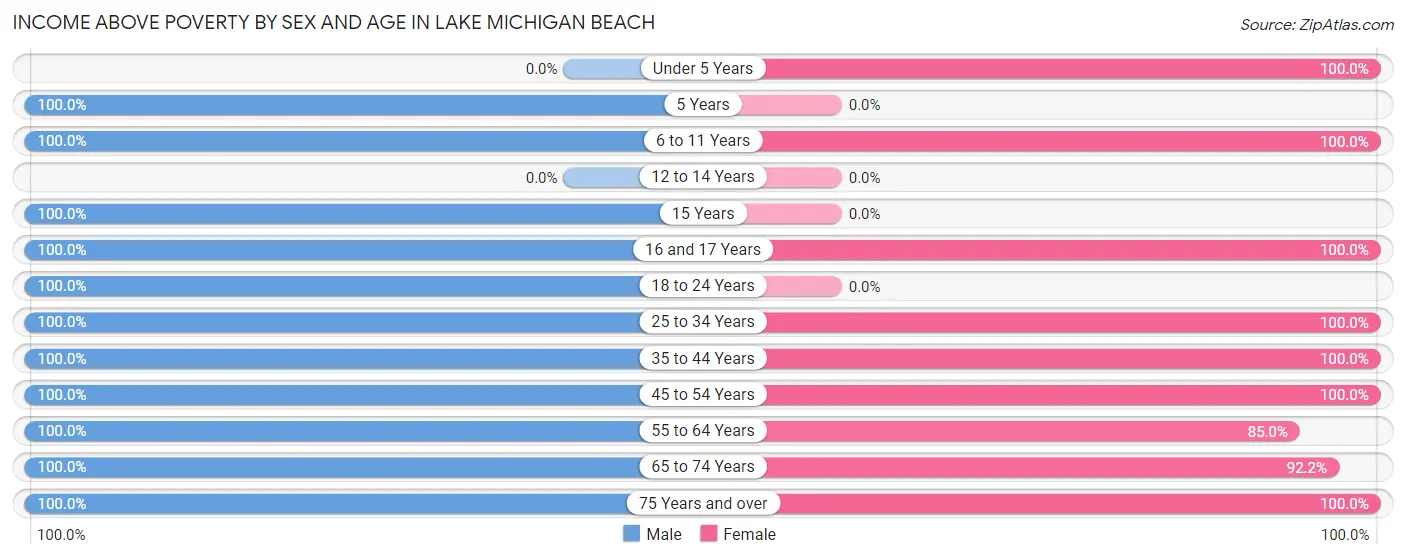
| Age Bracket | Male | Female |
| Under 5 Years | 0 (0.0%) | 37 (100.0%) |
| 5 Years | 14 (100.0%) | 0 (0.0%) |
| 6 to 11 Years | 23 (100.0%) | 19 (100.0%) |
| 12 to 14 Years | 0 (0.0%) | 0 (0.0%) |
| 15 Years | 10 (100.0%) | 0 (0.0%) |
| 16 and 17 Years | 11 (100.0%) | 13 (100.0%) |
| 18 to 24 Years | 77 (100.0%) | 0 (0.0%) |
| 25 to 34 Years | 56 (100.0%) | 38 (100.0%) |
| 35 to 44 Years | 35 (100.0%) | 72 (100.0%) |
| 45 to 54 Years | 65 (100.0%) | 54 (100.0%) |
| 55 to 64 Years | 46 (100.0%) | 51 (85.0%) |
| 65 to 74 Years | 100 (100.0%) | 107 (92.2%) |
| 75 Years and over | 64 (100.0%) | 8 (100.0%) |
| Total | 501 (100.0%) | 399 (95.7%) |
Income Below Poverty Among Married-Couple Families in Lake Michigan Beach
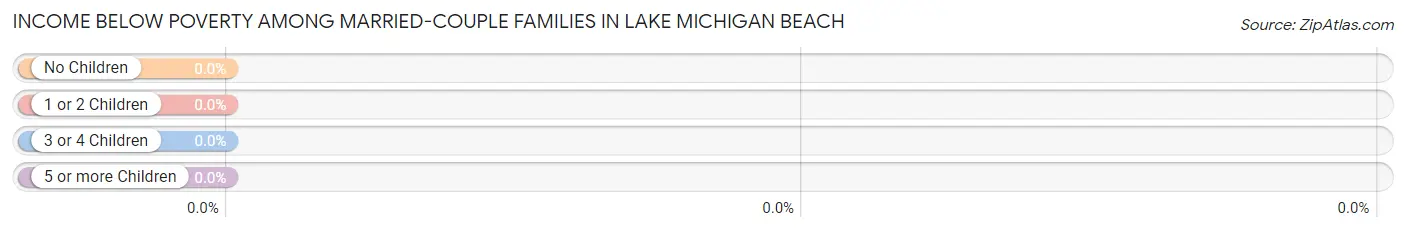
| Children | Above Poverty | Below Poverty |
| No Children | 136 (100.0%) | 0 (0.0%) |
| 1 or 2 Children | 68 (100.0%) | 0 (0.0%) |
| 3 or 4 Children | 14 (100.0%) | 0 (0.0%) |
| 5 or more Children | 0 (0.0%) | 0 (0.0%) |
| Total | 218 (100.0%) | 0 (0.0%) |
Income Below Poverty Among Single-Parent Households in Lake Michigan Beach
| Children | Single Father | Single Mother |
| No Children | 0 (0.0%) | 0 (0.0%) |
| 1 or 2 Children | 0 (0.0%) | 0 (0.0%) |
| 3 or 4 Children | 0 (0.0%) | 0 (0.0%) |
| 5 or more Children | 0 (0.0%) | 0 (0.0%) |
| Total | 0 (0.0%) | 0 (0.0%) |
Income Below Poverty Among Married-Couple vs Single-Parent Households in Lake Michigan Beach
| Children | Married-Couple Families | Single-Parent Households |
| No Children | 0 (0.0%) | 0 (0.0%) |
| 1 or 2 Children | 0 (0.0%) | 0 (0.0%) |
| 3 or 4 Children | 0 (0.0%) | 0 (0.0%) |
| 5 or more Children | 0 (0.0%) | 0 (0.0%) |
| Total | 0 (0.0%) | 0 (0.0%) |
Race in Lake Michigan Beach
The most populous races in Lake Michigan Beach are White / Caucasian (796 | 86.7%), Black / African American (80 | 8.7%), and Two or more Races (39 | 4.3%).
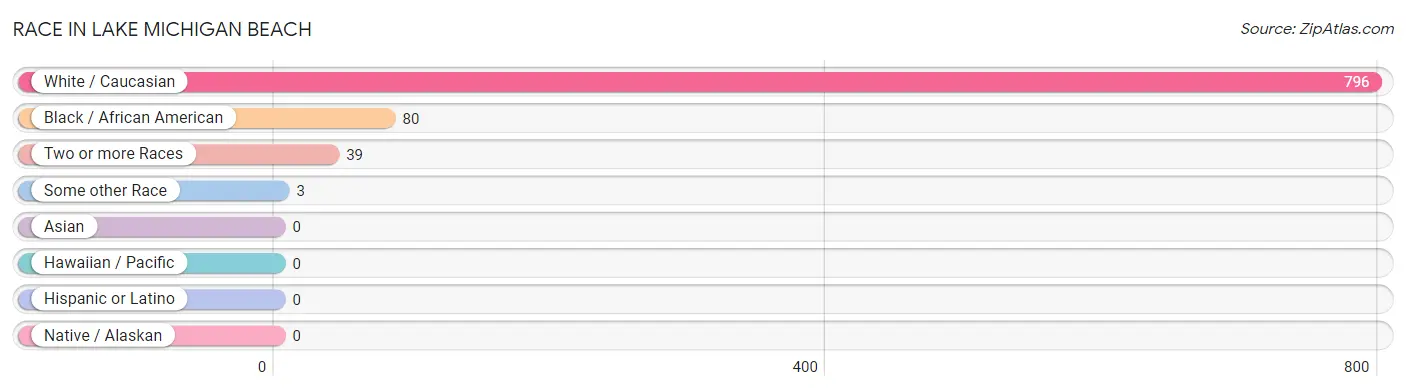
| Race | # Population | % Population |
| Asian | 0 | 0.0% |
| Black / African American | 80 | 8.7% |
| Hawaiian / Pacific | 0 | 0.0% |
| Hispanic or Latino | 0 | 0.0% |
| Native / Alaskan | 0 | 0.0% |
| White / Caucasian | 796 | 86.7% |
| Two or more Races | 39 | 4.3% |
| Some other Race | 3 | 0.3% |
| Total | 918 | 100.0% |
Ancestry in Lake Michigan Beach
The most populous ancestries reported in Lake Michigan Beach are Irish (219 | 23.9%), German (201 | 21.9%), English (191 | 20.8%), Polish (93 | 10.1%), and American (42 | 4.6%), together accounting for 81.3% of all Lake Michigan Beach residents.
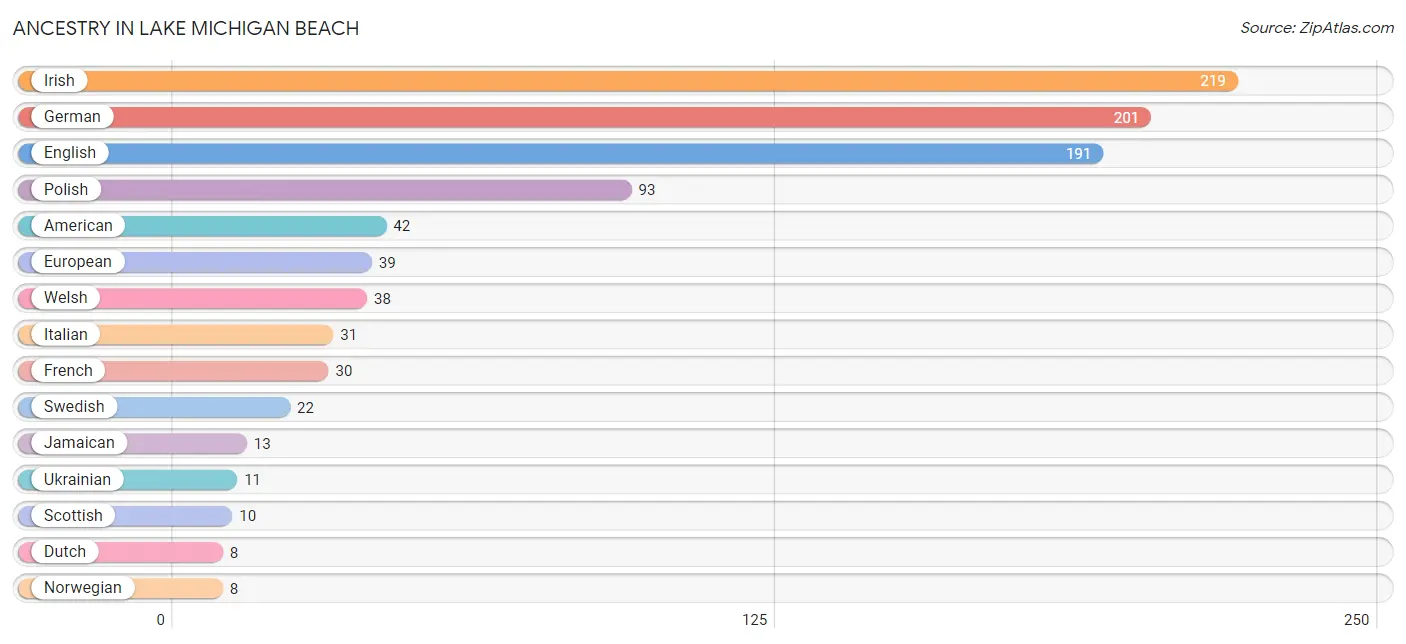
| Ancestry | # Population | % Population |
| American | 42 | 4.6% |
| Dutch | 8 | 0.9% |
| English | 191 | 20.8% |
| European | 39 | 4.3% |
| French | 30 | 3.3% |
| German | 201 | 21.9% |
| Irish | 219 | 23.9% |
| Italian | 31 | 3.4% |
| Jamaican | 13 | 1.4% |
| Norwegian | 8 | 0.9% |
| Polish | 93 | 10.1% |
| Scottish | 10 | 1.1% |
| Swedish | 22 | 2.4% |
| Ukrainian | 11 | 1.2% |
| Welsh | 38 | 4.1% | View All 15 Rows |
Immigrants in Lake Michigan Beach
The most numerous immigrant groups reported in Lake Michigan Beach came from Caribbean (13 | 1.4%), Jamaica (13 | 1.4%), and Latin America (13 | 1.4%), together accounting for 4.3% of all Lake Michigan Beach residents.
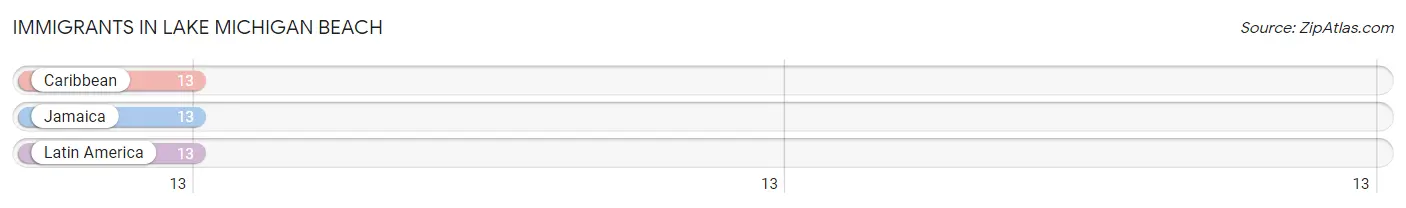
| Immigration Origin | # Population | % Population |
| Caribbean | 13 | 1.4% |
| Jamaica | 13 | 1.4% |
| Latin America | 13 | 1.4% | View All 3 Rows |
Sex and Age in Lake Michigan Beach
Sex and Age in Lake Michigan Beach
The most populous age groups in Lake Michigan Beach are 20 to 24 Years (64 | 12.8%) for men and 70 to 74 Years (90 | 21.6%) for women.
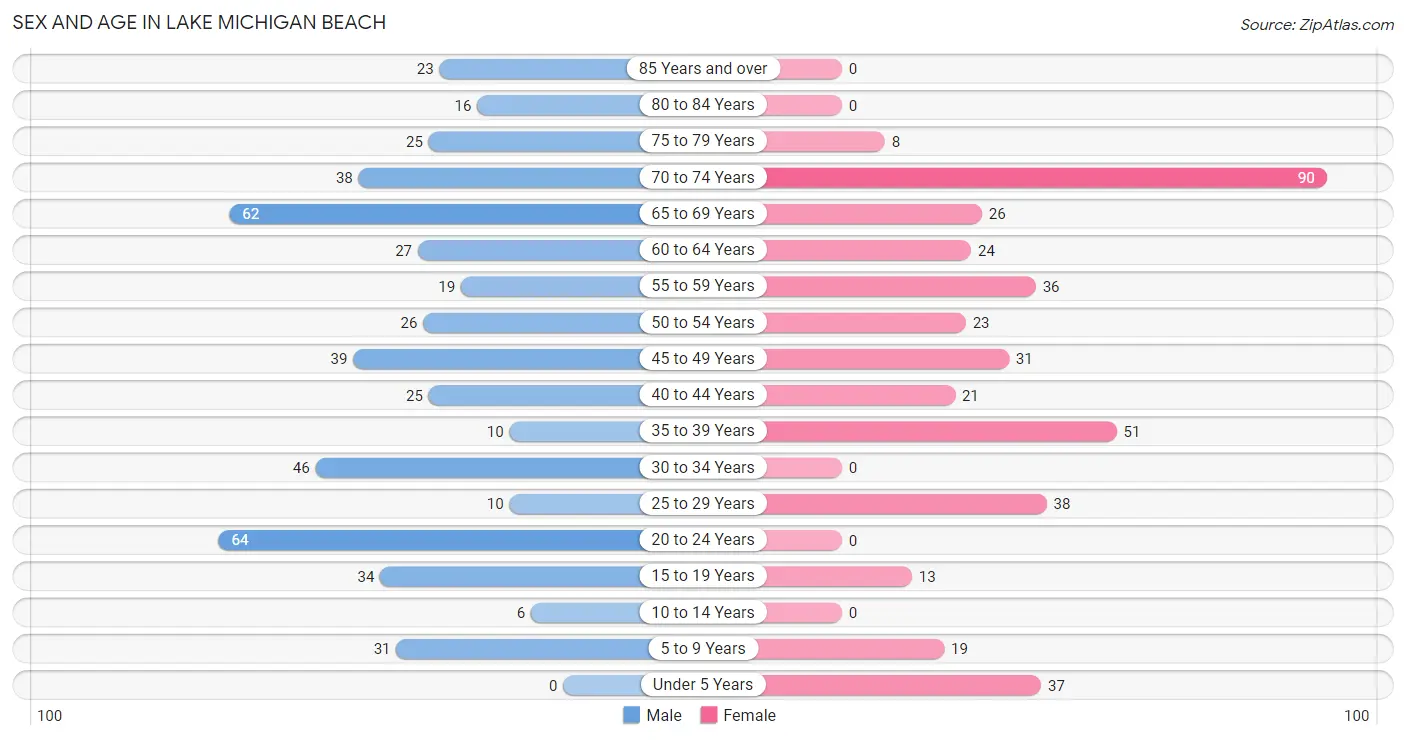
| Age Bracket | Male | Female |
| Under 5 Years | 0 (0.0%) | 37 (8.9%) |
| 5 to 9 Years | 31 (6.2%) | 19 (4.6%) |
| 10 to 14 Years | 6 (1.2%) | 0 (0.0%) |
| 15 to 19 Years | 34 (6.8%) | 13 (3.1%) |
| 20 to 24 Years | 64 (12.8%) | 0 (0.0%) |
| 25 to 29 Years | 10 (2.0%) | 38 (9.1%) |
| 30 to 34 Years | 46 (9.2%) | 0 (0.0%) |
| 35 to 39 Years | 10 (2.0%) | 51 (12.2%) |
| 40 to 44 Years | 25 (5.0%) | 21 (5.0%) |
| 45 to 49 Years | 39 (7.8%) | 31 (7.4%) |
| 50 to 54 Years | 26 (5.2%) | 23 (5.5%) |
| 55 to 59 Years | 19 (3.8%) | 36 (8.6%) |
| 60 to 64 Years | 27 (5.4%) | 24 (5.8%) |
| 65 to 69 Years | 62 (12.4%) | 26 (6.2%) |
| 70 to 74 Years | 38 (7.6%) | 90 (21.6%) |
| 75 to 79 Years | 25 (5.0%) | 8 (1.9%) |
| 80 to 84 Years | 16 (3.2%) | 0 (0.0%) |
| 85 Years and over | 23 (4.6%) | 0 (0.0%) |
| Total | 501 (100.0%) | 417 (100.0%) |
Families and Households in Lake Michigan Beach
Median Family Size in Lake Michigan Beach
The median family size in Lake Michigan Beach is 2.72 persons per family, with single female/mother families (19 | 7.1%) accounting for the largest median family size of 3.53 persons per family. On the other hand, single male/father families (29 | 10.9%) represent the smallest median family size with 2.21 persons per family.
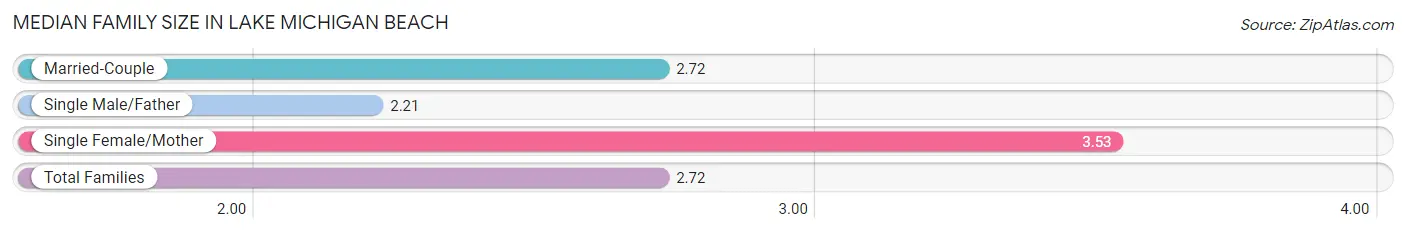
| Family Type | # Families | Family Size |
| Married-Couple | 218 (82.0%) | 2.72 |
| Single Male/Father | 29 (10.9%) | 2.21 |
| Single Female/Mother | 19 (7.1%) | 3.53 |
| Total Families | 266 (100.0%) | 2.72 |
Median Household Size in Lake Michigan Beach
The median household size in Lake Michigan Beach is 2.04 persons per household, with single female/mother households (19 | 4.2%) accounting for the largest median household size of 3.53 persons per household. non-family households (185 | 41.0%) represent the smallest median household size with 1.05 persons per household.
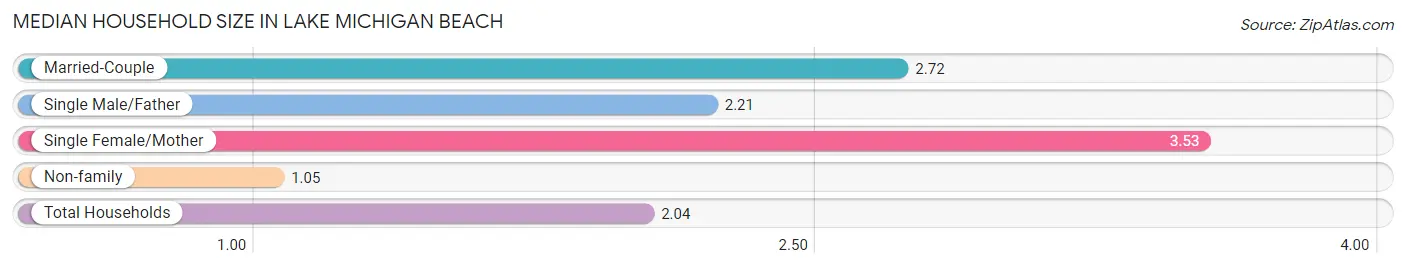
| Household Type | # Households | Household Size |
| Married-Couple | 218 (48.3%) | 2.72 |
| Single Male/Father | 29 (6.4%) | 2.21 |
| Single Female/Mother | 19 (4.2%) | 3.53 |
| Non-family | 185 (41.0%) | 1.05 |
| Total Households | 451 (100.0%) | 2.04 |
Household Size by Marriage Status in Lake Michigan Beach
Out of a total of 451 households in Lake Michigan Beach, 266 (59.0%) are family households, while 185 (41.0%) are nonfamily households. The most numerous type of family households are 2-person households, comprising 147, and the most common type of nonfamily households are 1-person households, comprising 176.
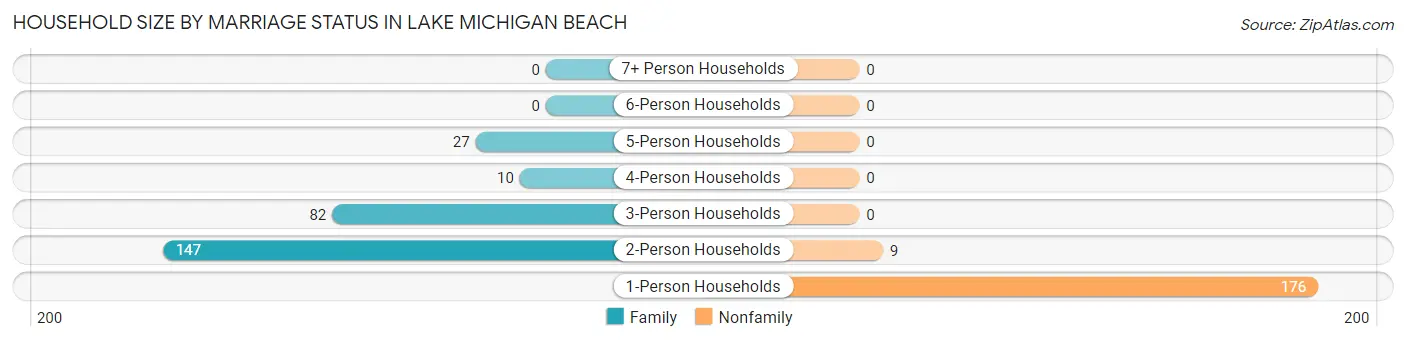
| Household Size | Family Households | Nonfamily Households |
| 1-Person Households | - | 176 (39.0%) |
| 2-Person Households | 147 (32.6%) | 9 (2.0%) |
| 3-Person Households | 82 (18.2%) | 0 (0.0%) |
| 4-Person Households | 10 (2.2%) | 0 (0.0%) |
| 5-Person Households | 27 (6.0%) | 0 (0.0%) |
| 6-Person Households | 0 (0.0%) | 0 (0.0%) |
| 7+ Person Households | 0 (0.0%) | 0 (0.0%) |
| Total | 266 (59.0%) | 185 (41.0%) |
Female Fertility in Lake Michigan Beach
Fertility by Age in Lake Michigan Beach
Average fertility rate in Lake Michigan Beach is 247.0 births per 1,000 women. Women in the age bracket of 20 to 34 years have the highest fertility rate with 1,000.0 births per 1,000 women. Women in the age bracket of 20 to 34 years acount for 100.0% of all women with births.
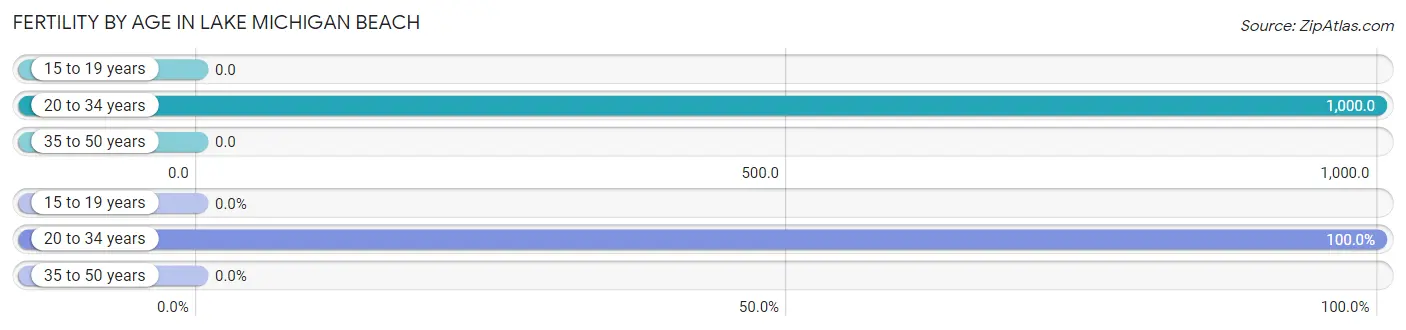
| Age Bracket | Women with Births | Births / 1,000 Women |
| 15 to 19 years | 0 (0.0%) | 0.0 |
| 20 to 34 years | 38 (100.0%) | 1,000.0 |
| 35 to 50 years | 0 (0.0%) | 0.0 |
| Total | 38 (100.0%) | 247.0 |
Fertility by Age by Marriage Status in Lake Michigan Beach
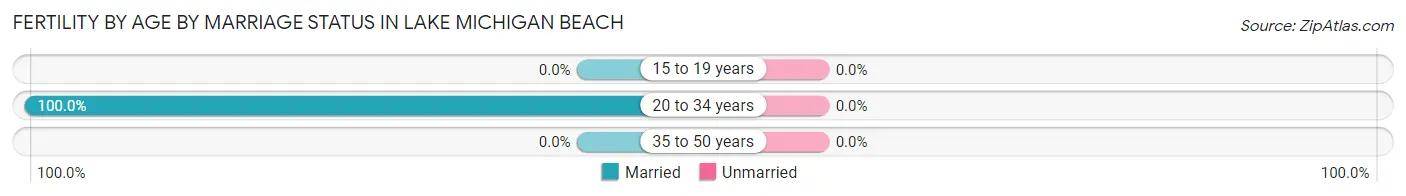
| Age Bracket | Married | Unmarried |
| 15 to 19 years | 0 (0.0%) | 0 (0.0%) |
| 20 to 34 years | 38 (100.0%) | 0 (0.0%) |
| 35 to 50 years | 0 (0.0%) | 0 (0.0%) |
| Total | 38 (100.0%) | 0 (0.0%) |
Fertility by Education in Lake Michigan Beach
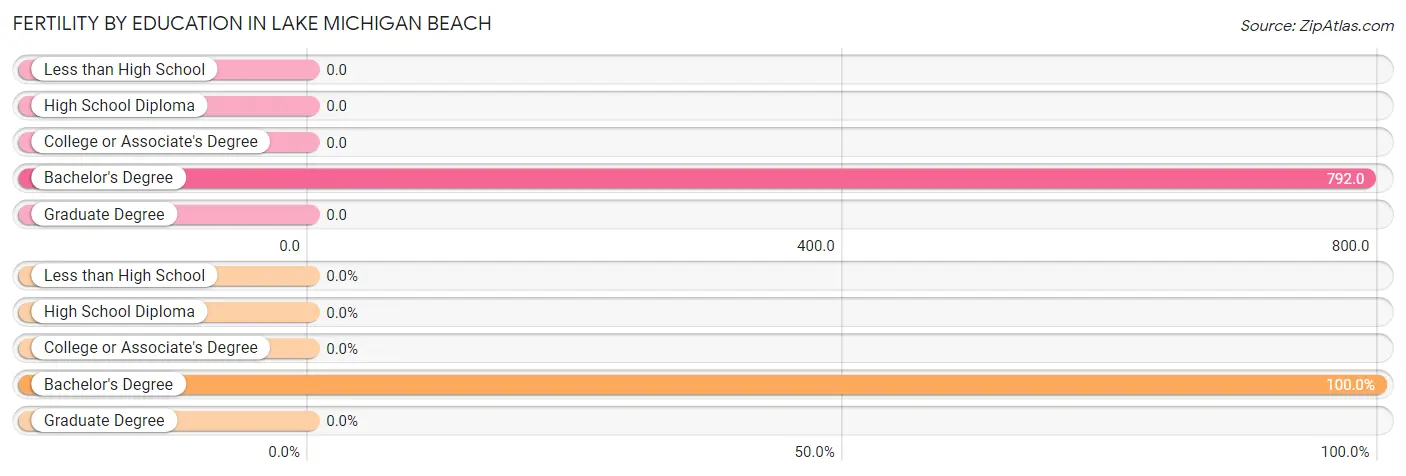
| Educational Attainment | Women with Births | Births / 1,000 Women |
| Less than High School | 0 (0.0%) | 0.0 |
| High School Diploma | 0 (0.0%) | 0.0 |
| College or Associate's Degree | 0 (0.0%) | 0.0 |
| Bachelor's Degree | 38 (100.0%) | 792.0 |
| Graduate Degree | 0 (0.0%) | 0.0 |
| Total | 38 (100.0%) | 247.0 |
Fertility by Education by Marriage Status in Lake Michigan Beach
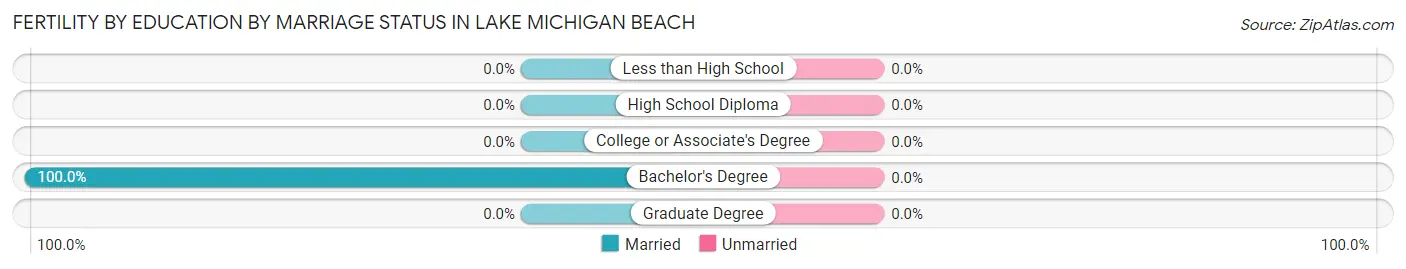
| Educational Attainment | Married | Unmarried |
| Less than High School | 0 (0.0%) | 0 (0.0%) |
| High School Diploma | 0 (0.0%) | 0 (0.0%) |
| College or Associate's Degree | 0 (0.0%) | 0 (0.0%) |
| Bachelor's Degree | 38 (100.0%) | 0 (0.0%) |
| Graduate Degree | 0 (0.0%) | 0 (0.0%) |
| Total | 38 (100.0%) | 0 (0.0%) |
Employment Characteristics in Lake Michigan Beach
Employment by Class of Employer in Lake Michigan Beach
Among the 485 employed individuals in Lake Michigan Beach, private company employees (310 | 63.9%), local government employees (54 | 11.1%), and self-employed (not incorporated) (47 | 9.7%) make up the most common classes of employment.
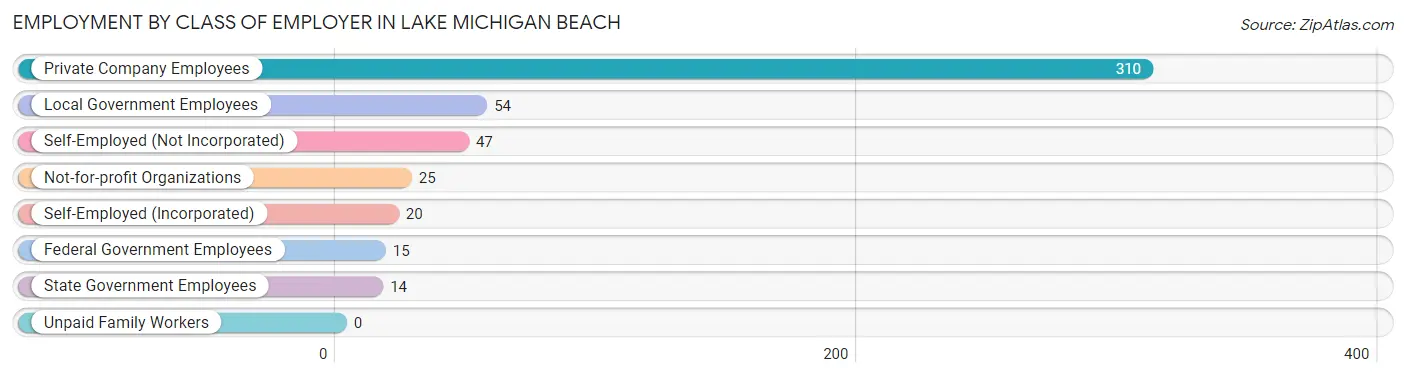
| Employer Class | # Employees | % Employees |
| Private Company Employees | 310 | 63.9% |
| Self-Employed (Incorporated) | 20 | 4.1% |
| Self-Employed (Not Incorporated) | 47 | 9.7% |
| Not-for-profit Organizations | 25 | 5.1% |
| Local Government Employees | 54 | 11.1% |
| State Government Employees | 14 | 2.9% |
| Federal Government Employees | 15 | 3.1% |
| Unpaid Family Workers | 0 | 0.0% |
| Total | 485 | 100.0% |
Employment Status by Age in Lake Michigan Beach
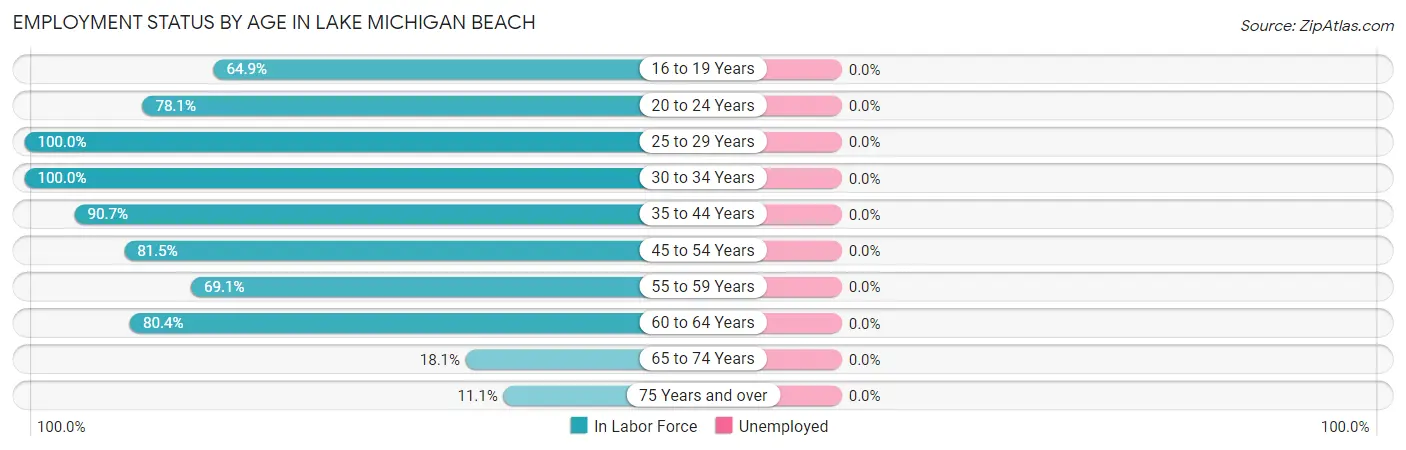
| Age Bracket | In Labor Force | Unemployed |
| 16 to 19 Years | 24 (64.9%) | 0 (0.0%) |
| 20 to 24 Years | 50 (78.1%) | 0 (0.0%) |
| 25 to 29 Years | 48 (100.0%) | 0 (0.0%) |
| 30 to 34 Years | 46 (100.0%) | 0 (0.0%) |
| 35 to 44 Years | 97 (90.7%) | 0 (0.0%) |
| 45 to 54 Years | 97 (81.5%) | 0 (0.0%) |
| 55 to 59 Years | 38 (69.1%) | 0 (0.0%) |
| 60 to 64 Years | 41 (80.4%) | 0 (0.0%) |
| 65 to 74 Years | 39 (18.1%) | 0 (0.0%) |
| 75 Years and over | 8 (11.1%) | 0 (0.0%) |
| Total | 488 (59.9%) | 0 (0.0%) |
Employment Status by Educational Attainment in Lake Michigan Beach
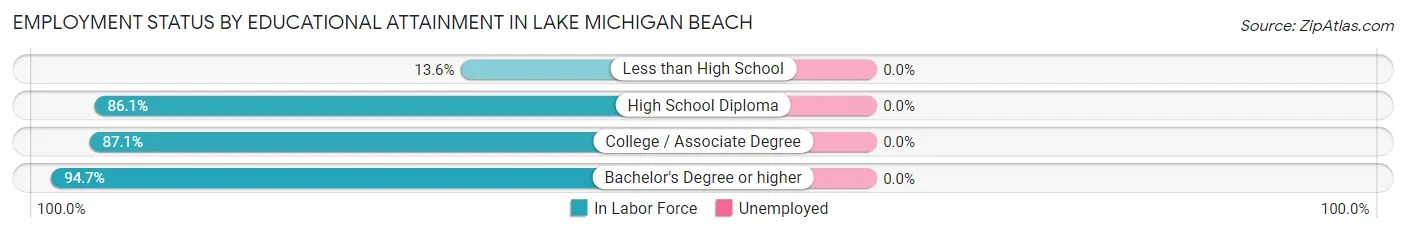
| Educational Attainment | In Labor Force | Unemployed |
| Less than High School | 3 (13.6%) | 0 (0.0%) |
| High School Diploma | 62 (86.1%) | 0 (0.0%) |
| College / Associate Degree | 142 (87.1%) | 0 (0.0%) |
| Bachelor's Degree or higher | 160 (94.7%) | 0 (0.0%) |
| Total | 367 (86.2%) | 0 (0.0%) |
Employment Occupations by Sex in Lake Michigan Beach
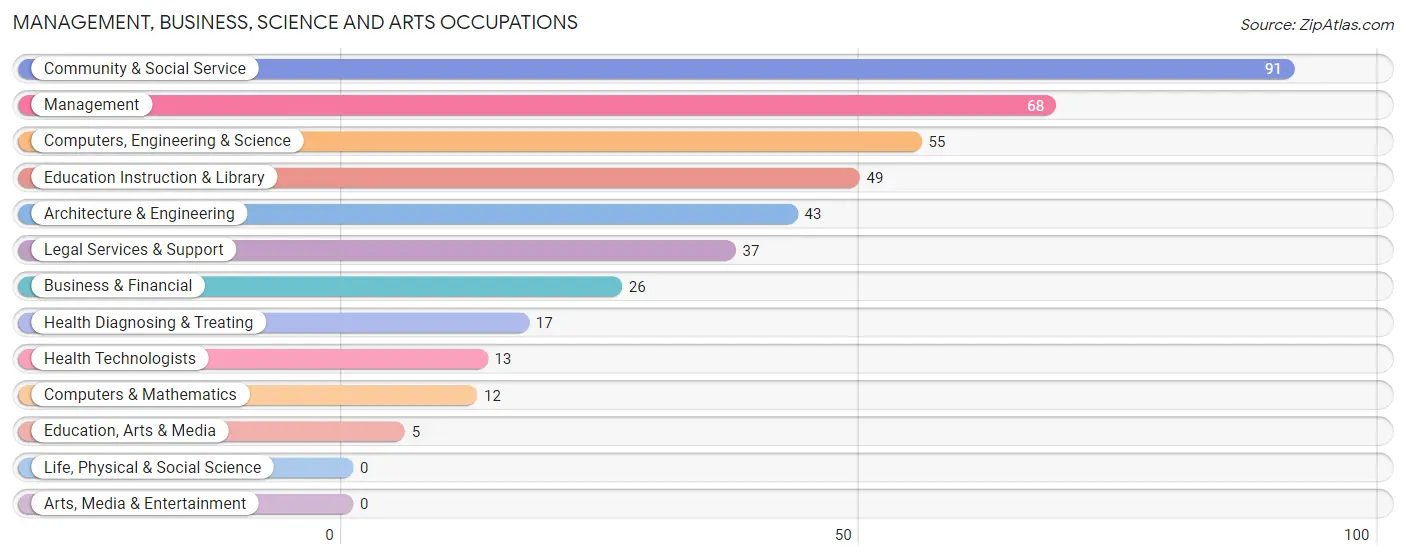
Management, Business, Science and Arts Occupations
The most common Management, Business, Science and Arts occupations in Lake Michigan Beach are Community & Social Service (91 | 18.6%), Management (68 | 13.9%), Computers, Engineering & Science (55 | 11.3%), Education Instruction & Library (49 | 10.0%), and Architecture & Engineering (43 | 8.8%).
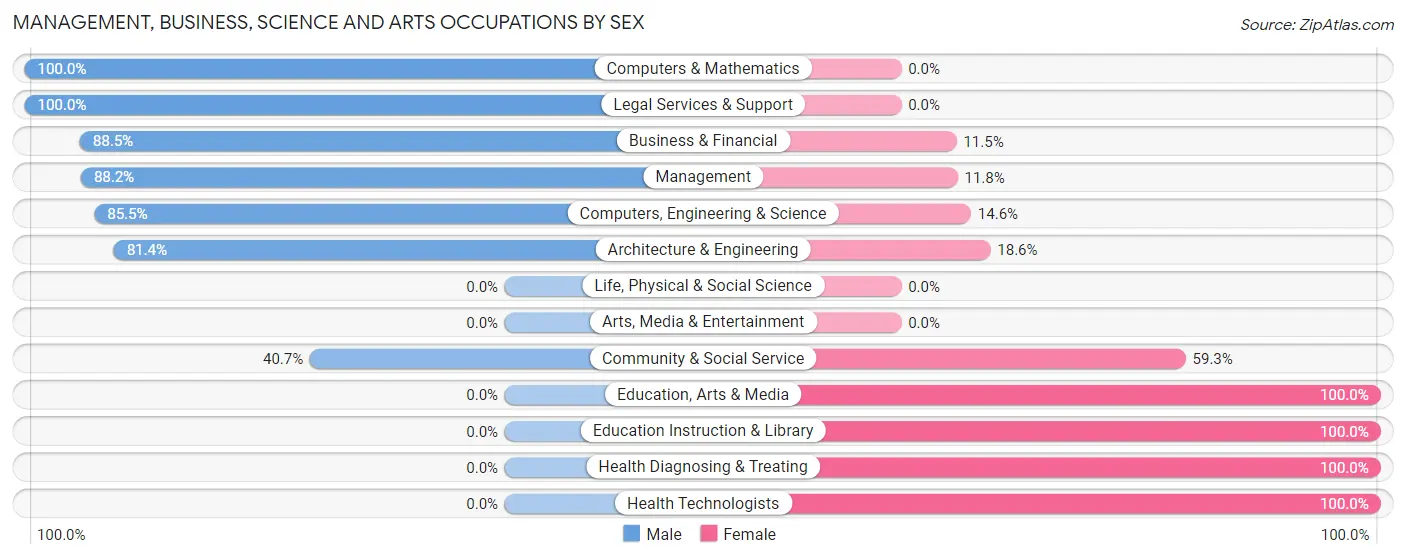
Management, Business, Science and Arts Occupations by Sex
Within the Management, Business, Science and Arts occupations in Lake Michigan Beach, the most male-oriented occupations are Computers & Mathematics (100.0%), Legal Services & Support (100.0%), and Business & Financial (88.5%), while the most female-oriented occupations are Education, Arts & Media (100.0%), Education Instruction & Library (100.0%), and Health Diagnosing & Treating (100.0%).
| Occupation | Male | Female |
| Management | 60 (88.2%) | 8 (11.8%) |
| Business & Financial | 23 (88.5%) | 3 (11.5%) |
| Computers, Engineering & Science | 47 (85.5%) | 8 (14.5%) |
| Computers & Mathematics | 12 (100.0%) | 0 (0.0%) |
| Architecture & Engineering | 35 (81.4%) | 8 (18.6%) |
| Life, Physical & Social Science | 0 (0.0%) | 0 (0.0%) |
| Community & Social Service | 37 (40.7%) | 54 (59.3%) |
| Education, Arts & Media | 0 (0.0%) | 5 (100.0%) |
| Legal Services & Support | 37 (100.0%) | 0 (0.0%) |
| Education Instruction & Library | 0 (0.0%) | 49 (100.0%) |
| Arts, Media & Entertainment | 0 (0.0%) | 0 (0.0%) |
| Health Diagnosing & Treating | 0 (0.0%) | 17 (100.0%) |
| Health Technologists | 0 (0.0%) | 13 (100.0%) |
| Total (Category) | 167 (65.0%) | 90 (35.0%) |
| Total (Overall) | 305 (62.5%) | 183 (37.5%) |
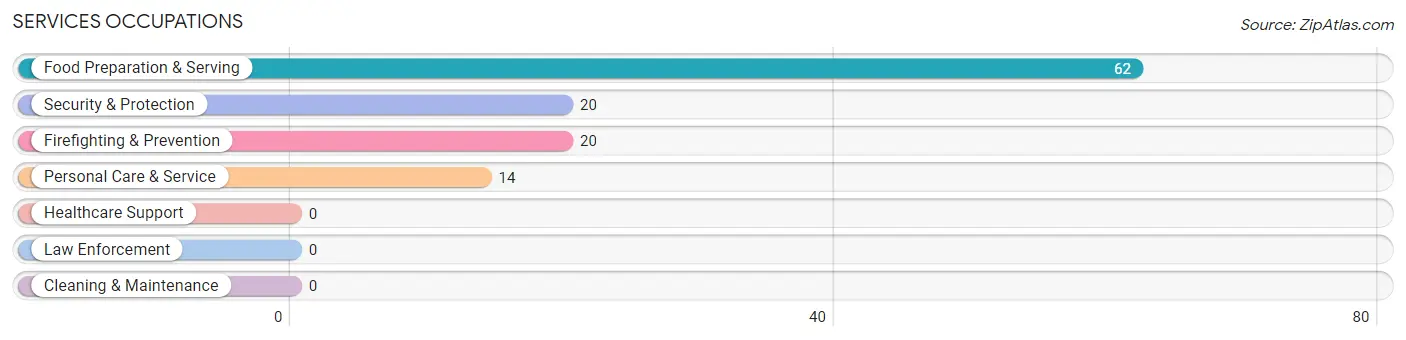
Services Occupations
The most common Services occupations in Lake Michigan Beach are Food Preparation & Serving (62 | 12.7%), Security & Protection (20 | 4.1%), Firefighting & Prevention (20 | 4.1%), and Personal Care & Service (14 | 2.9%).
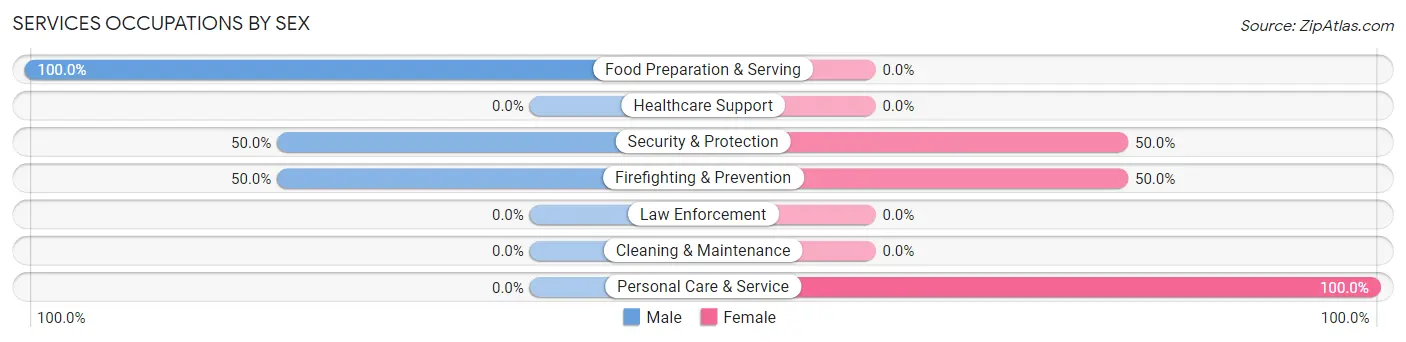
Services Occupations by Sex
Within the Services occupations in Lake Michigan Beach, the most male-oriented occupations are Food Preparation & Serving (100.0%), Security & Protection (50.0%), and Firefighting & Prevention (50.0%), while the most female-oriented occupations are Personal Care & Service (100.0%), Security & Protection (50.0%), and Firefighting & Prevention (50.0%).
| Occupation | Male | Female |
| Healthcare Support | 0 (0.0%) | 0 (0.0%) |
| Security & Protection | 10 (50.0%) | 10 (50.0%) |
| Firefighting & Prevention | 10 (50.0%) | 10 (50.0%) |
| Law Enforcement | 0 (0.0%) | 0 (0.0%) |
| Food Preparation & Serving | 62 (100.0%) | 0 (0.0%) |
| Cleaning & Maintenance | 0 (0.0%) | 0 (0.0%) |
| Personal Care & Service | 0 (0.0%) | 14 (100.0%) |
| Total (Category) | 72 (75.0%) | 24 (25.0%) |
| Total (Overall) | 305 (62.5%) | 183 (37.5%) |
Sales and Office Occupations
The most common Sales and Office occupations in Lake Michigan Beach are Office & Administration (27 | 5.5%), and Sales & Related (10 | 2.1%).
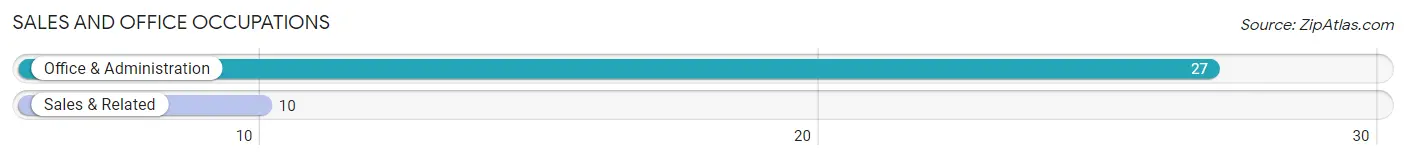
Sales and Office Occupations by Sex
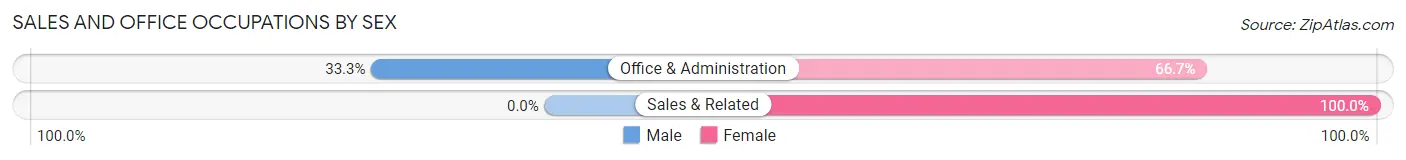
| Occupation | Male | Female |
| Sales & Related | 0 (0.0%) | 10 (100.0%) |
| Office & Administration | 9 (33.3%) | 18 (66.7%) |
| Total (Category) | 9 (24.3%) | 28 (75.7%) |
| Total (Overall) | 305 (62.5%) | 183 (37.5%) |
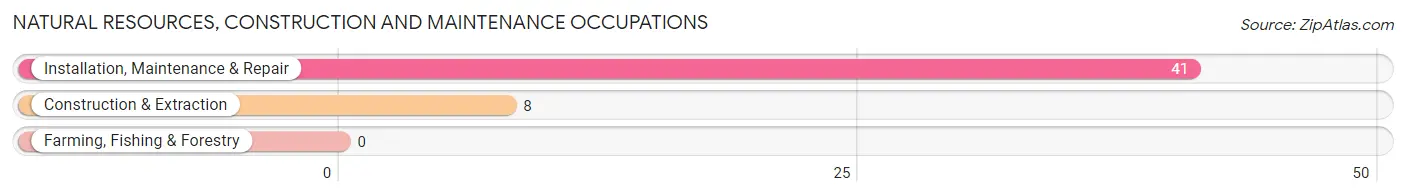
Natural Resources, Construction and Maintenance Occupations
The most common Natural Resources, Construction and Maintenance occupations in Lake Michigan Beach are Installation, Maintenance & Repair (41 | 8.4%), and Construction & Extraction (8 | 1.6%).
Natural Resources, Construction and Maintenance Occupations by Sex
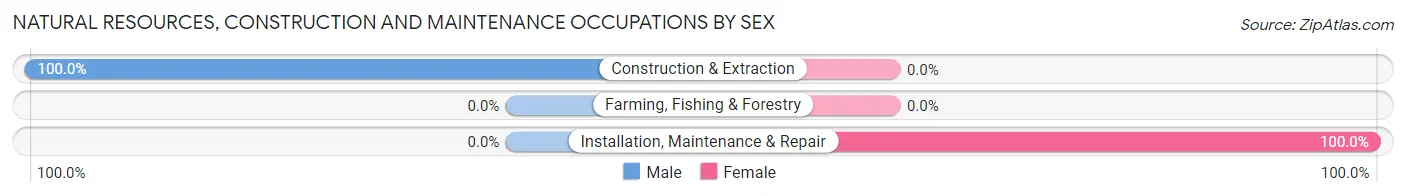
| Occupation | Male | Female |
| Farming, Fishing & Forestry | 0 (0.0%) | 0 (0.0%) |
| Construction & Extraction | 8 (100.0%) | 0 (0.0%) |
| Installation, Maintenance & Repair | 0 (0.0%) | 41 (100.0%) |
| Total (Category) | 8 (16.3%) | 41 (83.7%) |
| Total (Overall) | 305 (62.5%) | 183 (37.5%) |
Production, Transportation and Moving Occupations
The most common Production, Transportation and Moving occupations in Lake Michigan Beach are , and Production (49 | 10.0%).
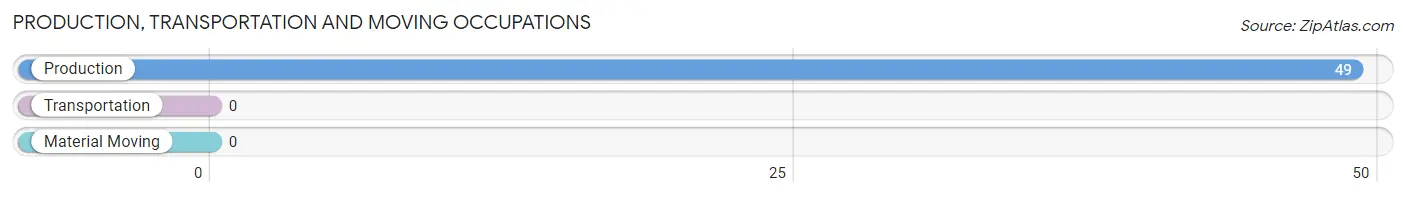
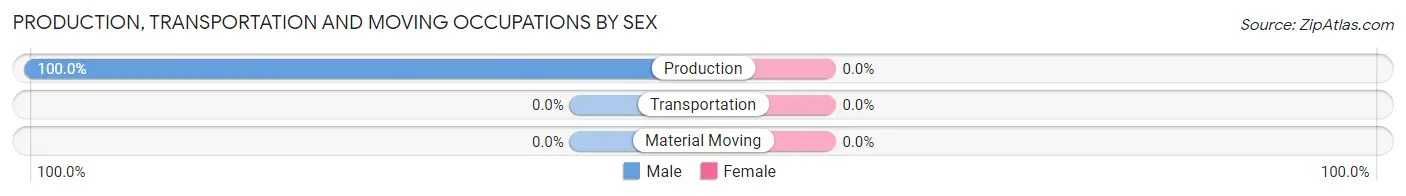
Production, Transportation and Moving Occupations by Sex
| Occupation | Male | Female |
| Production | 49 (100.0%) | 0 (0.0%) |
| Transportation | 0 (0.0%) | 0 (0.0%) |
| Material Moving | 0 (0.0%) | 0 (0.0%) |
| Total (Category) | 49 (100.0%) | 0 (0.0%) |
| Total (Overall) | 305 (62.5%) | 183 (37.5%) |
Employment Industries by Sex in Lake Michigan Beach
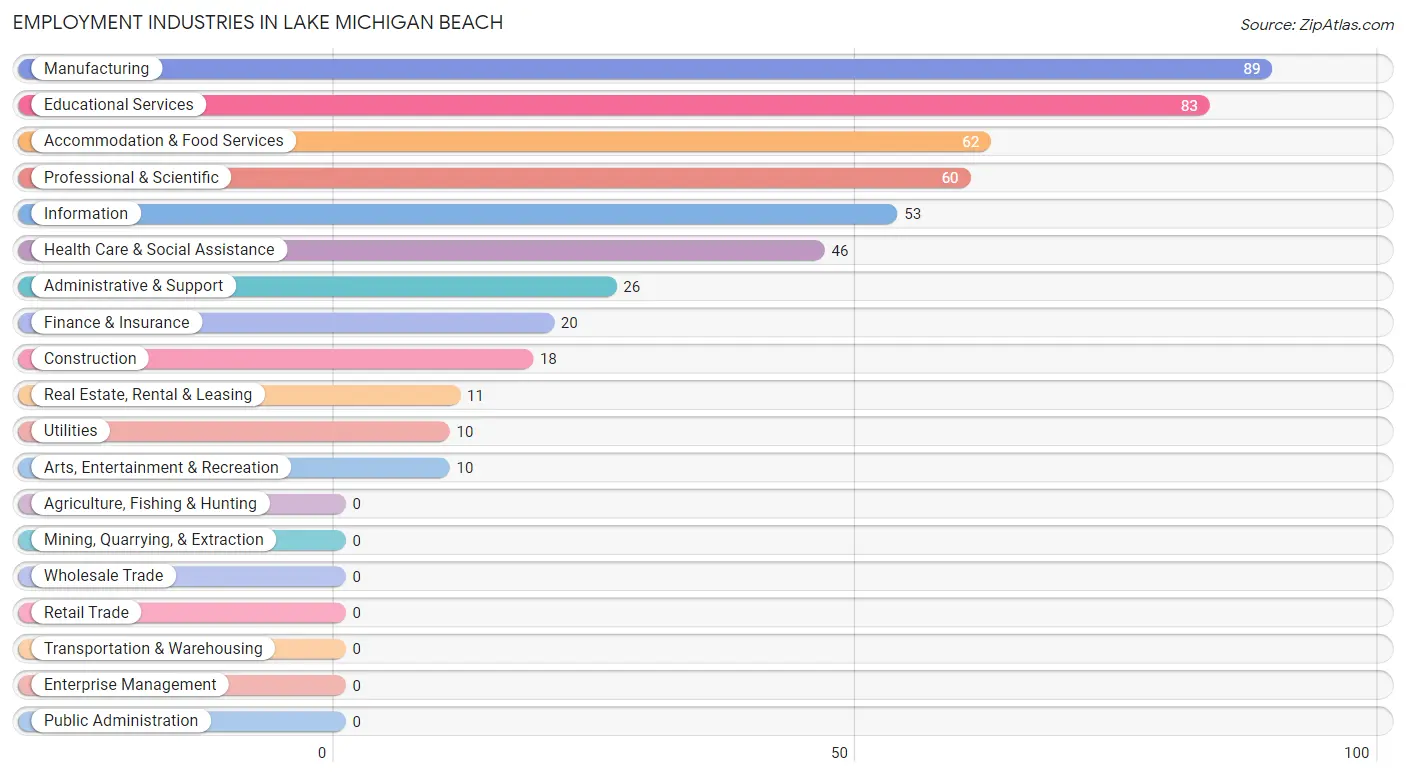
Employment Industries in Lake Michigan Beach
The major employment industries in Lake Michigan Beach include Manufacturing (89 | 18.2%), Educational Services (83 | 17.0%), Accommodation & Food Services (62 | 12.7%), Professional & Scientific (60 | 12.3%), and Information (53 | 10.9%).
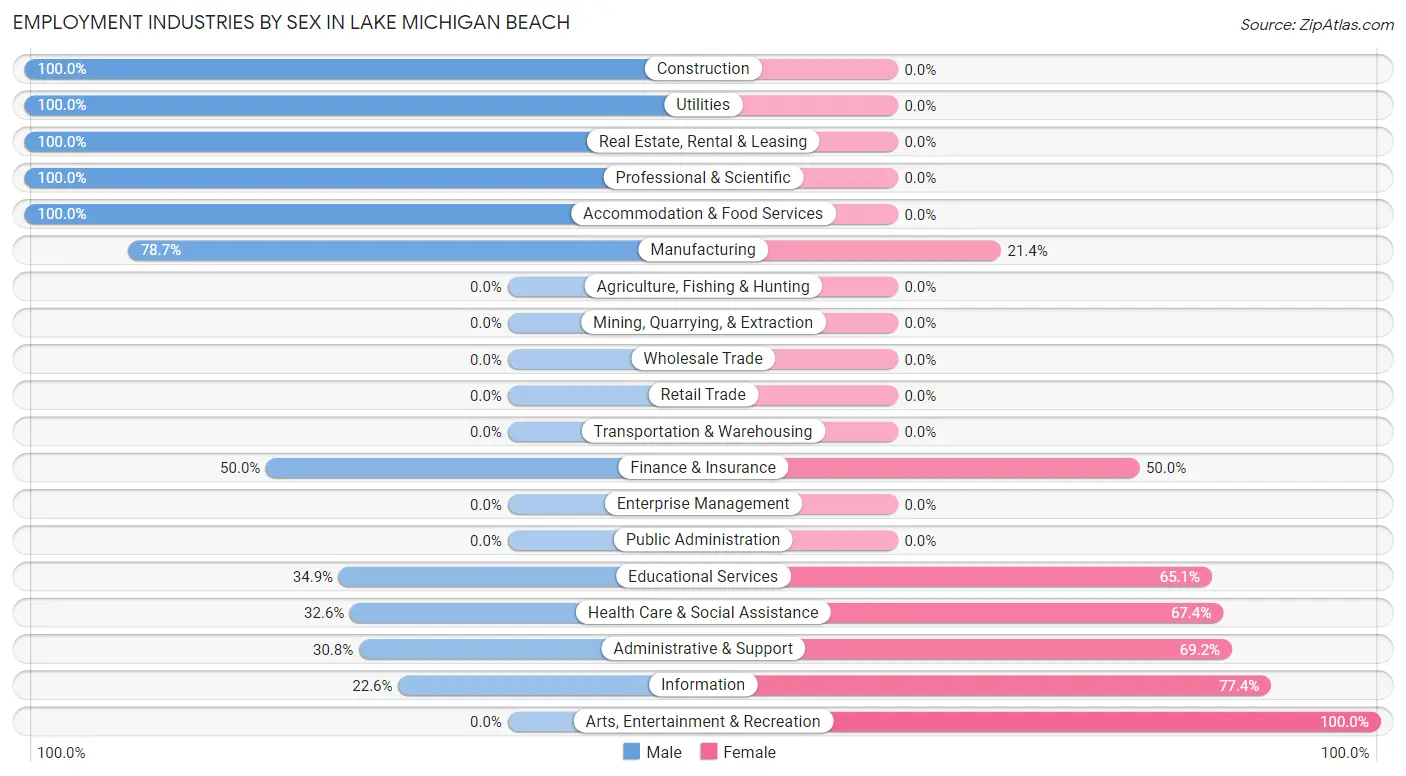
Employment Industries by Sex in Lake Michigan Beach
The Lake Michigan Beach industries that see more men than women are Construction (100.0%), Utilities (100.0%), and Real Estate, Rental & Leasing (100.0%), whereas the industries that tend to have a higher number of women are Arts, Entertainment & Recreation (100.0%), Information (77.4%), and Administrative & Support (69.2%).
| Industry | Male | Female |
| Agriculture, Fishing & Hunting | 0 (0.0%) | 0 (0.0%) |
| Mining, Quarrying, & Extraction | 0 (0.0%) | 0 (0.0%) |
| Construction | 18 (100.0%) | 0 (0.0%) |
| Manufacturing | 70 (78.6%) | 19 (21.3%) |
| Wholesale Trade | 0 (0.0%) | 0 (0.0%) |
| Retail Trade | 0 (0.0%) | 0 (0.0%) |
| Transportation & Warehousing | 0 (0.0%) | 0 (0.0%) |
| Utilities | 10 (100.0%) | 0 (0.0%) |
| Information | 12 (22.6%) | 41 (77.4%) |
| Finance & Insurance | 10 (50.0%) | 10 (50.0%) |
| Real Estate, Rental & Leasing | 11 (100.0%) | 0 (0.0%) |
| Professional & Scientific | 60 (100.0%) | 0 (0.0%) |
| Enterprise Management | 0 (0.0%) | 0 (0.0%) |
| Administrative & Support | 8 (30.8%) | 18 (69.2%) |
| Educational Services | 29 (34.9%) | 54 (65.1%) |
| Health Care & Social Assistance | 15 (32.6%) | 31 (67.4%) |
| Arts, Entertainment & Recreation | 0 (0.0%) | 10 (100.0%) |
| Accommodation & Food Services | 62 (100.0%) | 0 (0.0%) |
| Public Administration | 0 (0.0%) | 0 (0.0%) |
| Total | 305 (62.5%) | 183 (37.5%) |
Education in Lake Michigan Beach
School Enrollment in Lake Michigan Beach
The most common levels of schooling among the 182 students in Lake Michigan Beach are high school (47 | 25.8%), college / undergraduate (41 | 22.5%), and graduate / professional (38 | 20.9%).
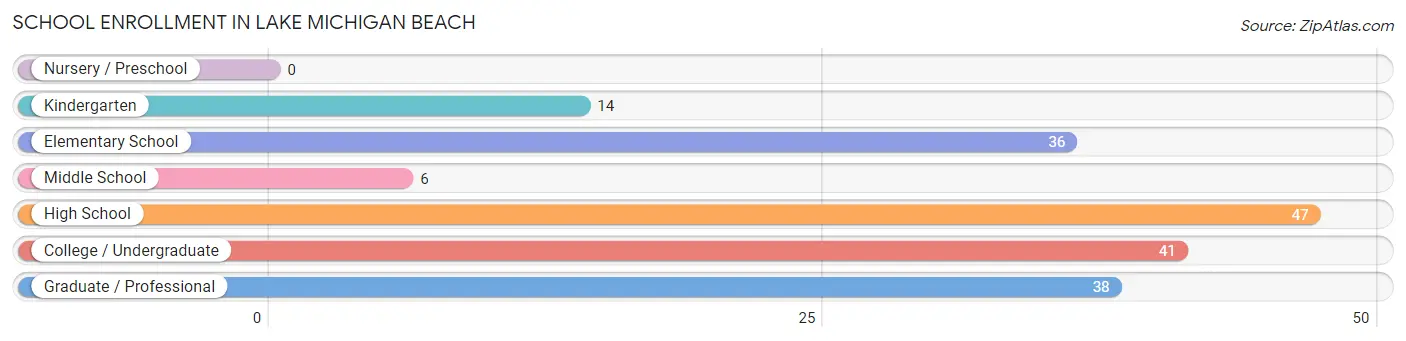
| School Level | # Students | % Students |
| Nursery / Preschool | 0 | 0.0% |
| Kindergarten | 14 | 7.7% |
| Elementary School | 36 | 19.8% |
| Middle School | 6 | 3.3% |
| High School | 47 | 25.8% |
| College / Undergraduate | 41 | 22.5% |
| Graduate / Professional | 38 | 20.9% |
| Total | 182 | 100.0% |
School Enrollment by Age by Funding Source in Lake Michigan Beach
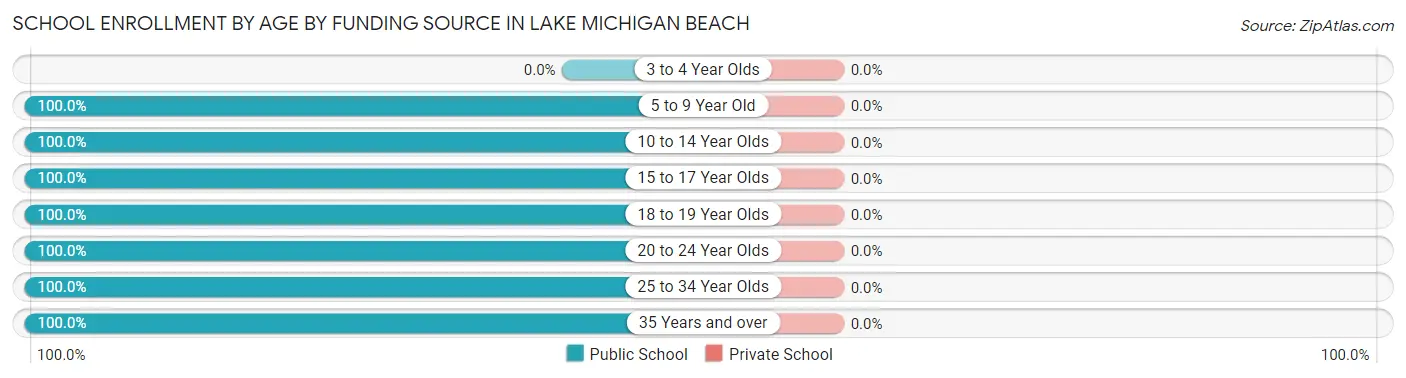
| Age Bracket | Public School | Private School |
| 3 to 4 Year Olds | 0 (0.0%) | 0 (0.0%) |
| 5 to 9 Year Old | 50 (100.0%) | 0 (0.0%) |
| 10 to 14 Year Olds | 6 (100.0%) | 0 (0.0%) |
| 15 to 17 Year Olds | 34 (100.0%) | 0 (0.0%) |
| 18 to 19 Year Olds | 13 (100.0%) | 0 (0.0%) |
| 20 to 24 Year Olds | 15 (100.0%) | 0 (0.0%) |
| 25 to 34 Year Olds | 38 (100.0%) | 0 (0.0%) |
| 35 Years and over | 26 (100.0%) | 0 (0.0%) |
| Total | 182 (100.0%) | 0 (0.0%) |
Educational Attainment by Field of Study in Lake Michigan Beach
Education (72 | 21.7%), business (54 | 16.3%), science & technology (38 | 11.5%), social sciences (37 | 11.1%), and liberal arts & history (37 | 11.1%) are the most common fields of study among 332 individuals in Lake Michigan Beach who have obtained a bachelor's degree or higher.
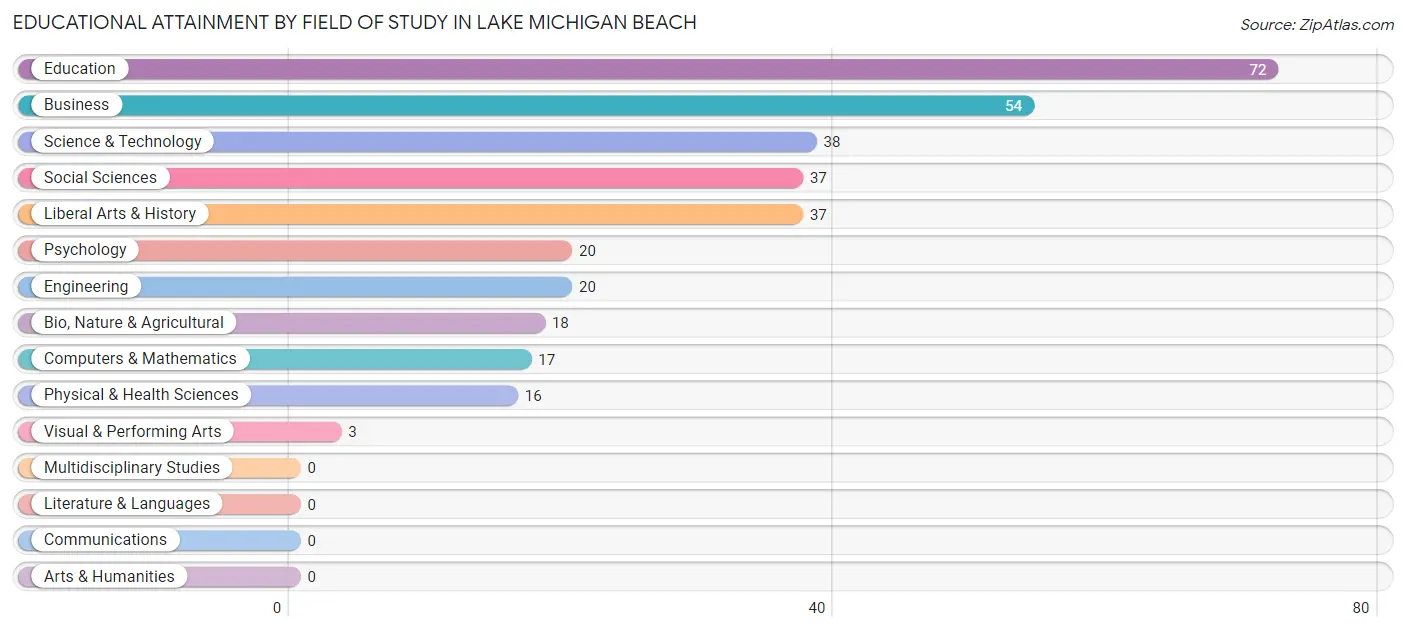
| Field of Study | # Graduates | % Graduates |
| Computers & Mathematics | 17 | 5.1% |
| Bio, Nature & Agricultural | 18 | 5.4% |
| Physical & Health Sciences | 16 | 4.8% |
| Psychology | 20 | 6.0% |
| Social Sciences | 37 | 11.1% |
| Engineering | 20 | 6.0% |
| Multidisciplinary Studies | 0 | 0.0% |
| Science & Technology | 38 | 11.5% |
| Business | 54 | 16.3% |
| Education | 72 | 21.7% |
| Literature & Languages | 0 | 0.0% |
| Liberal Arts & History | 37 | 11.1% |
| Visual & Performing Arts | 3 | 0.9% |
| Communications | 0 | 0.0% |
| Arts & Humanities | 0 | 0.0% |
| Total | 332 | 100.0% |
Transportation & Commute in Lake Michigan Beach
Vehicle Availability by Sex in Lake Michigan Beach
The most prevalent vehicle ownership categories in Lake Michigan Beach are males with 2 vehicles (145, accounting for 48.0%) and females with 2 vehicles (89, making up 79.2%).
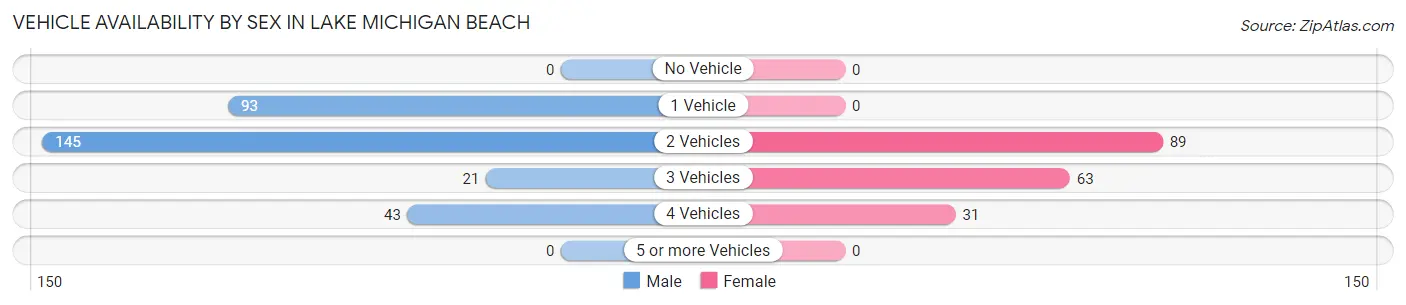
| Vehicles Available | Male | Female |
| No Vehicle | 0 (0.0%) | 0 (0.0%) |
| 1 Vehicle | 93 (30.8%) | 0 (0.0%) |
| 2 Vehicles | 145 (48.0%) | 89 (48.6%) |
| 3 Vehicles | 21 (7.0%) | 63 (34.4%) |
| 4 Vehicles | 43 (14.2%) | 31 (16.9%) |
| 5 or more Vehicles | 0 (0.0%) | 0 (0.0%) |
| Total | 302 (100.0%) | 183 (100.0%) |
Commute Time in Lake Michigan Beach
The most frequently occuring commute durations in Lake Michigan Beach are 15 to 19 minutes (157 commuters, 34.1%), 25 to 29 minutes (94 commuters, 20.4%), and 10 to 14 minutes (67 commuters, 14.6%).
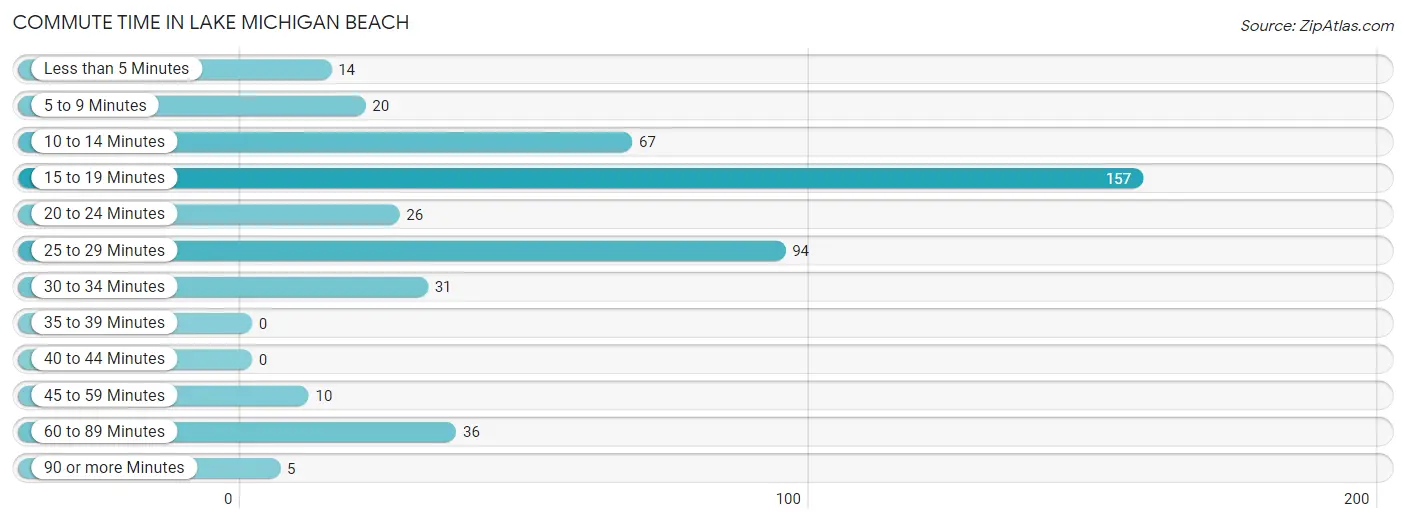
| Commute Time | # Commuters | % Commuters |
| Less than 5 Minutes | 14 | 3.0% |
| 5 to 9 Minutes | 20 | 4.3% |
| 10 to 14 Minutes | 67 | 14.6% |
| 15 to 19 Minutes | 157 | 34.1% |
| 20 to 24 Minutes | 26 | 5.7% |
| 25 to 29 Minutes | 94 | 20.4% |
| 30 to 34 Minutes | 31 | 6.7% |
| 35 to 39 Minutes | 0 | 0.0% |
| 40 to 44 Minutes | 0 | 0.0% |
| 45 to 59 Minutes | 10 | 2.2% |
| 60 to 89 Minutes | 36 | 7.8% |
| 90 or more Minutes | 5 | 1.1% |
Commute Time by Sex in Lake Michigan Beach
The most common commute times in Lake Michigan Beach are 25 to 29 minutes (86 commuters, 30.7%) for males and 15 to 19 minutes (96 commuters, 53.3%) for females.
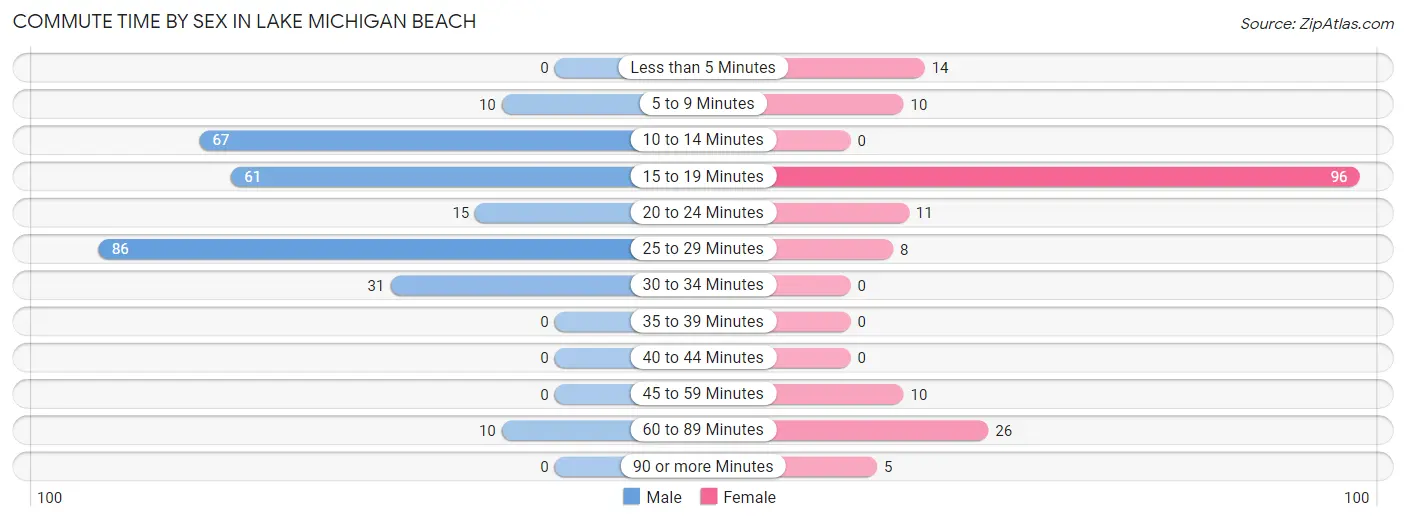
| Commute Time | Male | Female |
| Less than 5 Minutes | 0 (0.0%) | 14 (7.8%) |
| 5 to 9 Minutes | 10 (3.6%) | 10 (5.6%) |
| 10 to 14 Minutes | 67 (23.9%) | 0 (0.0%) |
| 15 to 19 Minutes | 61 (21.8%) | 96 (53.3%) |
| 20 to 24 Minutes | 15 (5.4%) | 11 (6.1%) |
| 25 to 29 Minutes | 86 (30.7%) | 8 (4.4%) |
| 30 to 34 Minutes | 31 (11.1%) | 0 (0.0%) |
| 35 to 39 Minutes | 0 (0.0%) | 0 (0.0%) |
| 40 to 44 Minutes | 0 (0.0%) | 0 (0.0%) |
| 45 to 59 Minutes | 0 (0.0%) | 10 (5.6%) |
| 60 to 89 Minutes | 10 (3.6%) | 26 (14.4%) |
| 90 or more Minutes | 0 (0.0%) | 5 (2.8%) |
Time of Departure to Work by Sex in Lake Michigan Beach
The most frequent times of departure to work in Lake Michigan Beach are 7:00 AM to 7:29 AM (62, 22.1%) for males and 7:00 AM to 7:29 AM (92, 51.1%) for females.
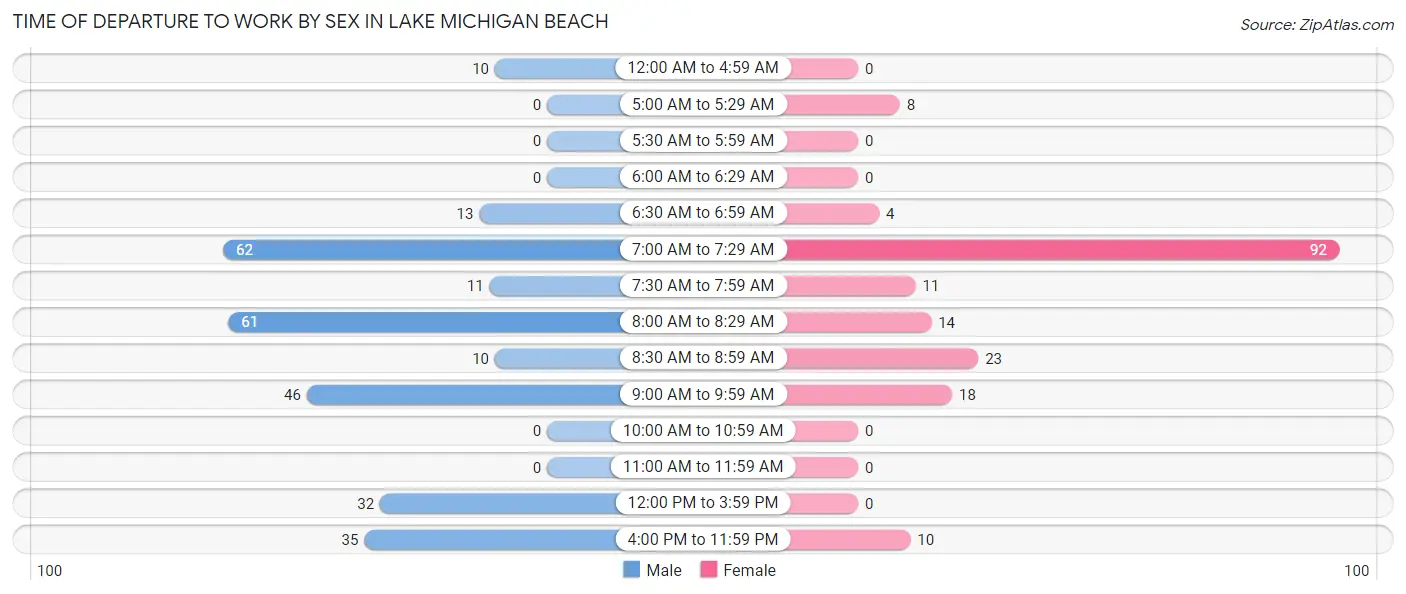
| Time of Departure | Male | Female |
| 12:00 AM to 4:59 AM | 10 (3.6%) | 0 (0.0%) |
| 5:00 AM to 5:29 AM | 0 (0.0%) | 8 (4.4%) |
| 5:30 AM to 5:59 AM | 0 (0.0%) | 0 (0.0%) |
| 6:00 AM to 6:29 AM | 0 (0.0%) | 0 (0.0%) |
| 6:30 AM to 6:59 AM | 13 (4.6%) | 4 (2.2%) |
| 7:00 AM to 7:29 AM | 62 (22.1%) | 92 (51.1%) |
| 7:30 AM to 7:59 AM | 11 (3.9%) | 11 (6.1%) |
| 8:00 AM to 8:29 AM | 61 (21.8%) | 14 (7.8%) |
| 8:30 AM to 8:59 AM | 10 (3.6%) | 23 (12.8%) |
| 9:00 AM to 9:59 AM | 46 (16.4%) | 18 (10.0%) |
| 10:00 AM to 10:59 AM | 0 (0.0%) | 0 (0.0%) |
| 11:00 AM to 11:59 AM | 0 (0.0%) | 0 (0.0%) |
| 12:00 PM to 3:59 PM | 32 (11.4%) | 0 (0.0%) |
| 4:00 PM to 11:59 PM | 35 (12.5%) | 10 (5.6%) |
| Total | 280 (100.0%) | 180 (100.0%) |
Housing Occupancy in Lake Michigan Beach
Occupancy by Ownership in Lake Michigan Beach
Of the total 451 dwellings in Lake Michigan Beach, owner-occupied units account for 395 (87.6%), while renter-occupied units make up 56 (12.4%).
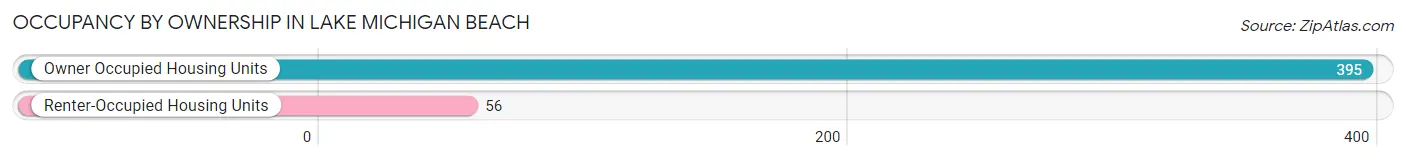
| Occupancy | # Housing Units | % Housing Units |
| Owner Occupied Housing Units | 395 | 87.6% |
| Renter-Occupied Housing Units | 56 | 12.4% |
| Total Occupied Housing Units | 451 | 100.0% |
Occupancy by Household Size in Lake Michigan Beach
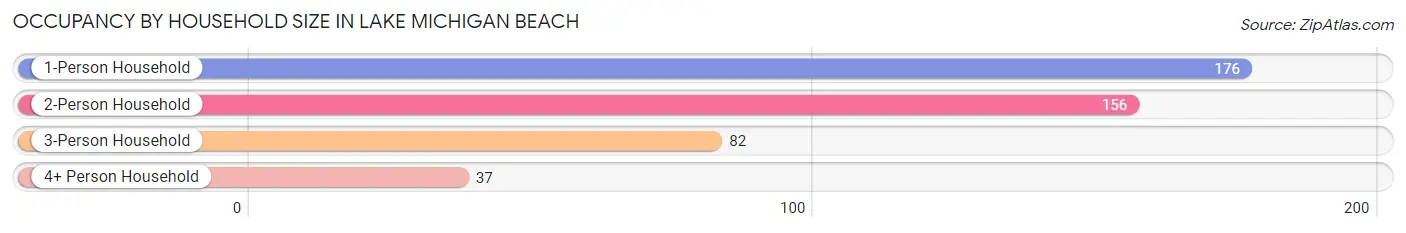
| Household Size | # Housing Units | % Housing Units |
| 1-Person Household | 176 | 39.0% |
| 2-Person Household | 156 | 34.6% |
| 3-Person Household | 82 | 18.2% |
| 4+ Person Household | 37 | 8.2% |
| Total Housing Units | 451 | 100.0% |
Occupancy by Ownership by Household Size in Lake Michigan Beach
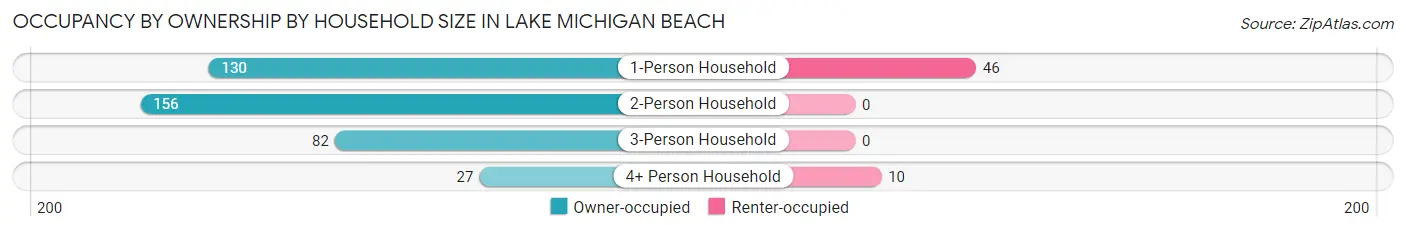
| Household Size | Owner-occupied | Renter-occupied |
| 1-Person Household | 130 (73.9%) | 46 (26.1%) |
| 2-Person Household | 156 (100.0%) | 0 (0.0%) |
| 3-Person Household | 82 (100.0%) | 0 (0.0%) |
| 4+ Person Household | 27 (73.0%) | 10 (27.0%) |
| Total Housing Units | 395 (87.6%) | 56 (12.4%) |
Occupancy by Educational Attainment in Lake Michigan Beach
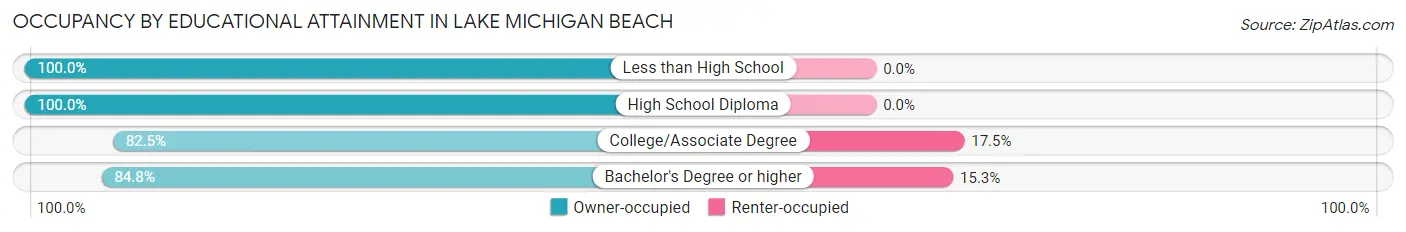
| Household Size | Owner-occupied | Renter-occupied |
| Less than High School | 32 (100.0%) | 0 (0.0%) |
| High School Diploma | 76 (100.0%) | 0 (0.0%) |
| College/Associate Degree | 137 (82.5%) | 29 (17.5%) |
| Bachelor's Degree or higher | 150 (84.8%) | 27 (15.2%) |
Occupancy by Age of Householder in Lake Michigan Beach
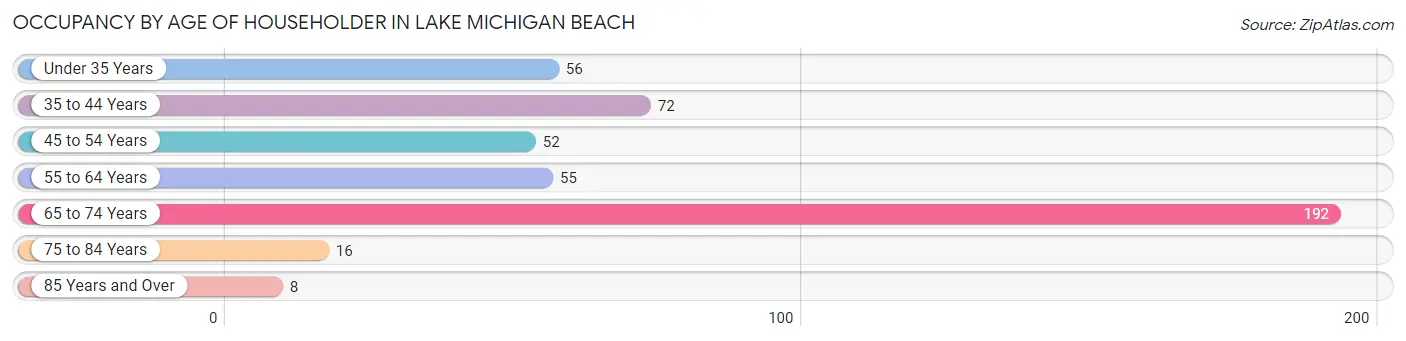
| Age Bracket | # Households | % Households |
| Under 35 Years | 56 | 12.4% |
| 35 to 44 Years | 72 | 16.0% |
| 45 to 54 Years | 52 | 11.5% |
| 55 to 64 Years | 55 | 12.2% |
| 65 to 74 Years | 192 | 42.6% |
| 75 to 84 Years | 16 | 3.5% |
| 85 Years and Over | 8 | 1.8% |
| Total | 451 | 100.0% |
Housing Finances in Lake Michigan Beach
Median Income by Occupancy in Lake Michigan Beach
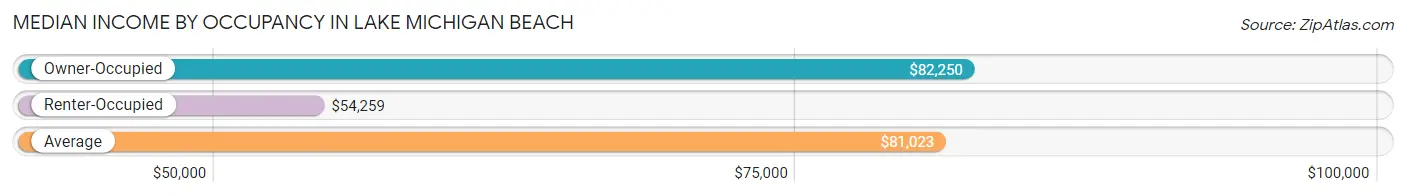
| Occupancy Type | # Households | Median Income |
| Owner-Occupied | 395 (87.6%) | $82,250 |
| Renter-Occupied | 56 (12.4%) | $54,259 |
| Average | 451 (100.0%) | $81,023 |
Occupancy by Householder Income Bracket in Lake Michigan Beach
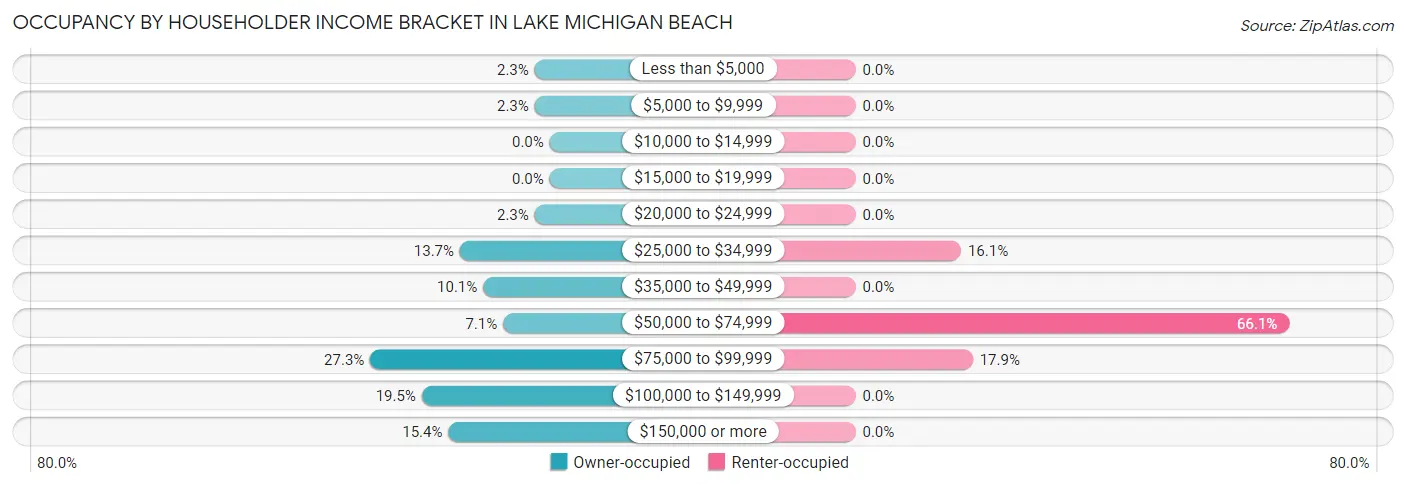
| Income Bracket | Owner-occupied | Renter-occupied |
| Less than $5,000 | 9 (2.3%) | 0 (0.0%) |
| $5,000 to $9,999 | 9 (2.3%) | 0 (0.0%) |
| $10,000 to $14,999 | 0 (0.0%) | 0 (0.0%) |
| $15,000 to $19,999 | 0 (0.0%) | 0 (0.0%) |
| $20,000 to $24,999 | 9 (2.3%) | 0 (0.0%) |
| $25,000 to $34,999 | 54 (13.7%) | 9 (16.1%) |
| $35,000 to $49,999 | 40 (10.1%) | 0 (0.0%) |
| $50,000 to $74,999 | 28 (7.1%) | 37 (66.1%) |
| $75,000 to $99,999 | 108 (27.3%) | 10 (17.9%) |
| $100,000 to $149,999 | 77 (19.5%) | 0 (0.0%) |
| $150,000 or more | 61 (15.4%) | 0 (0.0%) |
| Total | 395 (100.0%) | 56 (100.0%) |
Monthly Housing Cost Tiers in Lake Michigan Beach
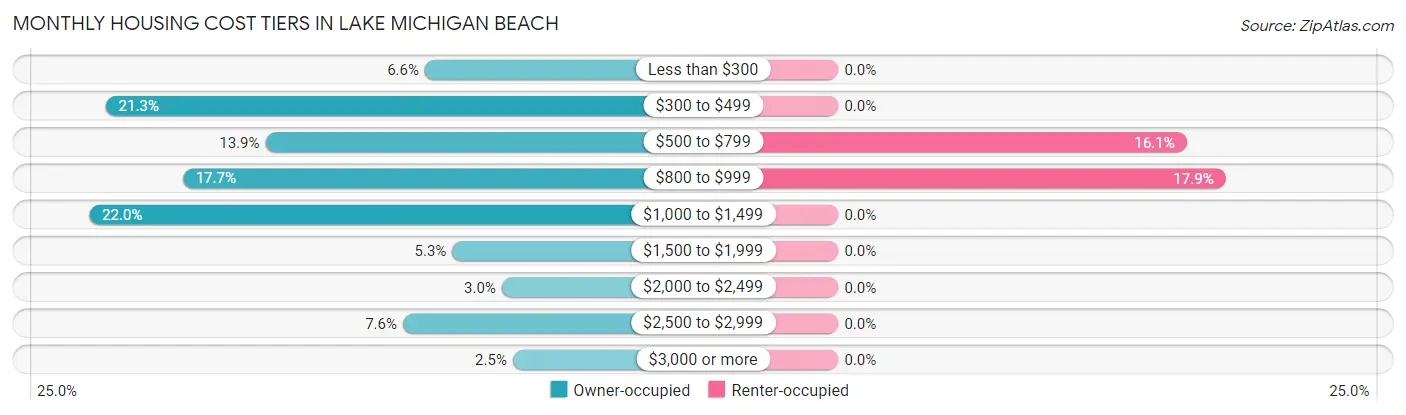
| Monthly Cost | Owner-occupied | Renter-occupied |
| Less than $300 | 26 (6.6%) | 0 (0.0%) |
| $300 to $499 | 84 (21.3%) | 0 (0.0%) |
| $500 to $799 | 55 (13.9%) | 9 (16.1%) |
| $800 to $999 | 70 (17.7%) | 10 (17.9%) |
| $1,000 to $1,499 | 87 (22.0%) | 0 (0.0%) |
| $1,500 to $1,999 | 21 (5.3%) | 0 (0.0%) |
| $2,000 to $2,499 | 12 (3.0%) | 0 (0.0%) |
| $2,500 to $2,999 | 30 (7.6%) | 0 (0.0%) |
| $3,000 or more | 10 (2.5%) | 0 (0.0%) |
| Total | 395 (100.0%) | 56 (100.0%) |
Physical Housing Characteristics in Lake Michigan Beach
Housing Structures in Lake Michigan Beach
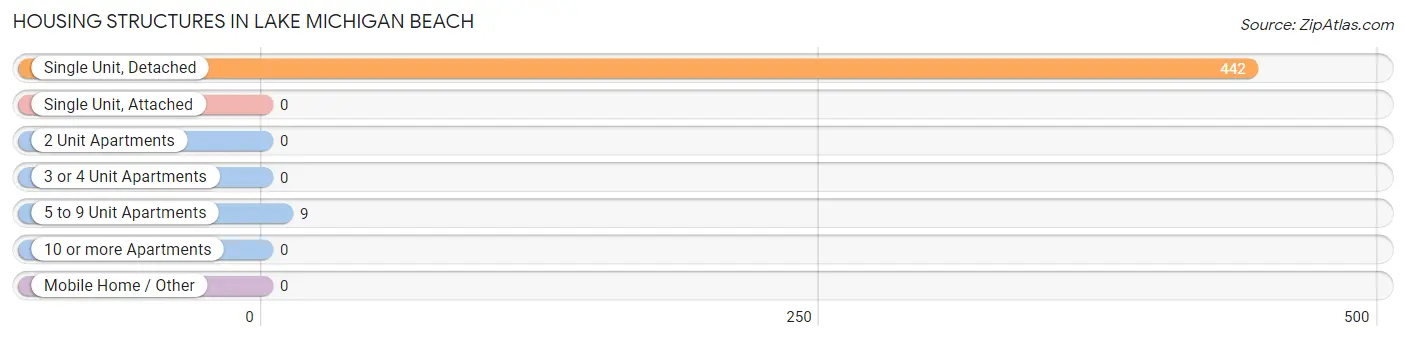
| Structure Type | # Housing Units | % Housing Units |
| Single Unit, Detached | 442 | 98.0% |
| Single Unit, Attached | 0 | 0.0% |
| 2 Unit Apartments | 0 | 0.0% |
| 3 or 4 Unit Apartments | 0 | 0.0% |
| 5 to 9 Unit Apartments | 9 | 2.0% |
| 10 or more Apartments | 0 | 0.0% |
| Mobile Home / Other | 0 | 0.0% |
| Total | 451 | 100.0% |
Housing Structures by Occupancy in Lake Michigan Beach
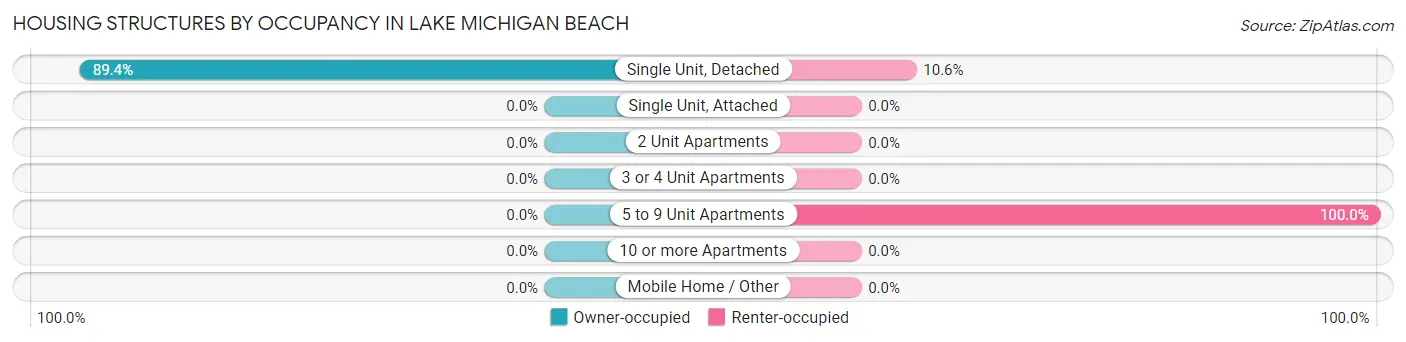
| Structure Type | Owner-occupied | Renter-occupied |
| Single Unit, Detached | 395 (89.4%) | 47 (10.6%) |
| Single Unit, Attached | 0 (0.0%) | 0 (0.0%) |
| 2 Unit Apartments | 0 (0.0%) | 0 (0.0%) |
| 3 or 4 Unit Apartments | 0 (0.0%) | 0 (0.0%) |
| 5 to 9 Unit Apartments | 0 (0.0%) | 9 (100.0%) |
| 10 or more Apartments | 0 (0.0%) | 0 (0.0%) |
| Mobile Home / Other | 0 (0.0%) | 0 (0.0%) |
| Total | 395 (87.6%) | 56 (12.4%) |
Housing Structures by Number of Rooms in Lake Michigan Beach
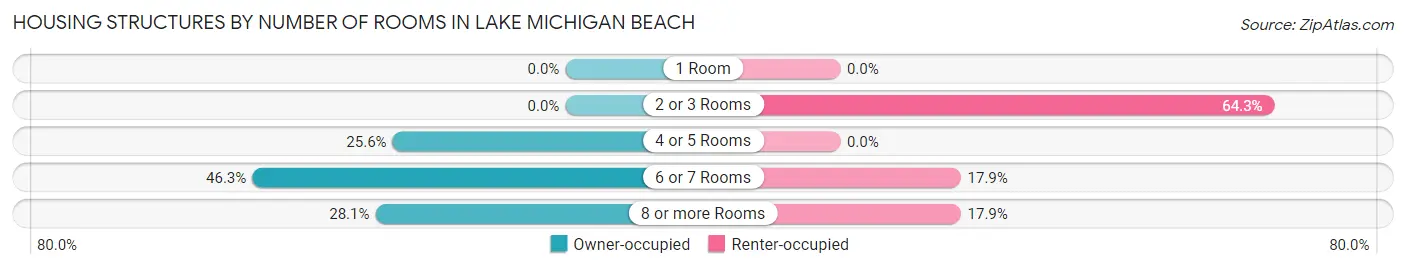
| Number of Rooms | Owner-occupied | Renter-occupied |
| 1 Room | 0 (0.0%) | 0 (0.0%) |
| 2 or 3 Rooms | 0 (0.0%) | 36 (64.3%) |
| 4 or 5 Rooms | 101 (25.6%) | 0 (0.0%) |
| 6 or 7 Rooms | 183 (46.3%) | 10 (17.9%) |
| 8 or more Rooms | 111 (28.1%) | 10 (17.9%) |
| Total | 395 (100.0%) | 56 (100.0%) |
Housing Structure by Heating Type in Lake Michigan Beach
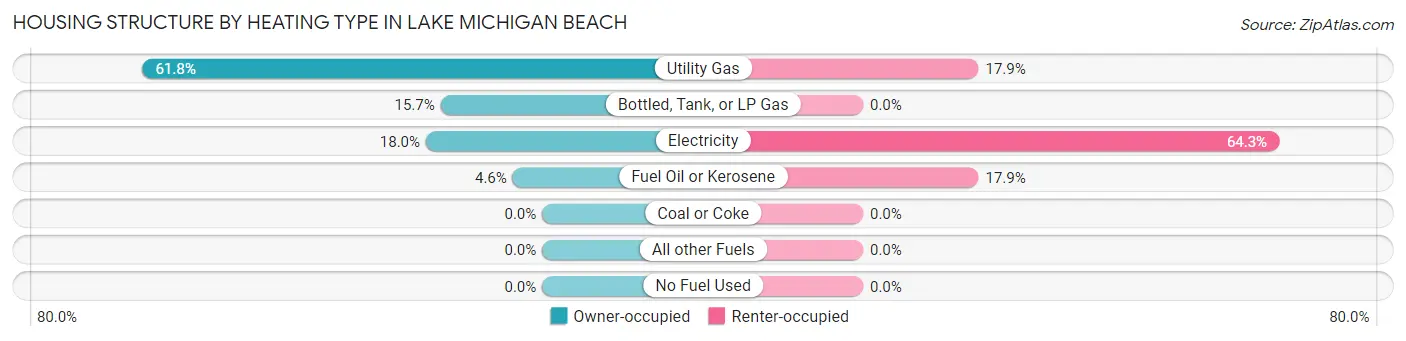
| Heating Type | Owner-occupied | Renter-occupied |
| Utility Gas | 244 (61.8%) | 10 (17.9%) |
| Bottled, Tank, or LP Gas | 62 (15.7%) | 0 (0.0%) |
| Electricity | 71 (18.0%) | 36 (64.3%) |
| Fuel Oil or Kerosene | 18 (4.6%) | 10 (17.9%) |
| Coal or Coke | 0 (0.0%) | 0 (0.0%) |
| All other Fuels | 0 (0.0%) | 0 (0.0%) |
| No Fuel Used | 0 (0.0%) | 0 (0.0%) |
| Total | 395 (100.0%) | 56 (100.0%) |
Household Vehicle Usage in Lake Michigan Beach
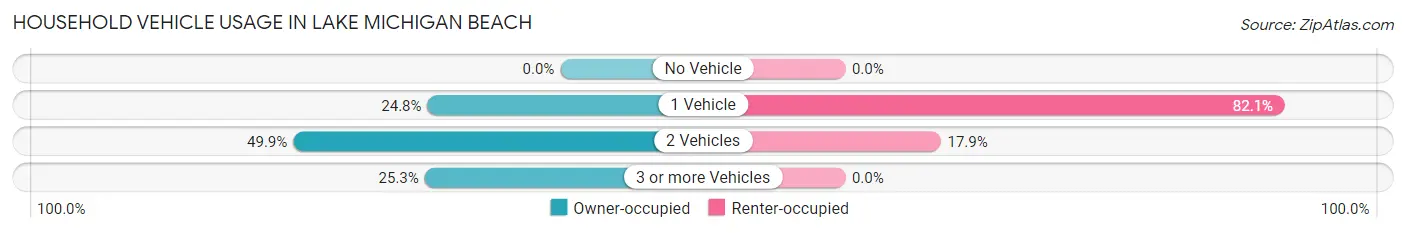
| Vehicles per Household | Owner-occupied | Renter-occupied |
| No Vehicle | 0 (0.0%) | 0 (0.0%) |
| 1 Vehicle | 98 (24.8%) | 46 (82.1%) |
| 2 Vehicles | 197 (49.9%) | 10 (17.9%) |
| 3 or more Vehicles | 100 (25.3%) | 0 (0.0%) |
| Total | 395 (100.0%) | 56 (100.0%) |
Real Estate & Mortgages in Lake Michigan Beach
Real Estate and Mortgage Overview in Lake Michigan Beach
| Characteristic | Without Mortgage | With Mortgage |
| Housing Units | 167 | 228 |
| Median Property Value | $172,400 | $157,200 |
| Median Household Income | $65,568 | $61 |
| Monthly Housing Costs | $444 | $10 |
| Real Estate Taxes | $1,793 | $0 |
Property Value by Mortgage Status in Lake Michigan Beach
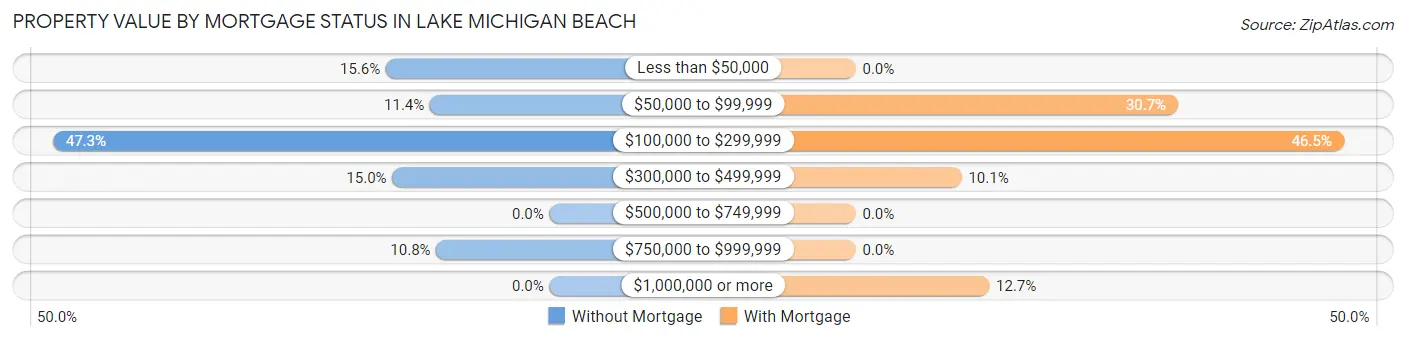
| Property Value | Without Mortgage | With Mortgage |
| Less than $50,000 | 26 (15.6%) | 0 (0.0%) |
| $50,000 to $99,999 | 19 (11.4%) | 70 (30.7%) |
| $100,000 to $299,999 | 79 (47.3%) | 106 (46.5%) |
| $300,000 to $499,999 | 25 (15.0%) | 23 (10.1%) |
| $500,000 to $749,999 | 0 (0.0%) | 0 (0.0%) |
| $750,000 to $999,999 | 18 (10.8%) | 0 (0.0%) |
| $1,000,000 or more | 0 (0.0%) | 29 (12.7%) |
| Total | 167 (100.0%) | 228 (100.0%) |
Household Income by Mortgage Status in Lake Michigan Beach
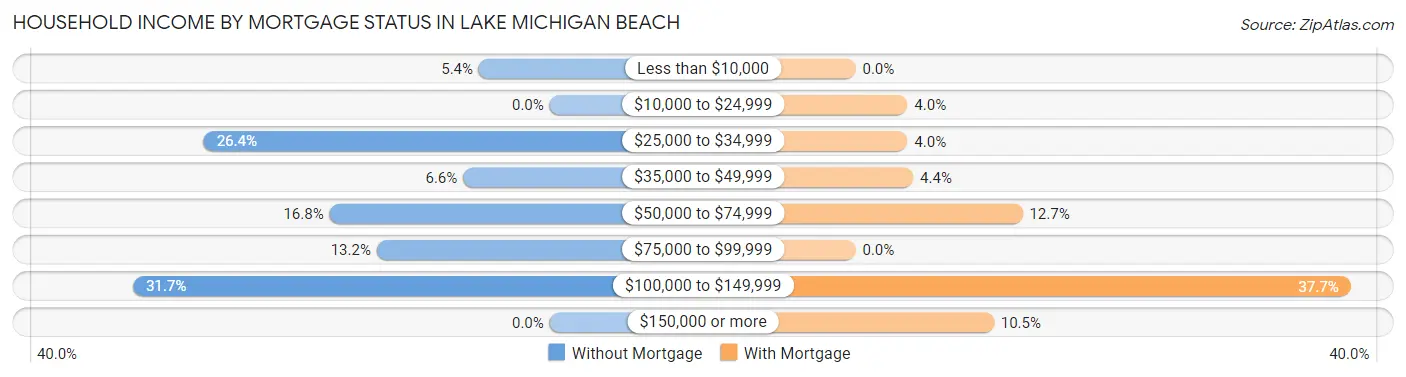
| Household Income | Without Mortgage | With Mortgage |
| Less than $10,000 | 9 (5.4%) | 0 (0.0%) |
| $10,000 to $24,999 | 0 (0.0%) | 9 (4.0%) |
| $25,000 to $34,999 | 44 (26.4%) | 9 (4.0%) |
| $35,000 to $49,999 | 11 (6.6%) | 10 (4.4%) |
| $50,000 to $74,999 | 28 (16.8%) | 29 (12.7%) |
| $75,000 to $99,999 | 22 (13.2%) | 0 (0.0%) |
| $100,000 to $149,999 | 53 (31.7%) | 86 (37.7%) |
| $150,000 or more | 0 (0.0%) | 24 (10.5%) |
| Total | 167 (100.0%) | 228 (100.0%) |
Property Value to Household Income Ratio in Lake Michigan Beach
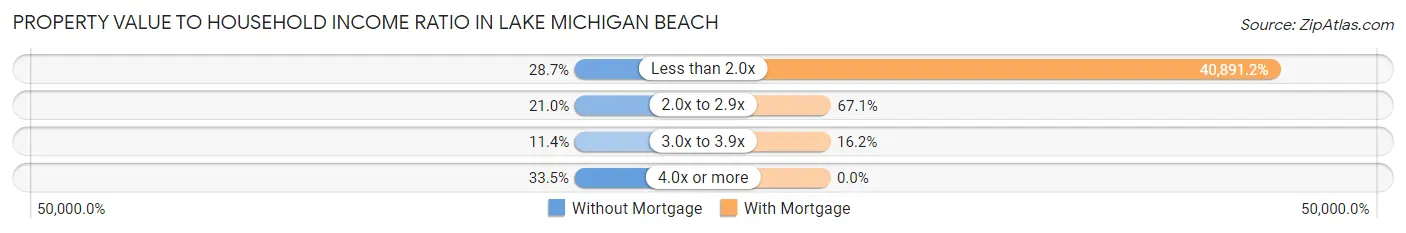
| Value-to-Income Ratio | Without Mortgage | With Mortgage |
| Less than 2.0x | 48 (28.7%) | 93,232 (40,891.2%) |
| 2.0x to 2.9x | 35 (21.0%) | 153 (67.1%) |
| 3.0x to 3.9x | 19 (11.4%) | 37 (16.2%) |
| 4.0x or more | 56 (33.5%) | 0 (0.0%) |
| Total | 167 (100.0%) | 228 (100.0%) |
Real Estate Taxes by Mortgage Status in Lake Michigan Beach
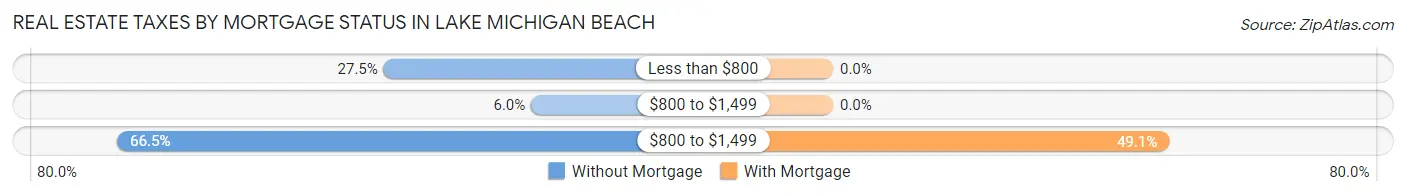
| Property Taxes | Without Mortgage | With Mortgage |
| Less than $800 | 46 (27.5%) | 0 (0.0%) |
| $800 to $1,499 | 10 (6.0%) | 0 (0.0%) |
| $800 to $1,499 | 111 (66.5%) | 112 (49.1%) |
| Total | 167 (100.0%) | 228 (100.0%) |
Health & Disability in Lake Michigan Beach
Health Insurance Coverage by Age in Lake Michigan Beach
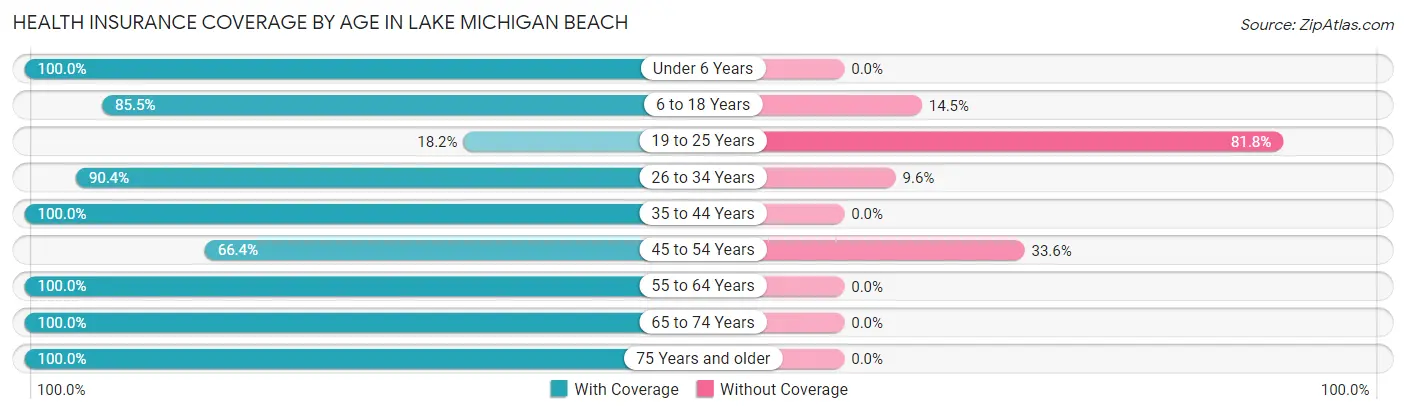
| Age Bracket | With Coverage | Without Coverage |
| Under 6 Years | 51 (100.0%) | 0 (0.0%) |
| 6 to 18 Years | 65 (85.5%) | 11 (14.5%) |
| 19 to 25 Years | 14 (18.2%) | 63 (81.8%) |
| 26 to 34 Years | 85 (90.4%) | 9 (9.6%) |
| 35 to 44 Years | 107 (100.0%) | 0 (0.0%) |
| 45 to 54 Years | 79 (66.4%) | 40 (33.6%) |
| 55 to 64 Years | 106 (100.0%) | 0 (0.0%) |
| 65 to 74 Years | 216 (100.0%) | 0 (0.0%) |
| 75 Years and older | 72 (100.0%) | 0 (0.0%) |
| Total | 795 (86.6%) | 123 (13.4%) |
Health Insurance Coverage by Citizenship Status in Lake Michigan Beach
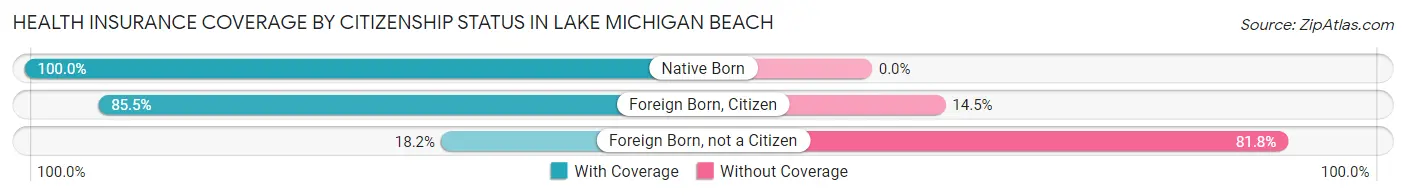
| Citizenship Status | With Coverage | Without Coverage |
| Native Born | 51 (100.0%) | 0 (0.0%) |
| Foreign Born, Citizen | 65 (85.5%) | 11 (14.5%) |
| Foreign Born, not a Citizen | 14 (18.2%) | 63 (81.8%) |
Health Insurance Coverage by Household Income in Lake Michigan Beach
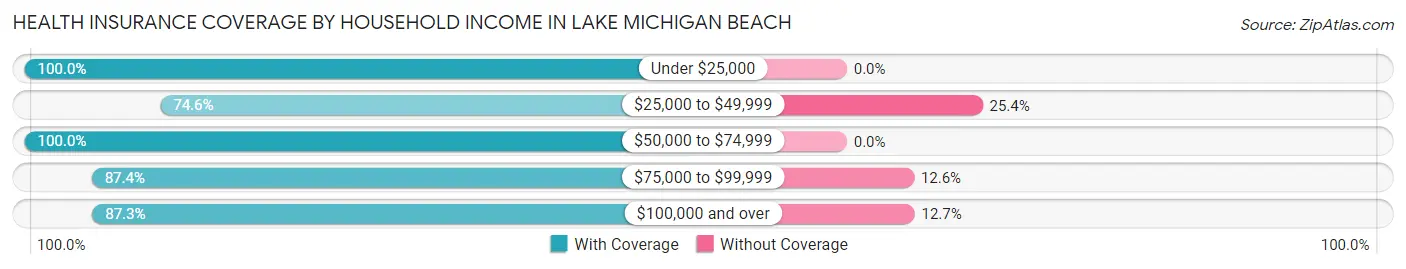
| Household Income | With Coverage | Without Coverage |
| Under $25,000 | 37 (100.0%) | 0 (0.0%) |
| $25,000 to $49,999 | 129 (74.6%) | 44 (25.4%) |
| $50,000 to $74,999 | 83 (100.0%) | 0 (0.0%) |
| $75,000 to $99,999 | 264 (87.4%) | 38 (12.6%) |
| $100,000 and over | 282 (87.3%) | 41 (12.7%) |
Public vs Private Health Insurance Coverage by Age in Lake Michigan Beach
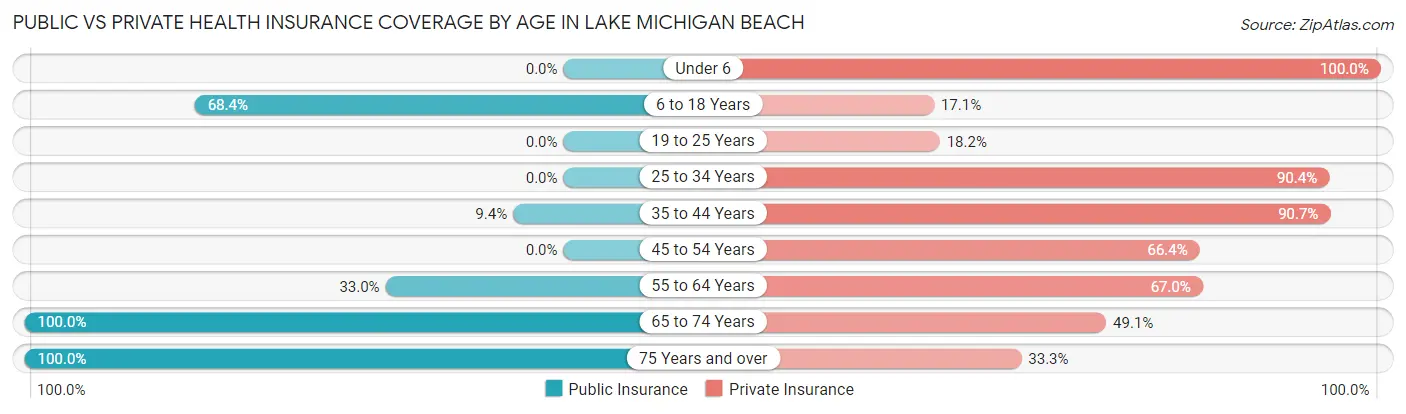
| Age Bracket | Public Insurance | Private Insurance |
| Under 6 | 0 (0.0%) | 51 (100.0%) |
| 6 to 18 Years | 52 (68.4%) | 13 (17.1%) |
| 19 to 25 Years | 0 (0.0%) | 14 (18.2%) |
| 25 to 34 Years | 0 (0.0%) | 85 (90.4%) |
| 35 to 44 Years | 10 (9.3%) | 97 (90.6%) |
| 45 to 54 Years | 0 (0.0%) | 79 (66.4%) |
| 55 to 64 Years | 35 (33.0%) | 71 (67.0%) |
| 65 to 74 Years | 216 (100.0%) | 106 (49.1%) |
| 75 Years and over | 72 (100.0%) | 24 (33.3%) |
| Total | 385 (41.9%) | 540 (58.8%) |
Disability Status by Sex by Age in Lake Michigan Beach
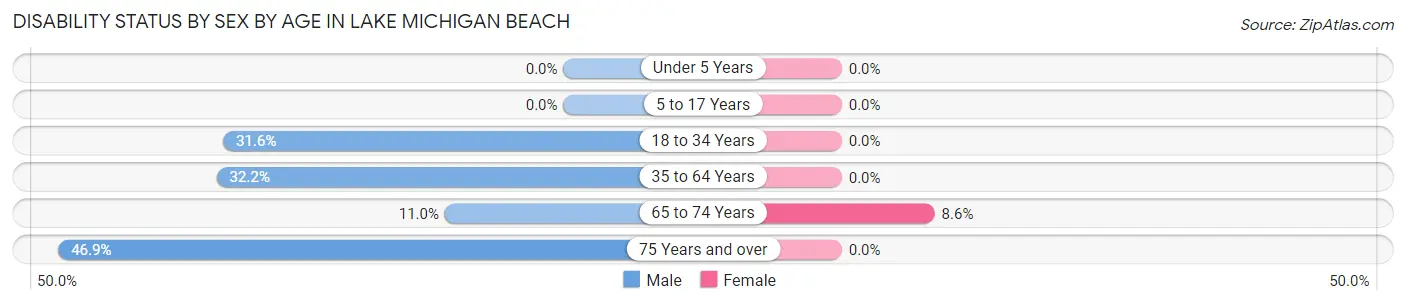
| Age Bracket | Male | Female |
| Under 5 Years | 0 (0.0%) | 0 (0.0%) |
| 5 to 17 Years | 0 (0.0%) | 0 (0.0%) |
| 18 to 34 Years | 42 (31.6%) | 0 (0.0%) |
| 35 to 64 Years | 47 (32.2%) | 0 (0.0%) |
| 65 to 74 Years | 11 (11.0%) | 10 (8.6%) |
| 75 Years and over | 30 (46.9%) | 0 (0.0%) |
Disability Class by Sex by Age in Lake Michigan Beach
Disability Class: Hearing Difficulty
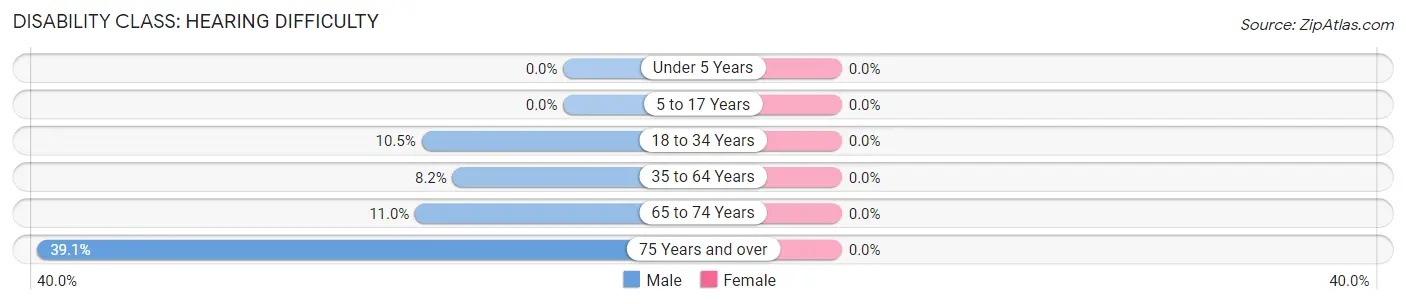
| Age Bracket | Male | Female |
| Under 5 Years | 0 (0.0%) | 0 (0.0%) |
| 5 to 17 Years | 0 (0.0%) | 0 (0.0%) |
| 18 to 34 Years | 14 (10.5%) | 0 (0.0%) |
| 35 to 64 Years | 12 (8.2%) | 0 (0.0%) |
| 65 to 74 Years | 11 (11.0%) | 0 (0.0%) |
| 75 Years and over | 25 (39.1%) | 0 (0.0%) |
Disability Class: Vision Difficulty
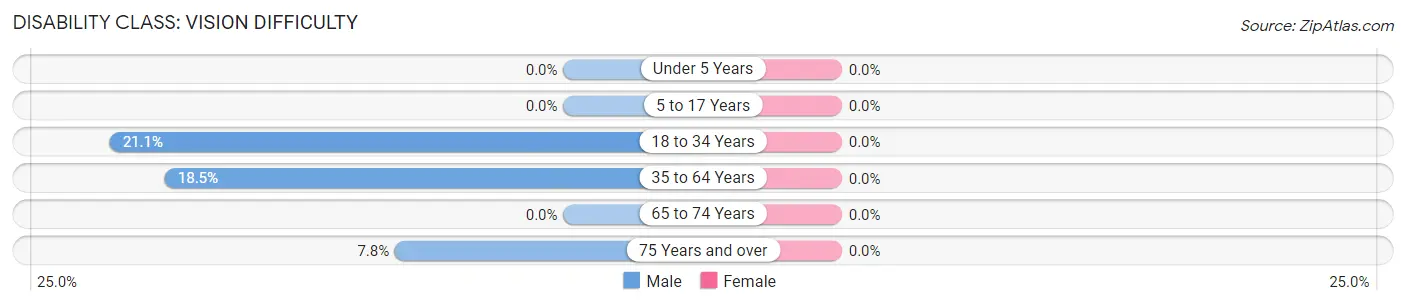
| Age Bracket | Male | Female |
| Under 5 Years | 0 (0.0%) | 0 (0.0%) |
| 5 to 17 Years | 0 (0.0%) | 0 (0.0%) |
| 18 to 34 Years | 28 (21.0%) | 0 (0.0%) |
| 35 to 64 Years | 27 (18.5%) | 0 (0.0%) |
| 65 to 74 Years | 0 (0.0%) | 0 (0.0%) |
| 75 Years and over | 5 (7.8%) | 0 (0.0%) |
Disability Class: Cognitive Difficulty
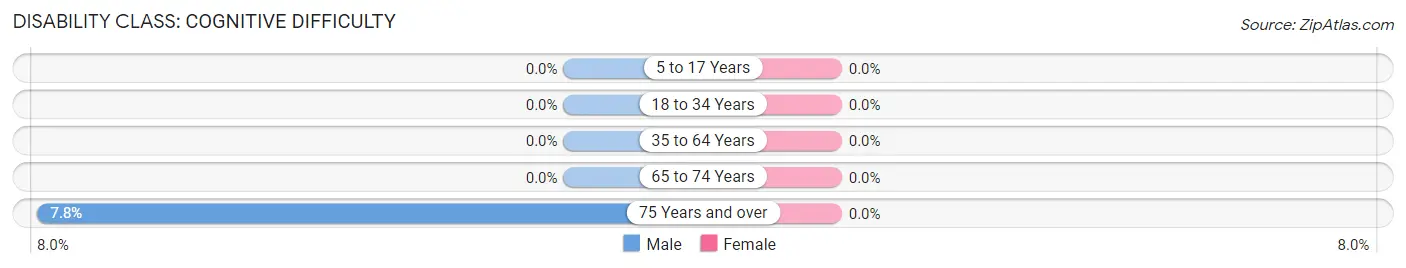
| Age Bracket | Male | Female |
| 5 to 17 Years | 0 (0.0%) | 0 (0.0%) |
| 18 to 34 Years | 0 (0.0%) | 0 (0.0%) |
| 35 to 64 Years | 0 (0.0%) | 0 (0.0%) |
| 65 to 74 Years | 0 (0.0%) | 0 (0.0%) |
| 75 Years and over | 5 (7.8%) | 0 (0.0%) |
Disability Class: Ambulatory Difficulty
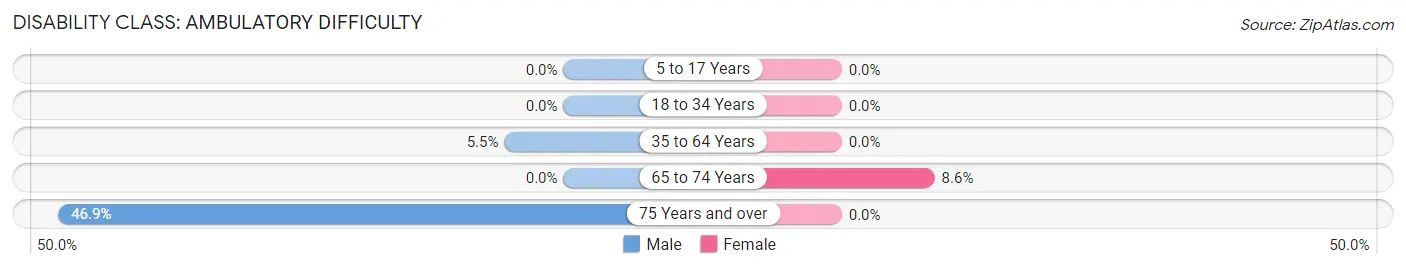
| Age Bracket | Male | Female |
| 5 to 17 Years | 0 (0.0%) | 0 (0.0%) |
| 18 to 34 Years | 0 (0.0%) | 0 (0.0%) |
| 35 to 64 Years | 8 (5.5%) | 0 (0.0%) |
| 65 to 74 Years | 0 (0.0%) | 10 (8.6%) |
| 75 Years and over | 30 (46.9%) | 0 (0.0%) |
Disability Class: Self-Care Difficulty

| Age Bracket | Male | Female |
| 5 to 17 Years | 0 (0.0%) | 0 (0.0%) |
| 18 to 34 Years | 0 (0.0%) | 0 (0.0%) |
| 35 to 64 Years | 0 (0.0%) | 0 (0.0%) |
| 65 to 74 Years | 0 (0.0%) | 0 (0.0%) |
| 75 Years and over | 5 (7.8%) | 0 (0.0%) |
Technology Access in Lake Michigan Beach
Computing Device Access in Lake Michigan Beach
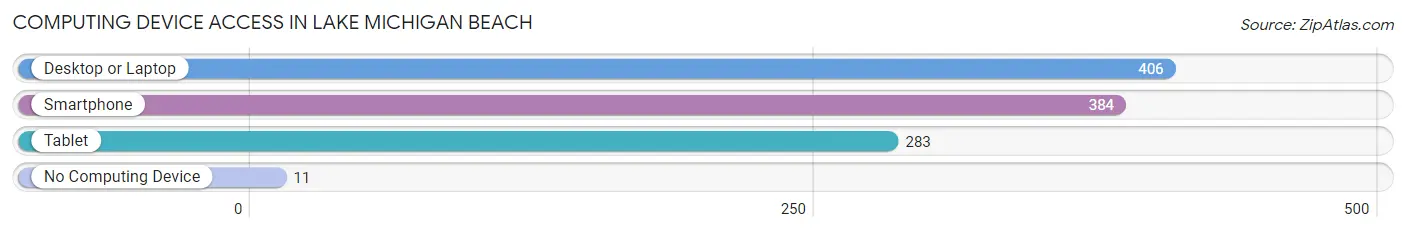
| Device Type | # Households | % Households |
| Desktop or Laptop | 406 | 90.0% |
| Smartphone | 384 | 85.1% |
| Tablet | 283 | 62.7% |
| No Computing Device | 11 | 2.4% |
| Total | 451 | 100.0% |
Internet Access in Lake Michigan Beach
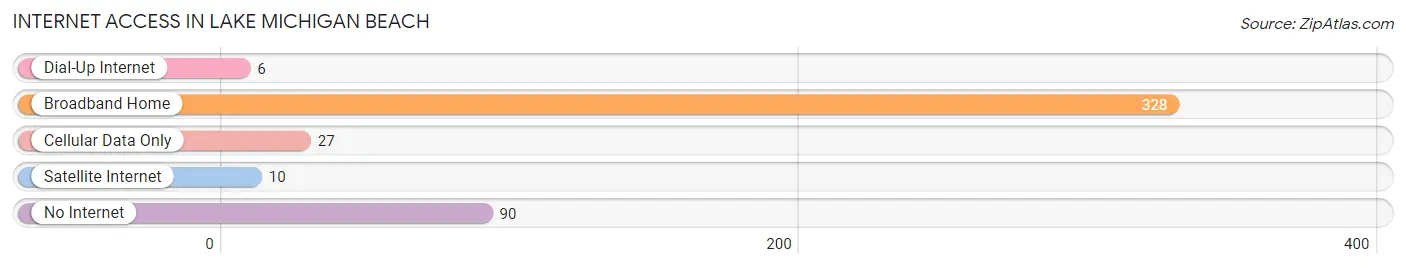
| Internet Type | # Households | % Households |
| Dial-Up Internet | 6 | 1.3% |
| Broadband Home | 328 | 72.7% |
| Cellular Data Only | 27 | 6.0% |
| Satellite Internet | 10 | 2.2% |
| No Internet | 90 | 20.0% |
| Total | 451 | 100.0% |
Lake Michigan Beach Summary
Introduction
Lake Michigan Beach is a small town located in the state of Michigan, United States. It is situated on the eastern shore of Lake Michigan, the fifth largest lake in the world. The town is known for its beautiful beaches, which attract tourists from all over the world. The town has a population of approximately 1,000 people and is a popular destination for vacationers and retirees.
History
The area that is now Lake Michigan Beach was first settled in the early 1800s by French fur traders. The town was originally known as “Lac des Chats”, which translates to “Lake of the Cats”. The town was later renamed to Lake Michigan Beach in 1837.
The town was a popular destination for vacationers and retirees in the late 19th and early 20th centuries. The town was also a popular spot for fishing and boating. In the 1950s, the town began to experience a decline in population as people moved away to larger cities.
Geography
Lake Michigan Beach is located on the eastern shore of Lake Michigan. The town is situated on a peninsula that juts out into the lake. The town is surrounded by the lake on three sides and is bordered by the towns of Grand Haven and Muskegon to the north and south, respectively.
The town has a total area of 1.2 square miles, all of which is land. The town has a total elevation of 645 feet above sea level. The town is located in a temperate climate zone and experiences warm summers and cold winters.
Economy
The economy of Lake Michigan Beach is largely based on tourism. The town is a popular destination for vacationers and retirees, and the town’s beaches are a major draw for visitors. The town also has a number of restaurants, bars, and shops that cater to tourists.
The town also has a number of small businesses, including a marina, a boat repair shop, and a bait shop. The town also has a number of small manufacturing businesses, including a furniture factory and a woodworking shop.
Demographics
As of the 2010 census, the population of Lake Michigan Beach was 1,000 people. The town has a population density of 833 people per square mile. The town is predominantly white, with 95.7% of the population identifying as white. The town also has a small Hispanic population, with 2.7% of the population identifying as Hispanic or Latino.
Conclusion
Lake Michigan Beach is a small town located on the eastern shore of Lake Michigan. The town is known for its beautiful beaches and is a popular destination for vacationers and retirees. The town has a population of 1,000 people and is predominantly white. The town’s economy is largely based on tourism, and the town also has a number of small businesses.
Common Questions
What is Per Capita Income in Lake Michigan Beach?
Per Capita income in Lake Michigan Beach is $67,609.
What is the Median Family Income in Lake Michigan Beach?
Median Family Income in Lake Michigan Beach is $81,955.
What is the Median Household income in Lake Michigan Beach?
Median Household Income in Lake Michigan Beach is $81,023.
What is Income or Wage Gap in Lake Michigan Beach?
Income or Wage Gap in Lake Michigan Beach is 24.8%.
Women in Lake Michigan Beach earn 75.2 cents for every dollar earned by a man.
What is Inequality or Gini Index in Lake Michigan Beach?
Inequality or Gini Index in Lake Michigan Beach is 0.57.
What is the Total Population of Lake Michigan Beach?
Total Population of Lake Michigan Beach is 918.
What is the Total Male Population of Lake Michigan Beach?
Total Male Population of Lake Michigan Beach is 501.
What is the Total Female Population of Lake Michigan Beach?
Total Female Population of Lake Michigan Beach is 417.
What is the Ratio of Males per 100 Females in Lake Michigan Beach?
There are 120.14 Males per 100 Females in Lake Michigan Beach.
What is the Ratio of Females per 100 Males in Lake Michigan Beach?
There are 83.23 Females per 100 Males in Lake Michigan Beach.
What is the Median Population Age in Lake Michigan Beach?
Median Population Age in Lake Michigan Beach is 49.1 Years.
What is the Average Family Size in Lake Michigan Beach
Average Family Size in Lake Michigan Beach is 2.7 People.
What is the Average Household Size in Lake Michigan Beach
Average Household Size in Lake Michigan Beach is 2.0 People.
How Large is the Labor Force in Lake Michigan Beach?
There are 488 People in the Labor Forcein in Lake Michigan Beach.
What is the Percentage of People in the Labor Force in Lake Michigan Beach?
59.9% of People are in the Labor Force in Lake Michigan Beach.