Wolverine Lake, MI Map & Demographics
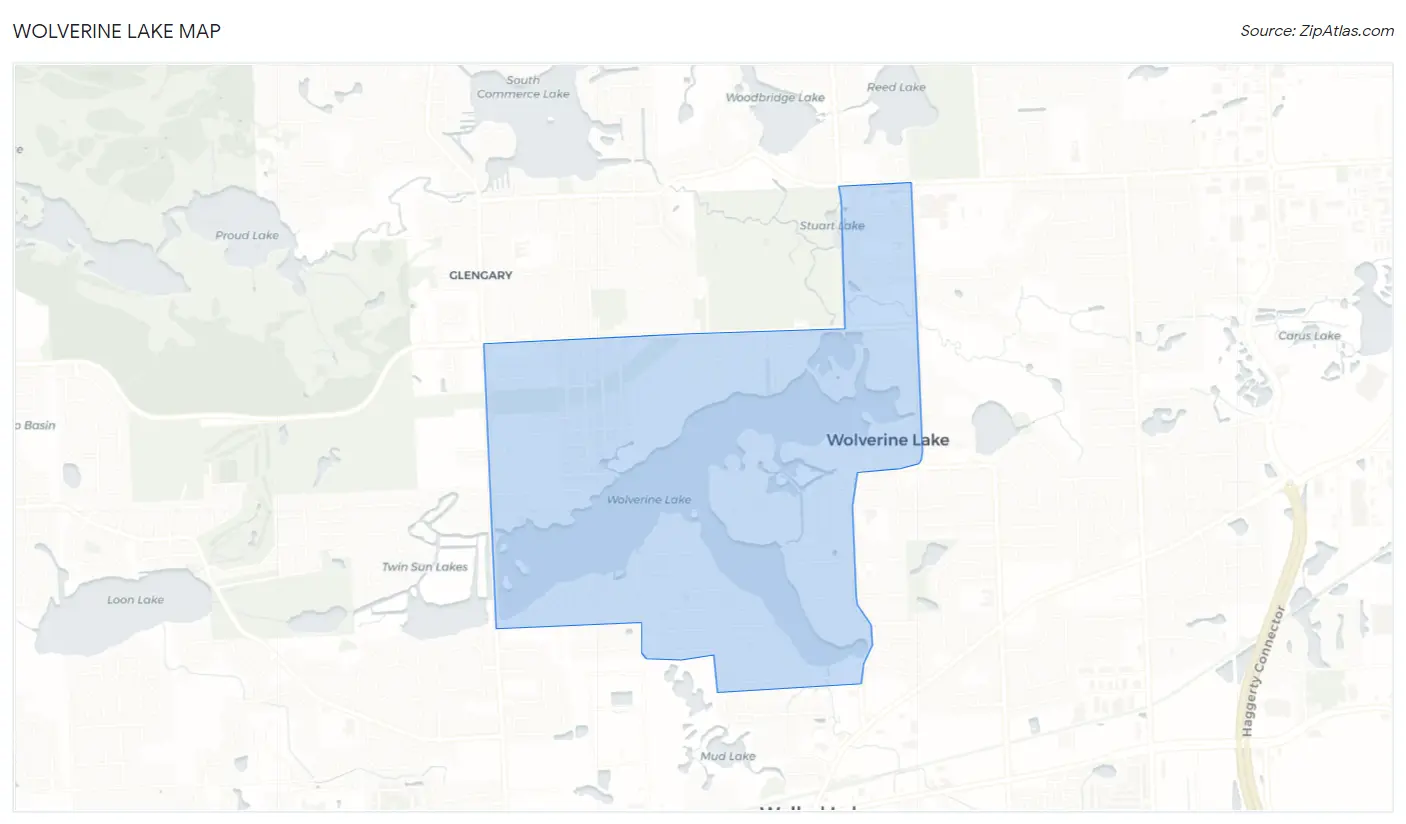
Wolverine Lake Map
Wolverine Lake Overview
$50,595
PER CAPITA INCOME
$111,836
AVG FAMILY INCOME
$85,195
AVG HOUSEHOLD INCOME
41.4%
WAGE / INCOME GAP [ % ]
58.6¢/ $1
WAGE / INCOME GAP [ $ ]
0.44
INEQUALITY / GINI INDEX
4,493
TOTAL POPULATION
2,335
MALE POPULATION
2,158
FEMALE POPULATION
108.20
MALES / 100 FEMALES
92.42
FEMALES / 100 MALES
45.5
MEDIAN AGE
2.9
AVG FAMILY SIZE
2.3
AVG HOUSEHOLD SIZE
2,574
LABOR FORCE [ PEOPLE ]
66.1%
PERCENT IN LABOR FORCE
3.2%
UNEMPLOYMENT RATE
Wolverine Lake Area Codes
Income in Wolverine Lake
Income Overview in Wolverine Lake
Per Capita Income in Wolverine Lake is $50,595, while median incomes of families and households are $111,836 and $85,195 respectively.
| Characteristic | Number | Measure |
| Per Capita Income | 4,493 | $50,595 |
| Median Family Income | 1,197 | $111,836 |
| Mean Family Income | 1,197 | $134,796 |
| Median Household Income | 1,971 | $85,195 |
| Mean Household Income | 1,971 | $114,212 |
| Income Deficit | 1,197 | $0 |
| Wage / Income Gap (%) | 4,493 | 41.41% |
| Wage / Income Gap ($) | 4,493 | 58.59¢ per $1 |
| Gini / Inequality Index | 4,493 | 0.44 |
Earnings by Sex in Wolverine Lake
Average Earnings in Wolverine Lake are $53,468, $60,184 for men and $35,259 for women, a difference of 41.4%.
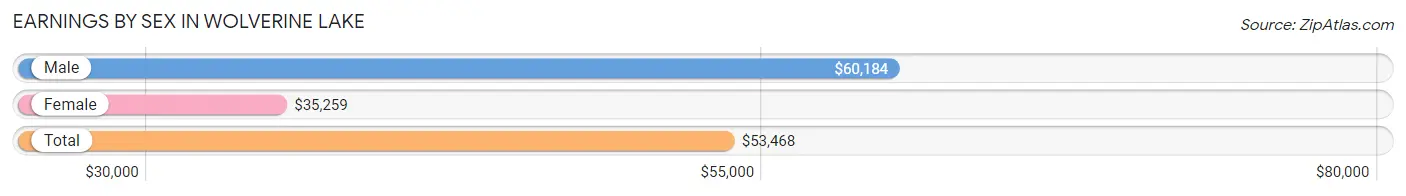
| Sex | Number | Average Earnings |
| Male | 1,455 (54.3%) | $60,184 |
| Female | 1,223 (45.7%) | $35,259 |
| Total | 2,678 (100.0%) | $53,468 |
Earnings by Sex by Income Bracket in Wolverine Lake
The most common earnings brackets in Wolverine Lake are $100,000+ for men (376 | 25.8%) and $65,000 to $74,999 for women (147 | 12.0%).
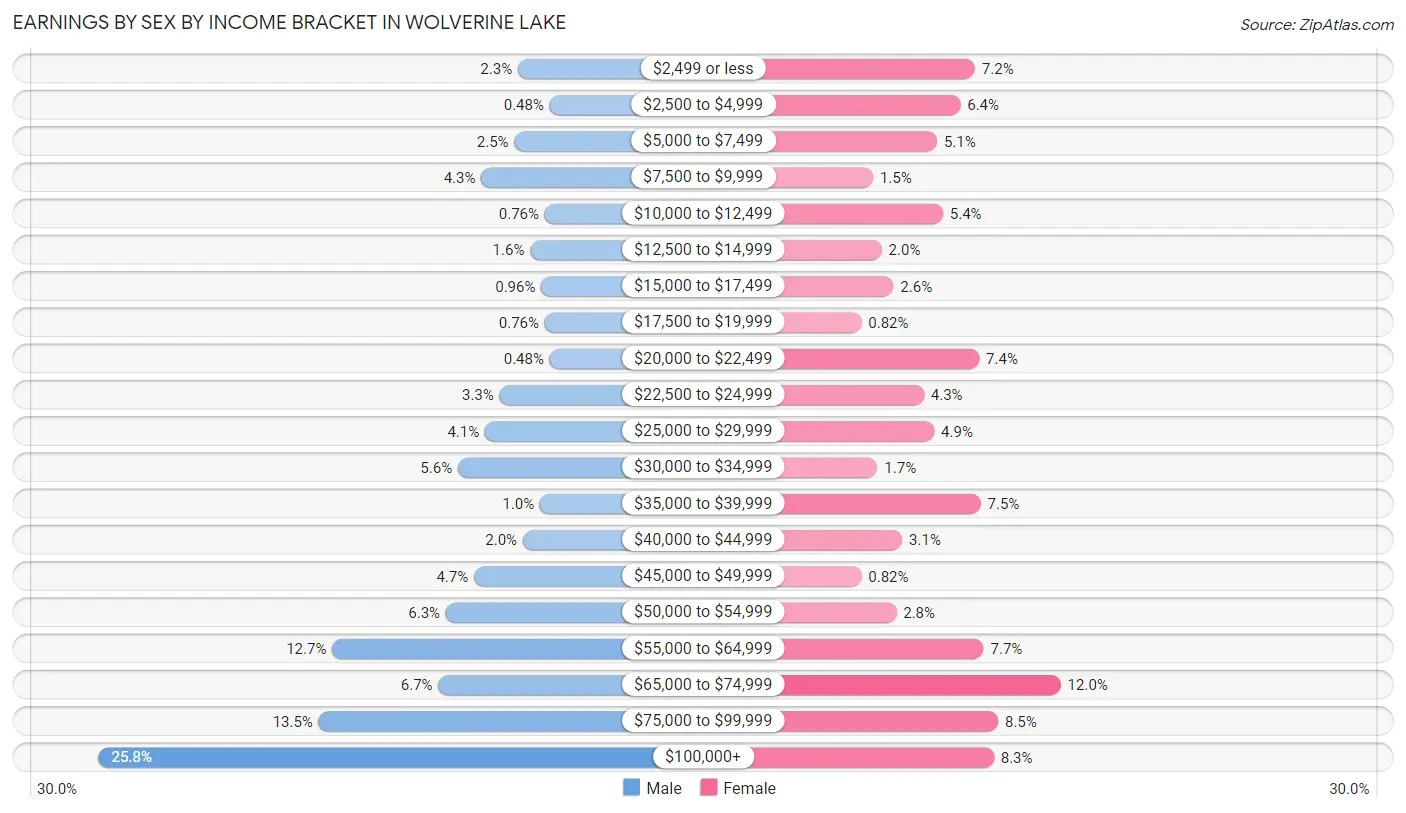
| Income | Male | Female |
| $2,499 or less | 33 (2.3%) | 88 (7.2%) |
| $2,500 to $4,999 | 7 (0.5%) | 78 (6.4%) |
| $5,000 to $7,499 | 36 (2.5%) | 62 (5.1%) |
| $7,500 to $9,999 | 63 (4.3%) | 18 (1.5%) |
| $10,000 to $12,499 | 11 (0.8%) | 66 (5.4%) |
| $12,500 to $14,999 | 23 (1.6%) | 24 (2.0%) |
| $15,000 to $17,499 | 14 (1.0%) | 32 (2.6%) |
| $17,500 to $19,999 | 11 (0.8%) | 10 (0.8%) |
| $20,000 to $22,499 | 7 (0.5%) | 91 (7.4%) |
| $22,500 to $24,999 | 48 (3.3%) | 53 (4.3%) |
| $25,000 to $29,999 | 60 (4.1%) | 60 (4.9%) |
| $30,000 to $34,999 | 82 (5.6%) | 21 (1.7%) |
| $35,000 to $39,999 | 15 (1.0%) | 92 (7.5%) |
| $40,000 to $44,999 | 29 (2.0%) | 38 (3.1%) |
| $45,000 to $49,999 | 69 (4.7%) | 10 (0.8%) |
| $50,000 to $54,999 | 92 (6.3%) | 34 (2.8%) |
| $55,000 to $64,999 | 185 (12.7%) | 94 (7.7%) |
| $65,000 to $74,999 | 98 (6.7%) | 147 (12.0%) |
| $75,000 to $99,999 | 196 (13.5%) | 104 (8.5%) |
| $100,000+ | 376 (25.8%) | 101 (8.3%) |
| Total | 1,455 (100.0%) | 1,223 (100.0%) |
Earnings by Sex by Educational Attainment in Wolverine Lake
Average earnings in Wolverine Lake are $70,000 for men and $37,393 for women, a difference of 46.6%. Men with an educational attainment of bachelor's degree enjoy the highest average annual earnings of $117,232, while those with high school diploma education earn the least with $51,100. Women with an educational attainment of bachelor's degree earn the most with the average annual earnings of $54,750, while those with graduate degree education have the smallest earnings of $16,711.
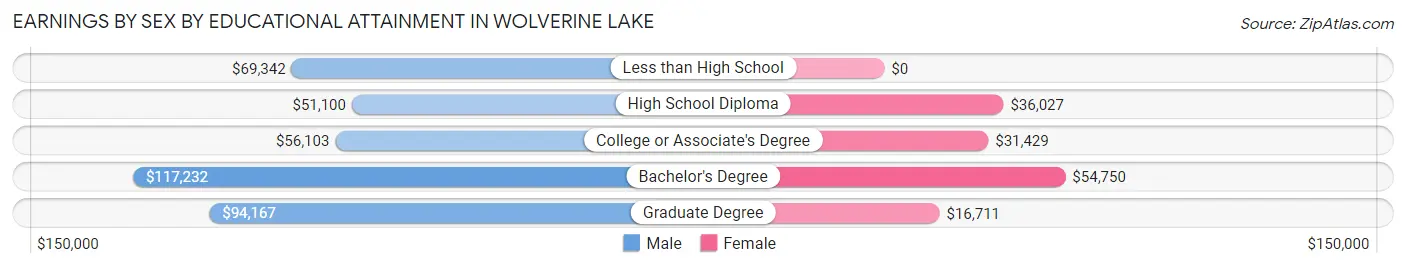
| Educational Attainment | Male Income | Female Income |
| Less than High School | $69,342 | $0 |
| High School Diploma | $51,100 | $36,027 |
| College or Associate's Degree | $56,103 | $31,429 |
| Bachelor's Degree | $117,232 | $54,750 |
| Graduate Degree | $94,167 | $16,711 |
| Total | $70,000 | $37,393 |
Family Income in Wolverine Lake
Family Income Brackets in Wolverine Lake
According to the Wolverine Lake family income data, there are 424 families falling into the $100,000 to $149,999 income range, which is the most common income bracket and makes up 35.4% of all families.
| Income Bracket | # Families | % Families |
| Less than $10,000 | 10 | 0.8% |
| $10,000 to $14,999 | 0 | 0.0% |
| $15,000 to $24,999 | 36 | 3.0% |
| $25,000 to $34,999 | 17 | 1.4% |
| $35,000 to $49,999 | 74 | 6.2% |
| $50,000 to $74,999 | 267 | 22.3% |
| $75,000 to $99,999 | 77 | 6.4% |
| $100,000 to $149,999 | 424 | 35.4% |
| $150,000 to $199,999 | 108 | 9.0% |
| $200,000+ | 184 | 15.4% |
Family Income by Famaliy Size in Wolverine Lake
6-person families (30 | 2.5%) account for the highest median family income in Wolverine Lake with $250,001 per family, while 2-person families (567 | 47.4%) have the highest median income of $50,764 per family member.
| Income Bracket | # Families | Median Income |
| 2-Person Families | 567 (47.4%) | $101,528 |
| 3-Person Families | 363 (30.3%) | $118,472 |
| 4-Person Families | 194 (16.2%) | $123,929 |
| 5-Person Families | 43 (3.6%) | $109,375 |
| 6-Person Families | 30 (2.5%) | $250,001 |
| 7+ Person Families | 0 (0.0%) | $0 |
| Total | 1,197 (100.0%) | $111,836 |
Family Income by Number of Earners in Wolverine Lake
The median family income in Wolverine Lake is $111,836, with families comprising 3+ earners (138) having the highest median family income of $190,357, while families with no earners (146) have the lowest median family income of $46,875, accounting for 11.5% and 12.2% of families, respectively.
| Number of Earners | # Families | Median Income |
| No Earners | 146 (12.2%) | $46,875 |
| 1 Earner | 286 (23.9%) | $56,801 |
| 2 Earners | 627 (52.4%) | $124,647 |
| 3+ Earners | 138 (11.5%) | $190,357 |
| Total | 1,197 (100.0%) | $111,836 |
Household Income in Wolverine Lake
Household Income Brackets in Wolverine Lake
With 534 households falling in the category, the $100,000 to $149,999 income range is the most frequent in Wolverine Lake, accounting for 27.1% of all households. In contrast, only 43 households (2.2%) fall into the less than $10,000 income bracket, making it the least populous group.
| Income Bracket | # Households | % Households |
| Less than $10,000 | 43 | 2.2% |
| $10,000 to $14,999 | 47 | 2.4% |
| $15,000 to $24,999 | 97 | 4.9% |
| $25,000 to $34,999 | 83 | 4.2% |
| $35,000 to $49,999 | 205 | 10.4% |
| $50,000 to $74,999 | 473 | 24.0% |
| $75,000 to $99,999 | 122 | 6.2% |
| $100,000 to $149,999 | 534 | 27.1% |
| $150,000 to $199,999 | 170 | 8.6% |
| $200,000+ | 197 | 10.0% |
Household Income by Householder Age in Wolverine Lake
The median household income in Wolverine Lake is $85,195, with the highest median household income of $122,935 found in the 45 to 64 years age bracket for the primary householder. A total of 770 households (39.1%) fall into this category. Meanwhile, the 15 to 24 years age bracket for the primary householder has the lowest median household income of $0, with 38 households (1.9%) in this group.
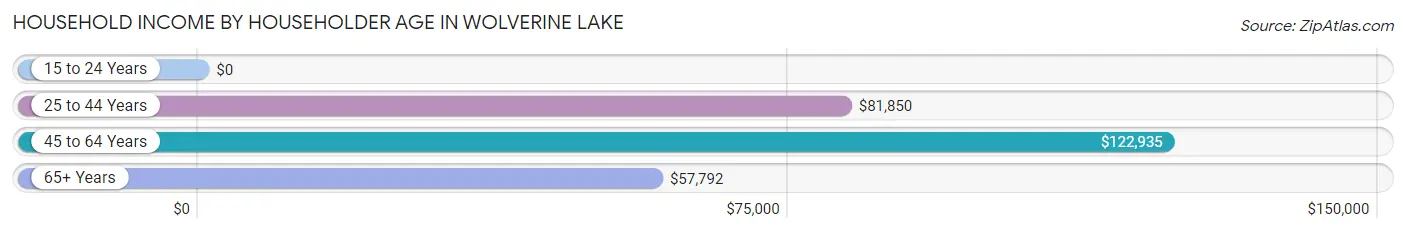
| Income Bracket | # Households | Median Income |
| 15 to 24 Years | 38 (1.9%) | $0 |
| 25 to 44 Years | 549 (27.9%) | $81,850 |
| 45 to 64 Years | 770 (39.1%) | $122,935 |
| 65+ Years | 614 (31.1%) | $57,792 |
| Total | 1,971 (100.0%) | $85,195 |
Poverty in Wolverine Lake
Income Below Poverty by Sex and Age in Wolverine Lake
With 5.1% poverty level for males and 6.3% for females among the residents of Wolverine Lake, 18 to 24 year old males and 18 to 24 year old females are the most vulnerable to poverty, with 41 males (20.0%) and 36 females (18.9%) in their respective age groups living below the poverty level.
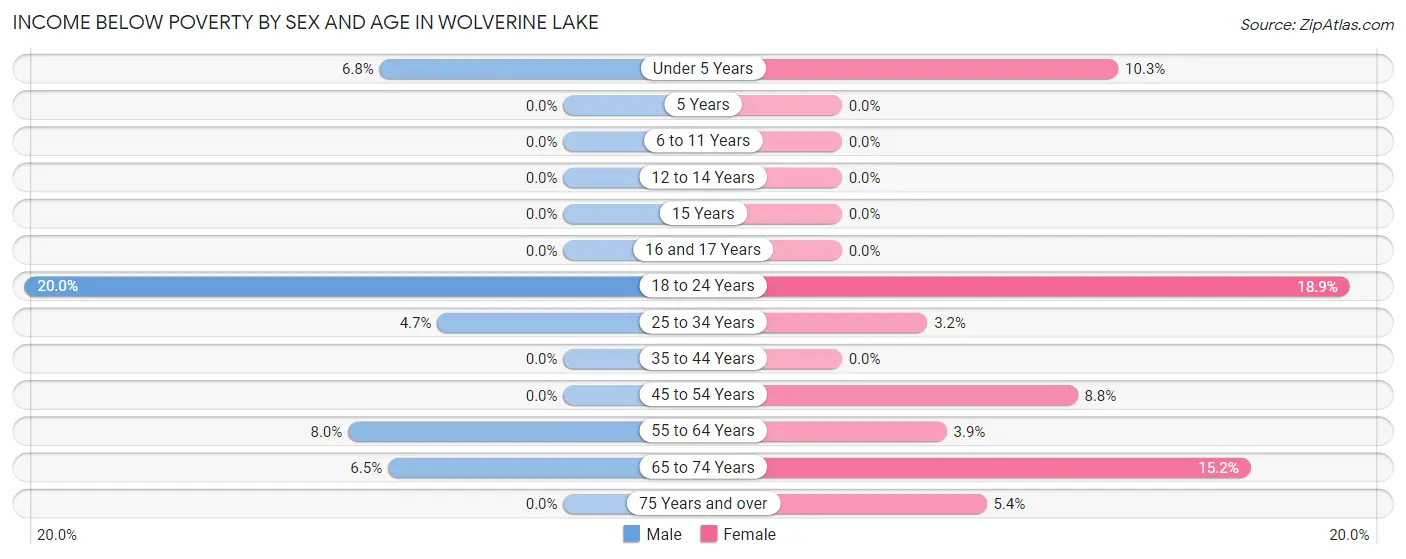
| Age Bracket | Male | Female |
| Under 5 Years | 9 (6.8%) | 8 (10.3%) |
| 5 Years | 0 (0.0%) | 0 (0.0%) |
| 6 to 11 Years | 0 (0.0%) | 0 (0.0%) |
| 12 to 14 Years | 0 (0.0%) | 0 (0.0%) |
| 15 Years | 0 (0.0%) | 0 (0.0%) |
| 16 and 17 Years | 0 (0.0%) | 0 (0.0%) |
| 18 to 24 Years | 41 (20.0%) | 36 (18.9%) |
| 25 to 34 Years | 14 (4.7%) | 10 (3.2%) |
| 35 to 44 Years | 0 (0.0%) | 0 (0.0%) |
| 45 to 54 Years | 0 (0.0%) | 21 (8.7%) |
| 55 to 64 Years | 35 (8.0%) | 18 (3.9%) |
| 65 to 74 Years | 19 (6.5%) | 32 (15.2%) |
| 75 Years and over | 0 (0.0%) | 11 (5.4%) |
| Total | 118 (5.1%) | 136 (6.3%) |
Income Above Poverty by Sex and Age in Wolverine Lake
According to the poverty statistics in Wolverine Lake, males aged 6 to 11 years and females aged 6 to 11 years are the age groups that are most secure financially, with 100.0% of males and 100.0% of females in these age groups living above the poverty line.
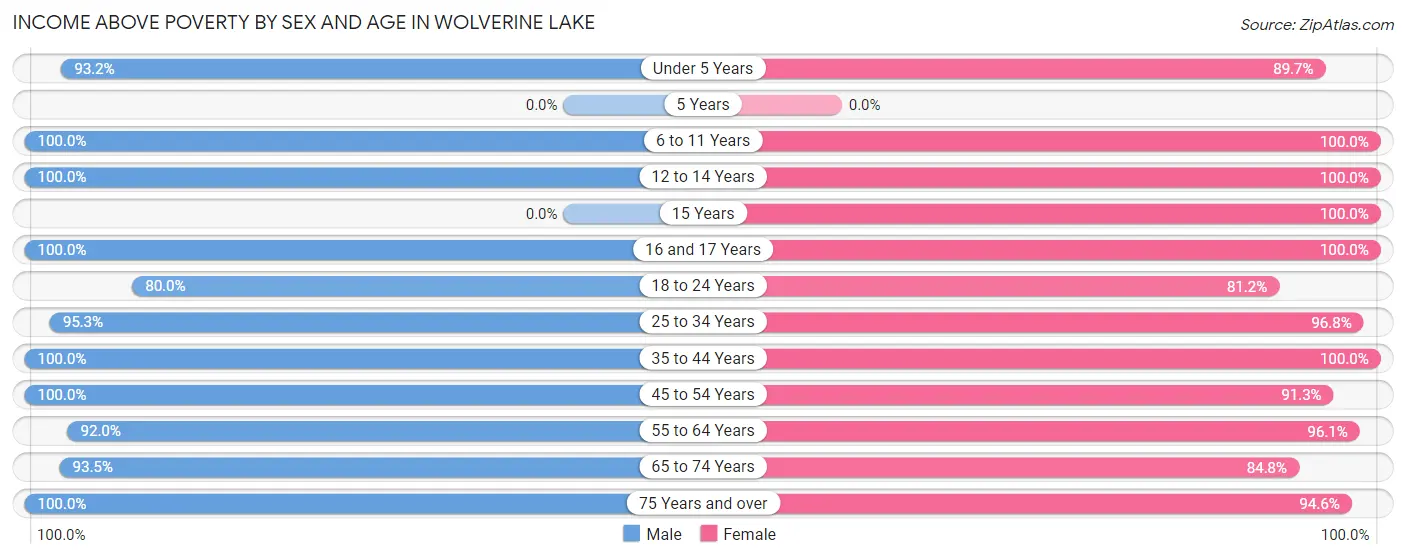
| Age Bracket | Male | Female |
| Under 5 Years | 123 (93.2%) | 70 (89.7%) |
| 5 Years | 0 (0.0%) | 0 (0.0%) |
| 6 to 11 Years | 108 (100.0%) | 67 (100.0%) |
| 12 to 14 Years | 101 (100.0%) | 104 (100.0%) |
| 15 Years | 0 (0.0%) | 9 (100.0%) |
| 16 and 17 Years | 65 (100.0%) | 78 (100.0%) |
| 18 to 24 Years | 164 (80.0%) | 155 (81.1%) |
| 25 to 34 Years | 285 (95.3%) | 305 (96.8%) |
| 35 to 44 Years | 281 (100.0%) | 197 (100.0%) |
| 45 to 54 Years | 276 (100.0%) | 219 (91.2%) |
| 55 to 64 Years | 403 (92.0%) | 445 (96.1%) |
| 65 to 74 Years | 273 (93.5%) | 179 (84.8%) |
| 75 Years and over | 138 (100.0%) | 194 (94.6%) |
| Total | 2,217 (95.0%) | 2,022 (93.7%) |
Income Below Poverty Among Married-Couple Families in Wolverine Lake
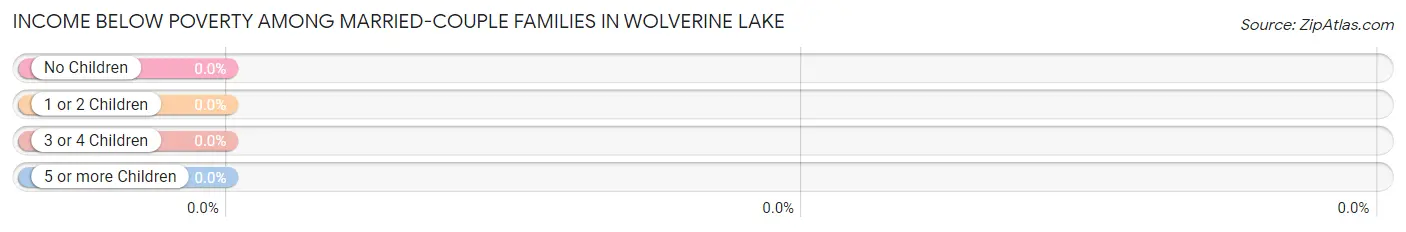
| Children | Above Poverty | Below Poverty |
| No Children | 672 (100.0%) | 0 (0.0%) |
| 1 or 2 Children | 251 (100.0%) | 0 (0.0%) |
| 3 or 4 Children | 54 (100.0%) | 0 (0.0%) |
| 5 or more Children | 0 (0.0%) | 0 (0.0%) |
| Total | 977 (100.0%) | 0 (0.0%) |
Income Below Poverty Among Single-Parent Households in Wolverine Lake
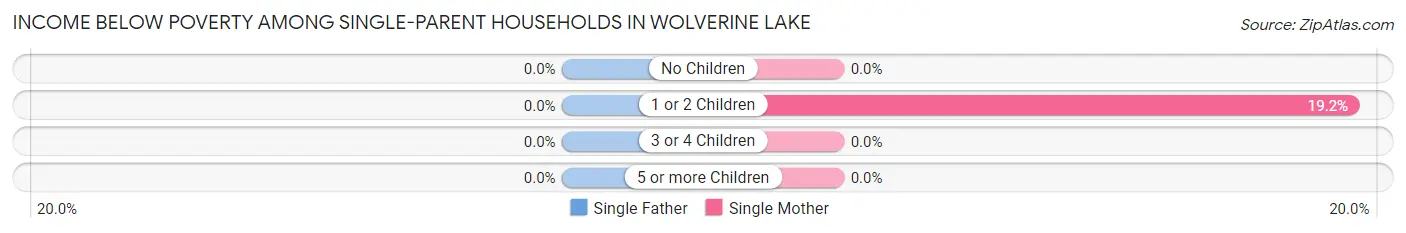
| Children | Single Father | Single Mother |
| No Children | 0 (0.0%) | 0 (0.0%) |
| 1 or 2 Children | 0 (0.0%) | 10 (19.2%) |
| 3 or 4 Children | 0 (0.0%) | 0 (0.0%) |
| 5 or more Children | 0 (0.0%) | 0 (0.0%) |
| Total | 0 (0.0%) | 10 (9.1%) |
Income Below Poverty Among Married-Couple vs Single-Parent Households in Wolverine Lake
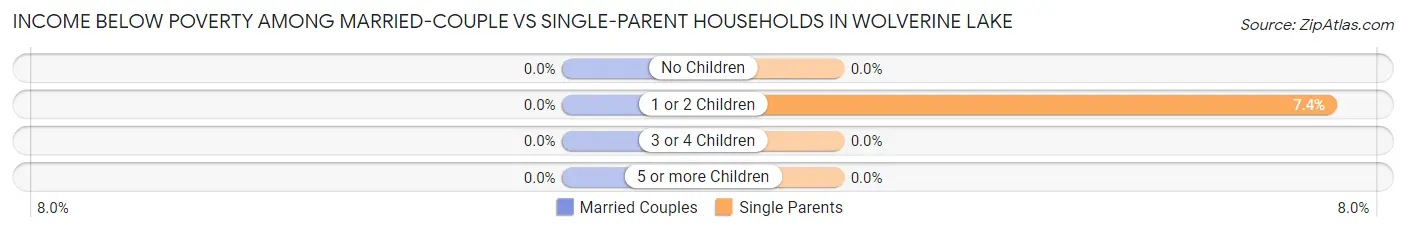
| Children | Married-Couple Families | Single-Parent Households |
| No Children | 0 (0.0%) | 0 (0.0%) |
| 1 or 2 Children | 0 (0.0%) | 10 (7.3%) |
| 3 or 4 Children | 0 (0.0%) | 0 (0.0%) |
| 5 or more Children | 0 (0.0%) | 0 (0.0%) |
| Total | 0 (0.0%) | 10 (4.5%) |
Race in Wolverine Lake
The most populous races in Wolverine Lake are White / Caucasian (4,190 | 93.3%), Two or more Races (205 | 4.6%), and Hispanic or Latino (179 | 4.0%).
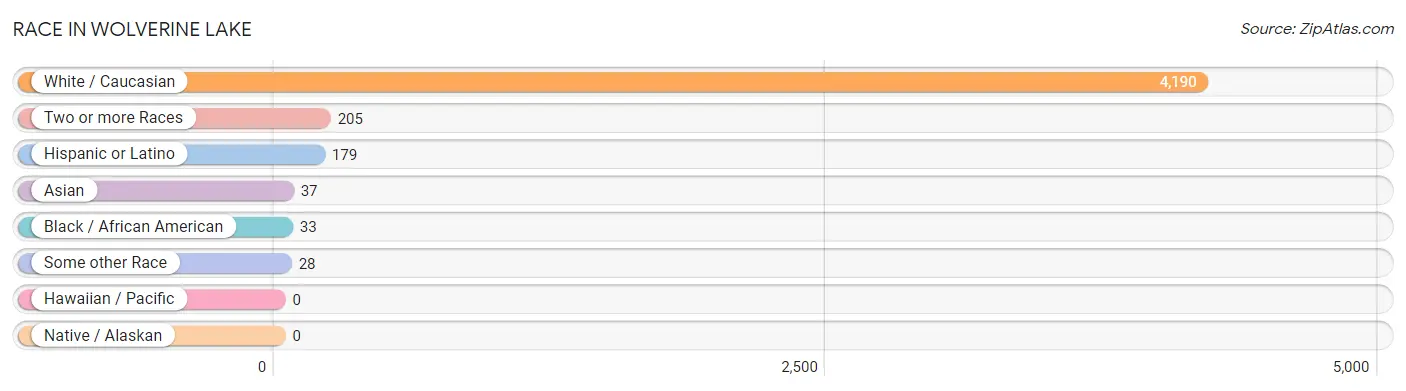
| Race | # Population | % Population |
| Asian | 37 | 0.8% |
| Black / African American | 33 | 0.7% |
| Hawaiian / Pacific | 0 | 0.0% |
| Hispanic or Latino | 179 | 4.0% |
| Native / Alaskan | 0 | 0.0% |
| White / Caucasian | 4,190 | 93.3% |
| Two or more Races | 205 | 4.6% |
| Some other Race | 28 | 0.6% |
| Total | 4,493 | 100.0% |
Ancestry in Wolverine Lake
The most populous ancestries reported in Wolverine Lake are Irish (810 | 18.0%), Polish (785 | 17.5%), German (763 | 17.0%), English (441 | 9.8%), and Italian (329 | 7.3%), together accounting for 69.6% of all Wolverine Lake residents.
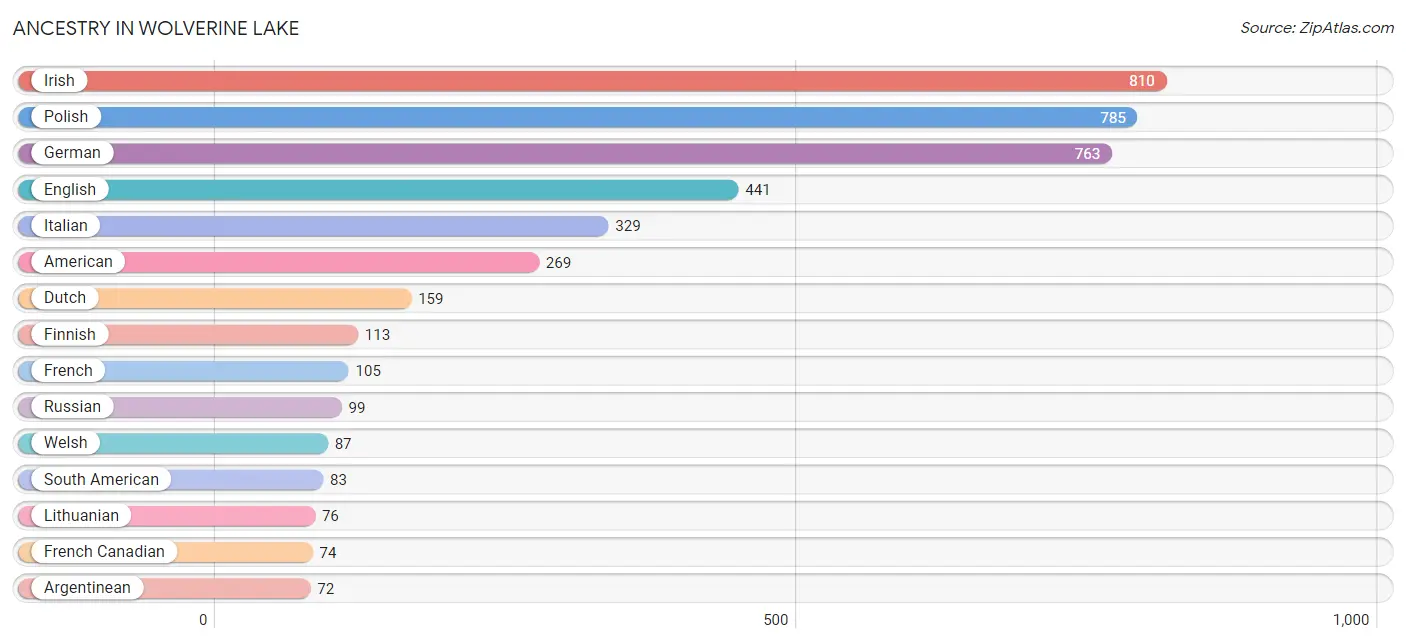
| Ancestry | # Population | % Population |
| American | 269 | 6.0% |
| Arab | 40 | 0.9% |
| Argentinean | 72 | 1.6% |
| Assyrian / Chaldean / Syriac | 24 | 0.5% |
| Austrian | 16 | 0.4% |
| Barbadian | 5 | 0.1% |
| Bhutanese | 30 | 0.7% |
| Blackfeet | 6 | 0.1% |
| British | 10 | 0.2% |
| Bulgarian | 19 | 0.4% |
| Cajun | 6 | 0.1% |
| Canadian | 12 | 0.3% |
| Cherokee | 44 | 1.0% |
| Colombian | 11 | 0.2% |
| Czech | 19 | 0.4% |
| Danish | 5 | 0.1% |
| Dutch | 159 | 3.5% |
| Eastern European | 15 | 0.3% |
| English | 441 | 9.8% |
| European | 24 | 0.5% |
| Finnish | 113 | 2.5% |
| French | 105 | 2.3% |
| French Canadian | 74 | 1.7% |
| German | 763 | 17.0% |
| Greek | 26 | 0.6% |
| Hungarian | 16 | 0.4% |
| Indian (Asian) | 24 | 0.5% |
| Irish | 810 | 18.0% |
| Italian | 329 | 7.3% |
| Korean | 26 | 0.6% |
| Lithuanian | 76 | 1.7% |
| Macedonian | 35 | 0.8% |
| Mexican | 59 | 1.3% |
| Norwegian | 11 | 0.2% |
| Palestinian | 40 | 0.9% |
| Pennsylvania German | 3 | 0.1% |
| Polish | 785 | 17.5% |
| Puerto Rican | 13 | 0.3% |
| Romanian | 58 | 1.3% |
| Russian | 99 | 2.2% |
| Scotch-Irish | 43 | 1.0% |
| Scottish | 70 | 1.6% |
| Slovak | 18 | 0.4% |
| South American | 83 | 1.8% |
| South American Indian | 11 | 0.2% |
| Spaniard | 24 | 0.5% |
| Swedish | 68 | 1.5% |
| Ukrainian | 27 | 0.6% |
| Welsh | 87 | 1.9% |
| Yugoslavian | 11 | 0.2% | View All 50 Rows |
Immigrants in Wolverine Lake
The most numerous immigrant groups reported in Wolverine Lake came from Europe (119 | 2.6%), Latin America (102 | 2.3%), Eastern Europe (84 | 1.9%), South America (83 | 1.8%), and Argentina (72 | 1.6%), together accounting for 10.2% of all Wolverine Lake residents.
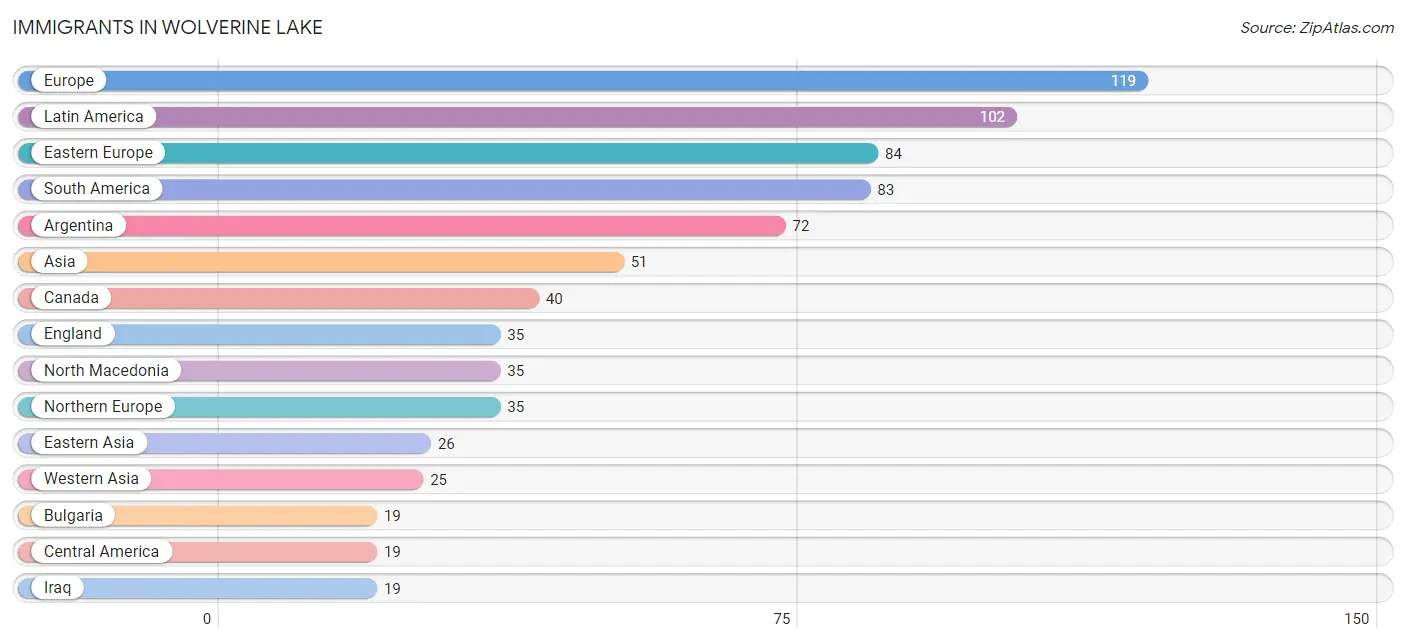
| Immigration Origin | # Population | % Population |
| Argentina | 72 | 1.6% |
| Asia | 51 | 1.1% |
| Bulgaria | 19 | 0.4% |
| Canada | 40 | 0.9% |
| Central America | 19 | 0.4% |
| China | 17 | 0.4% |
| Colombia | 11 | 0.2% |
| Eastern Asia | 26 | 0.6% |
| Eastern Europe | 84 | 1.9% |
| England | 35 | 0.8% |
| Europe | 119 | 2.6% |
| Iraq | 19 | 0.4% |
| Japan | 9 | 0.2% |
| Latin America | 102 | 2.3% |
| Mexico | 19 | 0.4% |
| North Macedonia | 35 | 0.8% |
| Northern Europe | 35 | 0.8% |
| Russia | 19 | 0.4% |
| South America | 83 | 1.8% |
| Western Asia | 25 | 0.6% | View All 20 Rows |
Sex and Age in Wolverine Lake
Sex and Age in Wolverine Lake
The most populous age groups in Wolverine Lake are 60 to 64 Years (229 | 9.8%) for men and 60 to 64 Years (291 | 13.5%) for women.
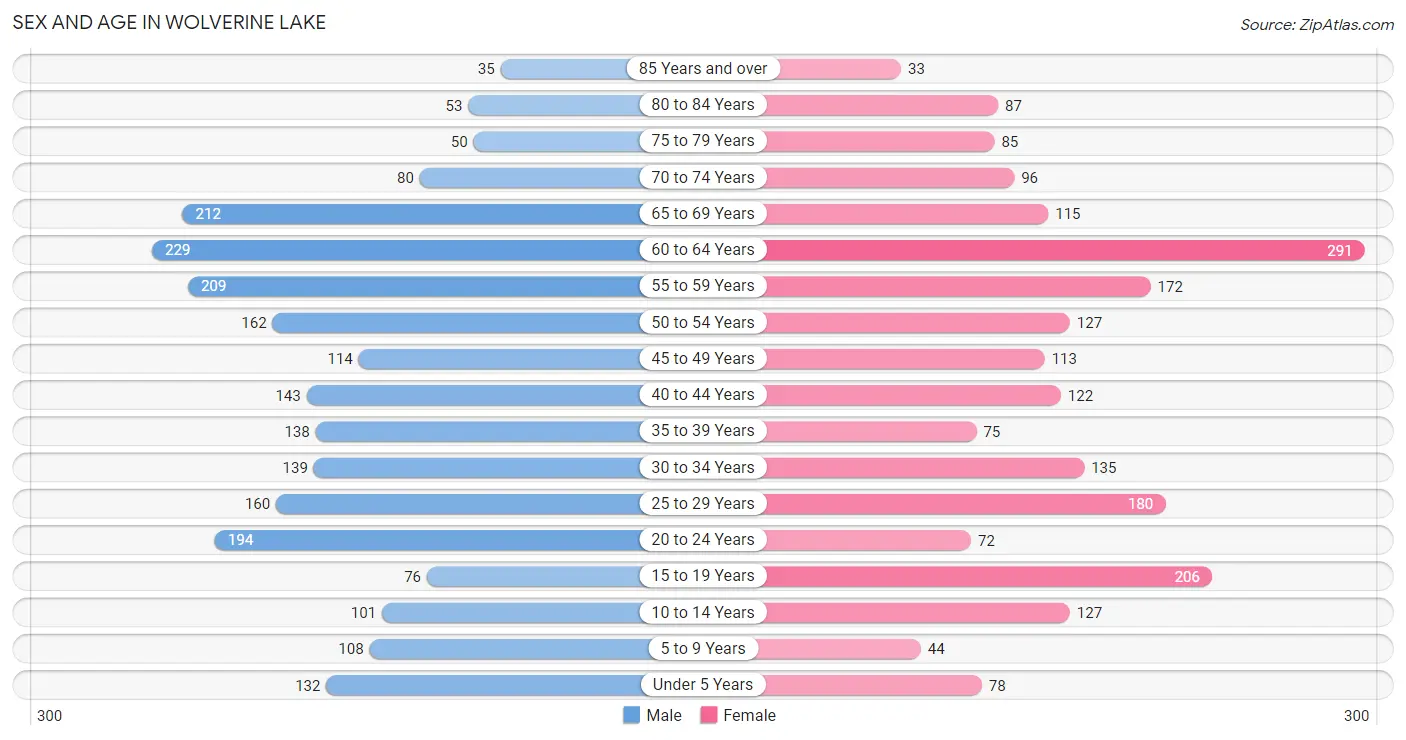
| Age Bracket | Male | Female |
| Under 5 Years | 132 (5.7%) | 78 (3.6%) |
| 5 to 9 Years | 108 (4.6%) | 44 (2.0%) |
| 10 to 14 Years | 101 (4.3%) | 127 (5.9%) |
| 15 to 19 Years | 76 (3.3%) | 206 (9.6%) |
| 20 to 24 Years | 194 (8.3%) | 72 (3.3%) |
| 25 to 29 Years | 160 (6.9%) | 180 (8.3%) |
| 30 to 34 Years | 139 (5.9%) | 135 (6.3%) |
| 35 to 39 Years | 138 (5.9%) | 75 (3.5%) |
| 40 to 44 Years | 143 (6.1%) | 122 (5.7%) |
| 45 to 49 Years | 114 (4.9%) | 113 (5.2%) |
| 50 to 54 Years | 162 (6.9%) | 127 (5.9%) |
| 55 to 59 Years | 209 (8.9%) | 172 (8.0%) |
| 60 to 64 Years | 229 (9.8%) | 291 (13.5%) |
| 65 to 69 Years | 212 (9.1%) | 115 (5.3%) |
| 70 to 74 Years | 80 (3.4%) | 96 (4.4%) |
| 75 to 79 Years | 50 (2.1%) | 85 (3.9%) |
| 80 to 84 Years | 53 (2.3%) | 87 (4.0%) |
| 85 Years and over | 35 (1.5%) | 33 (1.5%) |
| Total | 2,335 (100.0%) | 2,158 (100.0%) |
Families and Households in Wolverine Lake
Median Family Size in Wolverine Lake
The median family size in Wolverine Lake is 2.90 persons per family, with married-couple families (977 | 81.6%) accounting for the largest median family size of 2.94 persons per family. On the other hand, single female/mother families (110 | 9.2%) represent the smallest median family size with 2.70 persons per family.
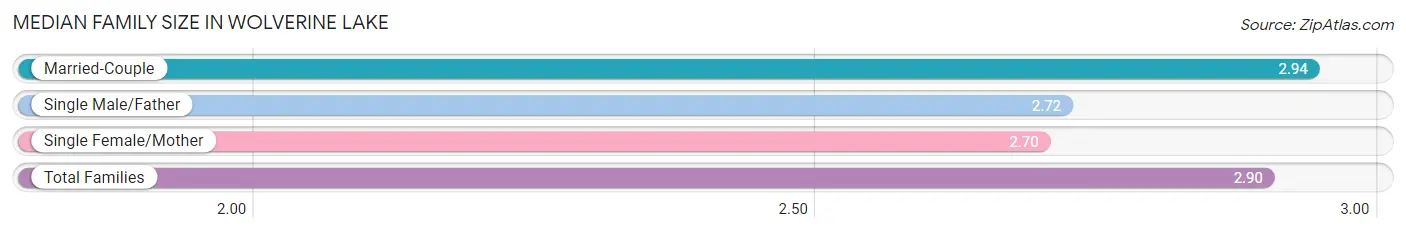
| Family Type | # Families | Family Size |
| Married-Couple | 977 (81.6%) | 2.94 |
| Single Male/Father | 110 (9.2%) | 2.72 |
| Single Female/Mother | 110 (9.2%) | 2.70 |
| Total Families | 1,197 (100.0%) | 2.90 |
Median Household Size in Wolverine Lake
The median household size in Wolverine Lake is 2.28 persons per household, with married-couple households (977 | 49.6%) accounting for the largest median household size of 2.97 persons per household. non-family households (774 | 39.3%) represent the smallest median household size with 1.22 persons per household.
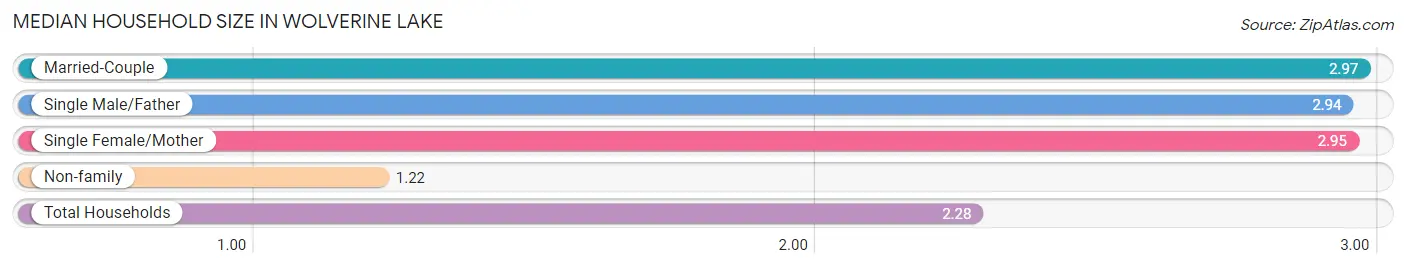
| Household Type | # Households | Household Size |
| Married-Couple | 977 (49.6%) | 2.97 |
| Single Male/Father | 110 (5.6%) | 2.94 |
| Single Female/Mother | 110 (5.6%) | 2.95 |
| Non-family | 774 (39.3%) | 1.22 |
| Total Households | 1,971 (100.0%) | 2.28 |
Household Size by Marriage Status in Wolverine Lake
Out of a total of 1,971 households in Wolverine Lake, 1,197 (60.7%) are family households, while 774 (39.3%) are nonfamily households. The most numerous type of family households are 2-person households, comprising 548, and the most common type of nonfamily households are 1-person households, comprising 622.
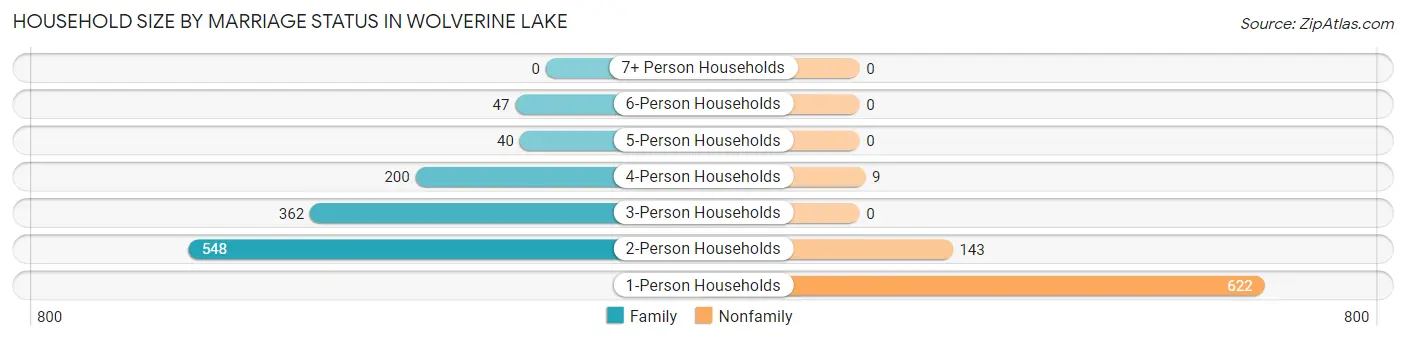
| Household Size | Family Households | Nonfamily Households |
| 1-Person Households | - | 622 (31.6%) |
| 2-Person Households | 548 (27.8%) | 143 (7.3%) |
| 3-Person Households | 362 (18.4%) | 0 (0.0%) |
| 4-Person Households | 200 (10.2%) | 9 (0.5%) |
| 5-Person Households | 40 (2.0%) | 0 (0.0%) |
| 6-Person Households | 47 (2.4%) | 0 (0.0%) |
| 7+ Person Households | 0 (0.0%) | 0 (0.0%) |
| Total | 1,197 (60.7%) | 774 (39.3%) |
Female Fertility in Wolverine Lake
Fertility by Age in Wolverine Lake
Average fertility rate in Wolverine Lake is 40.0 births per 1,000 women. Women in the age bracket of 20 to 34 years have the highest fertility rate with 93.0 births per 1,000 women. Women in the age bracket of 20 to 34 years acount for 100.0% of all women with births.
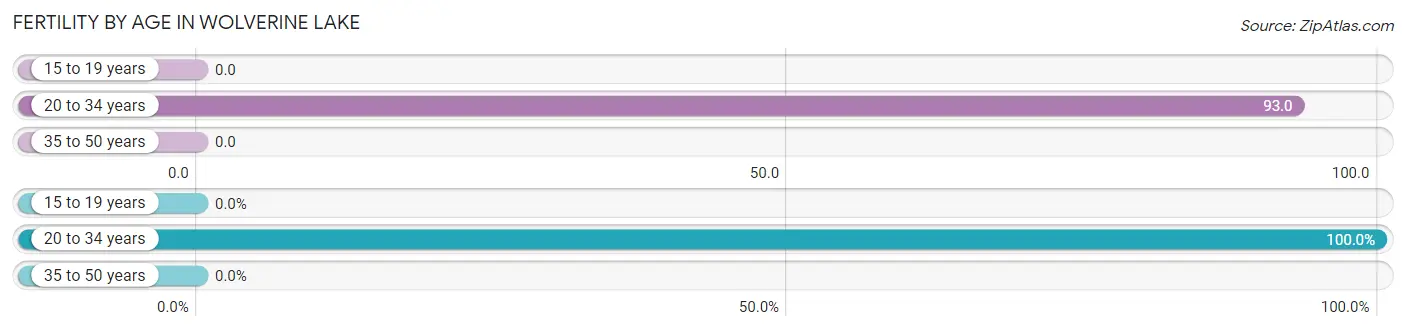
| Age Bracket | Women with Births | Births / 1,000 Women |
| 15 to 19 years | 0 (0.0%) | 0.0 |
| 20 to 34 years | 36 (100.0%) | 93.0 |
| 35 to 50 years | 0 (0.0%) | 0.0 |
| Total | 36 (100.0%) | 40.0 |
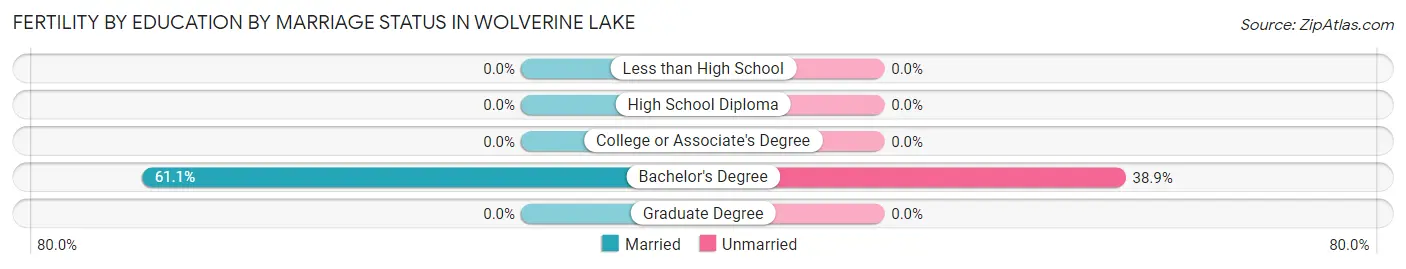
Fertility by Age by Marriage Status in Wolverine Lake
61.1% of women with births (36) in Wolverine Lake are married. The highest percentage of unmarried women with births falls into 20 to 34 years age bracket with 38.9% of them unmarried at the time of birth, while the lowest percentage of unmarried women with births belong to 20 to 34 years age bracket with 38.9% of them unmarried.
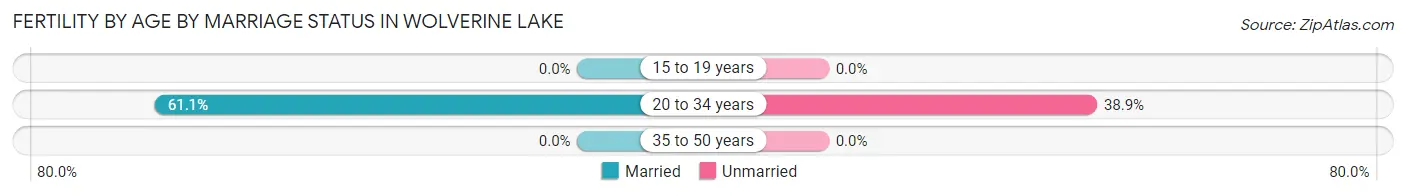
| Age Bracket | Married | Unmarried |
| 15 to 19 years | 0 (0.0%) | 0 (0.0%) |
| 20 to 34 years | 22 (61.1%) | 14 (38.9%) |
| 35 to 50 years | 0 (0.0%) | 0 (0.0%) |
| Total | 22 (61.1%) | 14 (38.9%) |
Fertility by Education in Wolverine Lake
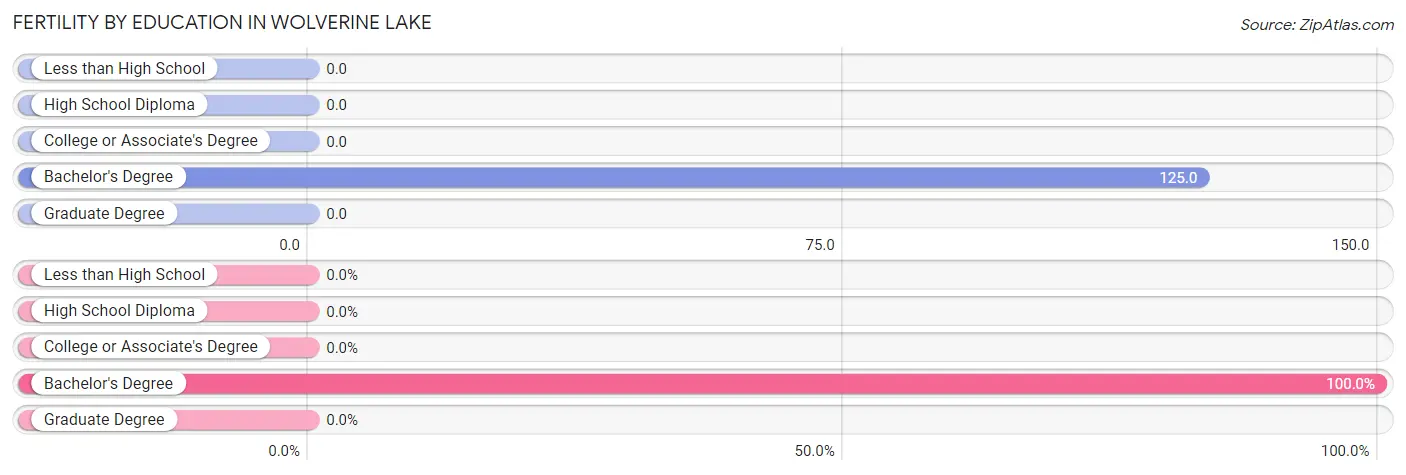
| Educational Attainment | Women with Births | Births / 1,000 Women |
| Less than High School | 0 (0.0%) | 0.0 |
| High School Diploma | 0 (0.0%) | 0.0 |
| College or Associate's Degree | 0 (0.0%) | 0.0 |
| Bachelor's Degree | 36 (100.0%) | 125.0 |
| Graduate Degree | 0 (0.0%) | 0.0 |
| Total | 36 (100.0%) | 40.0 |
Fertility by Education by Marriage Status in Wolverine Lake
38.9% of women with births in Wolverine Lake are unmarried. Women with the educational attainment of bachelor's degree are most likely to be married with 61.1% of them married at childbirth, while women with the educational attainment of bachelor's degree are least likely to be married with 38.9% of them unmarried at childbirth.
| Educational Attainment | Married | Unmarried |
| Less than High School | 0 (0.0%) | 0 (0.0%) |
| High School Diploma | 0 (0.0%) | 0 (0.0%) |
| College or Associate's Degree | 0 (0.0%) | 0 (0.0%) |
| Bachelor's Degree | 22 (61.1%) | 14 (38.9%) |
| Graduate Degree | 0 (0.0%) | 0 (0.0%) |
| Total | 22 (61.1%) | 14 (38.9%) |
Employment Characteristics in Wolverine Lake
Employment by Class of Employer in Wolverine Lake
Among the 2,483 employed individuals in Wolverine Lake, private company employees (1,813 | 73.0%), not-for-profit organizations (164 | 6.6%), and self-employed (incorporated) (159 | 6.4%) make up the most common classes of employment.
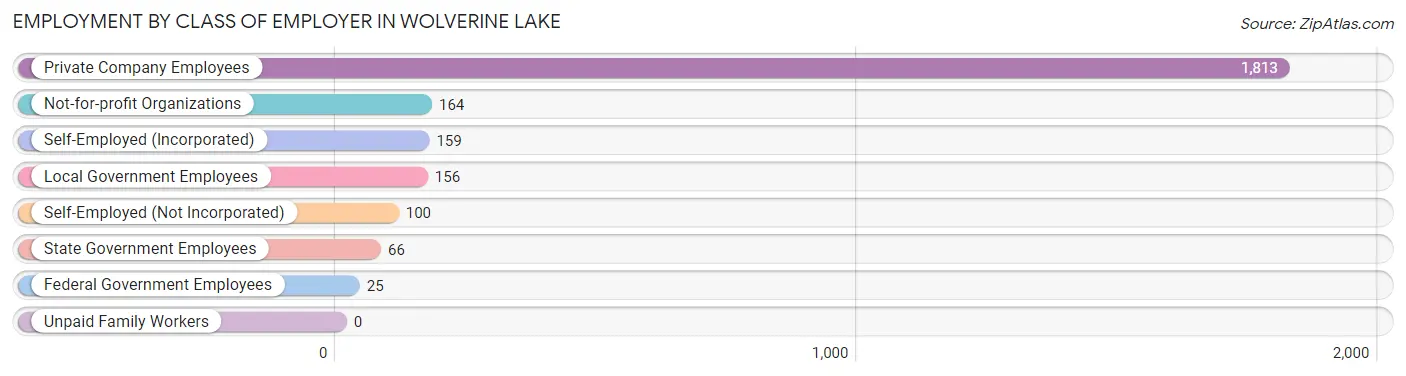
| Employer Class | # Employees | % Employees |
| Private Company Employees | 1,813 | 73.0% |
| Self-Employed (Incorporated) | 159 | 6.4% |
| Self-Employed (Not Incorporated) | 100 | 4.0% |
| Not-for-profit Organizations | 164 | 6.6% |
| Local Government Employees | 156 | 6.3% |
| State Government Employees | 66 | 2.7% |
| Federal Government Employees | 25 | 1.0% |
| Unpaid Family Workers | 0 | 0.0% |
| Total | 2,483 | 100.0% |
Employment Status by Age in Wolverine Lake
According to the labor force statistics for Wolverine Lake, out of the total population over 16 years of age (3,894), 66.1% or 2,574 individuals are in the labor force, with 3.2% or 82 of them unemployed. The age group with the highest labor force participation rate is 30 to 34 years, with 89.8% or 246 individuals in the labor force. Within the labor force, the 20 to 24 years age range has the highest percentage of unemployed individuals, with 17.6% or 35 of them being unemployed.
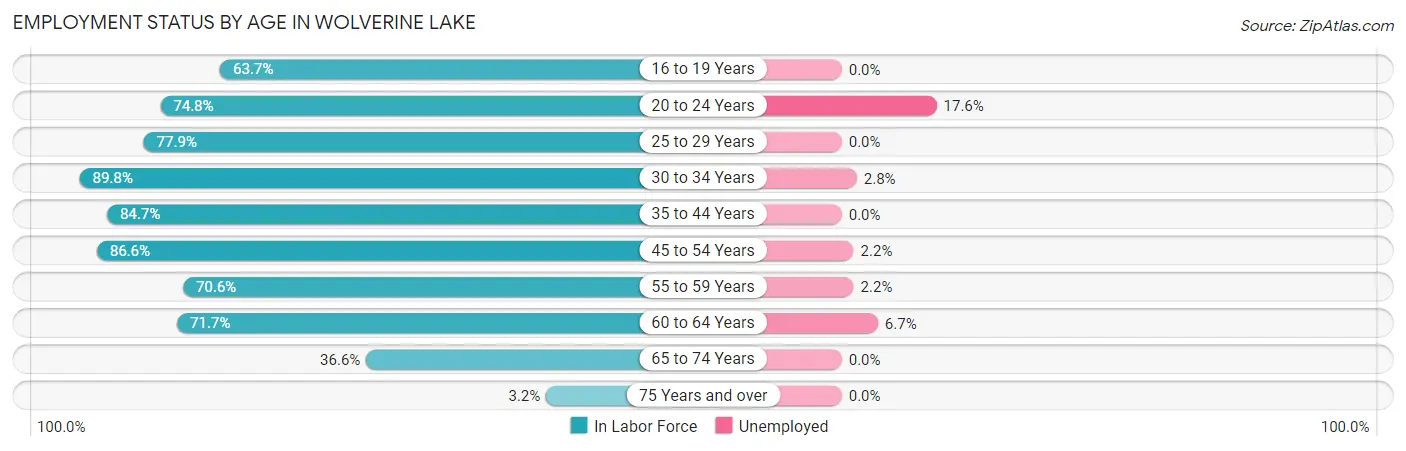
| Age Bracket | In Labor Force | Unemployed |
| 16 to 19 Years | 174 (63.7%) | 0 (0.0%) |
| 20 to 24 Years | 199 (74.8%) | 35 (17.6%) |
| 25 to 29 Years | 265 (77.9%) | 0 (0.0%) |
| 30 to 34 Years | 246 (89.8%) | 7 (2.8%) |
| 35 to 44 Years | 405 (84.7%) | 0 (0.0%) |
| 45 to 54 Years | 447 (86.6%) | 10 (2.2%) |
| 55 to 59 Years | 269 (70.6%) | 6 (2.2%) |
| 60 to 64 Years | 373 (71.7%) | 25 (6.7%) |
| 65 to 74 Years | 184 (36.6%) | 0 (0.0%) |
| 75 Years and over | 11 (3.2%) | 0 (0.0%) |
| Total | 2,574 (66.1%) | 82 (3.2%) |
Employment Status by Educational Attainment in Wolverine Lake
According to labor force statistics for Wolverine Lake, 79.9% of individuals (2,005) out of the total population between 25 and 64 years of age (2,509) are in the labor force, with 2.4% or 48 of them being unemployed. The group with the highest labor force participation rate are those with the educational attainment of college / associate degree, with 87.7% or 756 individuals in the labor force. Within the labor force, individuals with high school diploma education have the highest percentage of unemployment, with 11.1% or 32 of them being unemployed.
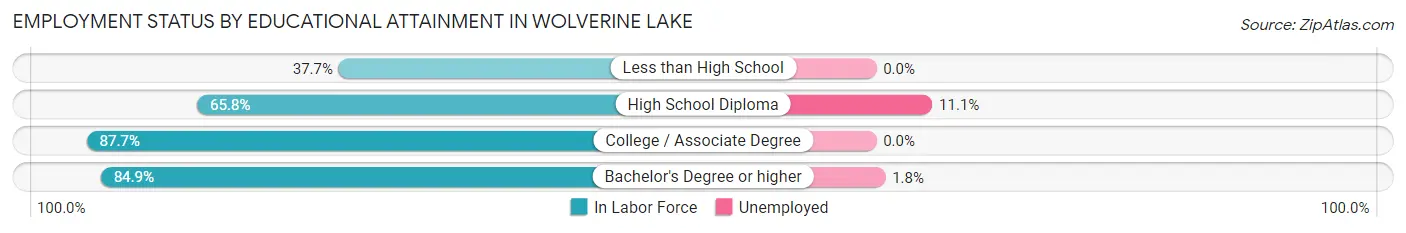
| Educational Attainment | In Labor Force | Unemployed |
| Less than High School | 52 (37.7%) | 0 (0.0%) |
| High School Diploma | 289 (65.8%) | 49 (11.1%) |
| College / Associate Degree | 756 (87.7%) | 0 (0.0%) |
| Bachelor's Degree or higher | 908 (84.9%) | 19 (1.8%) |
| Total | 2,005 (79.9%) | 60 (2.4%) |
Employment Occupations by Sex in Wolverine Lake
Management, Business, Science and Arts Occupations
The most common Management, Business, Science and Arts occupations in Wolverine Lake are Computers, Engineering & Science (311 | 12.5%), Management (300 | 12.0%), Community & Social Service (225 | 9.0%), Architecture & Engineering (154 | 6.2%), and Computers & Mathematics (148 | 5.9%).
Management, Business, Science and Arts Occupations by Sex
Within the Management, Business, Science and Arts occupations in Wolverine Lake, the most male-oriented occupations are Life, Physical & Social Science (100.0%), Education, Arts & Media (100.0%), and Computers & Mathematics (83.1%), while the most female-oriented occupations are Health Technologists (91.4%), Health Diagnosing & Treating (82.0%), and Education Instruction & Library (81.3%).
| Occupation | Male | Female |
| Management | 202 (67.3%) | 98 (32.7%) |
| Business & Financial | 52 (40.9%) | 75 (59.1%) |
| Computers, Engineering & Science | 250 (80.4%) | 61 (19.6%) |
| Computers & Mathematics | 123 (83.1%) | 25 (16.9%) |
| Architecture & Engineering | 118 (76.6%) | 36 (23.4%) |
| Life, Physical & Social Science | 9 (100.0%) | 0 (0.0%) |
| Community & Social Service | 107 (47.6%) | 118 (52.4%) |
| Education, Arts & Media | 42 (100.0%) | 0 (0.0%) |
| Legal Services & Support | 18 (78.3%) | 5 (21.7%) |
| Education Instruction & Library | 17 (18.7%) | 74 (81.3%) |
| Arts, Media & Entertainment | 30 (43.5%) | 39 (56.5%) |
| Health Diagnosing & Treating | 24 (18.0%) | 109 (82.0%) |
| Health Technologists | 9 (8.6%) | 96 (91.4%) |
| Total (Category) | 635 (57.9%) | 461 (42.1%) |
| Total (Overall) | 1,362 (54.7%) | 1,128 (45.3%) |
Services Occupations
The most common Services occupations in Wolverine Lake are Personal Care & Service (85 | 3.4%), Food Preparation & Serving (77 | 3.1%), Security & Protection (74 | 3.0%), Law Enforcement (60 | 2.4%), and Cleaning & Maintenance (25 | 1.0%).
Services Occupations by Sex
Within the Services occupations in Wolverine Lake, the most male-oriented occupations are Firefighting & Prevention (100.0%), Security & Protection (73.0%), and Law Enforcement (66.7%), while the most female-oriented occupations are Healthcare Support (100.0%), Cleaning & Maintenance (100.0%), and Personal Care & Service (96.5%).
| Occupation | Male | Female |
| Healthcare Support | 0 (0.0%) | 12 (100.0%) |
| Security & Protection | 54 (73.0%) | 20 (27.0%) |
| Firefighting & Prevention | 14 (100.0%) | 0 (0.0%) |
| Law Enforcement | 40 (66.7%) | 20 (33.3%) |
| Food Preparation & Serving | 17 (22.1%) | 60 (77.9%) |
| Cleaning & Maintenance | 0 (0.0%) | 25 (100.0%) |
| Personal Care & Service | 3 (3.5%) | 82 (96.5%) |
| Total (Category) | 74 (27.1%) | 199 (72.9%) |
| Total (Overall) | 1,362 (54.7%) | 1,128 (45.3%) |
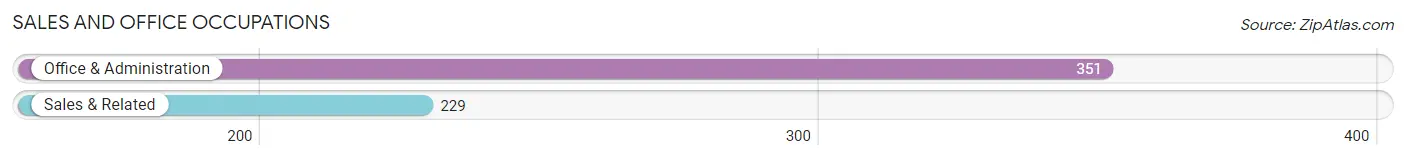
Sales and Office Occupations
The most common Sales and Office occupations in Wolverine Lake are Office & Administration (351 | 14.1%), and Sales & Related (229 | 9.2%).
Sales and Office Occupations by Sex
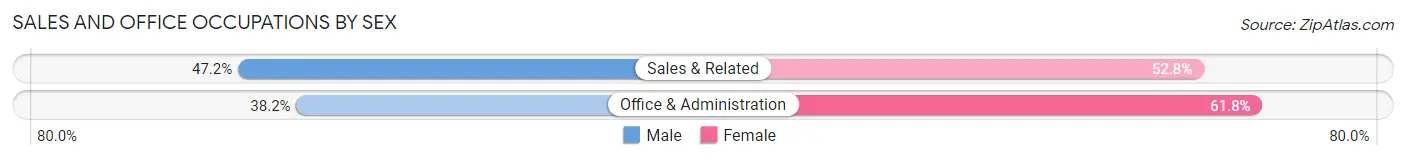
| Occupation | Male | Female |
| Sales & Related | 108 (47.2%) | 121 (52.8%) |
| Office & Administration | 134 (38.2%) | 217 (61.8%) |
| Total (Category) | 242 (41.7%) | 338 (58.3%) |
| Total (Overall) | 1,362 (54.7%) | 1,128 (45.3%) |
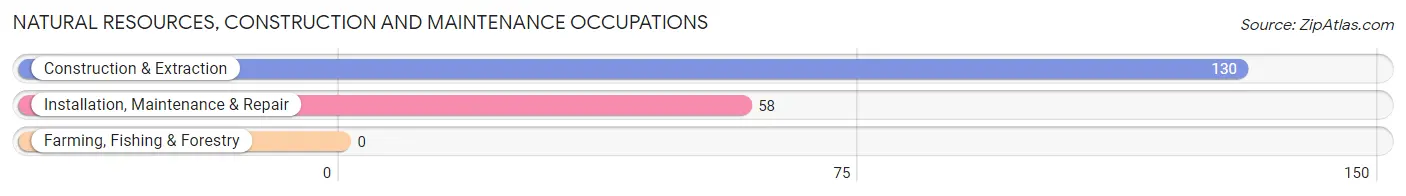
Natural Resources, Construction and Maintenance Occupations
The most common Natural Resources, Construction and Maintenance occupations in Wolverine Lake are Construction & Extraction (130 | 5.2%), and Installation, Maintenance & Repair (58 | 2.3%).
Natural Resources, Construction and Maintenance Occupations by Sex
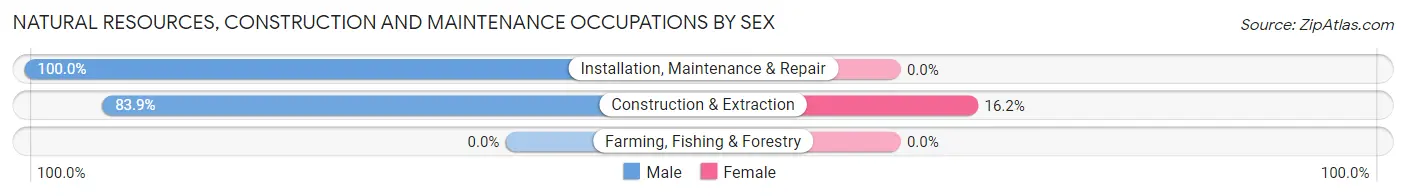
| Occupation | Male | Female |
| Farming, Fishing & Forestry | 0 (0.0%) | 0 (0.0%) |
| Construction & Extraction | 109 (83.9%) | 21 (16.2%) |
| Installation, Maintenance & Repair | 58 (100.0%) | 0 (0.0%) |
| Total (Category) | 167 (88.8%) | 21 (11.2%) |
| Total (Overall) | 1,362 (54.7%) | 1,128 (45.3%) |
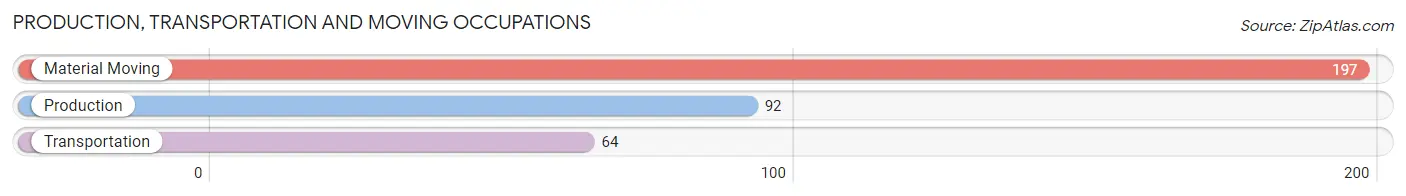
Production, Transportation and Moving Occupations
The most common Production, Transportation and Moving occupations in Wolverine Lake are Material Moving (197 | 7.9%), Production (92 | 3.7%), and Transportation (64 | 2.6%).
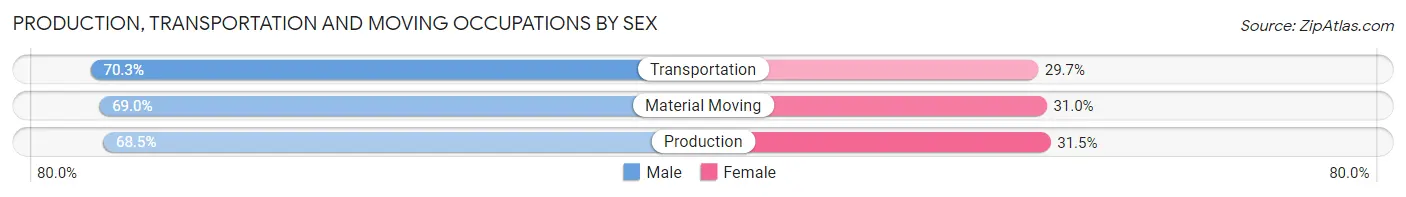
Production, Transportation and Moving Occupations by Sex
| Occupation | Male | Female |
| Production | 63 (68.5%) | 29 (31.5%) |
| Transportation | 45 (70.3%) | 19 (29.7%) |
| Material Moving | 136 (69.0%) | 61 (31.0%) |
| Total (Category) | 244 (69.1%) | 109 (30.9%) |
| Total (Overall) | 1,362 (54.7%) | 1,128 (45.3%) |
Employment Industries by Sex in Wolverine Lake
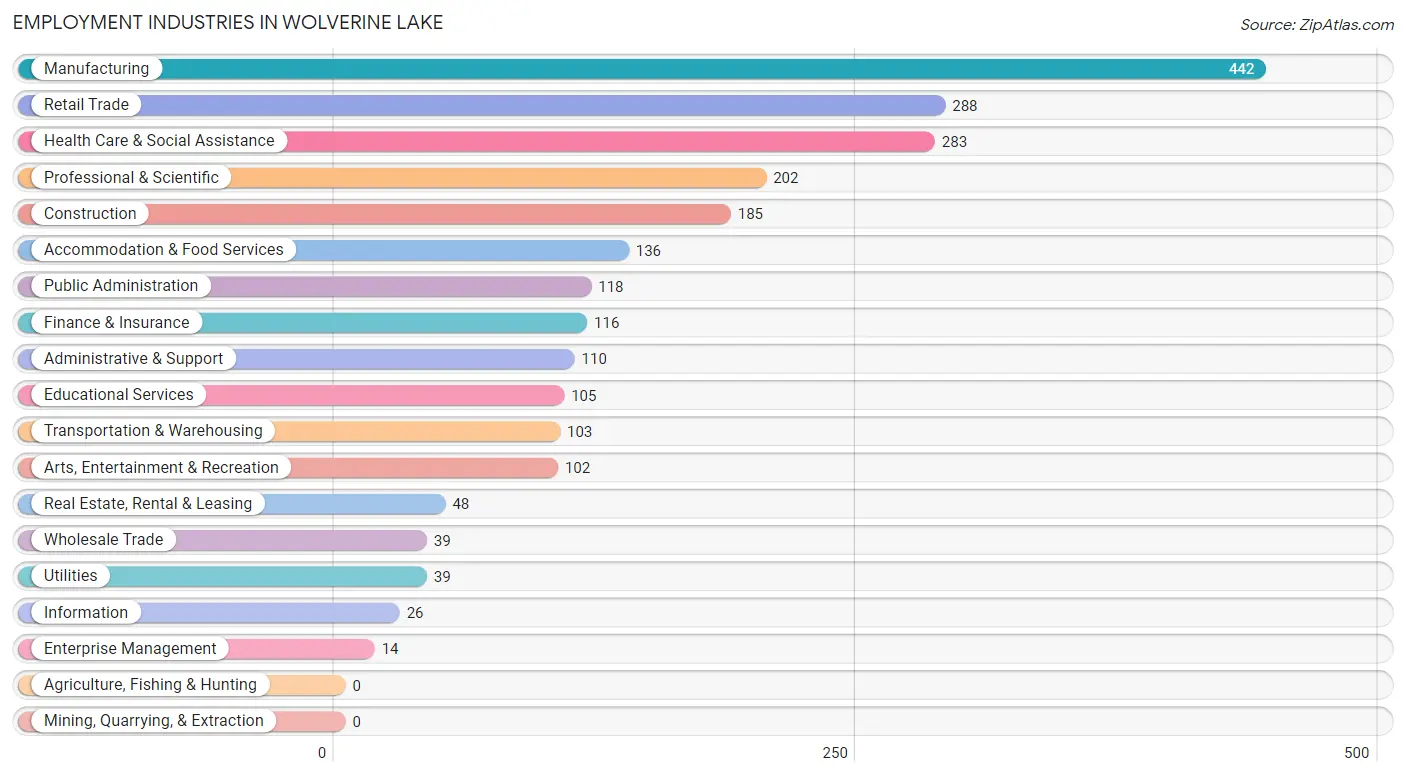
Employment Industries in Wolverine Lake
The major employment industries in Wolverine Lake include Manufacturing (442 | 17.7%), Retail Trade (288 | 11.6%), Health Care & Social Assistance (283 | 11.4%), Professional & Scientific (202 | 8.1%), and Construction (185 | 7.4%).
Employment Industries by Sex in Wolverine Lake
The Wolverine Lake industries that see more men than women are Utilities (100.0%), Construction (83.8%), and Real Estate, Rental & Leasing (79.2%), whereas the industries that tend to have a higher number of women are Enterprise Management (100.0%), Health Care & Social Assistance (88.0%), and Educational Services (84.8%).
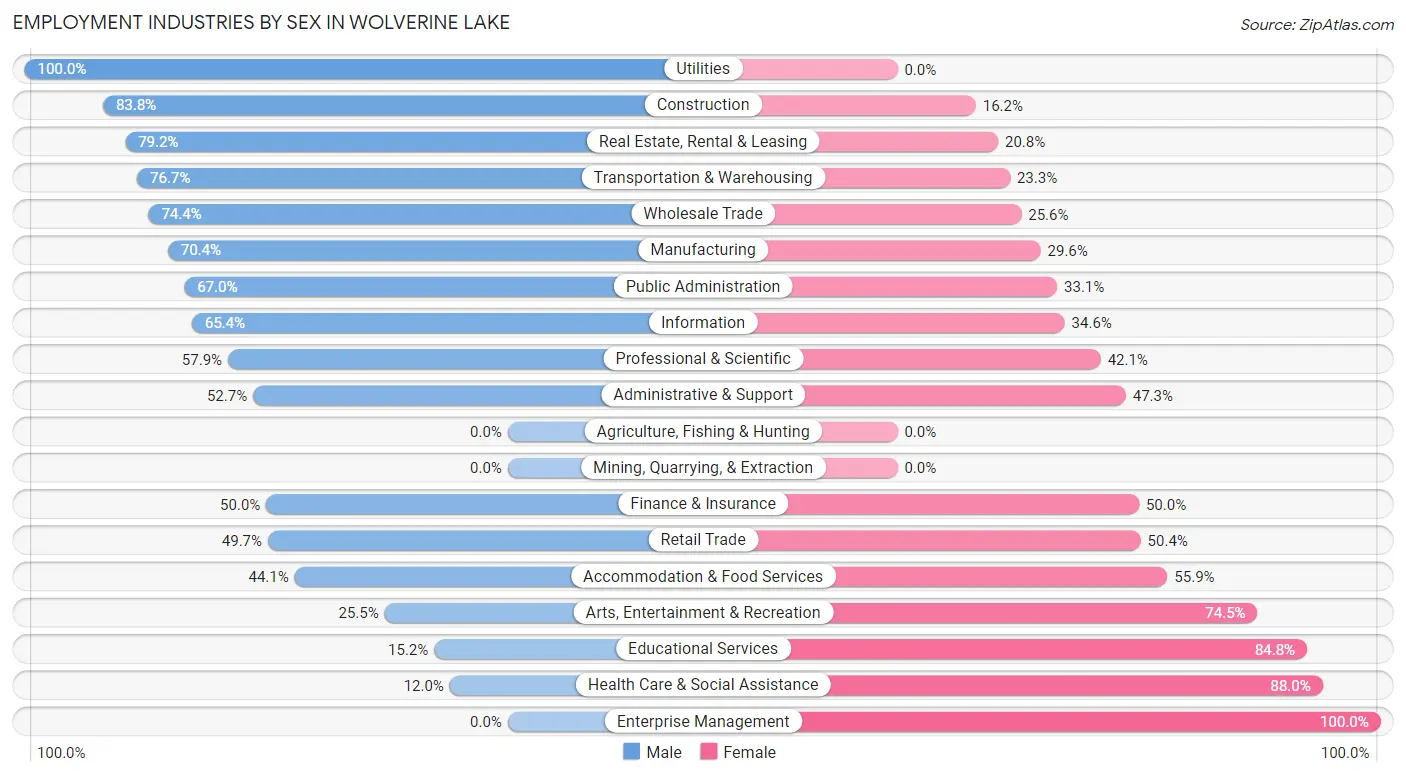
| Industry | Male | Female |
| Agriculture, Fishing & Hunting | 0 (0.0%) | 0 (0.0%) |
| Mining, Quarrying, & Extraction | 0 (0.0%) | 0 (0.0%) |
| Construction | 155 (83.8%) | 30 (16.2%) |
| Manufacturing | 311 (70.4%) | 131 (29.6%) |
| Wholesale Trade | 29 (74.4%) | 10 (25.6%) |
| Retail Trade | 143 (49.6%) | 145 (50.3%) |
| Transportation & Warehousing | 79 (76.7%) | 24 (23.3%) |
| Utilities | 39 (100.0%) | 0 (0.0%) |
| Information | 17 (65.4%) | 9 (34.6%) |
| Finance & Insurance | 58 (50.0%) | 58 (50.0%) |
| Real Estate, Rental & Leasing | 38 (79.2%) | 10 (20.8%) |
| Professional & Scientific | 117 (57.9%) | 85 (42.1%) |
| Enterprise Management | 0 (0.0%) | 14 (100.0%) |
| Administrative & Support | 58 (52.7%) | 52 (47.3%) |
| Educational Services | 16 (15.2%) | 89 (84.8%) |
| Health Care & Social Assistance | 34 (12.0%) | 249 (88.0%) |
| Arts, Entertainment & Recreation | 26 (25.5%) | 76 (74.5%) |
| Accommodation & Food Services | 60 (44.1%) | 76 (55.9%) |
| Public Administration | 79 (66.9%) | 39 (33.1%) |
| Total | 1,362 (54.7%) | 1,128 (45.3%) |
Education in Wolverine Lake
School Enrollment in Wolverine Lake
The most common levels of schooling among the 896 students in Wolverine Lake are high school (239 | 26.7%), college / undergraduate (234 | 26.1%), and middle school (133 | 14.8%).
| School Level | # Students | % Students |
| Nursery / Preschool | 73 | 8.2% |
| Kindergarten | 53 | 5.9% |
| Elementary School | 112 | 12.5% |
| Middle School | 133 | 14.8% |
| High School | 239 | 26.7% |
| College / Undergraduate | 234 | 26.1% |
| Graduate / Professional | 52 | 5.8% |
| Total | 896 | 100.0% |
School Enrollment by Age by Funding Source in Wolverine Lake
Out of a total of 896 students who are enrolled in schools in Wolverine Lake, 98 (10.9%) attend a private institution, while the remaining 798 (89.1%) are enrolled in public schools. The age group of 3 to 4 year olds has the highest likelihood of being enrolled in private schools, with 41 (51.9% in the age bracket) enrolled. Conversely, the age group of 10 to 14 year olds has the lowest likelihood of being enrolled in a private school, with 228 (100.0% in the age bracket) attending a public institution.
| Age Bracket | Public School | Private School |
| 3 to 4 Year Olds | 38 (48.1%) | 41 (51.9%) |
| 5 to 9 Year Old | 122 (80.3%) | 30 (19.7%) |
| 10 to 14 Year Olds | 228 (100.0%) | 0 (0.0%) |
| 15 to 17 Year Olds | 114 (100.0%) | 0 (0.0%) |
| 18 to 19 Year Olds | 74 (100.0%) | 0 (0.0%) |
| 20 to 24 Year Olds | 115 (94.3%) | 7 (5.7%) |
| 25 to 34 Year Olds | 70 (83.3%) | 14 (16.7%) |
| 35 Years and over | 37 (86.1%) | 6 (14.0%) |
| Total | 798 (89.1%) | 98 (10.9%) |
Educational Attainment by Field of Study in Wolverine Lake
Science & technology (242 | 16.8%), engineering (237 | 16.4%), business (221 | 15.3%), education (154 | 10.7%), and liberal arts & history (102 | 7.1%) are the most common fields of study among 1,444 individuals in Wolverine Lake who have obtained a bachelor's degree or higher.
| Field of Study | # Graduates | % Graduates |
| Computers & Mathematics | 81 | 5.6% |
| Bio, Nature & Agricultural | 0 | 0.0% |
| Physical & Health Sciences | 53 | 3.7% |
| Psychology | 61 | 4.2% |
| Social Sciences | 16 | 1.1% |
| Engineering | 237 | 16.4% |
| Multidisciplinary Studies | 21 | 1.5% |
| Science & Technology | 242 | 16.8% |
| Business | 221 | 15.3% |
| Education | 154 | 10.7% |
| Literature & Languages | 45 | 3.1% |
| Liberal Arts & History | 102 | 7.1% |
| Visual & Performing Arts | 85 | 5.9% |
| Communications | 37 | 2.6% |
| Arts & Humanities | 89 | 6.2% |
| Total | 1,444 | 100.0% |
Transportation & Commute in Wolverine Lake
Vehicle Availability by Sex in Wolverine Lake
The most prevalent vehicle ownership categories in Wolverine Lake are males with 2 vehicles (630, accounting for 46.5%) and females with 2 vehicles (514, making up 55.8%).
| Vehicles Available | Male | Female |
| No Vehicle | 0 (0.0%) | 32 (2.8%) |
| 1 Vehicle | 210 (15.5%) | 193 (17.1%) |
| 2 Vehicles | 630 (46.5%) | 514 (45.6%) |
| 3 Vehicles | 349 (25.8%) | 286 (25.4%) |
| 4 Vehicles | 131 (9.7%) | 88 (7.8%) |
| 5 or more Vehicles | 35 (2.6%) | 15 (1.3%) |
| Total | 1,355 (100.0%) | 1,128 (100.0%) |
Commute Time in Wolverine Lake
The most frequently occuring commute durations in Wolverine Lake are 20 to 24 minutes (427 commuters, 19.7%), 10 to 14 minutes (347 commuters, 16.0%), and 15 to 19 minutes (339 commuters, 15.6%).
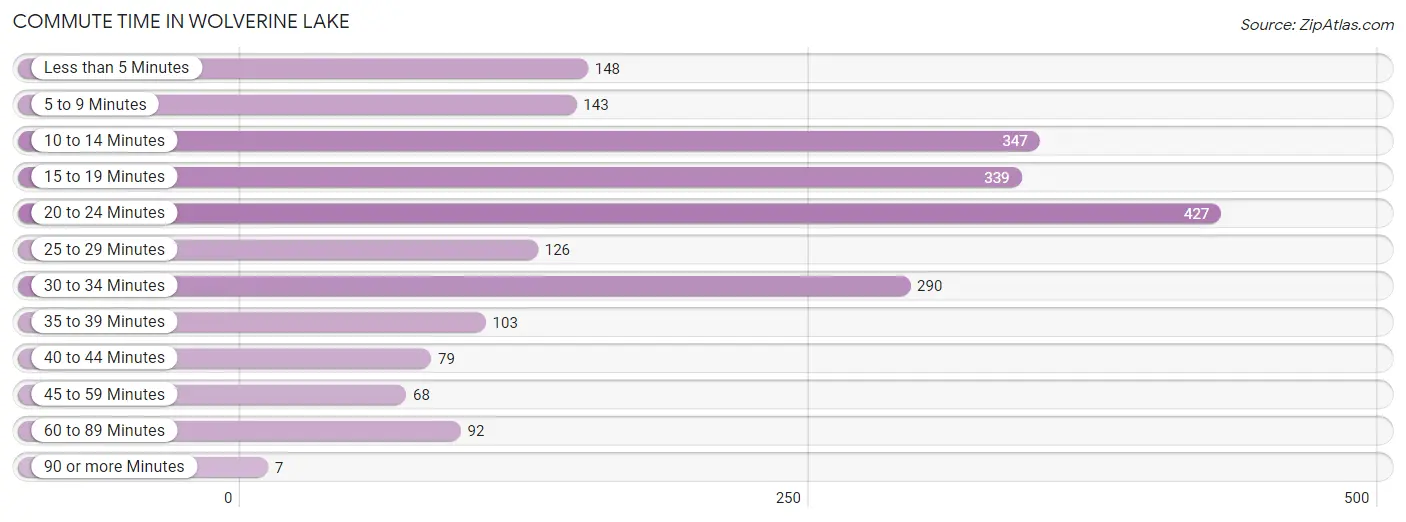
| Commute Time | # Commuters | % Commuters |
| Less than 5 Minutes | 148 | 6.8% |
| 5 to 9 Minutes | 143 | 6.6% |
| 10 to 14 Minutes | 347 | 16.0% |
| 15 to 19 Minutes | 339 | 15.6% |
| 20 to 24 Minutes | 427 | 19.7% |
| 25 to 29 Minutes | 126 | 5.8% |
| 30 to 34 Minutes | 290 | 13.4% |
| 35 to 39 Minutes | 103 | 4.8% |
| 40 to 44 Minutes | 79 | 3.6% |
| 45 to 59 Minutes | 68 | 3.1% |
| 60 to 89 Minutes | 92 | 4.2% |
| 90 or more Minutes | 7 | 0.3% |
Commute Time by Sex in Wolverine Lake
The most common commute times in Wolverine Lake are 20 to 24 minutes (285 commuters, 23.6%) for males and 10 to 14 minutes (247 commuters, 25.7%) for females.
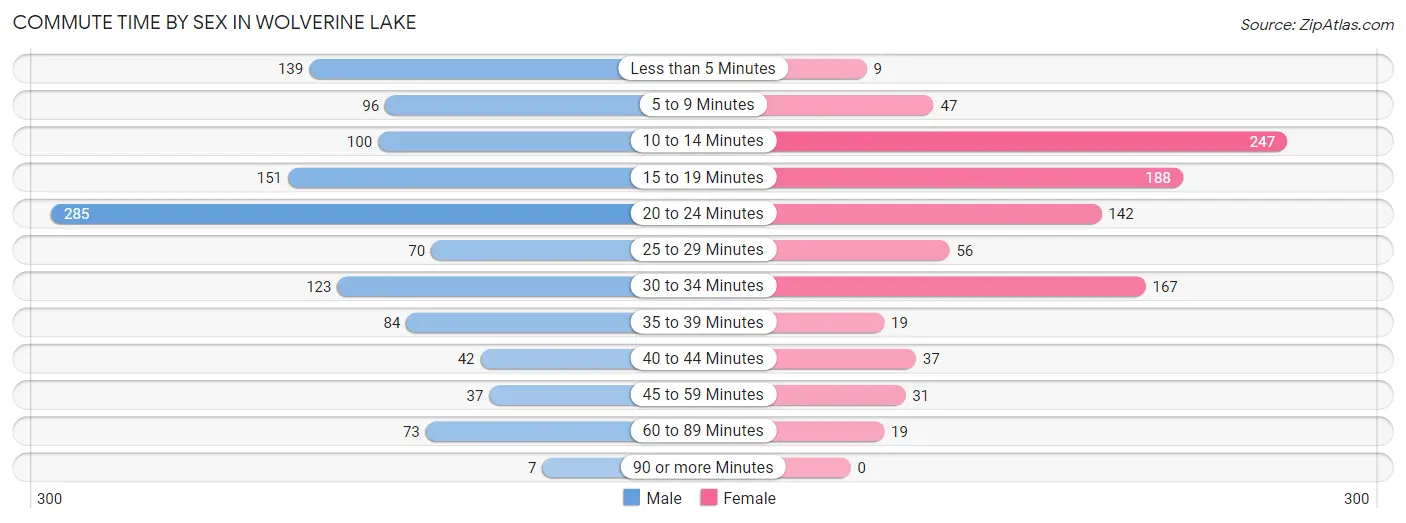
| Commute Time | Male | Female |
| Less than 5 Minutes | 139 (11.5%) | 9 (0.9%) |
| 5 to 9 Minutes | 96 (8.0%) | 47 (4.9%) |
| 10 to 14 Minutes | 100 (8.3%) | 247 (25.7%) |
| 15 to 19 Minutes | 151 (12.5%) | 188 (19.5%) |
| 20 to 24 Minutes | 285 (23.6%) | 142 (14.8%) |
| 25 to 29 Minutes | 70 (5.8%) | 56 (5.8%) |
| 30 to 34 Minutes | 123 (10.2%) | 167 (17.4%) |
| 35 to 39 Minutes | 84 (7.0%) | 19 (2.0%) |
| 40 to 44 Minutes | 42 (3.5%) | 37 (3.8%) |
| 45 to 59 Minutes | 37 (3.1%) | 31 (3.2%) |
| 60 to 89 Minutes | 73 (6.0%) | 19 (2.0%) |
| 90 or more Minutes | 7 (0.6%) | 0 (0.0%) |
Time of Departure to Work by Sex in Wolverine Lake
The most frequent times of departure to work in Wolverine Lake are 6:30 AM to 6:59 AM (205, 17.0%) for males and 7:00 AM to 7:29 AM (125, 13.0%) for females.
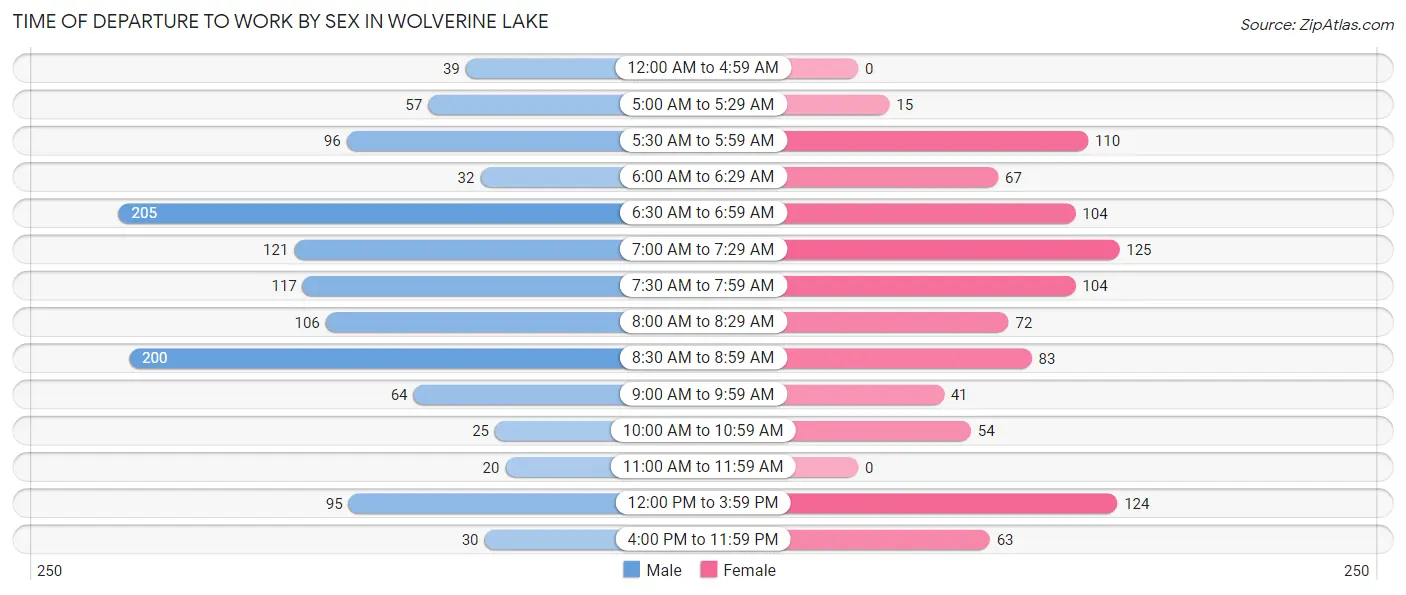
| Time of Departure | Male | Female |
| 12:00 AM to 4:59 AM | 39 (3.2%) | 0 (0.0%) |
| 5:00 AM to 5:29 AM | 57 (4.7%) | 15 (1.6%) |
| 5:30 AM to 5:59 AM | 96 (8.0%) | 110 (11.4%) |
| 6:00 AM to 6:29 AM | 32 (2.6%) | 67 (7.0%) |
| 6:30 AM to 6:59 AM | 205 (17.0%) | 104 (10.8%) |
| 7:00 AM to 7:29 AM | 121 (10.0%) | 125 (13.0%) |
| 7:30 AM to 7:59 AM | 117 (9.7%) | 104 (10.8%) |
| 8:00 AM to 8:29 AM | 106 (8.8%) | 72 (7.5%) |
| 8:30 AM to 8:59 AM | 200 (16.6%) | 83 (8.6%) |
| 9:00 AM to 9:59 AM | 64 (5.3%) | 41 (4.3%) |
| 10:00 AM to 10:59 AM | 25 (2.1%) | 54 (5.6%) |
| 11:00 AM to 11:59 AM | 20 (1.7%) | 0 (0.0%) |
| 12:00 PM to 3:59 PM | 95 (7.9%) | 124 (12.9%) |
| 4:00 PM to 11:59 PM | 30 (2.5%) | 63 (6.6%) |
| Total | 1,207 (100.0%) | 962 (100.0%) |
Housing Occupancy in Wolverine Lake
Occupancy by Ownership in Wolverine Lake
Of the total 1,971 dwellings in Wolverine Lake, owner-occupied units account for 1,402 (71.1%), while renter-occupied units make up 569 (28.9%).
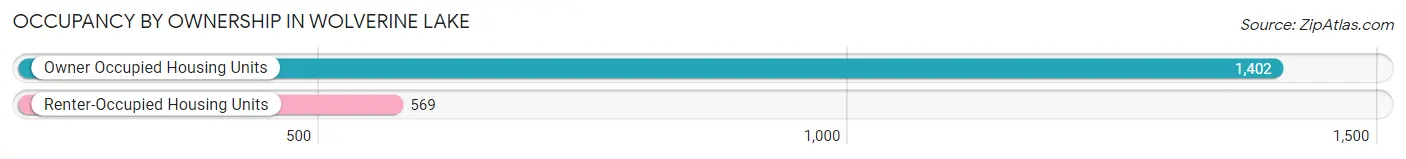
| Occupancy | # Housing Units | % Housing Units |
| Owner Occupied Housing Units | 1,402 | 71.1% |
| Renter-Occupied Housing Units | 569 | 28.9% |
| Total Occupied Housing Units | 1,971 | 100.0% |
Occupancy by Household Size in Wolverine Lake
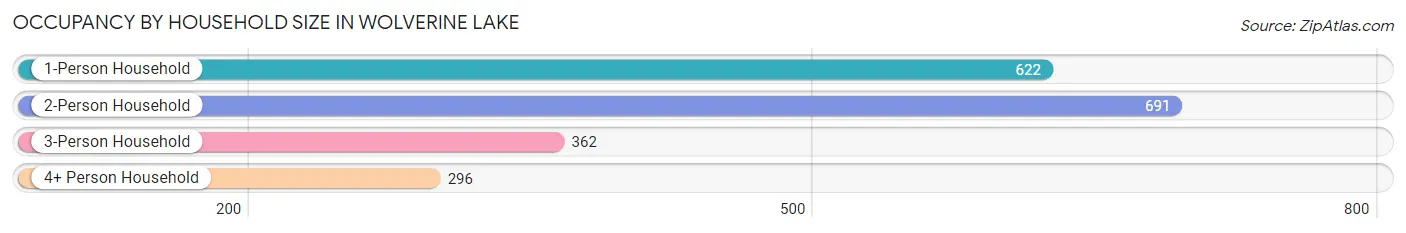
| Household Size | # Housing Units | % Housing Units |
| 1-Person Household | 622 | 31.6% |
| 2-Person Household | 691 | 35.1% |
| 3-Person Household | 362 | 18.4% |
| 4+ Person Household | 296 | 15.0% |
| Total Housing Units | 1,971 | 100.0% |
Occupancy by Ownership by Household Size in Wolverine Lake
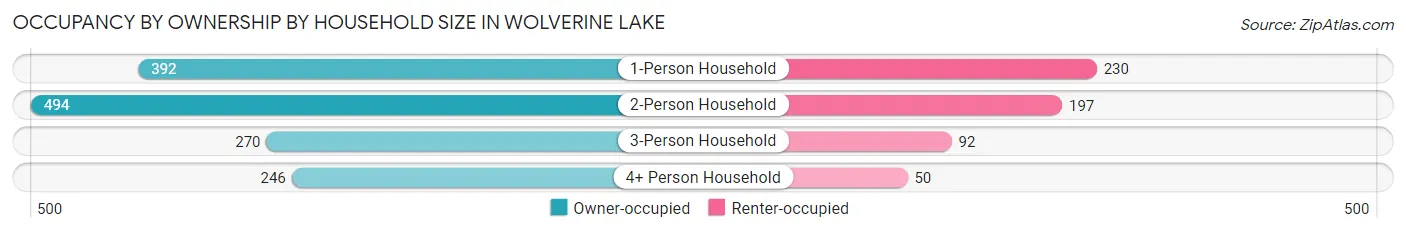
| Household Size | Owner-occupied | Renter-occupied |
| 1-Person Household | 392 (63.0%) | 230 (37.0%) |
| 2-Person Household | 494 (71.5%) | 197 (28.5%) |
| 3-Person Household | 270 (74.6%) | 92 (25.4%) |
| 4+ Person Household | 246 (83.1%) | 50 (16.9%) |
| Total Housing Units | 1,402 (71.1%) | 569 (28.9%) |
Occupancy by Educational Attainment in Wolverine Lake
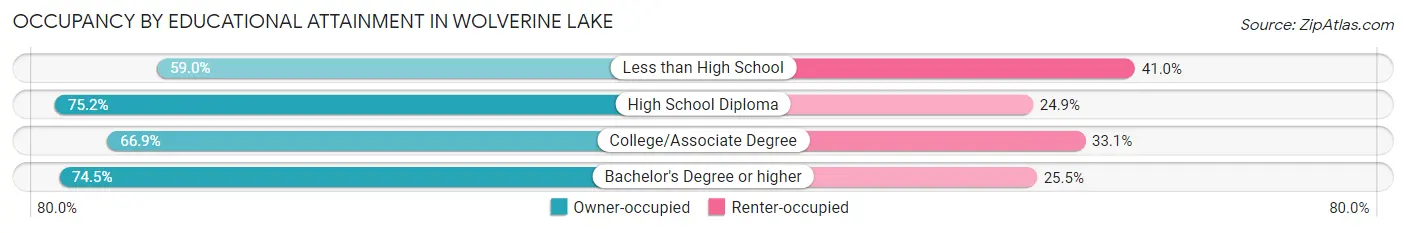
| Household Size | Owner-occupied | Renter-occupied |
| Less than High School | 69 (59.0%) | 48 (41.0%) |
| High School Diploma | 251 (75.1%) | 83 (24.8%) |
| College/Associate Degree | 444 (66.9%) | 220 (33.1%) |
| Bachelor's Degree or higher | 638 (74.5%) | 218 (25.5%) |
Occupancy by Age of Householder in Wolverine Lake
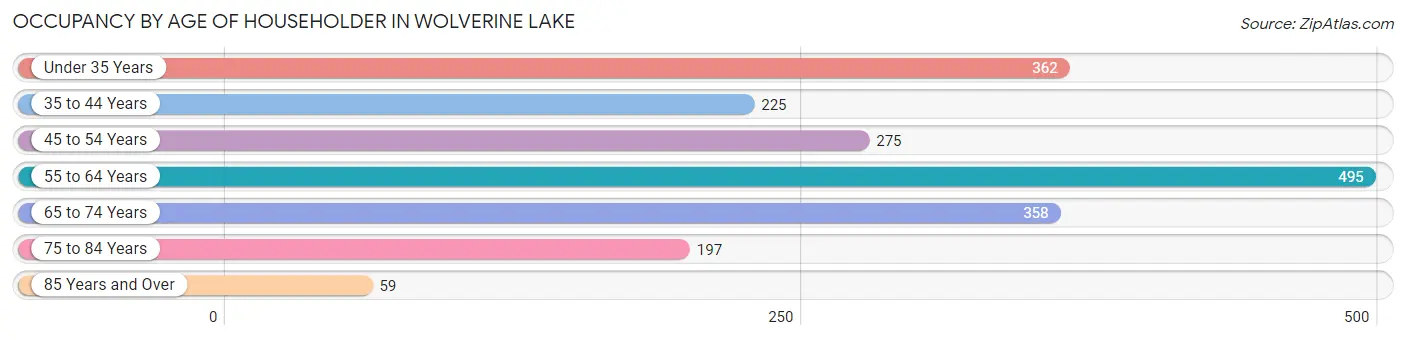
| Age Bracket | # Households | % Households |
| Under 35 Years | 362 | 18.4% |
| 35 to 44 Years | 225 | 11.4% |
| 45 to 54 Years | 275 | 14.0% |
| 55 to 64 Years | 495 | 25.1% |
| 65 to 74 Years | 358 | 18.2% |
| 75 to 84 Years | 197 | 10.0% |
| 85 Years and Over | 59 | 3.0% |
| Total | 1,971 | 100.0% |
Housing Finances in Wolverine Lake
Median Income by Occupancy in Wolverine Lake
| Occupancy Type | # Households | Median Income |
| Owner-Occupied | 1,402 (71.1%) | $102,200 |
| Renter-Occupied | 569 (28.9%) | $54,650 |
| Average | 1,971 (100.0%) | $85,195 |
Occupancy by Householder Income Bracket in Wolverine Lake
| Income Bracket | Owner-occupied | Renter-occupied |
| Less than $5,000 | 16 (1.1%) | 28 (4.9%) |
| $5,000 to $9,999 | 0 (0.0%) | 0 (0.0%) |
| $10,000 to $14,999 | 11 (0.8%) | 37 (6.5%) |
| $15,000 to $19,999 | 21 (1.5%) | 5 (0.9%) |
| $20,000 to $24,999 | 10 (0.7%) | 60 (10.5%) |
| $25,000 to $34,999 | 47 (3.4%) | 35 (6.1%) |
| $35,000 to $49,999 | 112 (8.0%) | 92 (16.2%) |
| $50,000 to $74,999 | 351 (25.0%) | 123 (21.6%) |
| $75,000 to $99,999 | 111 (7.9%) | 11 (1.9%) |
| $100,000 to $149,999 | 397 (28.3%) | 138 (24.2%) |
| $150,000 or more | 326 (23.3%) | 40 (7.0%) |
| Total | 1,402 (100.0%) | 569 (100.0%) |
Monthly Housing Cost Tiers in Wolverine Lake
| Monthly Cost | Owner-occupied | Renter-occupied |
| Less than $300 | 37 (2.6%) | 0 (0.0%) |
| $300 to $499 | 146 (10.4%) | 0 (0.0%) |
| $500 to $799 | 145 (10.3%) | 109 (19.2%) |
| $800 to $999 | 216 (15.4%) | 118 (20.7%) |
| $1,000 to $1,499 | 313 (22.3%) | 31 (5.4%) |
| $1,500 to $1,999 | 271 (19.3%) | 116 (20.4%) |
| $2,000 to $2,499 | 102 (7.3%) | 151 (26.5%) |
| $2,500 to $2,999 | 43 (3.1%) | 0 (0.0%) |
| $3,000 or more | 129 (9.2%) | 16 (2.8%) |
| Total | 1,402 (100.0%) | 569 (100.0%) |
Physical Housing Characteristics in Wolverine Lake
Housing Structures in Wolverine Lake
| Structure Type | # Housing Units | % Housing Units |
| Single Unit, Detached | 1,441 | 73.1% |
| Single Unit, Attached | 106 | 5.4% |
| 2 Unit Apartments | 76 | 3.9% |
| 3 or 4 Unit Apartments | 93 | 4.7% |
| 5 to 9 Unit Apartments | 54 | 2.7% |
| 10 or more Apartments | 201 | 10.2% |
| Mobile Home / Other | 0 | 0.0% |
| Total | 1,971 | 100.0% |
Housing Structures by Occupancy in Wolverine Lake
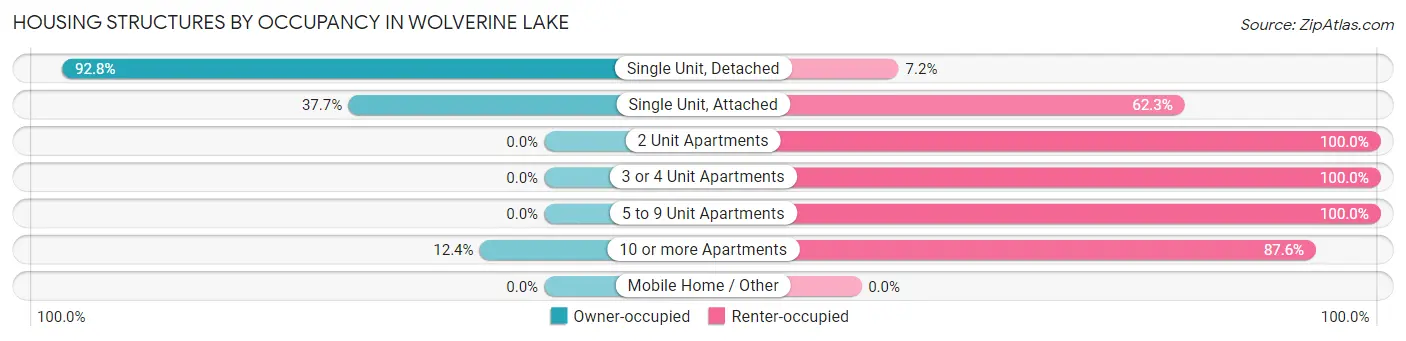
| Structure Type | Owner-occupied | Renter-occupied |
| Single Unit, Detached | 1,337 (92.8%) | 104 (7.2%) |
| Single Unit, Attached | 40 (37.7%) | 66 (62.3%) |
| 2 Unit Apartments | 0 (0.0%) | 76 (100.0%) |
| 3 or 4 Unit Apartments | 0 (0.0%) | 93 (100.0%) |
| 5 to 9 Unit Apartments | 0 (0.0%) | 54 (100.0%) |
| 10 or more Apartments | 25 (12.4%) | 176 (87.6%) |
| Mobile Home / Other | 0 (0.0%) | 0 (0.0%) |
| Total | 1,402 (71.1%) | 569 (28.9%) |
Housing Structures by Number of Rooms in Wolverine Lake
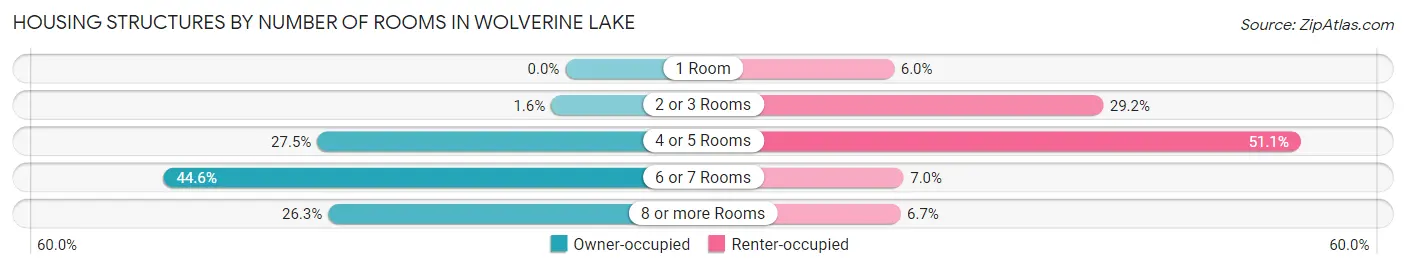
| Number of Rooms | Owner-occupied | Renter-occupied |
| 1 Room | 0 (0.0%) | 34 (6.0%) |
| 2 or 3 Rooms | 22 (1.6%) | 166 (29.2%) |
| 4 or 5 Rooms | 386 (27.5%) | 291 (51.1%) |
| 6 or 7 Rooms | 625 (44.6%) | 40 (7.0%) |
| 8 or more Rooms | 369 (26.3%) | 38 (6.7%) |
| Total | 1,402 (100.0%) | 569 (100.0%) |
Housing Structure by Heating Type in Wolverine Lake
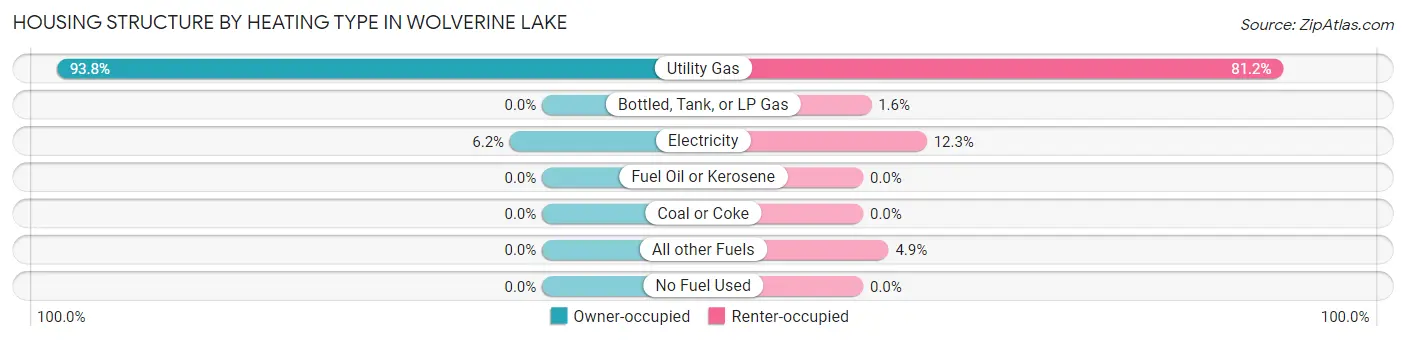
| Heating Type | Owner-occupied | Renter-occupied |
| Utility Gas | 1,315 (93.8%) | 462 (81.2%) |
| Bottled, Tank, or LP Gas | 0 (0.0%) | 9 (1.6%) |
| Electricity | 87 (6.2%) | 70 (12.3%) |
| Fuel Oil or Kerosene | 0 (0.0%) | 0 (0.0%) |
| Coal or Coke | 0 (0.0%) | 0 (0.0%) |
| All other Fuels | 0 (0.0%) | 28 (4.9%) |
| No Fuel Used | 0 (0.0%) | 0 (0.0%) |
| Total | 1,402 (100.0%) | 569 (100.0%) |
Household Vehicle Usage in Wolverine Lake
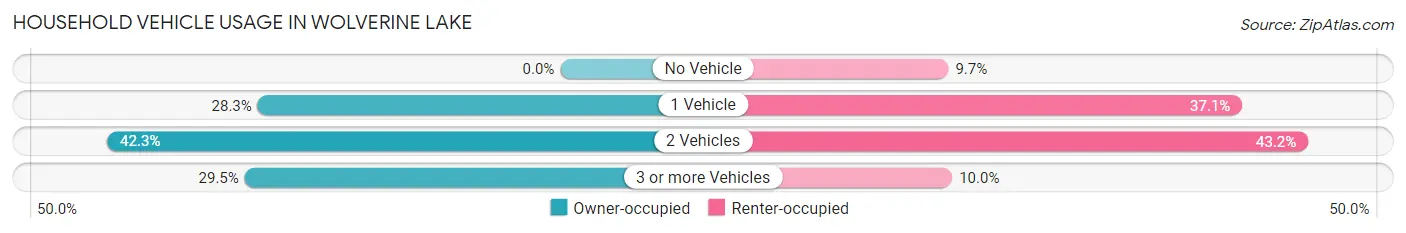
| Vehicles per Household | Owner-occupied | Renter-occupied |
| No Vehicle | 0 (0.0%) | 55 (9.7%) |
| 1 Vehicle | 396 (28.2%) | 211 (37.1%) |
| 2 Vehicles | 593 (42.3%) | 246 (43.2%) |
| 3 or more Vehicles | 413 (29.5%) | 57 (10.0%) |
| Total | 1,402 (100.0%) | 569 (100.0%) |
Real Estate & Mortgages in Wolverine Lake
Real Estate and Mortgage Overview in Wolverine Lake
| Characteristic | Without Mortgage | With Mortgage |
| Housing Units | 361 | 1,041 |
| Median Property Value | $243,100 | $239,100 |
| Median Household Income | $64,432 | $227 |
| Monthly Housing Costs | $601 | $129 |
| Real Estate Taxes | $3,793 | $8 |
Property Value by Mortgage Status in Wolverine Lake
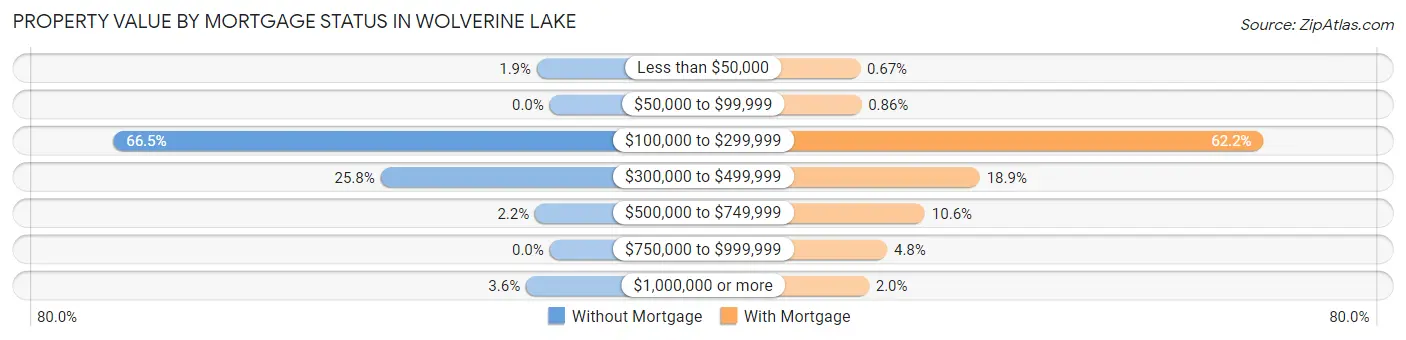
| Property Value | Without Mortgage | With Mortgage |
| Less than $50,000 | 7 (1.9%) | 7 (0.7%) |
| $50,000 to $99,999 | 0 (0.0%) | 9 (0.9%) |
| $100,000 to $299,999 | 240 (66.5%) | 647 (62.2%) |
| $300,000 to $499,999 | 93 (25.8%) | 197 (18.9%) |
| $500,000 to $749,999 | 8 (2.2%) | 110 (10.6%) |
| $750,000 to $999,999 | 0 (0.0%) | 50 (4.8%) |
| $1,000,000 or more | 13 (3.6%) | 21 (2.0%) |
| Total | 361 (100.0%) | 1,041 (100.0%) |
Household Income by Mortgage Status in Wolverine Lake
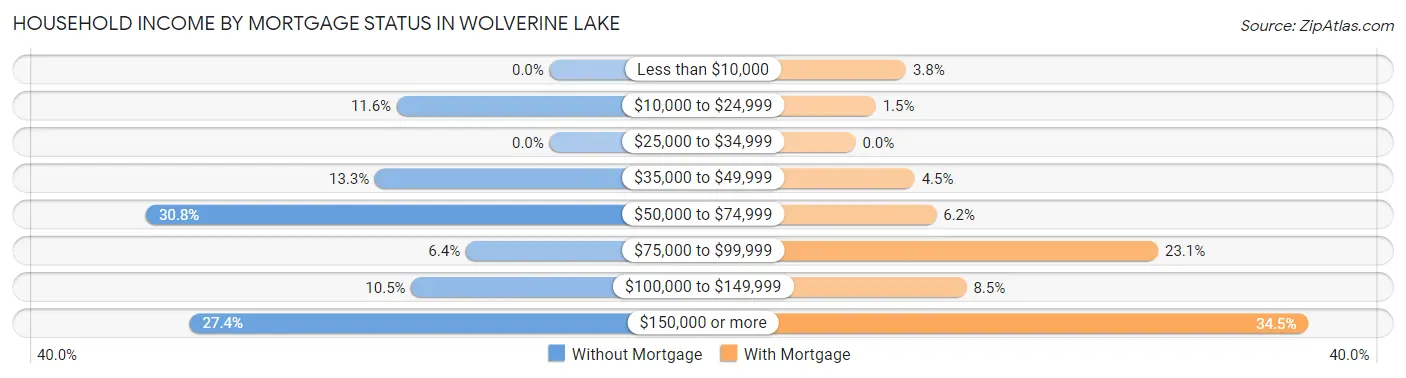
| Household Income | Without Mortgage | With Mortgage |
| Less than $10,000 | 0 (0.0%) | 40 (3.8%) |
| $10,000 to $24,999 | 42 (11.6%) | 16 (1.5%) |
| $25,000 to $34,999 | 0 (0.0%) | 0 (0.0%) |
| $35,000 to $49,999 | 48 (13.3%) | 47 (4.5%) |
| $50,000 to $74,999 | 111 (30.7%) | 64 (6.1%) |
| $75,000 to $99,999 | 23 (6.4%) | 240 (23.1%) |
| $100,000 to $149,999 | 38 (10.5%) | 88 (8.5%) |
| $150,000 or more | 99 (27.4%) | 359 (34.5%) |
| Total | 361 (100.0%) | 1,041 (100.0%) |
Property Value to Household Income Ratio in Wolverine Lake
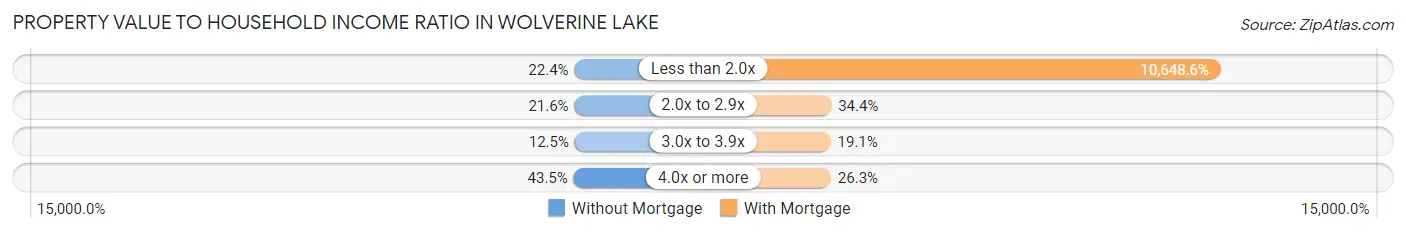
| Value-to-Income Ratio | Without Mortgage | With Mortgage |
| Less than 2.0x | 81 (22.4%) | 110,852 (10,648.6%) |
| 2.0x to 2.9x | 78 (21.6%) | 358 (34.4%) |
| 3.0x to 3.9x | 45 (12.5%) | 199 (19.1%) |
| 4.0x or more | 157 (43.5%) | 274 (26.3%) |
| Total | 361 (100.0%) | 1,041 (100.0%) |
Real Estate Taxes by Mortgage Status in Wolverine Lake
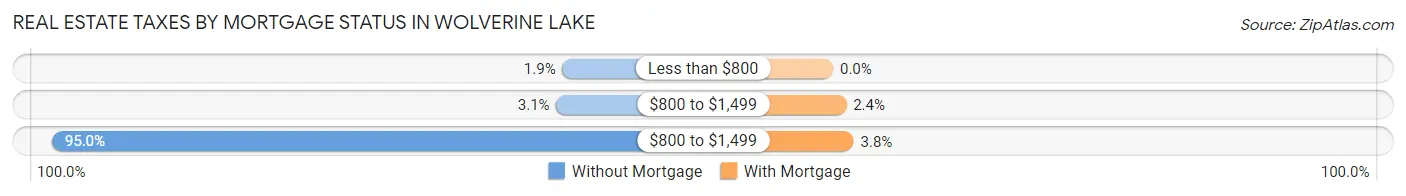
| Property Taxes | Without Mortgage | With Mortgage |
| Less than $800 | 7 (1.9%) | 0 (0.0%) |
| $800 to $1,499 | 11 (3.0%) | 25 (2.4%) |
| $800 to $1,499 | 343 (95.0%) | 39 (3.7%) |
| Total | 361 (100.0%) | 1,041 (100.0%) |
Health & Disability in Wolverine Lake
Health Insurance Coverage by Age in Wolverine Lake
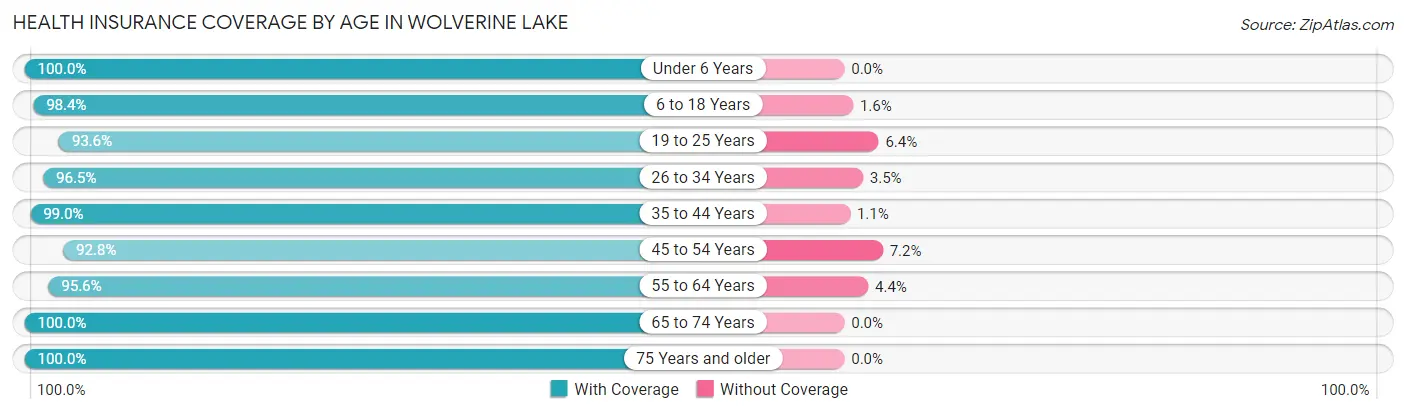
| Age Bracket | With Coverage | Without Coverage |
| Under 6 Years | 210 (100.0%) | 0 (0.0%) |
| 6 to 18 Years | 550 (98.4%) | 9 (1.6%) |
| 19 to 25 Years | 352 (93.6%) | 24 (6.4%) |
| 26 to 34 Years | 586 (96.5%) | 21 (3.5%) |
| 35 to 44 Years | 473 (99.0%) | 5 (1.1%) |
| 45 to 54 Years | 479 (92.8%) | 37 (7.2%) |
| 55 to 64 Years | 861 (95.6%) | 40 (4.4%) |
| 65 to 74 Years | 503 (100.0%) | 0 (0.0%) |
| 75 Years and older | 343 (100.0%) | 0 (0.0%) |
| Total | 4,357 (97.0%) | 136 (3.0%) |
Health Insurance Coverage by Citizenship Status in Wolverine Lake
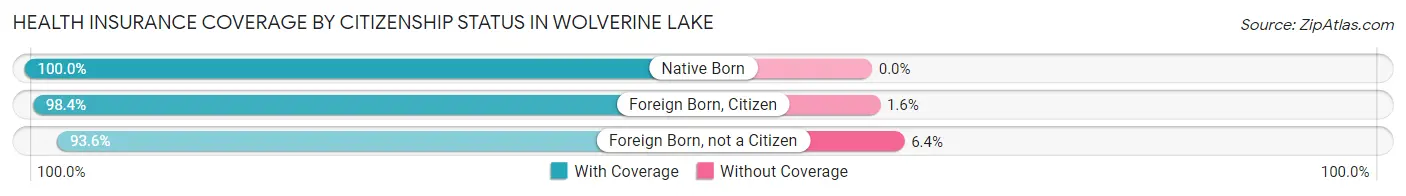
| Citizenship Status | With Coverage | Without Coverage |
| Native Born | 210 (100.0%) | 0 (0.0%) |
| Foreign Born, Citizen | 550 (98.4%) | 9 (1.6%) |
| Foreign Born, not a Citizen | 352 (93.6%) | 24 (6.4%) |
Health Insurance Coverage by Household Income in Wolverine Lake
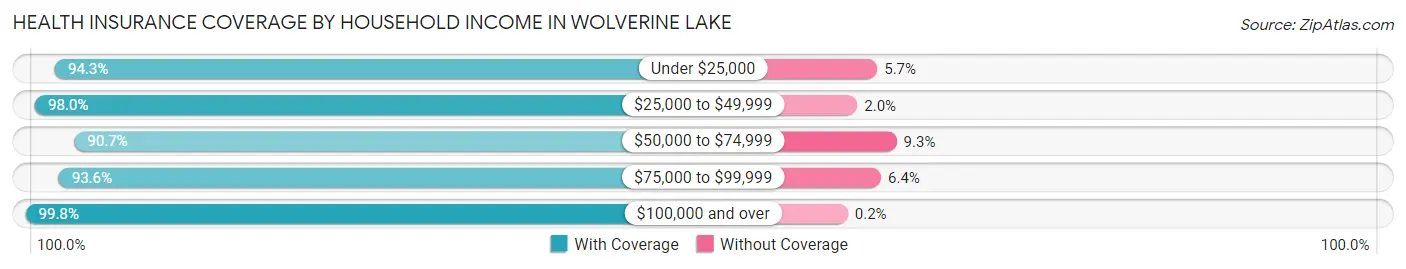
| Household Income | With Coverage | Without Coverage |
| Under $25,000 | 231 (94.3%) | 14 (5.7%) |
| $25,000 to $49,999 | 449 (98.0%) | 9 (2.0%) |
| $50,000 to $74,999 | 864 (90.7%) | 89 (9.3%) |
| $75,000 to $99,999 | 277 (93.6%) | 19 (6.4%) |
| $100,000 and over | 2,536 (99.8%) | 5 (0.2%) |
Public vs Private Health Insurance Coverage by Age in Wolverine Lake
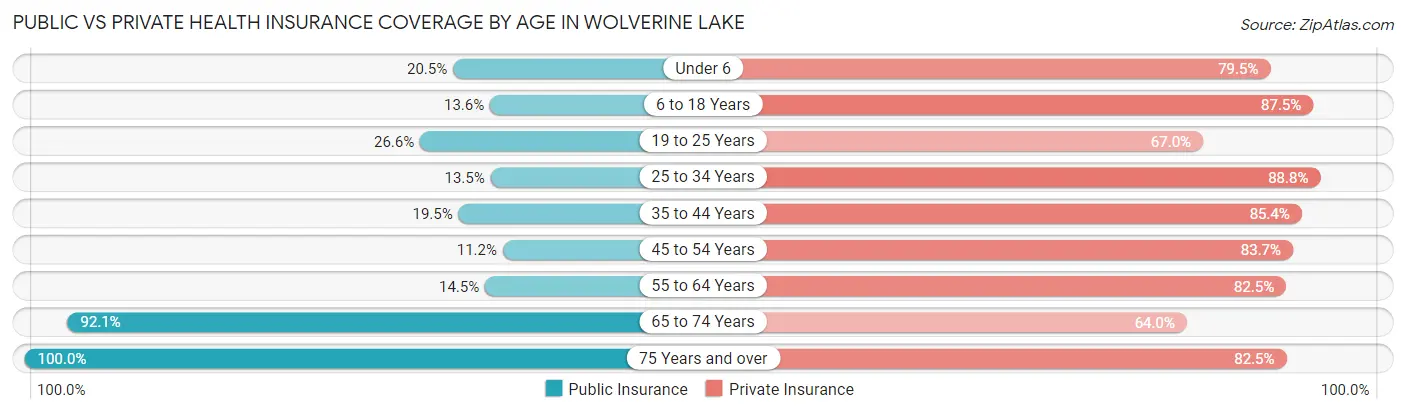
| Age Bracket | Public Insurance | Private Insurance |
| Under 6 | 43 (20.5%) | 167 (79.5%) |
| 6 to 18 Years | 76 (13.6%) | 489 (87.5%) |
| 19 to 25 Years | 100 (26.6%) | 252 (67.0%) |
| 25 to 34 Years | 82 (13.5%) | 539 (88.8%) |
| 35 to 44 Years | 93 (19.5%) | 408 (85.4%) |
| 45 to 54 Years | 58 (11.2%) | 432 (83.7%) |
| 55 to 64 Years | 131 (14.5%) | 743 (82.5%) |
| 65 to 74 Years | 463 (92.0%) | 322 (64.0%) |
| 75 Years and over | 343 (100.0%) | 283 (82.5%) |
| Total | 1,389 (30.9%) | 3,635 (80.9%) |
Disability Status by Sex by Age in Wolverine Lake
| Age Bracket | Male | Female |
| Under 5 Years | 0 (0.0%) | 0 (0.0%) |
| 5 to 17 Years | 16 (5.8%) | 11 (4.3%) |
| 18 to 34 Years | 29 (5.8%) | 32 (6.3%) |
| 35 to 64 Years | 129 (13.0%) | 127 (14.1%) |
| 65 to 74 Years | 110 (37.7%) | 0 (0.0%) |
| 75 Years and over | 72 (52.2%) | 62 (30.2%) |
Disability Class by Sex by Age in Wolverine Lake
Disability Class: Hearing Difficulty
| Age Bracket | Male | Female |
| Under 5 Years | 0 (0.0%) | 0 (0.0%) |
| 5 to 17 Years | 0 (0.0%) | 0 (0.0%) |
| 18 to 34 Years | 0 (0.0%) | 0 (0.0%) |
| 35 to 64 Years | 88 (8.8%) | 5 (0.6%) |
| 65 to 74 Years | 63 (21.6%) | 0 (0.0%) |
| 75 Years and over | 44 (31.9%) | 35 (17.1%) |
Disability Class: Vision Difficulty
| Age Bracket | Male | Female |
| Under 5 Years | 0 (0.0%) | 0 (0.0%) |
| 5 to 17 Years | 0 (0.0%) | 0 (0.0%) |
| 18 to 34 Years | 0 (0.0%) | 0 (0.0%) |
| 35 to 64 Years | 5 (0.5%) | 37 (4.1%) |
| 65 to 74 Years | 14 (4.8%) | 0 (0.0%) |
| 75 Years and over | 33 (23.9%) | 15 (7.3%) |
Disability Class: Cognitive Difficulty
| Age Bracket | Male | Female |
| 5 to 17 Years | 16 (5.8%) | 11 (4.3%) |
| 18 to 34 Years | 22 (4.4%) | 32 (6.3%) |
| 35 to 64 Years | 63 (6.3%) | 31 (3.4%) |
| 65 to 74 Years | 14 (4.8%) | 0 (0.0%) |
| 75 Years and over | 26 (18.8%) | 10 (4.9%) |
Disability Class: Ambulatory Difficulty
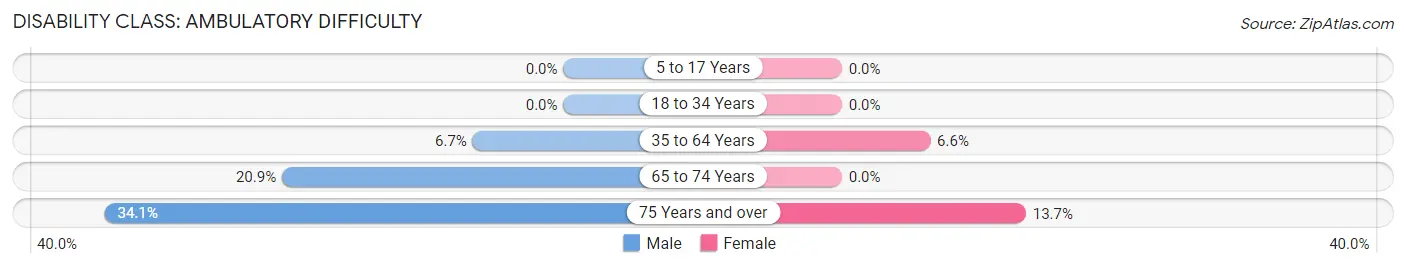
| Age Bracket | Male | Female |
| 5 to 17 Years | 0 (0.0%) | 0 (0.0%) |
| 18 to 34 Years | 0 (0.0%) | 0 (0.0%) |
| 35 to 64 Years | 67 (6.7%) | 59 (6.6%) |
| 65 to 74 Years | 61 (20.9%) | 0 (0.0%) |
| 75 Years and over | 47 (34.1%) | 28 (13.7%) |
Disability Class: Self-Care Difficulty
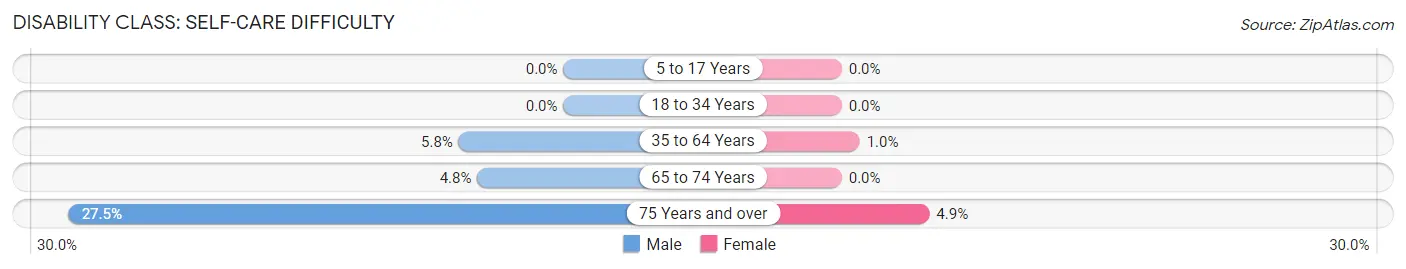
| Age Bracket | Male | Female |
| 5 to 17 Years | 0 (0.0%) | 0 (0.0%) |
| 18 to 34 Years | 0 (0.0%) | 0 (0.0%) |
| 35 to 64 Years | 58 (5.8%) | 9 (1.0%) |
| 65 to 74 Years | 14 (4.8%) | 0 (0.0%) |
| 75 Years and over | 38 (27.5%) | 10 (4.9%) |
Technology Access in Wolverine Lake
Computing Device Access in Wolverine Lake
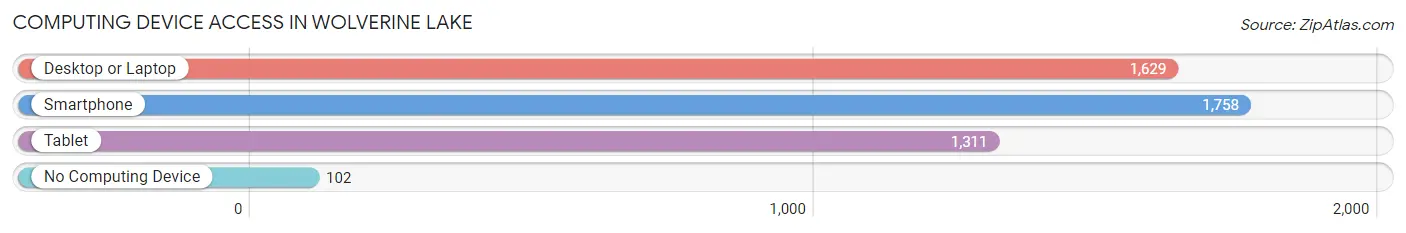
| Device Type | # Households | % Households |
| Desktop or Laptop | 1,629 | 82.7% |
| Smartphone | 1,758 | 89.2% |
| Tablet | 1,311 | 66.5% |
| No Computing Device | 102 | 5.2% |
| Total | 1,971 | 100.0% |
Internet Access in Wolverine Lake
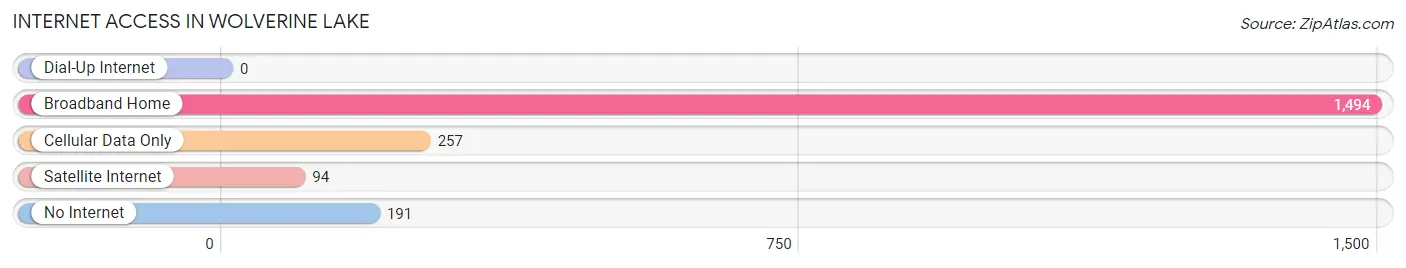
| Internet Type | # Households | % Households |
| Dial-Up Internet | 0 | 0.0% |
| Broadband Home | 1,494 | 75.8% |
| Cellular Data Only | 257 | 13.0% |
| Satellite Internet | 94 | 4.8% |
| No Internet | 191 | 9.7% |
| Total | 1,971 | 100.0% |
Wolverine Lake Summary
Wolverine Lake is a village located in Oakland County, Michigan, United States. The population was 2,543 at the 2010 census. The village is located within the boundaries of Commerce Township.
History
The area that is now Wolverine Lake was originally inhabited by the Potawatomi Native American tribe. The first white settlers arrived in the area in the early 1800s. The village was originally known as Commerce Township, but was renamed Wolverine Lake in the early 1900s. The name was chosen to honor the wolverine, a species of animal native to the area.
The village was officially incorporated in 1953. In the 1950s and 1960s, the village experienced a period of rapid growth, as many people moved to the area from Detroit and other nearby cities. This growth continued into the 1970s and 1980s, and the village has remained relatively stable since then.
Geography
Wolverine Lake is located at 42°33'17" North, 83°27'45" West (42.554722, -83.462500). According to the United States Census Bureau, the village has a total area of 1.2 square miles (3.1 km2), all land.
The village is located on the shores of Wolverine Lake, a small lake that is part of the Huron River watershed. The lake is a popular destination for fishing, swimming, and boating.
Economy
The economy of Wolverine Lake is largely based on tourism and retail. The village is home to several small businesses, including restaurants, shops, and other services. The village is also home to several large employers, including a manufacturing plant and a hospital.
Demographics
As of the census of 2010, there were 2,543 people, 1,072 households, and 690 families residing in the village. The population density was 2,093.3 people per square mile (808.3/km2). There were 1,150 housing units at an average density of 958.3 per square mile (370.2/km2). The racial makeup of the village was 94.2% White, 1.2% African American, 0.2% Native American, 1.3% Asian, 0.1% Pacific Islander, 1.2% from other races, and 2.0% from two or more races. Hispanic or Latino of any race were 3.2% of the population.
There were 1,072 households, out of which 28.2% had children under the age of 18 living with them, 48.2% were married couples living together, 11.2% had a female householder with no husband present, and 36.2% were non-families. 30.2% of all households were made up of individuals, and 8.2% had someone living alone who was 65 years of age or older. The average household size was 2.37 and the average family size was 2.97.
In the village, the population was spread out, with 23.2% under the age of 18, 7.2% from 18 to 24, 30.2% from 25 to 44, 27.2% from 45 to 64, and 12.2% who were 65 years of age or older. The median age was 38 years. For every 100 females, there were 95.2 males. For every 100 females age 18 and over, there were 92.2 males.
The median income for a household in the village was $50,938, and the median income for a family was $62,917. Males had a median income of $45,000 versus $31,250 for females. The per capita income for the village was $25,945. About 4.2% of families and 5.2% of the population were below the poverty line, including 6.2% of those under age 18 and 4.2% of those age 65 or over.
Common Questions
What is Per Capita Income in Wolverine Lake?
Per Capita income in Wolverine Lake is $50,595.
What is the Median Family Income in Wolverine Lake?
Median Family Income in Wolverine Lake is $111,836.
What is the Median Household income in Wolverine Lake?
Median Household Income in Wolverine Lake is $85,195.
What is Income or Wage Gap in Wolverine Lake?
Income or Wage Gap in Wolverine Lake is 41.4%.
Women in Wolverine Lake earn 58.6 cents for every dollar earned by a man.
What is Inequality or Gini Index in Wolverine Lake?
Inequality or Gini Index in Wolverine Lake is 0.44.
What is the Total Population of Wolverine Lake?
Total Population of Wolverine Lake is 4,493.
What is the Total Male Population of Wolverine Lake?
Total Male Population of Wolverine Lake is 2,335.
What is the Total Female Population of Wolverine Lake?
Total Female Population of Wolverine Lake is 2,158.
What is the Ratio of Males per 100 Females in Wolverine Lake?
There are 108.20 Males per 100 Females in Wolverine Lake.
What is the Ratio of Females per 100 Males in Wolverine Lake?
There are 92.42 Females per 100 Males in Wolverine Lake.
What is the Median Population Age in Wolverine Lake?
Median Population Age in Wolverine Lake is 45.5 Years.
What is the Average Family Size in Wolverine Lake
Average Family Size in Wolverine Lake is 2.9 People.
What is the Average Household Size in Wolverine Lake
Average Household Size in Wolverine Lake is 2.3 People.
How Large is the Labor Force in Wolverine Lake?
There are 2,574 People in the Labor Forcein in Wolverine Lake.
What is the Percentage of People in the Labor Force in Wolverine Lake?
66.1% of People are in the Labor Force in Wolverine Lake.
What is the Unemployment Rate in Wolverine Lake?
Unemployment Rate in Wolverine Lake is 3.2%.