Cities with the Lowest Percentage of Births to Unmarried Women in Michigan
RELATED REPORTS & OPTIONS
Lowest Illegitimacy | All Women
Michigan
Compare Cities
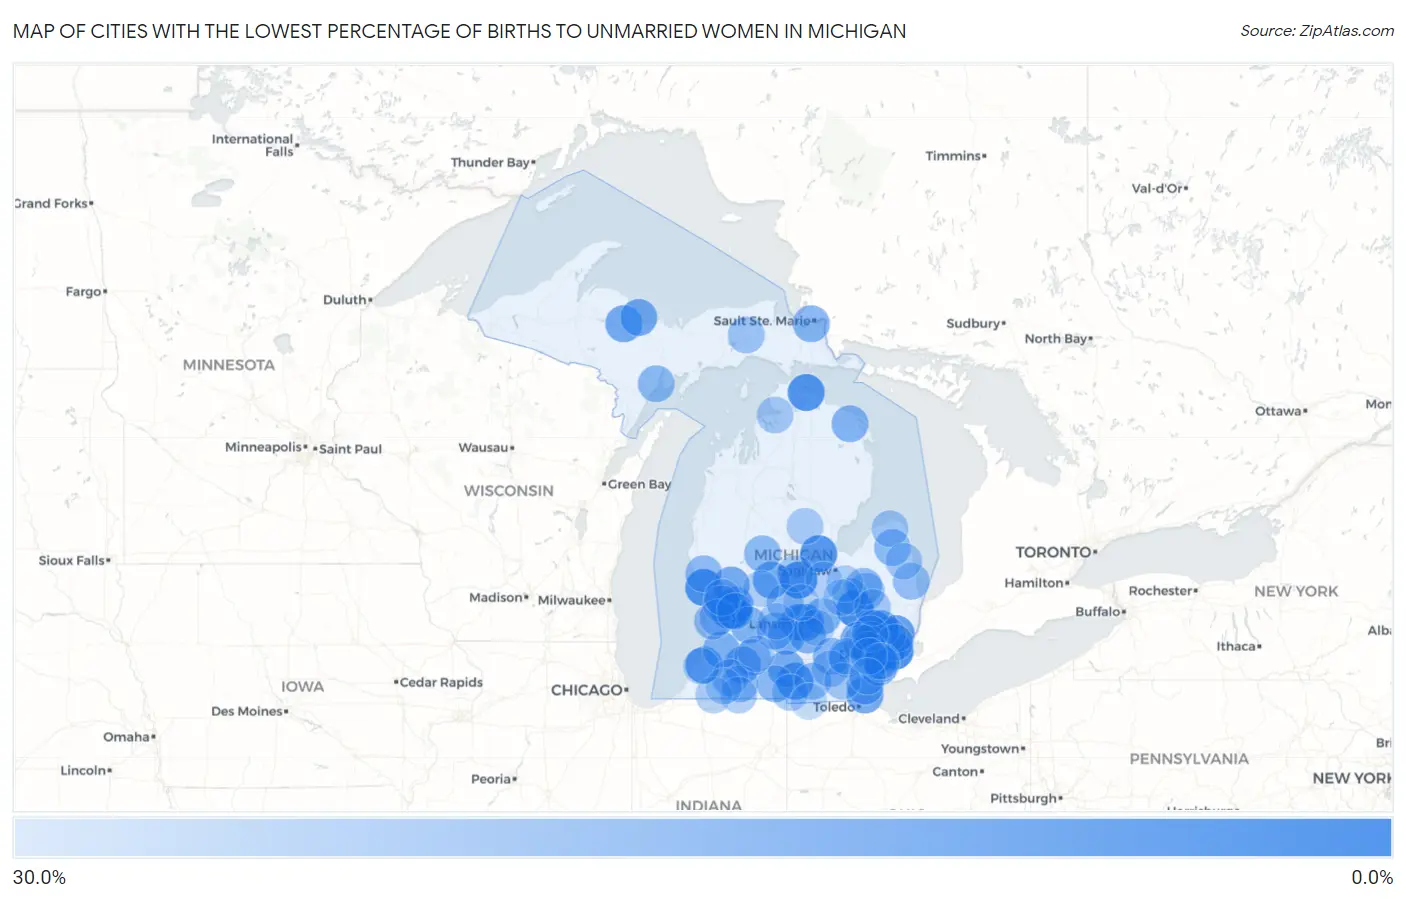
Map of Cities with the Lowest Percentage of Births to Unmarried Women in Michigan
30.0%
0.0%
Cities with the Lowest Percentage of Births to Unmarried Women in Michigan
| City | % Unmarried | vs State | vs National | |
| 1. | Hamtramck | 0.20% | 34.8%(-34.6)#1 | 32.1%(-31.9)#2 |
| 2. | Grand Blanc | 3.2% | 34.8%(-31.6)#2 | 32.1%(-28.9)#139 |
| 3. | Jenison | 3.4% | 34.8%(-31.4)#3 | 32.1%(-28.7)#150 |
| 4. | Grosse Pointe | 3.8% | 34.8%(-31.0)#4 | 32.1%(-28.3)#164 |
| 5. | Grandville | 4.5% | 34.8%(-30.3)#5 | 32.1%(-27.6)#219 |
| 6. | Roosevelt Park | 4.7% | 34.8%(-30.1)#6 | 32.1%(-27.4)#238 |
| 7. | Ithaca | 5.1% | 34.8%(-29.7)#7 | 32.1%(-27.0)#274 |
| 8. | Cheboygan | 6.1% | 34.8%(-28.7)#8 | 32.1%(-26.0)#362 |
| 9. | Midland | 6.5% | 34.8%(-28.3)#9 | 32.1%(-25.6)#395 |
| 10. | Mohawk | 7.1% | 34.8%(-27.7)#10 | 32.1%(-25.0)#467 |
| 11. | Troy | 7.7% | 34.8%(-27.1)#11 | 32.1%(-24.4)#508 |
| 12. | Auburn Hills | 7.7% | 34.8%(-27.1)#12 | 32.1%(-24.4)#512 |
| 13. | Royal Oak | 7.9% | 34.8%(-26.9)#13 | 32.1%(-24.2)#536 |
| 14. | Birmingham | 8.5% | 34.8%(-26.3)#14 | 32.1%(-23.6)#613 |
| 15. | East Lansing | 8.6% | 34.8%(-26.2)#15 | 32.1%(-23.5)#622 |
| 16. | Clawson | 8.6% | 34.8%(-26.2)#16 | 32.1%(-23.5)#623 |
| 17. | Jonesville | 8.6% | 34.8%(-26.2)#17 | 32.1%(-23.5)#625 |
| 18. | Watervliet | 9.8% | 34.8%(-25.0)#18 | 32.1%(-22.3)#772 |
| 19. | Mount Clemens | 10.4% | 34.8%(-24.4)#19 | 32.1%(-21.7)#834 |
| 20. | Stanton | 11.8% | 34.8%(-23.0)#20 | 32.1%(-20.3)#1,013 |
| 21. | Dearborn | 12.2% | 34.8%(-22.6)#21 | 32.1%(-19.9)#1,051 |
| 22. | Ishpeming | 12.3% | 34.8%(-22.5)#22 | 32.1%(-19.8)#1,067 |
| 23. | Walker | 12.5% | 34.8%(-22.3)#23 | 32.1%(-19.6)#1,081 |
| 24. | Luna Pier | 12.8% | 34.8%(-22.0)#24 | 32.1%(-19.3)#1,154 |
| 25. | Marquette | 12.9% | 34.8%(-21.9)#25 | 32.1%(-19.2)#1,159 |
| 26. | Edgemont Park | 13.1% | 34.8%(-21.7)#26 | 32.1%(-19.0)#1,193 |
| 27. | Casnovia | 13.3% | 34.8%(-21.5)#27 | 32.1%(-18.8)#1,228 |
| 28. | Charlotte | 13.6% | 34.8%(-21.2)#28 | 32.1%(-18.5)#1,250 |
| 29. | Homer | 13.8% | 34.8%(-21.0)#29 | 32.1%(-18.3)#1,271 |
| 30. | Portage | 13.9% | 34.8%(-20.9)#30 | 32.1%(-18.2)#1,274 |
| 31. | Sterling Heights | 14.3% | 34.8%(-20.5)#31 | 32.1%(-17.8)#1,315 |
| 32. | Wixom | 14.6% | 34.8%(-20.2)#32 | 32.1%(-17.5)#1,389 |
| 33. | Bloomingdale | 14.8% | 34.8%(-20.0)#33 | 32.1%(-17.3)#1,421 |
| 34. | Morrice | 15.0% | 34.8%(-19.8)#34 | 32.1%(-17.1)#1,444 |
| 35. | West Monroe | 15.3% | 34.8%(-19.5)#35 | 32.1%(-16.8)#1,471 |
| 36. | Rochester Hills | 15.5% | 34.8%(-19.3)#36 | 32.1%(-16.6)#1,499 |
| 37. | Middleville | 15.6% | 34.8%(-19.2)#37 | 32.1%(-16.5)#1,519 |
| 38. | Mason | 16.2% | 34.8%(-18.6)#38 | 32.1%(-15.9)#1,608 |
| 39. | Farmington Hills | 16.4% | 34.8%(-18.4)#39 | 32.1%(-15.7)#1,627 |
| 40. | Franklin | 16.7% | 34.8%(-18.1)#40 | 32.1%(-15.4)#1,667 |
| 41. | Posen | 16.7% | 34.8%(-18.1)#41 | 32.1%(-15.4)#1,706 |
| 42. | Sault Ste Marie | 16.8% | 34.8%(-18.0)#42 | 32.1%(-15.3)#1,711 |
| 43. | Dorr | 17.1% | 34.8%(-17.7)#43 | 32.1%(-15.0)#1,746 |
| 44. | Chelsea | 17.2% | 34.8%(-17.6)#44 | 32.1%(-14.9)#1,753 |
| 45. | Dearborn Heights | 17.8% | 34.8%(-17.0)#45 | 32.1%(-14.3)#1,828 |
| 46. | Coldwater | 17.8% | 34.8%(-17.0)#46 | 32.1%(-14.3)#1,831 |
| 47. | Escanaba | 17.9% | 34.8%(-16.9)#47 | 32.1%(-14.2)#1,843 |
| 48. | Ubly | 18.2% | 34.8%(-16.6)#48 | 32.1%(-13.9)#1,893 |
| 49. | Mecosta | 18.2% | 34.8%(-16.6)#49 | 32.1%(-13.9)#1,898 |
| 50. | Riverview | 18.4% | 34.8%(-16.4)#50 | 32.1%(-13.7)#1,916 |
| 51. | Galesburg | 18.8% | 34.8%(-16.0)#51 | 32.1%(-13.3)#1,975 |
| 52. | Lakewood Club | 18.8% | 34.8%(-16.0)#52 | 32.1%(-13.3)#1,978 |
| 53. | Columbiaville | 18.8% | 34.8%(-16.0)#53 | 32.1%(-13.3)#1,985 |
| 54. | Vermontville | 18.8% | 34.8%(-16.0)#54 | 32.1%(-13.3)#1,986 |
| 55. | Addison | 18.8% | 34.8%(-16.0)#55 | 32.1%(-13.3)#1,988 |
| 56. | Holland | 19.1% | 34.8%(-15.7)#56 | 32.1%(-13.0)#2,018 |
| 57. | St Clair Shores | 19.8% | 34.8%(-15.0)#57 | 32.1%(-12.3)#2,103 |
| 58. | Croswell | 20.0% | 34.8%(-14.8)#58 | 32.1%(-12.1)#2,131 |
| 59. | Pewamo | 20.0% | 34.8%(-14.8)#59 | 32.1%(-12.1)#2,173 |
| 60. | Otter Lake | 20.0% | 34.8%(-14.8)#60 | 32.1%(-12.1)#2,186 |
| 61. | Three Rivers | 20.1% | 34.8%(-14.7)#61 | 32.1%(-12.0)#2,207 |
| 62. | Allendale | 20.3% | 34.8%(-14.5)#62 | 32.1%(-11.8)#2,219 |
| 63. | Ann Arbor | 20.7% | 34.8%(-14.1)#63 | 32.1%(-11.4)#2,255 |
| 64. | Livonia | 20.8% | 34.8%(-14.0)#64 | 32.1%(-11.3)#2,268 |
| 65. | Marcellus | 21.1% | 34.8%(-13.7)#65 | 32.1%(-11.0)#2,319 |
| 66. | Zeeland | 21.3% | 34.8%(-13.5)#66 | 32.1%(-10.8)#2,347 |
| 67. | Newberry | 21.6% | 34.8%(-13.2)#67 | 32.1%(-10.5)#2,390 |
| 68. | Manchester | 22.2% | 34.8%(-12.6)#68 | 32.1%(-9.90)#2,454 |
| 69. | Kinde | 22.2% | 34.8%(-12.6)#69 | 32.1%(-9.90)#2,483 |
| 70. | Coopersville | 22.6% | 34.8%(-12.2)#70 | 32.1%(-9.50)#2,528 |
| 71. | Alma | 23.0% | 34.8%(-11.8)#71 | 32.1%(-9.10)#2,575 |
| 72. | Petoskey | 23.1% | 34.8%(-11.7)#72 | 32.1%(-9.00)#2,589 |
| 73. | Novi | 23.3% | 34.8%(-11.5)#73 | 32.1%(-8.80)#2,620 |
| 74. | Beecher | 23.3% | 34.8%(-11.5)#74 | 32.1%(-8.80)#2,626 |
| 75. | Deckerville | 23.3% | 34.8%(-11.5)#75 | 32.1%(-8.80)#2,631 |
| 76. | Britton | 23.5% | 34.8%(-11.3)#76 | 32.1%(-8.60)#2,659 |
| 77. | Metamora | 23.5% | 34.8%(-11.3)#77 | 32.1%(-8.60)#2,661 |
| 78. | Wyandotte | 23.7% | 34.8%(-11.1)#78 | 32.1%(-8.40)#2,674 |
| 79. | Wyoming | 23.8% | 34.8%(-11.0)#79 | 32.1%(-8.30)#2,686 |
| 80. | Reading | 23.8% | 34.8%(-11.0)#80 | 32.1%(-8.30)#2,703 |
| 81. | Sunfield | 23.8% | 34.8%(-11.0)#81 | 32.1%(-8.30)#2,704 |
| 82. | White Pigeon | 23.9% | 34.8%(-10.9)#82 | 32.1%(-8.20)#2,710 |
| 83. | Gladwin | 24.5% | 34.8%(-10.3)#83 | 32.1%(-7.60)#2,768 |
| 84. | Lincoln Park | 24.8% | 34.8%(-10.00)#84 | 32.1%(-7.30)#2,786 |
| 85. | Edwardsburg | 25.0% | 34.8%(-9.80)#85 | 32.1%(-7.10)#2,836 |
| 86. | Birch Run | 25.0% | 34.8%(-9.80)#86 | 32.1%(-7.10)#2,837 |
| 87. | Barton Hills | 25.0% | 34.8%(-9.80)#87 | 32.1%(-7.10)#2,872 |
| 88. | Vandalia | 25.0% | 34.8%(-9.80)#88 | 32.1%(-7.10)#2,879 |
| 89. | Greenville | 25.6% | 34.8%(-9.20)#89 | 32.1%(-6.50)#2,959 |
| 90. | Keego Harbor | 25.9% | 34.8%(-8.90)#90 | 32.1%(-6.20)#2,997 |
| 91. | Ecorse | 26.1% | 34.8%(-8.70)#91 | 32.1%(-6.00)#3,017 |
| 92. | Westland | 26.2% | 34.8%(-8.60)#92 | 32.1%(-5.90)#3,026 |
| 93. | Williamston | 26.4% | 34.8%(-8.40)#93 | 32.1%(-5.70)#3,075 |
| 94. | Carleton | 26.5% | 34.8%(-8.30)#94 | 32.1%(-5.60)#3,087 |
| 95. | St Charles | 26.7% | 34.8%(-8.10)#95 | 32.1%(-5.40)#3,113 |
| 96. | Coloma | 26.7% | 34.8%(-8.10)#96 | 32.1%(-5.40)#3,121 |
| 97. | Augusta | 26.7% | 34.8%(-8.10)#97 | 32.1%(-5.40)#3,125 |
| 98. | Flushing | 27.1% | 34.8%(-7.70)#98 | 32.1%(-5.00)#3,179 |
| 99. | Waldron | 27.3% | 34.8%(-7.50)#99 | 32.1%(-4.80)#3,223 |
| 100. | St Johns | 27.5% | 34.8%(-7.30)#100 | 32.1%(-4.60)#3,250 |
Common Questions
What are the Top 10 Cities with the Lowest Percentage of Births to Unmarried Women in Michigan?
Top 10 Cities with the Lowest Percentage of Births to Unmarried Women in Michigan are:
#1
0.20%
#2
3.2%
#3
3.4%
#4
3.8%
#5
4.5%
#6
4.7%
#7
5.1%
#8
6.1%
#9
6.5%
#10
7.7%
What city has the Lowest Percentage of Births to Unmarried Women in Michigan?
Hamtramck has the Lowest Percentage of Births to Unmarried Women in Michigan with 0.20%.
What is the Percentage of Births to Unmarried Women in the State of Michigan?
Percentage of Births to Unmarried Women in Michigan is 34.8%.
What is the Percentage of Births to Unmarried Women in the United States?
Percentage of Births to Unmarried Women in the United States is 32.1%.