Boyne City, MI Map & Demographics
Boyne City Map

Boyne City Overview
$38,115
PER CAPITA INCOME
$78,229
AVG FAMILY INCOME
$65,070
AVG HOUSEHOLD INCOME
30.0%
WAGE / INCOME GAP [ % ]
70.0¢/ $1
WAGE / INCOME GAP [ $ ]
0.42
INEQUALITY / GINI INDEX
3,821
TOTAL POPULATION
1,774
MALE POPULATION
2,047
FEMALE POPULATION
86.66
MALES / 100 FEMALES
115.39
FEMALES / 100 MALES
45.5
MEDIAN AGE
2.5
AVG FAMILY SIZE
2.0
AVG HOUSEHOLD SIZE
2,085
LABOR FORCE [ PEOPLE ]
64.8%
PERCENT IN LABOR FORCE
6.2%
UNEMPLOYMENT RATE
Boyne City Zip Codes
Boyne City Area Codes
Income in Boyne City
Income Overview in Boyne City
Per Capita Income in Boyne City is $38,115, while median incomes of families and households are $78,229 and $65,070 respectively.
| Characteristic | Number | Measure |
| Per Capita Income | 3,821 | $38,115 |
| Median Family Income | 1,029 | $78,229 |
| Mean Family Income | 1,029 | $100,554 |
| Median Household Income | 1,915 | $65,070 |
| Mean Household Income | 1,915 | $76,830 |
| Income Deficit | 1,029 | $0 |
| Wage / Income Gap (%) | 3,821 | 30.02% |
| Wage / Income Gap ($) | 3,821 | 69.98¢ per $1 |
| Gini / Inequality Index | 3,821 | 0.42 |
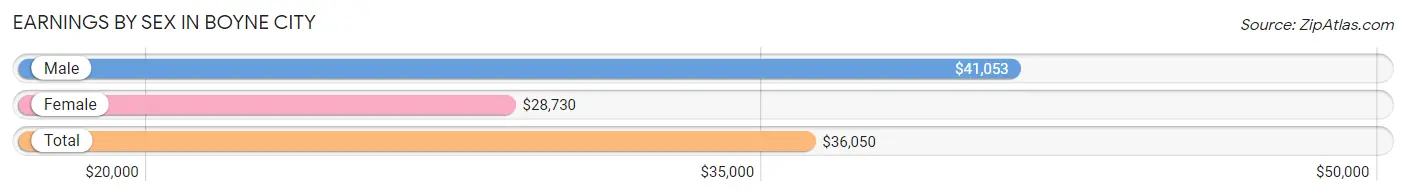
Earnings by Sex in Boyne City
Average Earnings in Boyne City are $36,050, $41,053 for men and $28,730 for women, a difference of 30.0%.
| Sex | Number | Average Earnings |
| Male | 1,190 (52.6%) | $41,053 |
| Female | 1,070 (47.3%) | $28,730 |
| Total | 2,260 (100.0%) | $36,050 |
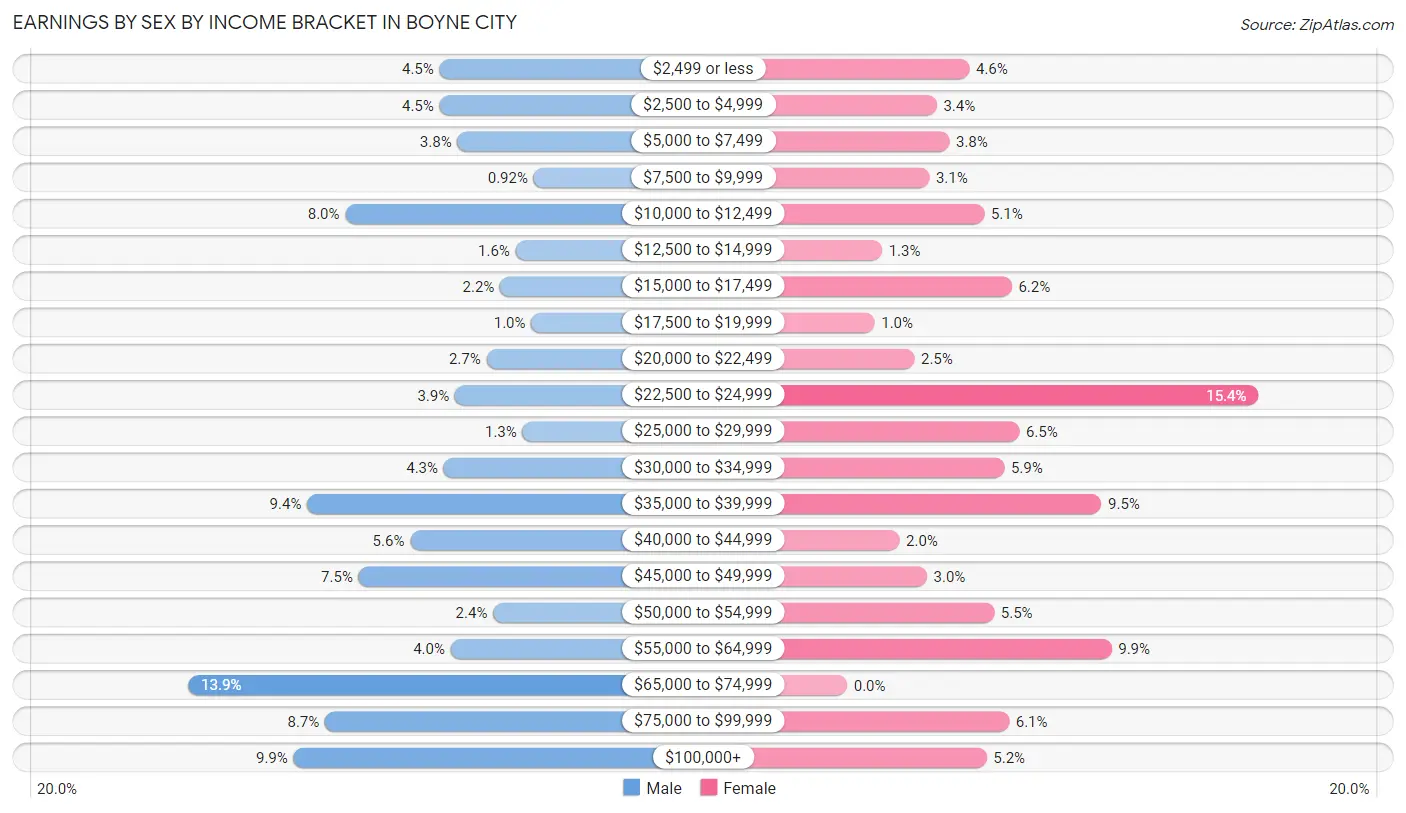
Earnings by Sex by Income Bracket in Boyne City
The most common earnings brackets in Boyne City are $65,000 to $74,999 for men (165 | 13.9%) and $22,500 to $24,999 for women (165 | 15.4%).
| Income | Male | Female |
| $2,499 or less | 53 (4.4%) | 49 (4.6%) |
| $2,500 to $4,999 | 53 (4.4%) | 36 (3.4%) |
| $5,000 to $7,499 | 45 (3.8%) | 41 (3.8%) |
| $7,500 to $9,999 | 11 (0.9%) | 33 (3.1%) |
| $10,000 to $12,499 | 95 (8.0%) | 55 (5.1%) |
| $12,500 to $14,999 | 19 (1.6%) | 14 (1.3%) |
| $15,000 to $17,499 | 26 (2.2%) | 66 (6.2%) |
| $17,500 to $19,999 | 12 (1.0%) | 11 (1.0%) |
| $20,000 to $22,499 | 32 (2.7%) | 27 (2.5%) |
| $22,500 to $24,999 | 46 (3.9%) | 165 (15.4%) |
| $25,000 to $29,999 | 16 (1.3%) | 69 (6.5%) |
| $30,000 to $34,999 | 51 (4.3%) | 63 (5.9%) |
| $35,000 to $39,999 | 112 (9.4%) | 102 (9.5%) |
| $40,000 to $44,999 | 66 (5.6%) | 21 (2.0%) |
| $45,000 to $49,999 | 89 (7.5%) | 32 (3.0%) |
| $50,000 to $54,999 | 29 (2.4%) | 59 (5.5%) |
| $55,000 to $64,999 | 48 (4.0%) | 106 (9.9%) |
| $65,000 to $74,999 | 165 (13.9%) | 0 (0.0%) |
| $75,000 to $99,999 | 104 (8.7%) | 65 (6.1%) |
| $100,000+ | 118 (9.9%) | 56 (5.2%) |
| Total | 1,190 (100.0%) | 1,070 (100.0%) |
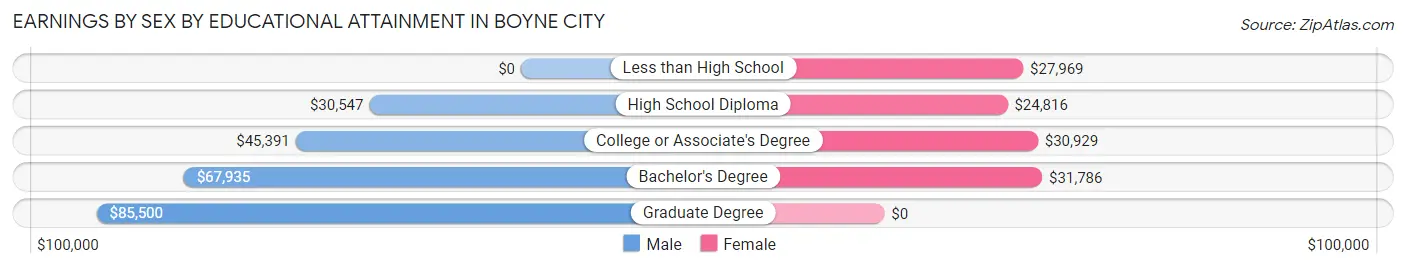
Earnings by Sex by Educational Attainment in Boyne City
Average earnings in Boyne City are $47,585 for men and $32,270 for women, a difference of 32.2%. Men with an educational attainment of graduate degree enjoy the highest average annual earnings of $85,500, while those with high school diploma education earn the least with $30,547. Women with an educational attainment of bachelor's degree earn the most with the average annual earnings of $31,786, while those with high school diploma education have the smallest earnings of $24,816.
| Educational Attainment | Male Income | Female Income |
| Less than High School | - | - |
| High School Diploma | $30,547 | $24,816 |
| College or Associate's Degree | $45,391 | $30,929 |
| Bachelor's Degree | $67,935 | $31,786 |
| Graduate Degree | $85,500 | $0 |
| Total | $47,585 | $32,270 |
Family Income in Boyne City
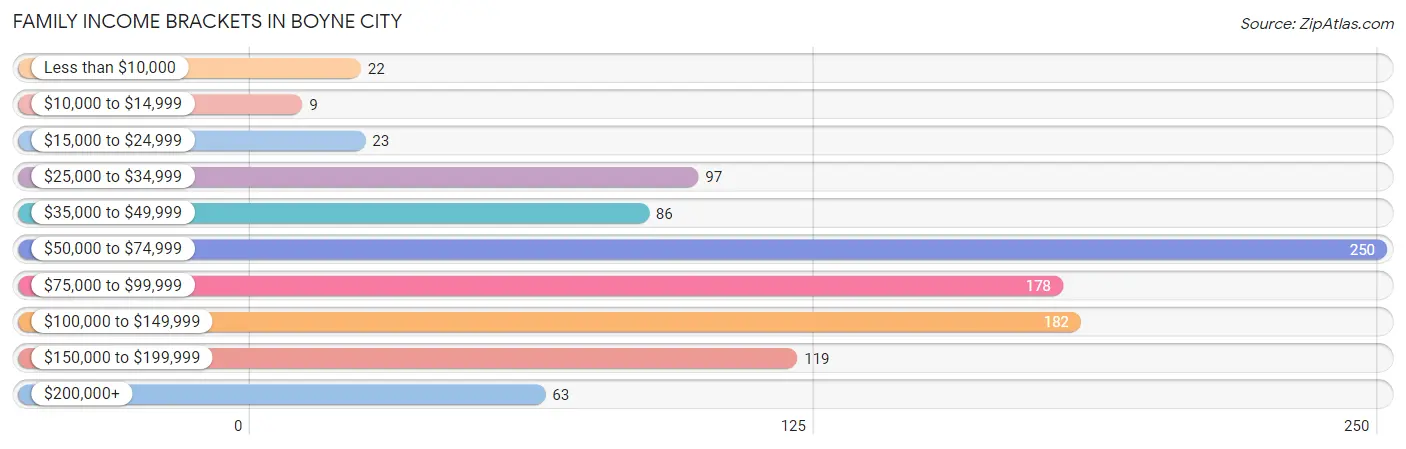
Family Income Brackets in Boyne City
According to the Boyne City family income data, there are 250 families falling into the $50,000 to $74,999 income range, which is the most common income bracket and makes up 24.3% of all families. Conversely, the $10,000 to $14,999 income bracket is the least frequent group with only 9 families (0.9%) belonging to this category.
| Income Bracket | # Families | % Families |
| Less than $10,000 | 22 | 2.1% |
| $10,000 to $14,999 | 9 | 0.9% |
| $15,000 to $24,999 | 23 | 2.2% |
| $25,000 to $34,999 | 97 | 9.4% |
| $35,000 to $49,999 | 86 | 8.4% |
| $50,000 to $74,999 | 250 | 24.3% |
| $75,000 to $99,999 | 178 | 17.3% |
| $100,000 to $149,999 | 182 | 17.7% |
| $150,000 to $199,999 | 119 | 11.6% |
| $200,000+ | 63 | 6.1% |
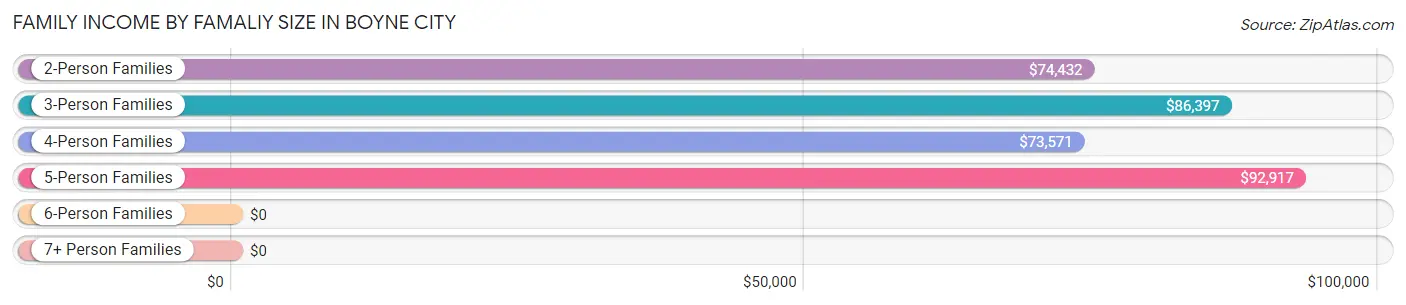
Family Income by Famaliy Size in Boyne City
5-person families (53 | 5.1%) account for the highest median family income in Boyne City with $92,917 per family, while 2-person families (611 | 59.4%) have the highest median income of $37,216 per family member.
| Income Bracket | # Families | Median Income |
| 2-Person Families | 611 (59.4%) | $74,432 |
| 3-Person Families | 196 (19.1%) | $86,397 |
| 4-Person Families | 150 (14.6%) | $73,571 |
| 5-Person Families | 53 (5.1%) | $92,917 |
| 6-Person Families | 13 (1.3%) | $0 |
| 7+ Person Families | 6 (0.6%) | $0 |
| Total | 1,029 (100.0%) | $78,229 |
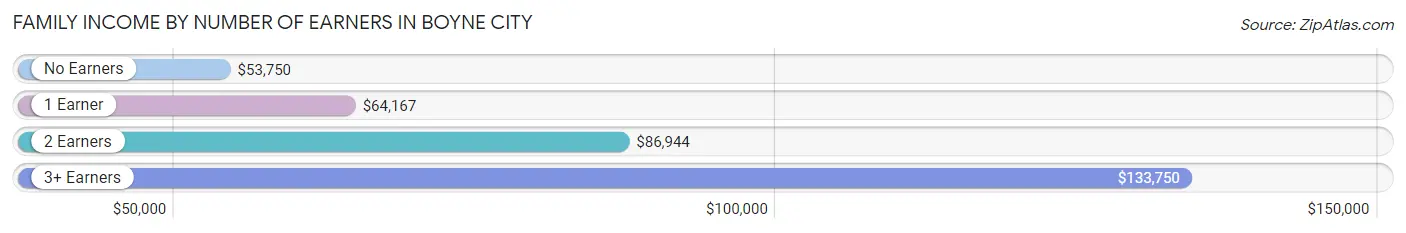
Family Income by Number of Earners in Boyne City
The median family income in Boyne City is $78,229, with families comprising 3+ earners (114) having the highest median family income of $133,750, while families with no earners (193) have the lowest median family income of $53,750, accounting for 11.1% and 18.8% of families, respectively.
| Number of Earners | # Families | Median Income |
| No Earners | 193 (18.8%) | $53,750 |
| 1 Earner | 228 (22.2%) | $64,167 |
| 2 Earners | 494 (48.0%) | $86,944 |
| 3+ Earners | 114 (11.1%) | $133,750 |
| Total | 1,029 (100.0%) | $78,229 |
Household Income in Boyne City
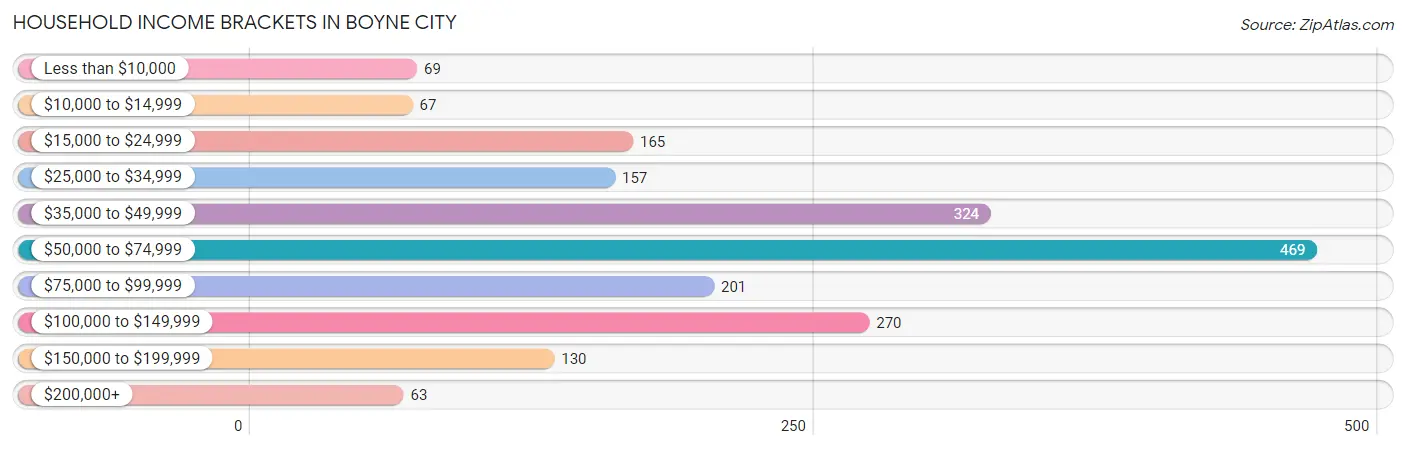
Household Income Brackets in Boyne City
With 469 households falling in the category, the $50,000 to $74,999 income range is the most frequent in Boyne City, accounting for 24.5% of all households. In contrast, only 63 households (3.3%) fall into the $200,000+ income bracket, making it the least populous group.
| Income Bracket | # Households | % Households |
| Less than $10,000 | 69 | 3.6% |
| $10,000 to $14,999 | 67 | 3.5% |
| $15,000 to $24,999 | 165 | 8.6% |
| $25,000 to $34,999 | 157 | 8.2% |
| $35,000 to $49,999 | 324 | 16.9% |
| $50,000 to $74,999 | 469 | 24.5% |
| $75,000 to $99,999 | 201 | 10.5% |
| $100,000 to $149,999 | 270 | 14.1% |
| $150,000 to $199,999 | 130 | 6.8% |
| $200,000+ | 63 | 3.3% |
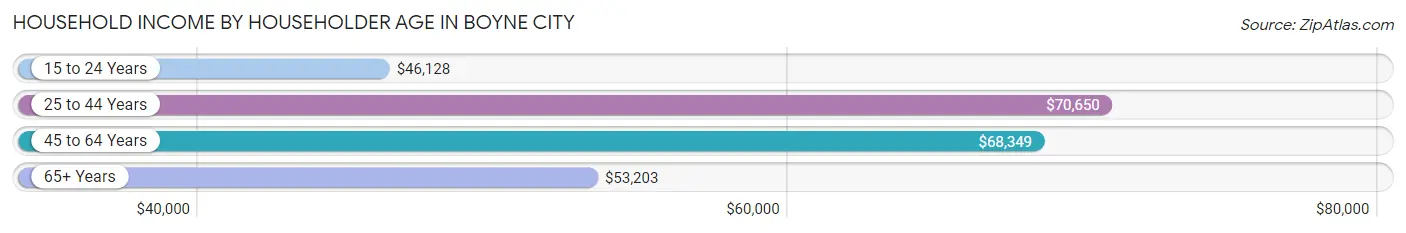
Household Income by Householder Age in Boyne City
The median household income in Boyne City is $65,070, with the highest median household income of $70,650 found in the 25 to 44 years age bracket for the primary householder. A total of 511 households (26.7%) fall into this category. Meanwhile, the 15 to 24 years age bracket for the primary householder has the lowest median household income of $46,128, with 134 households (7.0%) in this group.
| Income Bracket | # Households | Median Income |
| 15 to 24 Years | 134 (7.0%) | $46,128 |
| 25 to 44 Years | 511 (26.7%) | $70,650 |
| 45 to 64 Years | 657 (34.3%) | $68,349 |
| 65+ Years | 613 (32.0%) | $53,203 |
| Total | 1,915 (100.0%) | $65,070 |
Poverty in Boyne City
Income Below Poverty by Sex and Age in Boyne City
With 8.3% poverty level for males and 7.1% for females among the residents of Boyne City, 5 year old males and 75 year old and over females are the most vulnerable to poverty, with 5 males (45.5%) and 35 females (13.7%) in their respective age groups living below the poverty level.
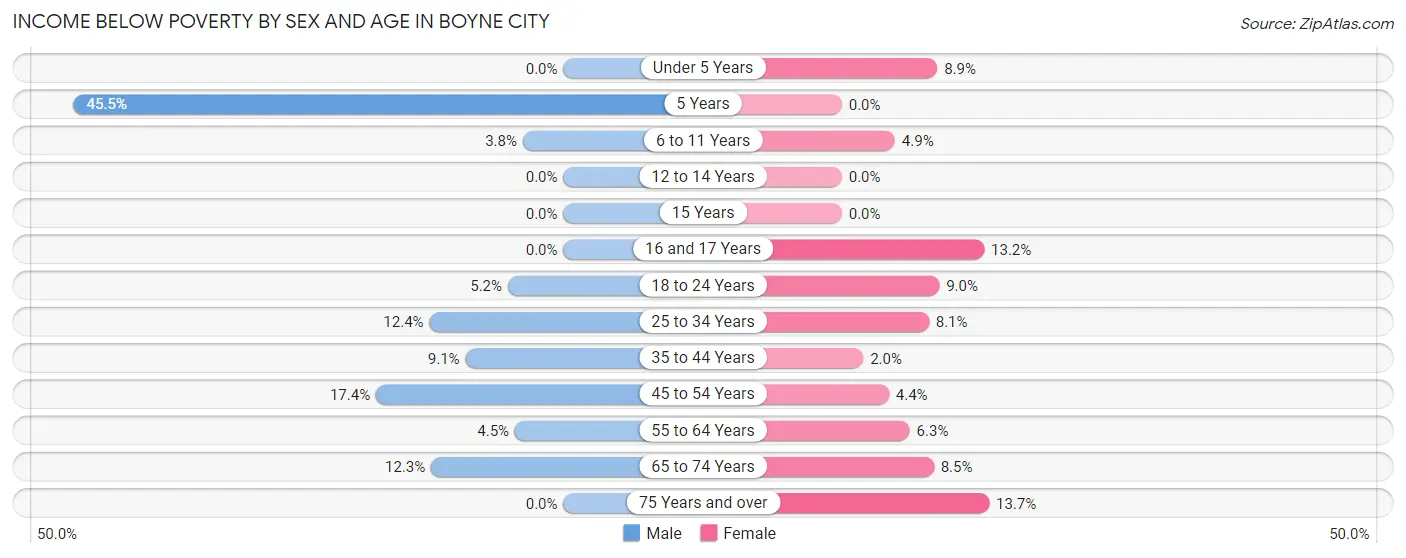
| Age Bracket | Male | Female |
| Under 5 Years | 0 (0.0%) | 7 (8.9%) |
| 5 Years | 5 (45.5%) | 0 (0.0%) |
| 6 to 11 Years | 5 (3.8%) | 7 (4.9%) |
| 12 to 14 Years | 0 (0.0%) | 0 (0.0%) |
| 15 Years | 0 (0.0%) | 0 (0.0%) |
| 16 and 17 Years | 0 (0.0%) | 7 (13.2%) |
| 18 to 24 Years | 10 (5.1%) | 17 (9.0%) |
| 25 to 34 Years | 23 (12.4%) | 18 (8.1%) |
| 35 to 44 Years | 21 (9.1%) | 4 (2.0%) |
| 45 to 54 Years | 36 (17.4%) | 11 (4.4%) |
| 55 to 64 Years | 12 (4.5%) | 17 (6.3%) |
| 65 to 74 Years | 34 (12.3%) | 22 (8.5%) |
| 75 Years and over | 0 (0.0%) | 35 (13.7%) |
| Total | 146 (8.3%) | 145 (7.1%) |
Income Above Poverty by Sex and Age in Boyne City
According to the poverty statistics in Boyne City, males aged under 5 years and females aged 5 years are the age groups that are most secure financially, with 100.0% of males and 100.0% of females in these age groups living above the poverty line.
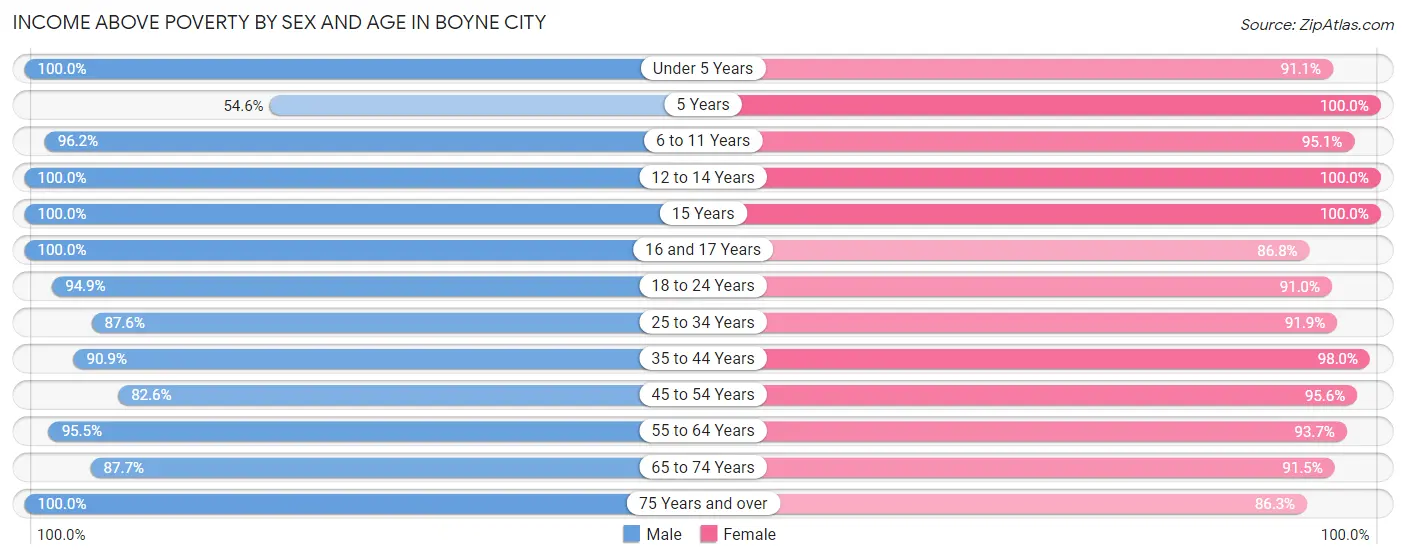
| Age Bracket | Male | Female |
| Under 5 Years | 42 (100.0%) | 72 (91.1%) |
| 5 Years | 6 (54.5%) | 10 (100.0%) |
| 6 to 11 Years | 128 (96.2%) | 135 (95.1%) |
| 12 to 14 Years | 54 (100.0%) | 83 (100.0%) |
| 15 Years | 10 (100.0%) | 20 (100.0%) |
| 16 and 17 Years | 20 (100.0%) | 46 (86.8%) |
| 18 to 24 Years | 184 (94.9%) | 171 (91.0%) |
| 25 to 34 Years | 162 (87.6%) | 205 (91.9%) |
| 35 to 44 Years | 210 (90.9%) | 197 (98.0%) |
| 45 to 54 Years | 171 (82.6%) | 241 (95.6%) |
| 55 to 64 Years | 255 (95.5%) | 253 (93.7%) |
| 65 to 74 Years | 243 (87.7%) | 236 (91.5%) |
| 75 Years and over | 136 (100.0%) | 221 (86.3%) |
| Total | 1,621 (91.7%) | 1,890 (92.9%) |
Income Below Poverty Among Married-Couple Families in Boyne City
The poverty statistics for married-couple families in Boyne City show that 1.8% or 13 of the total 703 families live below the poverty line. Families with 1 or 2 children have the highest poverty rate of 6.8%, comprising of 8 families. On the other hand, families with 3 or 4 children have the lowest poverty rate of 0.0%, which includes 0 families.
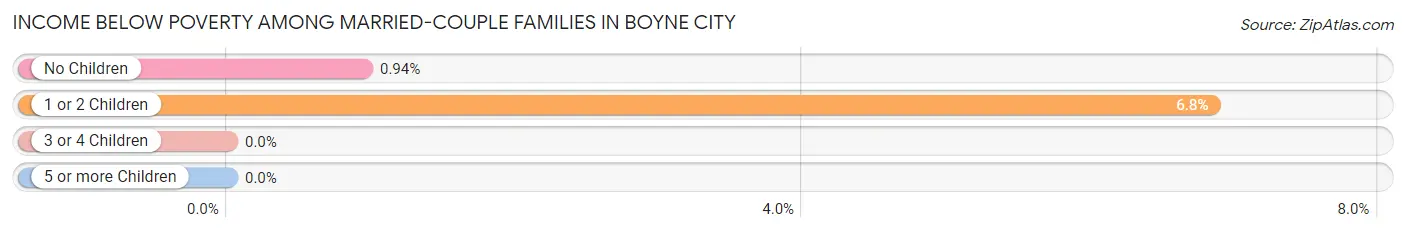
| Children | Above Poverty | Below Poverty |
| No Children | 529 (99.1%) | 5 (0.9%) |
| 1 or 2 Children | 109 (93.2%) | 8 (6.8%) |
| 3 or 4 Children | 52 (100.0%) | 0 (0.0%) |
| 5 or more Children | 0 (0.0%) | 0 (0.0%) |
| Total | 690 (98.2%) | 13 (1.8%) |
Income Below Poverty Among Single-Parent Households in Boyne City
According to the poverty data in Boyne City, 15.7% or 18 single-father households and 5.2% or 11 single-mother households are living below the poverty line. Among single-father households, those with 3 or 4 children have the highest poverty rate, with 9 households (100.0%) experiencing poverty. Likewise, among single-mother households, those with no children have the highest poverty rate, with 11 households (11.1%) falling below the poverty line.
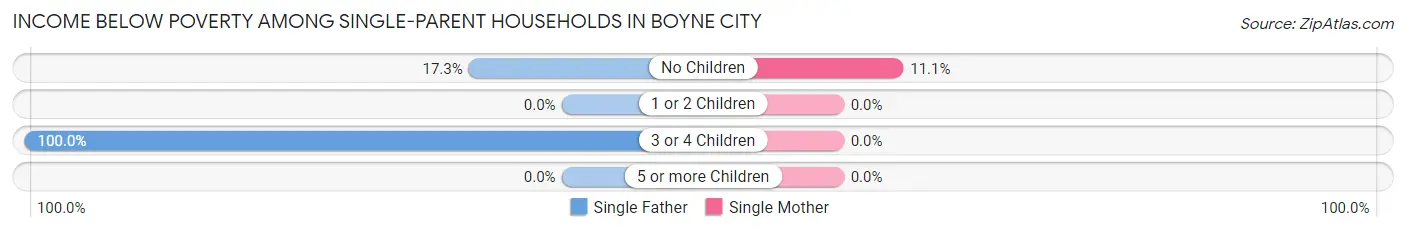
| Children | Single Father | Single Mother |
| No Children | 9 (17.3%) | 11 (11.1%) |
| 1 or 2 Children | 0 (0.0%) | 0 (0.0%) |
| 3 or 4 Children | 9 (100.0%) | 0 (0.0%) |
| 5 or more Children | 0 (0.0%) | 0 (0.0%) |
| Total | 18 (15.7%) | 11 (5.2%) |
Income Below Poverty Among Married-Couple vs Single-Parent Households in Boyne City
The poverty data for Boyne City shows that 13 of the married-couple family households (1.8%) and 29 of the single-parent households (8.9%) are living below the poverty level. Within the married-couple family households, those with 1 or 2 children have the highest poverty rate, with 8 households (6.8%) falling below the poverty line. Among the single-parent households, those with 3 or 4 children have the highest poverty rate, with 9 household (27.3%) living below poverty.
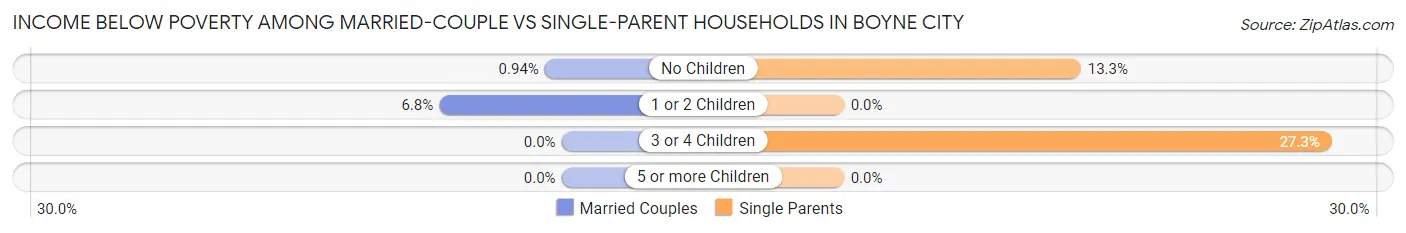
| Children | Married-Couple Families | Single-Parent Households |
| No Children | 5 (0.9%) | 20 (13.3%) |
| 1 or 2 Children | 8 (6.8%) | 0 (0.0%) |
| 3 or 4 Children | 0 (0.0%) | 9 (27.3%) |
| 5 or more Children | 0 (0.0%) | 0 (0.0%) |
| Total | 13 (1.8%) | 29 (8.9%) |
Race in Boyne City
The most populous races in Boyne City are White / Caucasian (3,605 | 94.4%), Two or more Races (112 | 2.9%), and Hispanic or Latino (109 | 2.9%).
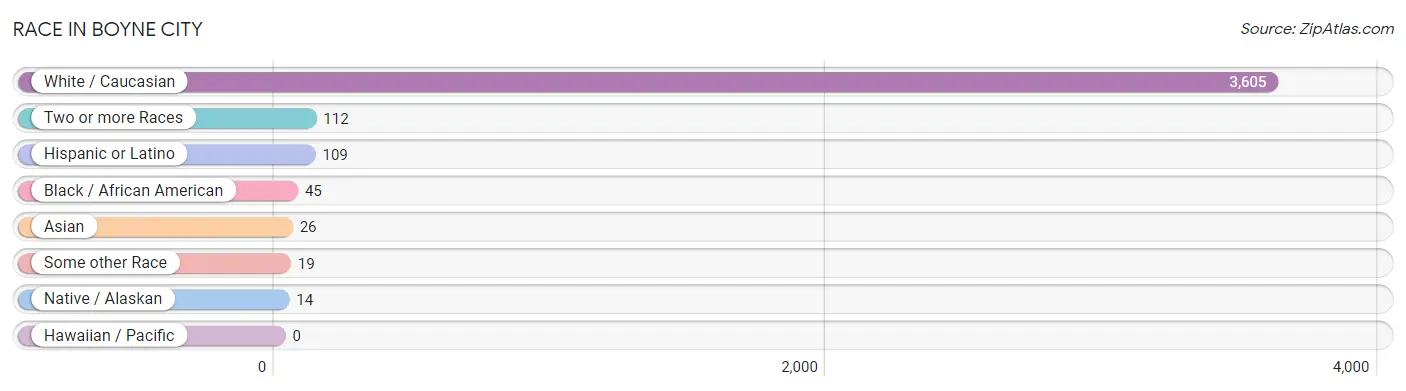
| Race | # Population | % Population |
| Asian | 26 | 0.7% |
| Black / African American | 45 | 1.2% |
| Hawaiian / Pacific | 0 | 0.0% |
| Hispanic or Latino | 109 | 2.9% |
| Native / Alaskan | 14 | 0.4% |
| White / Caucasian | 3,605 | 94.4% |
| Two or more Races | 112 | 2.9% |
| Some other Race | 19 | 0.5% |
| Total | 3,821 | 100.0% |
Ancestry in Boyne City
The most populous ancestries reported in Boyne City are German (873 | 22.9%), English (682 | 17.8%), Irish (557 | 14.6%), Polish (256 | 6.7%), and Dutch (221 | 5.8%), together accounting for 67.8% of all Boyne City residents.
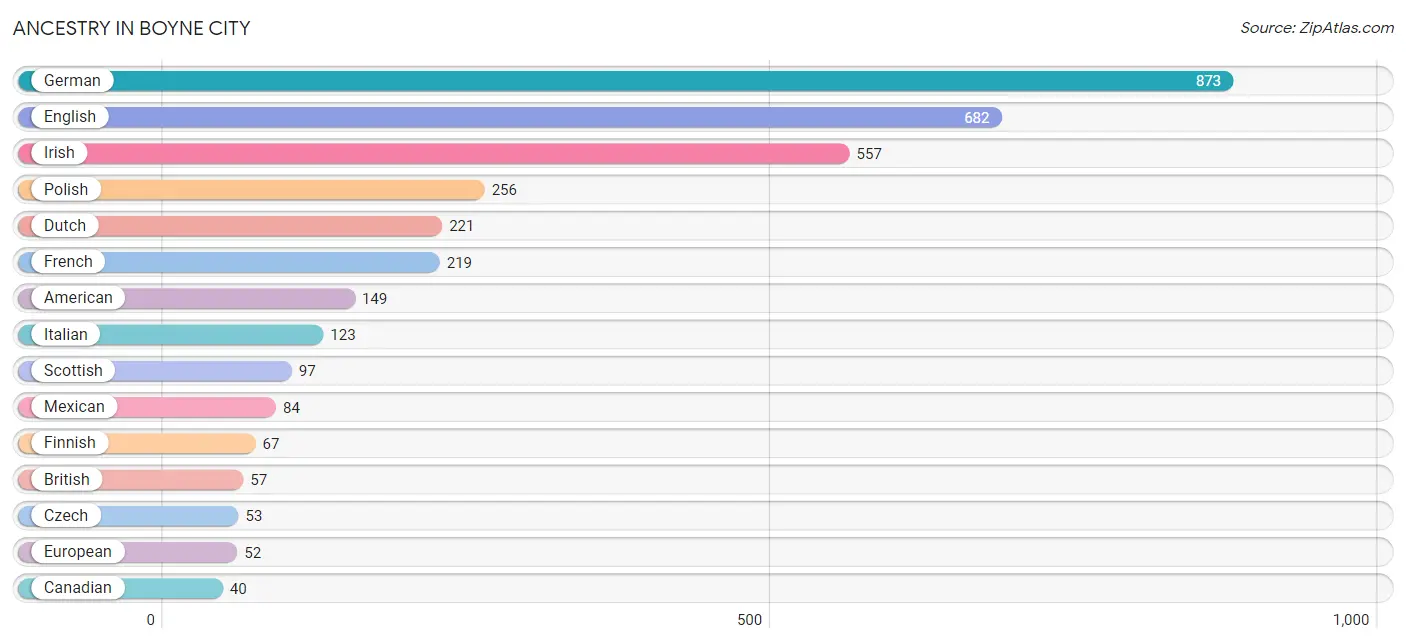
| Ancestry | # Population | % Population |
| American | 149 | 3.9% |
| Arab | 10 | 0.3% |
| Austrian | 6 | 0.2% |
| Bangladeshi | 15 | 0.4% |
| Basque | 3 | 0.1% |
| Belgian | 12 | 0.3% |
| Bhutanese | 5 | 0.1% |
| British | 57 | 1.5% |
| Canadian | 40 | 1.1% |
| Central American | 22 | 0.6% |
| Chippewa | 17 | 0.4% |
| Costa Rican | 3 | 0.1% |
| Czech | 53 | 1.4% |
| Dutch | 221 | 5.8% |
| Eastern European | 3 | 0.1% |
| English | 682 | 17.8% |
| Ethiopian | 12 | 0.3% |
| European | 52 | 1.4% |
| Finnish | 67 | 1.8% |
| French | 219 | 5.7% |
| French American Indian | 7 | 0.2% |
| French Canadian | 32 | 0.8% |
| German | 873 | 22.9% |
| Greek | 14 | 0.4% |
| Guatemalan | 19 | 0.5% |
| Hungarian | 13 | 0.3% |
| Irish | 557 | 14.6% |
| Italian | 123 | 3.2% |
| Korean | 6 | 0.2% |
| Lebanese | 10 | 0.3% |
| Lithuanian | 3 | 0.1% |
| Mexican | 84 | 2.2% |
| Northern European | 33 | 0.9% |
| Norwegian | 22 | 0.6% |
| Ottawa | 3 | 0.1% |
| Polish | 256 | 6.7% |
| Puerto Rican | 3 | 0.1% |
| Russian | 30 | 0.8% |
| Scandinavian | 6 | 0.2% |
| Scotch-Irish | 21 | 0.5% |
| Scottish | 97 | 2.5% |
| Subsaharan African | 12 | 0.3% |
| Swedish | 40 | 1.1% |
| Welsh | 40 | 1.1% | View All 44 Rows |
Immigrants in Boyne City
The most numerous immigrant groups reported in Boyne City came from Asia (18 | 0.5%), South Eastern Asia (13 | 0.3%), Africa (12 | 0.3%), Eastern Africa (12 | 0.3%), and Ethiopia (12 | 0.3%), together accounting for 1.7% of all Boyne City residents.
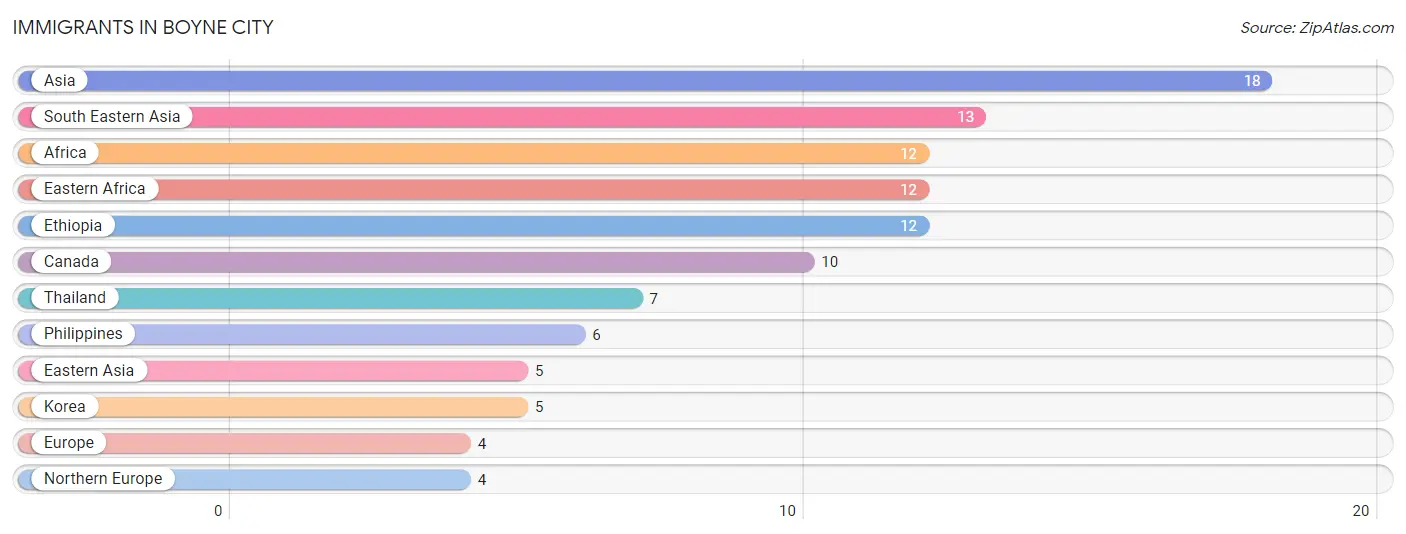
| Immigration Origin | # Population | % Population |
| Africa | 12 | 0.3% |
| Asia | 18 | 0.5% |
| Canada | 10 | 0.3% |
| Eastern Africa | 12 | 0.3% |
| Eastern Asia | 5 | 0.1% |
| Ethiopia | 12 | 0.3% |
| Europe | 4 | 0.1% |
| Korea | 5 | 0.1% |
| Northern Europe | 4 | 0.1% |
| Philippines | 6 | 0.2% |
| South Eastern Asia | 13 | 0.3% |
| Thailand | 7 | 0.2% | View All 12 Rows |
Sex and Age in Boyne City
Sex and Age in Boyne City
The most populous age groups in Boyne City are 60 to 64 Years (175 | 9.9%) for men and 60 to 64 Years (171 | 8.4%) for women.
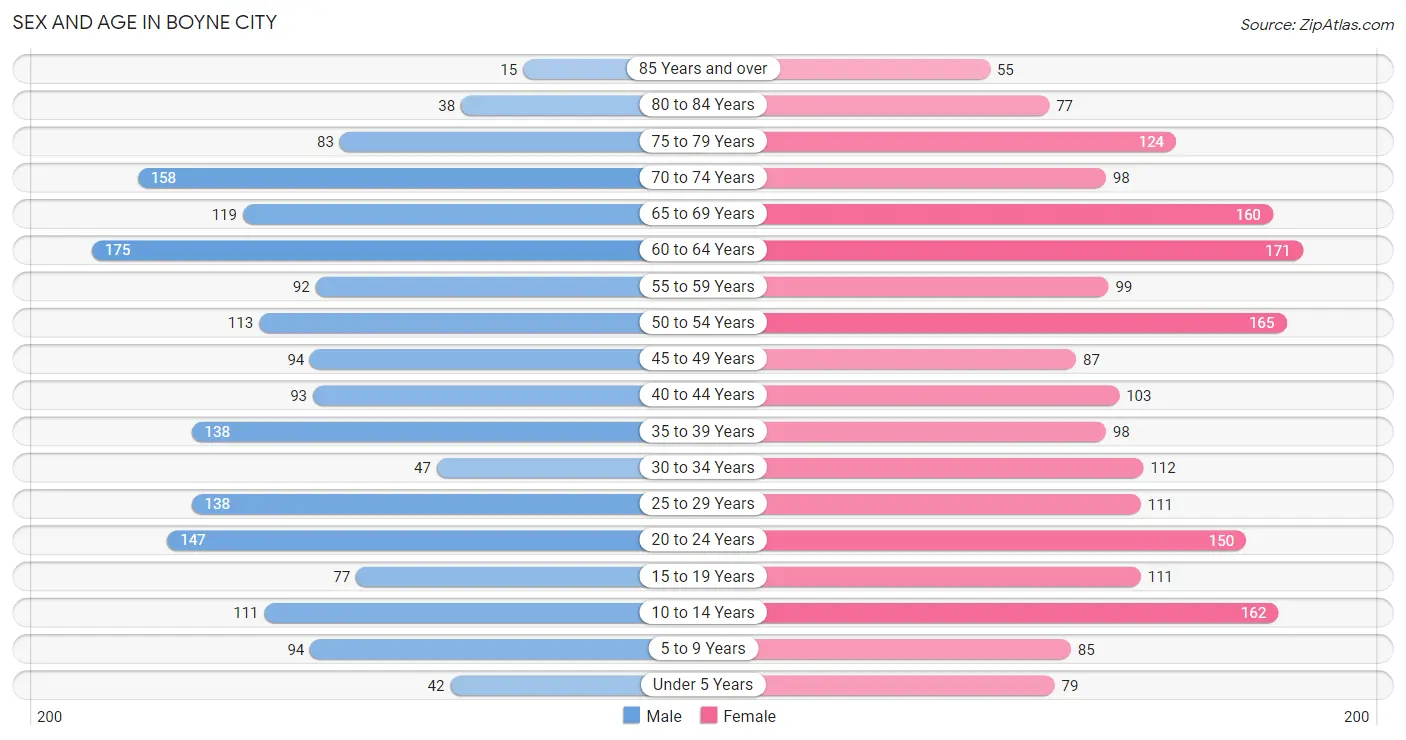
| Age Bracket | Male | Female |
| Under 5 Years | 42 (2.4%) | 79 (3.9%) |
| 5 to 9 Years | 94 (5.3%) | 85 (4.2%) |
| 10 to 14 Years | 111 (6.3%) | 162 (7.9%) |
| 15 to 19 Years | 77 (4.3%) | 111 (5.4%) |
| 20 to 24 Years | 147 (8.3%) | 150 (7.3%) |
| 25 to 29 Years | 138 (7.8%) | 111 (5.4%) |
| 30 to 34 Years | 47 (2.6%) | 112 (5.5%) |
| 35 to 39 Years | 138 (7.8%) | 98 (4.8%) |
| 40 to 44 Years | 93 (5.2%) | 103 (5.0%) |
| 45 to 49 Years | 94 (5.3%) | 87 (4.3%) |
| 50 to 54 Years | 113 (6.4%) | 165 (8.1%) |
| 55 to 59 Years | 92 (5.2%) | 99 (4.8%) |
| 60 to 64 Years | 175 (9.9%) | 171 (8.4%) |
| 65 to 69 Years | 119 (6.7%) | 160 (7.8%) |
| 70 to 74 Years | 158 (8.9%) | 98 (4.8%) |
| 75 to 79 Years | 83 (4.7%) | 124 (6.1%) |
| 80 to 84 Years | 38 (2.1%) | 77 (3.8%) |
| 85 Years and over | 15 (0.9%) | 55 (2.7%) |
| Total | 1,774 (100.0%) | 2,047 (100.0%) |
Families and Households in Boyne City
Median Family Size in Boyne City
The median family size in Boyne City is 2.54 persons per family, with married-couple families (703 | 68.3%) accounting for the largest median family size of 2.6 persons per family. On the other hand, single male/father families (115 | 11.2%) represent the smallest median family size with 2.39 persons per family.
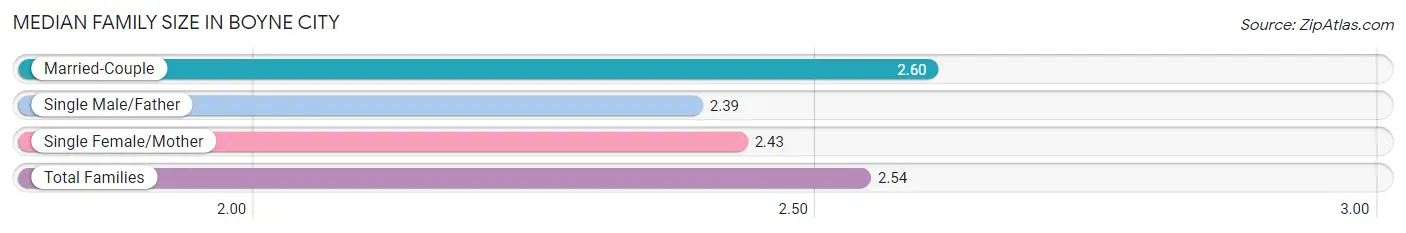
| Family Type | # Families | Family Size |
| Married-Couple | 703 (68.3%) | 2.60 |
| Single Male/Father | 115 (11.2%) | 2.39 |
| Single Female/Mother | 211 (20.5%) | 2.43 |
| Total Families | 1,029 (100.0%) | 2.54 |
Median Household Size in Boyne City
The median household size in Boyne City is 1.98 persons per household, with single male/father households (115 | 6.0%) accounting for the largest median household size of 2.74 persons per household. non-family households (886 | 46.3%) represent the smallest median household size with 1.27 persons per household.
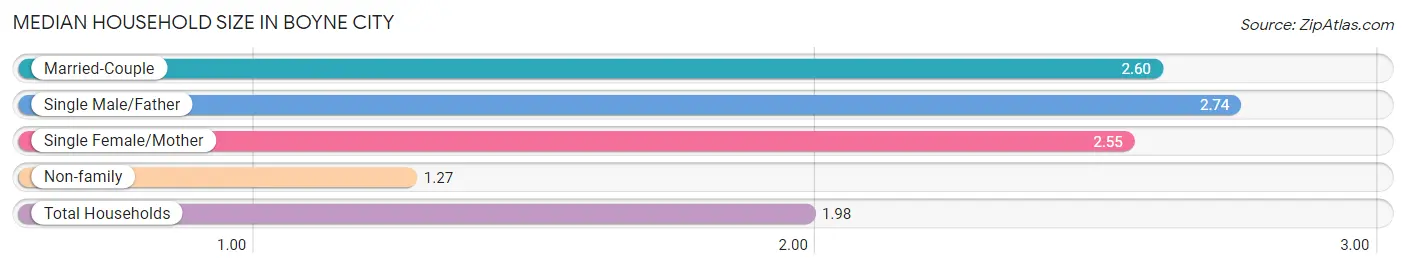
| Household Type | # Households | Household Size |
| Married-Couple | 703 (36.7%) | 2.60 |
| Single Male/Father | 115 (6.0%) | 2.74 |
| Single Female/Mother | 211 (11.0%) | 2.55 |
| Non-family | 886 (46.3%) | 1.27 |
| Total Households | 1,915 (100.0%) | 1.98 |
Household Size by Marriage Status in Boyne City
Out of a total of 1,915 households in Boyne City, 1,029 (53.7%) are family households, while 886 (46.3%) are nonfamily households. The most numerous type of family households are 2-person households, comprising 606, and the most common type of nonfamily households are 1-person households, comprising 677.
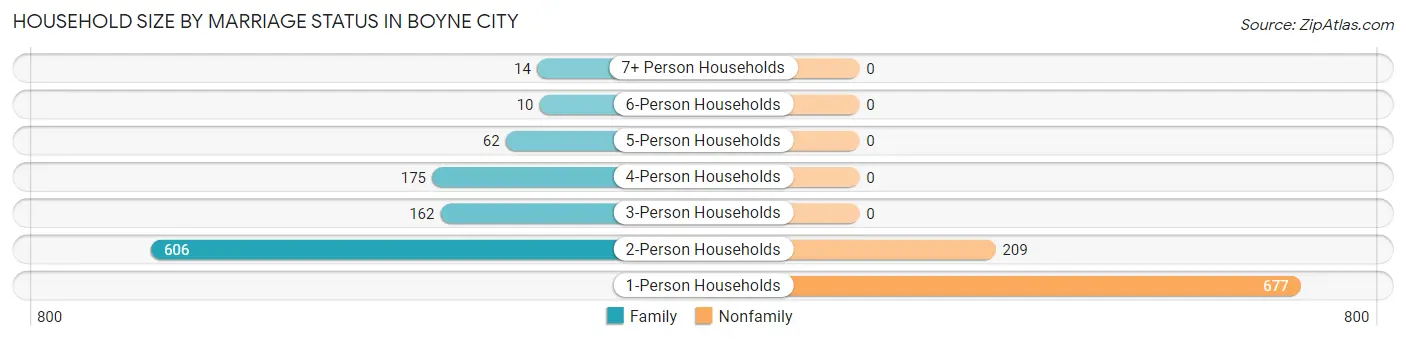
| Household Size | Family Households | Nonfamily Households |
| 1-Person Households | - | 677 (35.3%) |
| 2-Person Households | 606 (31.6%) | 209 (10.9%) |
| 3-Person Households | 162 (8.5%) | 0 (0.0%) |
| 4-Person Households | 175 (9.1%) | 0 (0.0%) |
| 5-Person Households | 62 (3.2%) | 0 (0.0%) |
| 6-Person Households | 10 (0.5%) | 0 (0.0%) |
| 7+ Person Households | 14 (0.7%) | 0 (0.0%) |
| Total | 1,029 (53.7%) | 886 (46.3%) |
Female Fertility in Boyne City
Fertility by Age in Boyne City
Average fertility rate in Boyne City is 56.0 births per 1,000 women. Women in the age bracket of 20 to 34 years have the highest fertility rate with 121.0 births per 1,000 women. Women in the age bracket of 20 to 34 years acount for 100.0% of all women with births.
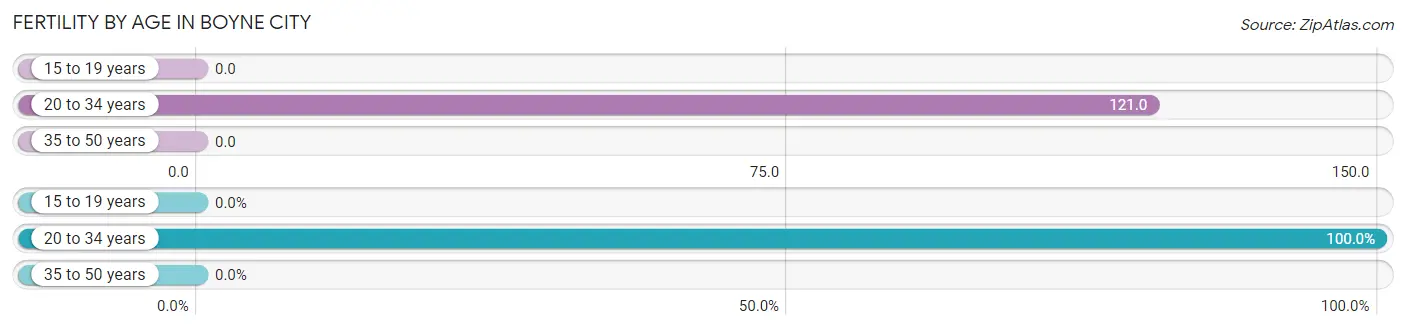
| Age Bracket | Women with Births | Births / 1,000 Women |
| 15 to 19 years | 0 (0.0%) | 0.0 |
| 20 to 34 years | 45 (100.0%) | 121.0 |
| 35 to 50 years | 0 (0.0%) | 0.0 |
| Total | 45 (100.0%) | 56.0 |
Fertility by Age by Marriage Status in Boyne City
44.4% of women with births (45) in Boyne City are married. The highest percentage of unmarried women with births falls into 20 to 34 years age bracket with 55.6% of them unmarried at the time of birth, while the lowest percentage of unmarried women with births belong to 20 to 34 years age bracket with 55.6% of them unmarried.
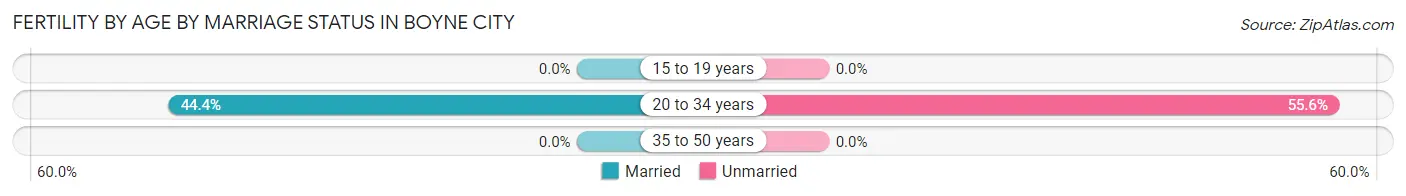
| Age Bracket | Married | Unmarried |
| 15 to 19 years | 0 (0.0%) | 0 (0.0%) |
| 20 to 34 years | 20 (44.4%) | 25 (55.6%) |
| 35 to 50 years | 0 (0.0%) | 0 (0.0%) |
| Total | 20 (44.4%) | 25 (55.6%) |
Fertility by Education in Boyne City
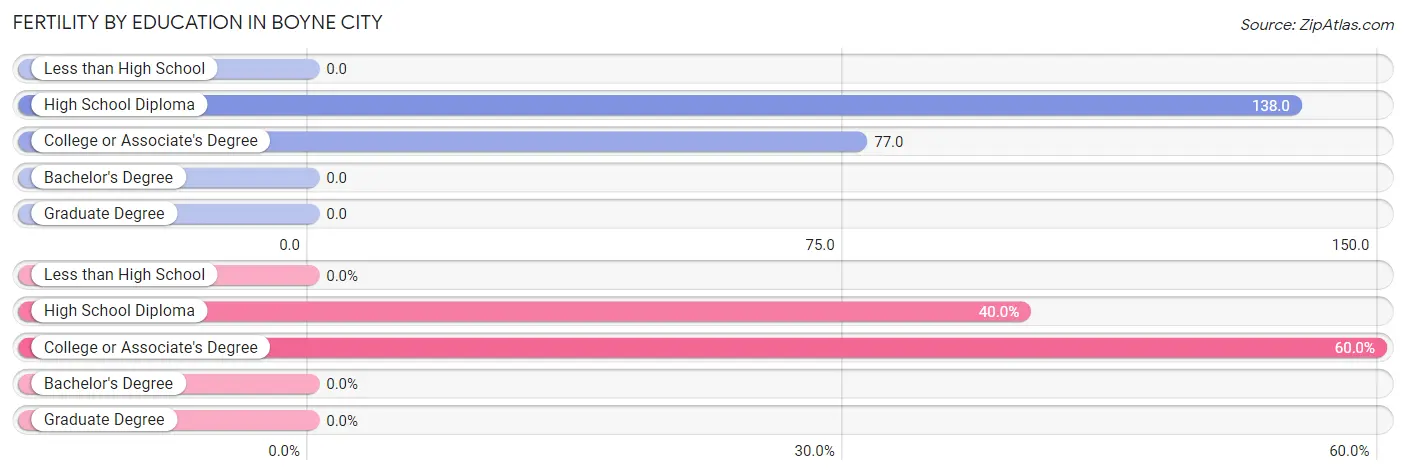
| Educational Attainment | Women with Births | Births / 1,000 Women |
| Less than High School | 0 (0.0%) | 0.0 |
| High School Diploma | 18 (40.0%) | 138.0 |
| College or Associate's Degree | 27 (60.0%) | 77.0 |
| Bachelor's Degree | 0 (0.0%) | 0.0 |
| Graduate Degree | 0 (0.0%) | 0.0 |
| Total | 45 (100.0%) | 56.0 |
Fertility by Education by Marriage Status in Boyne City
55.6% of women with births in Boyne City are unmarried. Women with the educational attainment of high school diploma are most likely to be married with 88.9% of them married at childbirth, while women with the educational attainment of college or associate's degree are least likely to be married with 85.2% of them unmarried at childbirth.
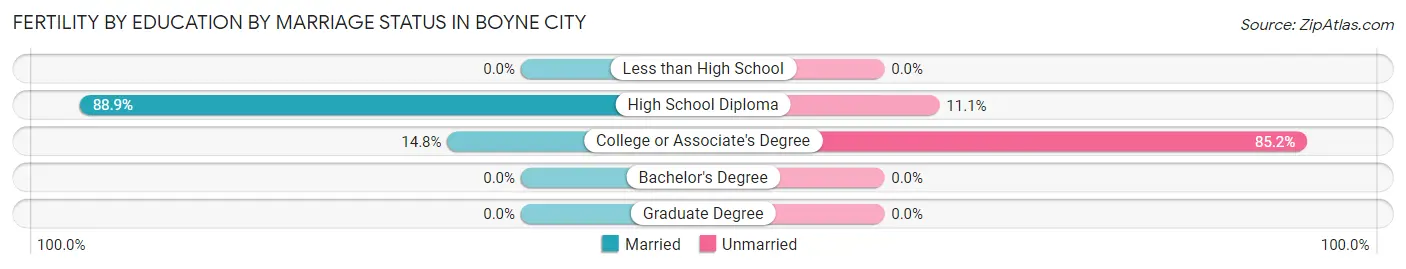
| Educational Attainment | Married | Unmarried |
| Less than High School | 0 (0.0%) | 0 (0.0%) |
| High School Diploma | 16 (88.9%) | 2 (11.1%) |
| College or Associate's Degree | 4 (14.8%) | 23 (85.2%) |
| Bachelor's Degree | 0 (0.0%) | 0 (0.0%) |
| Graduate Degree | 0 (0.0%) | 0 (0.0%) |
| Total | 20 (44.4%) | 25 (55.6%) |
Employment Characteristics in Boyne City
Employment by Class of Employer in Boyne City
Among the 1,927 employed individuals in Boyne City, private company employees (1,198 | 62.2%), self-employed (not incorporated) (208 | 10.8%), and local government employees (177 | 9.2%) make up the most common classes of employment.
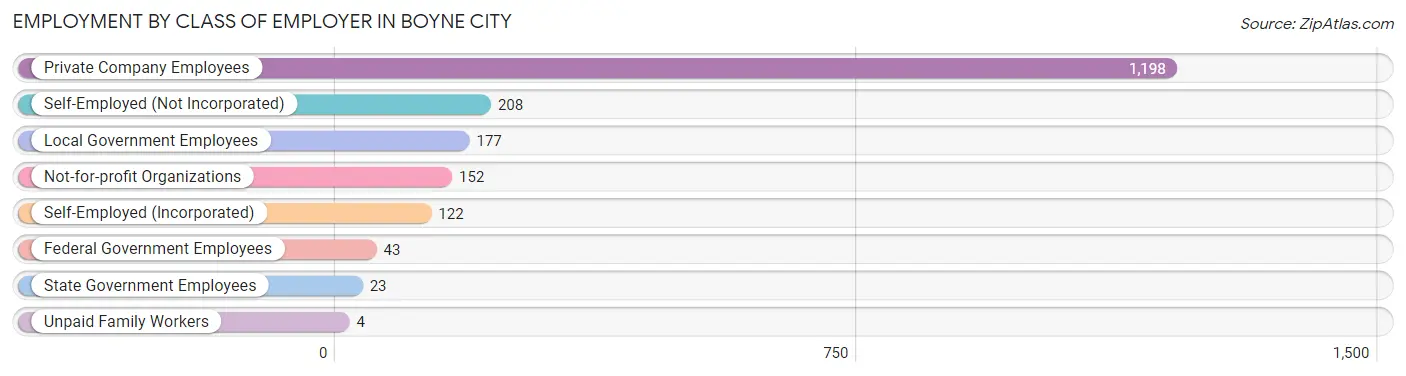
| Employer Class | # Employees | % Employees |
| Private Company Employees | 1,198 | 62.2% |
| Self-Employed (Incorporated) | 122 | 6.3% |
| Self-Employed (Not Incorporated) | 208 | 10.8% |
| Not-for-profit Organizations | 152 | 7.9% |
| Local Government Employees | 177 | 9.2% |
| State Government Employees | 23 | 1.2% |
| Federal Government Employees | 43 | 2.2% |
| Unpaid Family Workers | 4 | 0.2% |
| Total | 1,927 | 100.0% |
Employment Status by Age in Boyne City
According to the labor force statistics for Boyne City, out of the total population over 16 years of age (3,218), 64.8% or 2,085 individuals are in the labor force, with 6.2% or 129 of them unemployed. The age group with the highest labor force participation rate is 20 to 24 years, with 100.0% or 297 individuals in the labor force. Within the labor force, the 20 to 24 years age range has the highest percentage of unemployed individuals, with 27.6% or 82 of them being unemployed.
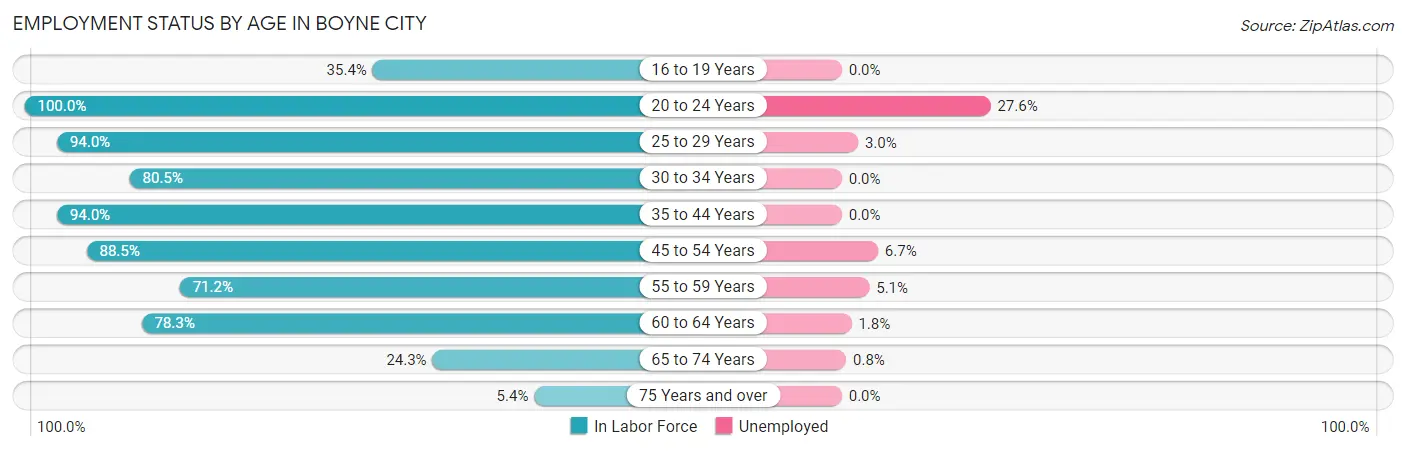
| Age Bracket | In Labor Force | Unemployed |
| 16 to 19 Years | 56 (35.4%) | 0 (0.0%) |
| 20 to 24 Years | 297 (100.0%) | 82 (27.6%) |
| 25 to 29 Years | 234 (94.0%) | 7 (3.0%) |
| 30 to 34 Years | 128 (80.5%) | 0 (0.0%) |
| 35 to 44 Years | 406 (94.0%) | 0 (0.0%) |
| 45 to 54 Years | 406 (88.5%) | 27 (6.7%) |
| 55 to 59 Years | 136 (71.2%) | 7 (5.1%) |
| 60 to 64 Years | 271 (78.3%) | 5 (1.8%) |
| 65 to 74 Years | 130 (24.3%) | 1 (0.8%) |
| 75 Years and over | 21 (5.4%) | 0 (0.0%) |
| Total | 2,085 (64.8%) | 129 (6.2%) |
Employment Status by Educational Attainment in Boyne City
According to labor force statistics for Boyne City, 86.1% of individuals (1,581) out of the total population between 25 and 64 years of age (1,836) are in the labor force, with 2.9% or 46 of them being unemployed. The group with the highest labor force participation rate are those with the educational attainment of bachelor's degree or higher, with 94.0% or 579 individuals in the labor force. Within the labor force, individuals with less than high school education have the highest percentage of unemployment, with 9.6% or 5 of them being unemployed.
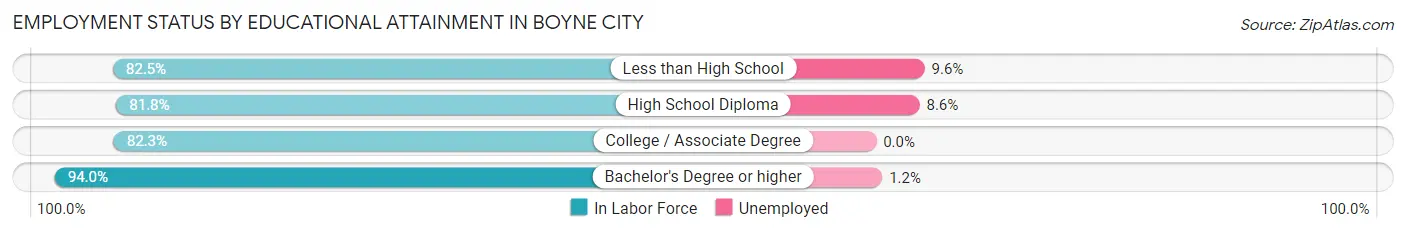
| Educational Attainment | In Labor Force | Unemployed |
| Less than High School | 52 (82.5%) | 6 (9.6%) |
| High School Diploma | 396 (81.8%) | 42 (8.6%) |
| College / Associate Degree | 554 (82.3%) | 0 (0.0%) |
| Bachelor's Degree or higher | 579 (94.0%) | 7 (1.2%) |
| Total | 1,581 (86.1%) | 53 (2.9%) |
Employment Occupations by Sex in Boyne City
Management, Business, Science and Arts Occupations
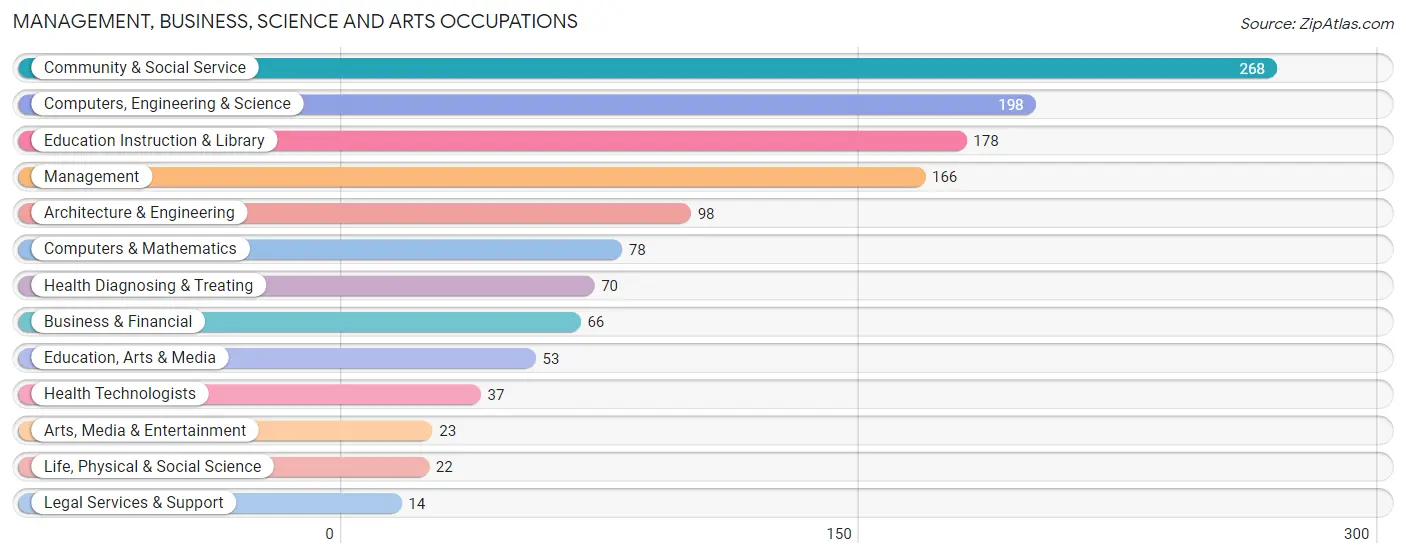
The most common Management, Business, Science and Arts occupations in Boyne City are Community & Social Service (268 | 13.7%), Computers, Engineering & Science (198 | 10.1%), Education Instruction & Library (178 | 9.1%), Management (166 | 8.5%), and Architecture & Engineering (98 | 5.0%).
Management, Business, Science and Arts Occupations by Sex
Within the Management, Business, Science and Arts occupations in Boyne City, the most male-oriented occupations are Computers & Mathematics (100.0%), Arts, Media & Entertainment (100.0%), and Architecture & Engineering (87.8%), while the most female-oriented occupations are Legal Services & Support (100.0%), Education Instruction & Library (85.4%), and Health Diagnosing & Treating (70.0%).
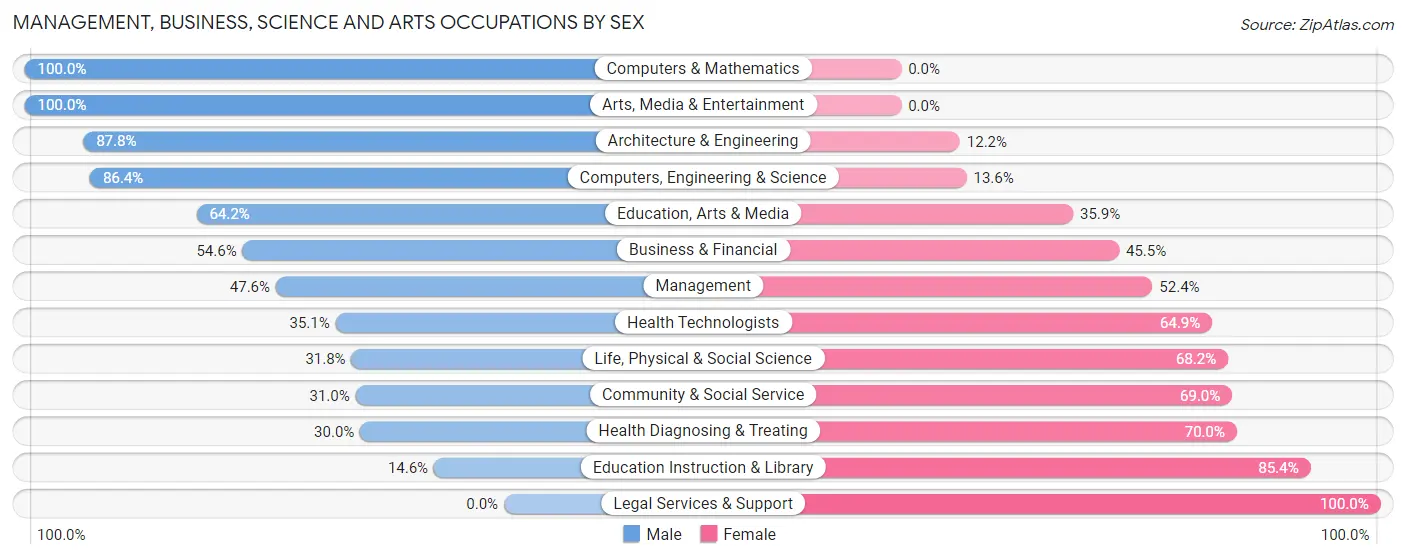
| Occupation | Male | Female |
| Management | 79 (47.6%) | 87 (52.4%) |
| Business & Financial | 36 (54.5%) | 30 (45.5%) |
| Computers, Engineering & Science | 171 (86.4%) | 27 (13.6%) |
| Computers & Mathematics | 78 (100.0%) | 0 (0.0%) |
| Architecture & Engineering | 86 (87.8%) | 12 (12.2%) |
| Life, Physical & Social Science | 7 (31.8%) | 15 (68.2%) |
| Community & Social Service | 83 (31.0%) | 185 (69.0%) |
| Education, Arts & Media | 34 (64.1%) | 19 (35.8%) |
| Legal Services & Support | 0 (0.0%) | 14 (100.0%) |
| Education Instruction & Library | 26 (14.6%) | 152 (85.4%) |
| Arts, Media & Entertainment | 23 (100.0%) | 0 (0.0%) |
| Health Diagnosing & Treating | 21 (30.0%) | 49 (70.0%) |
| Health Technologists | 13 (35.1%) | 24 (64.9%) |
| Total (Category) | 390 (50.8%) | 378 (49.2%) |
| Total (Overall) | 1,001 (51.2%) | 955 (48.8%) |
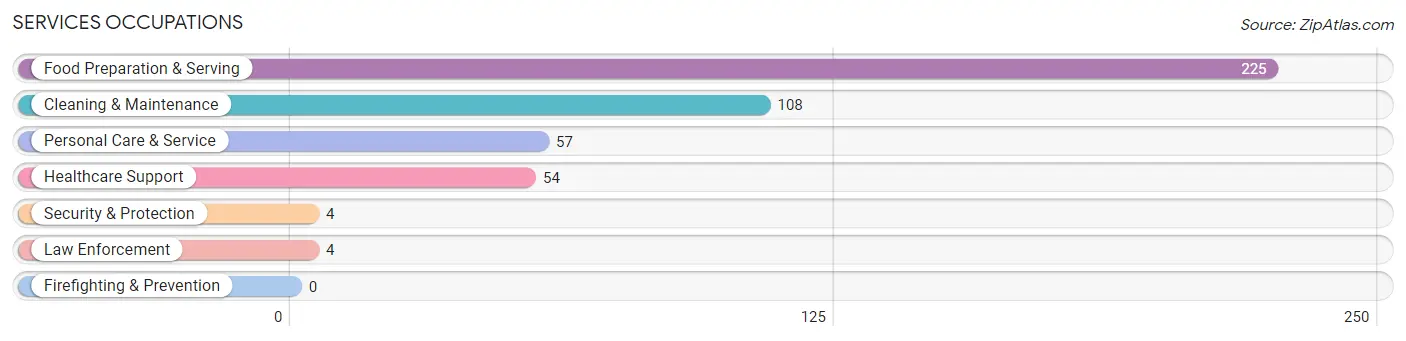
Services Occupations
The most common Services occupations in Boyne City are Food Preparation & Serving (225 | 11.5%), Cleaning & Maintenance (108 | 5.5%), Personal Care & Service (57 | 2.9%), Healthcare Support (54 | 2.8%), and Security & Protection (4 | 0.2%).
Services Occupations by Sex
Within the Services occupations in Boyne City, the most male-oriented occupations are Security & Protection (100.0%), Law Enforcement (100.0%), and Cleaning & Maintenance (72.2%), while the most female-oriented occupations are Personal Care & Service (100.0%), Food Preparation & Serving (72.9%), and Healthcare Support (50.0%).
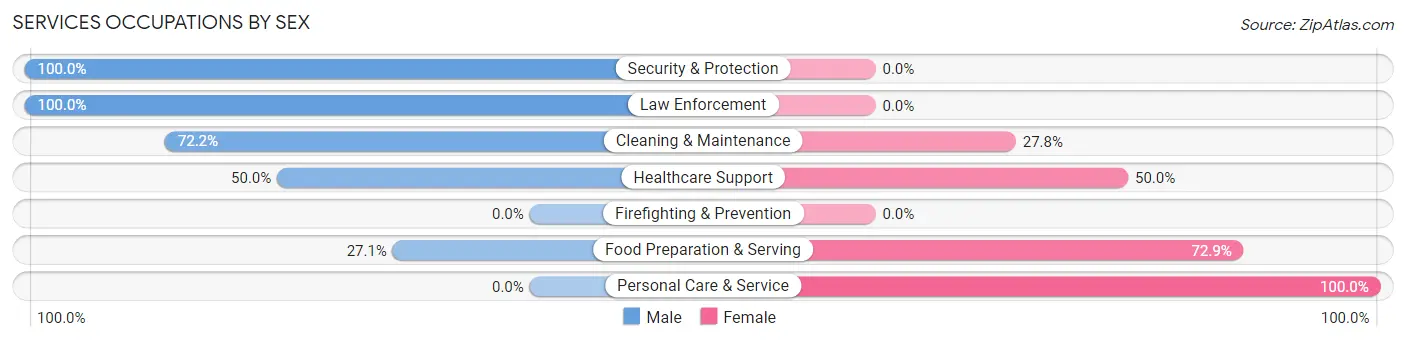
| Occupation | Male | Female |
| Healthcare Support | 27 (50.0%) | 27 (50.0%) |
| Security & Protection | 4 (100.0%) | 0 (0.0%) |
| Firefighting & Prevention | 0 (0.0%) | 0 (0.0%) |
| Law Enforcement | 4 (100.0%) | 0 (0.0%) |
| Food Preparation & Serving | 61 (27.1%) | 164 (72.9%) |
| Cleaning & Maintenance | 78 (72.2%) | 30 (27.8%) |
| Personal Care & Service | 0 (0.0%) | 57 (100.0%) |
| Total (Category) | 170 (38.0%) | 278 (62.1%) |
| Total (Overall) | 1,001 (51.2%) | 955 (48.8%) |
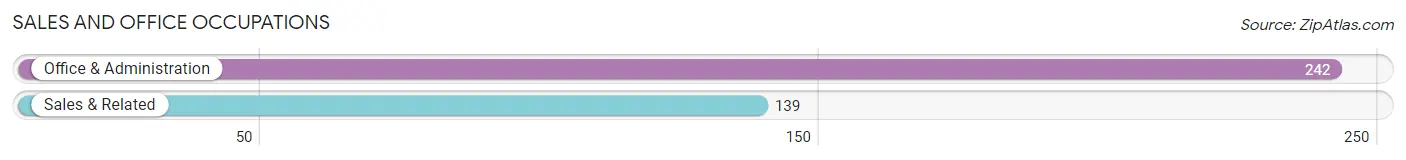
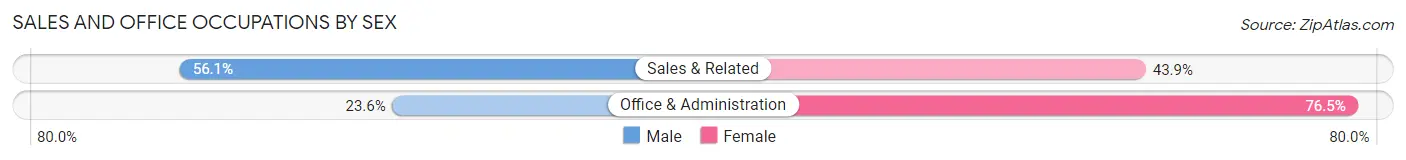
Sales and Office Occupations
The most common Sales and Office occupations in Boyne City are Office & Administration (242 | 12.4%), and Sales & Related (139 | 7.1%).
Sales and Office Occupations by Sex
| Occupation | Male | Female |
| Sales & Related | 78 (56.1%) | 61 (43.9%) |
| Office & Administration | 57 (23.5%) | 185 (76.4%) |
| Total (Category) | 135 (35.4%) | 246 (64.6%) |
| Total (Overall) | 1,001 (51.2%) | 955 (48.8%) |
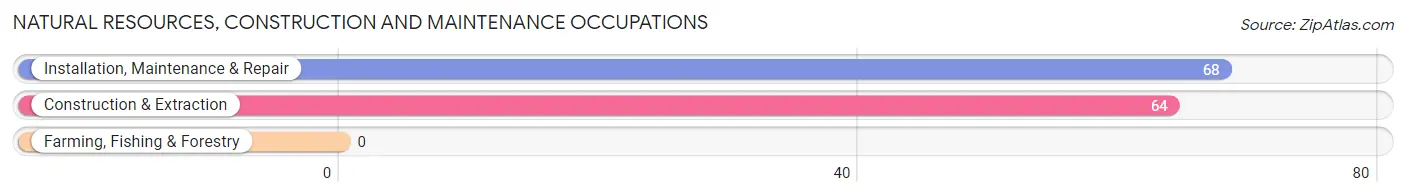
Natural Resources, Construction and Maintenance Occupations
The most common Natural Resources, Construction and Maintenance occupations in Boyne City are Installation, Maintenance & Repair (68 | 3.5%), and Construction & Extraction (64 | 3.3%).
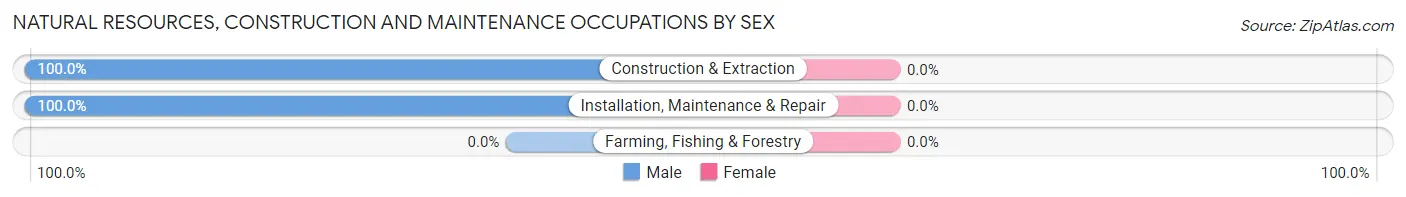
Natural Resources, Construction and Maintenance Occupations by Sex
| Occupation | Male | Female |
| Farming, Fishing & Forestry | 0 (0.0%) | 0 (0.0%) |
| Construction & Extraction | 64 (100.0%) | 0 (0.0%) |
| Installation, Maintenance & Repair | 68 (100.0%) | 0 (0.0%) |
| Total (Category) | 132 (100.0%) | 0 (0.0%) |
| Total (Overall) | 1,001 (51.2%) | 955 (48.8%) |
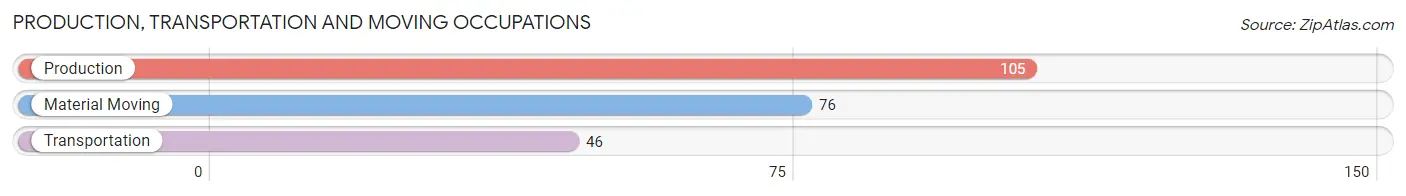
Production, Transportation and Moving Occupations
The most common Production, Transportation and Moving occupations in Boyne City are Production (105 | 5.4%), Material Moving (76 | 3.9%), and Transportation (46 | 2.4%).
Production, Transportation and Moving Occupations by Sex
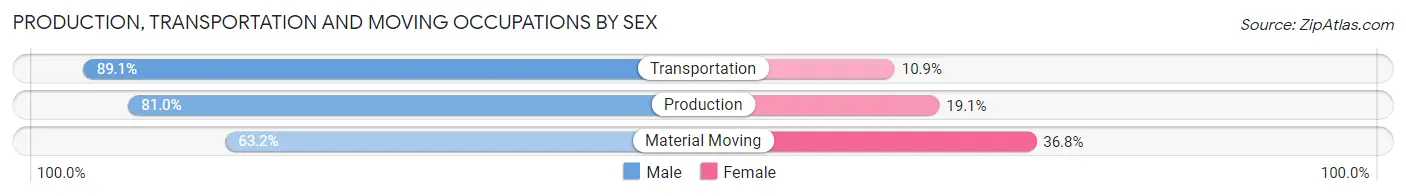
| Occupation | Male | Female |
| Production | 85 (80.9%) | 20 (19.1%) |
| Transportation | 41 (89.1%) | 5 (10.9%) |
| Material Moving | 48 (63.2%) | 28 (36.8%) |
| Total (Category) | 174 (76.6%) | 53 (23.4%) |
| Total (Overall) | 1,001 (51.2%) | 955 (48.8%) |
Employment Industries by Sex in Boyne City
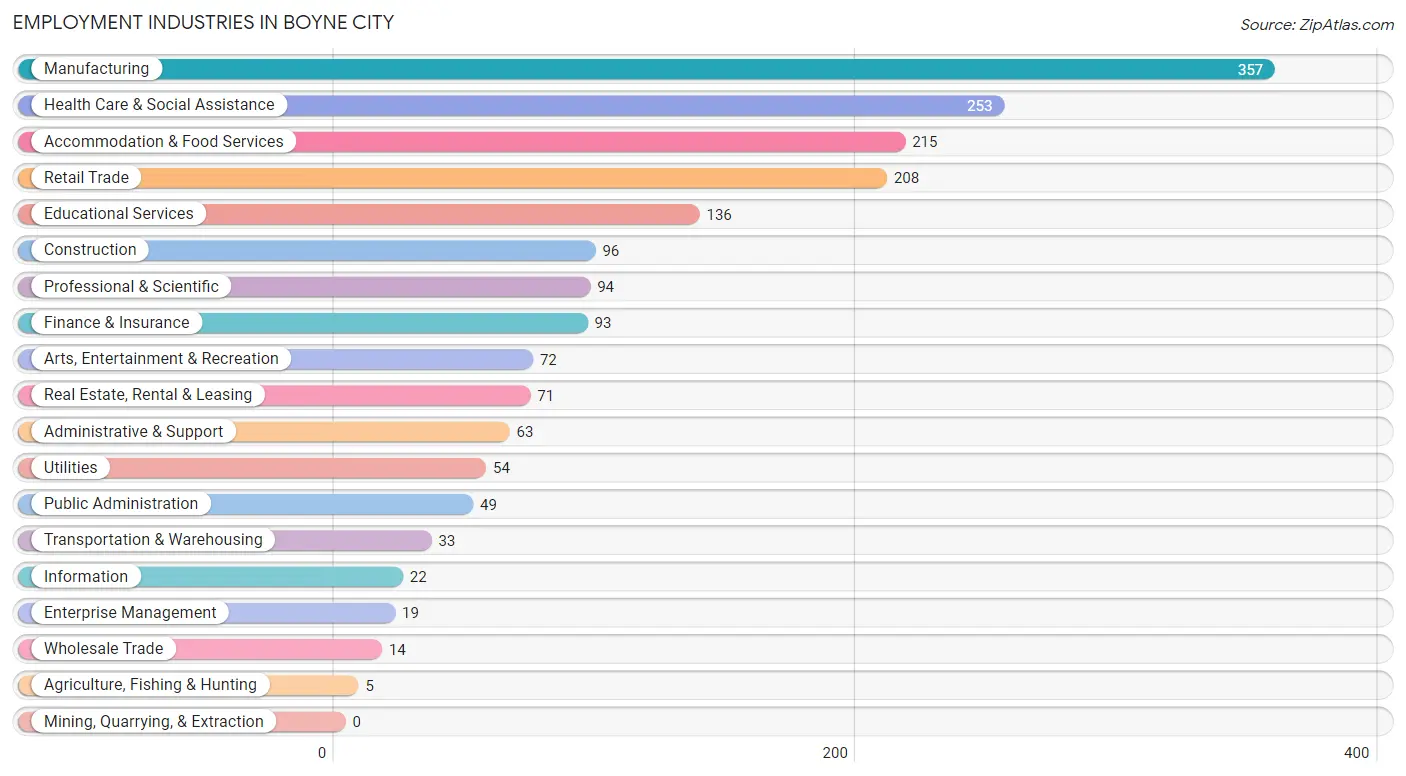
Employment Industries in Boyne City
The major employment industries in Boyne City include Manufacturing (357 | 18.2%), Health Care & Social Assistance (253 | 12.9%), Accommodation & Food Services (215 | 11.0%), Retail Trade (208 | 10.6%), and Educational Services (136 | 7.0%).
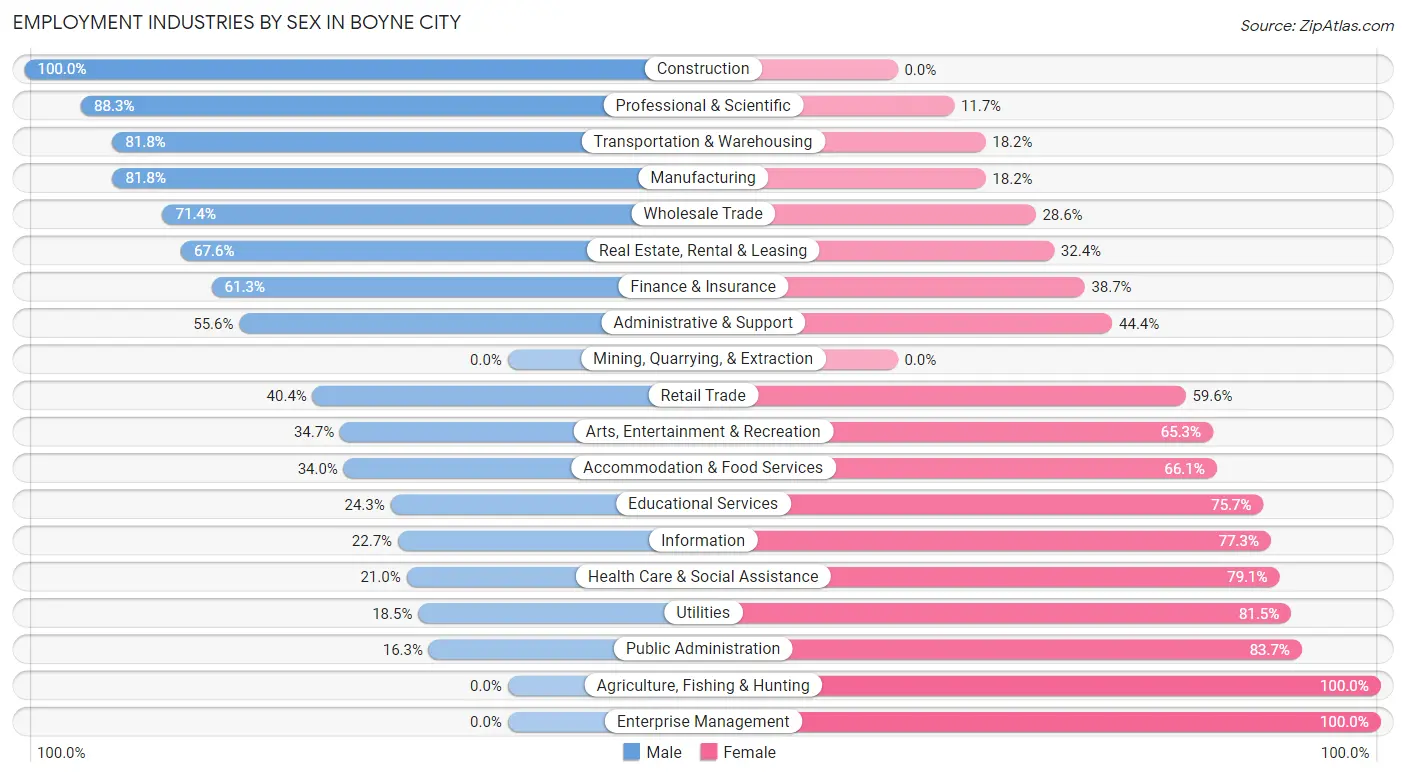
Employment Industries by Sex in Boyne City
The Boyne City industries that see more men than women are Construction (100.0%), Professional & Scientific (88.3%), and Transportation & Warehousing (81.8%), whereas the industries that tend to have a higher number of women are Agriculture, Fishing & Hunting (100.0%), Enterprise Management (100.0%), and Public Administration (83.7%).
| Industry | Male | Female |
| Agriculture, Fishing & Hunting | 0 (0.0%) | 5 (100.0%) |
| Mining, Quarrying, & Extraction | 0 (0.0%) | 0 (0.0%) |
| Construction | 96 (100.0%) | 0 (0.0%) |
| Manufacturing | 292 (81.8%) | 65 (18.2%) |
| Wholesale Trade | 10 (71.4%) | 4 (28.6%) |
| Retail Trade | 84 (40.4%) | 124 (59.6%) |
| Transportation & Warehousing | 27 (81.8%) | 6 (18.2%) |
| Utilities | 10 (18.5%) | 44 (81.5%) |
| Information | 5 (22.7%) | 17 (77.3%) |
| Finance & Insurance | 57 (61.3%) | 36 (38.7%) |
| Real Estate, Rental & Leasing | 48 (67.6%) | 23 (32.4%) |
| Professional & Scientific | 83 (88.3%) | 11 (11.7%) |
| Enterprise Management | 0 (0.0%) | 19 (100.0%) |
| Administrative & Support | 35 (55.6%) | 28 (44.4%) |
| Educational Services | 33 (24.3%) | 103 (75.7%) |
| Health Care & Social Assistance | 53 (20.9%) | 200 (79.0%) |
| Arts, Entertainment & Recreation | 25 (34.7%) | 47 (65.3%) |
| Accommodation & Food Services | 73 (34.0%) | 142 (66.0%) |
| Public Administration | 8 (16.3%) | 41 (83.7%) |
| Total | 1,001 (51.2%) | 955 (48.8%) |
Education in Boyne City
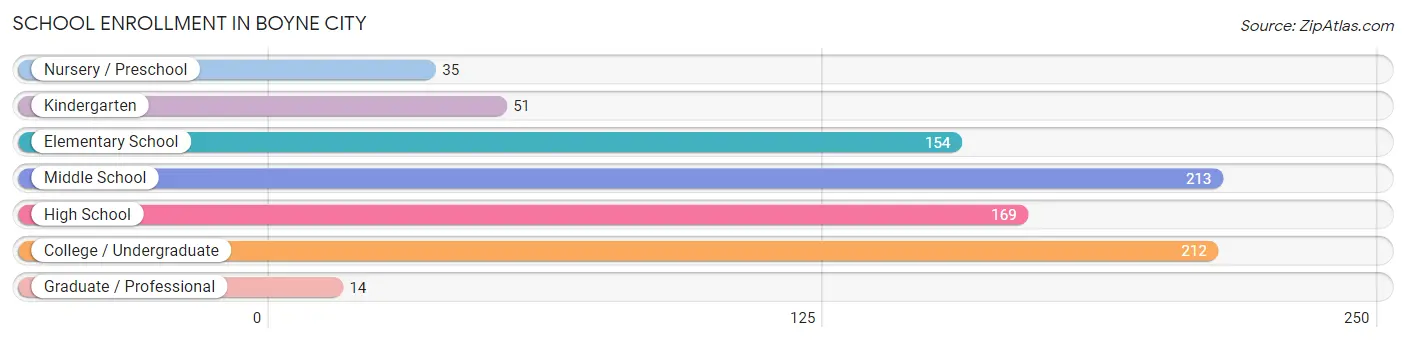
School Enrollment in Boyne City
The most common levels of schooling among the 848 students in Boyne City are middle school (213 | 25.1%), college / undergraduate (212 | 25.0%), and high school (169 | 19.9%).
| School Level | # Students | % Students |
| Nursery / Preschool | 35 | 4.1% |
| Kindergarten | 51 | 6.0% |
| Elementary School | 154 | 18.2% |
| Middle School | 213 | 25.1% |
| High School | 169 | 19.9% |
| College / Undergraduate | 212 | 25.0% |
| Graduate / Professional | 14 | 1.7% |
| Total | 848 | 100.0% |
School Enrollment by Age by Funding Source in Boyne City
Out of a total of 848 students who are enrolled in schools in Boyne City, 59 (7.0%) attend a private institution, while the remaining 789 (93.0%) are enrolled in public schools. The age group of 10 to 14 year olds has the highest likelihood of being enrolled in private schools, with 37 (13.8% in the age bracket) enrolled. Conversely, the age group of 3 to 4 year olds has the lowest likelihood of being enrolled in a private school, with 37 (100.0% in the age bracket) attending a public institution.
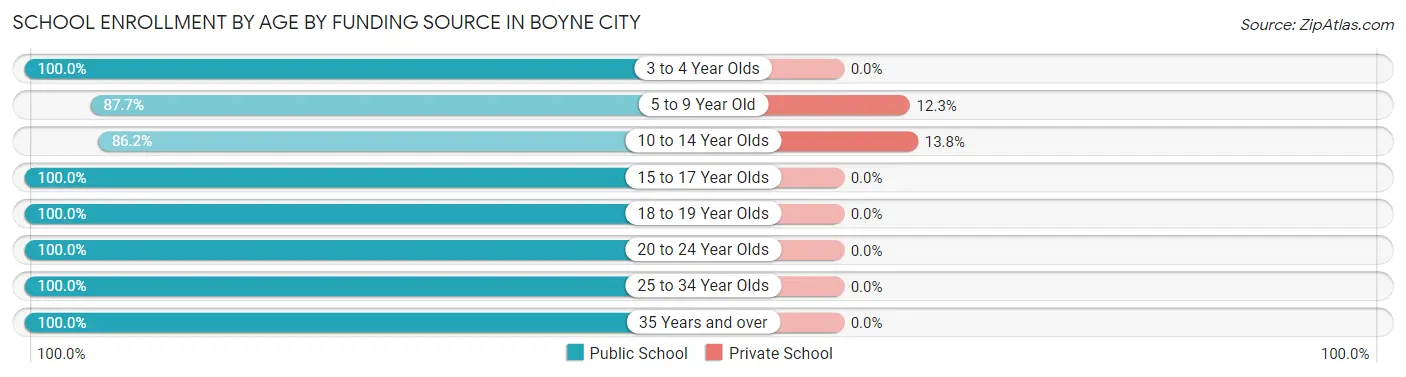
| Age Bracket | Public School | Private School |
| 3 to 4 Year Olds | 37 (100.0%) | 0 (0.0%) |
| 5 to 9 Year Old | 157 (87.7%) | 22 (12.3%) |
| 10 to 14 Year Olds | 231 (86.2%) | 37 (13.8%) |
| 15 to 17 Year Olds | 103 (100.0%) | 0 (0.0%) |
| 18 to 19 Year Olds | 67 (100.0%) | 0 (0.0%) |
| 20 to 24 Year Olds | 114 (100.0%) | 0 (0.0%) |
| 25 to 34 Year Olds | 53 (100.0%) | 0 (0.0%) |
| 35 Years and over | 27 (100.0%) | 0 (0.0%) |
| Total | 789 (93.0%) | 59 (7.0%) |
Educational Attainment by Field of Study in Boyne City
Education (241 | 20.9%), business (181 | 15.7%), communications (123 | 10.6%), engineering (112 | 9.7%), and arts & humanities (91 | 7.9%) are the most common fields of study among 1,155 individuals in Boyne City who have obtained a bachelor's degree or higher.
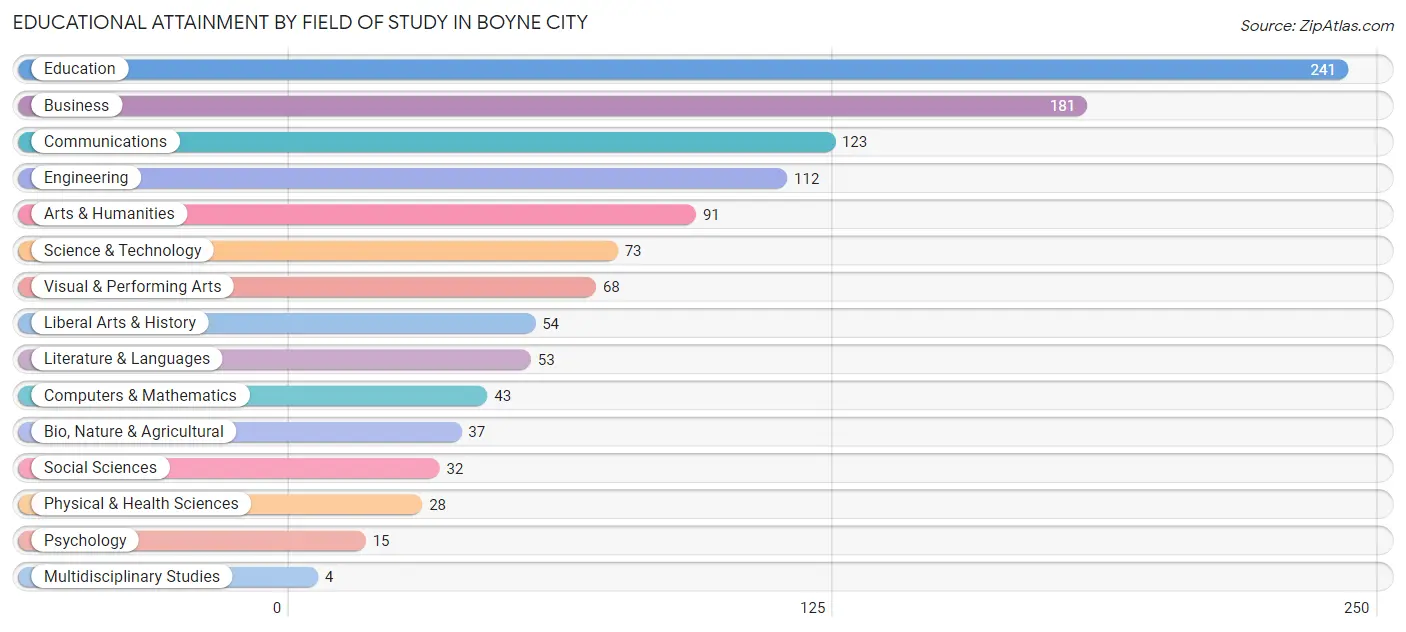
| Field of Study | # Graduates | % Graduates |
| Computers & Mathematics | 43 | 3.7% |
| Bio, Nature & Agricultural | 37 | 3.2% |
| Physical & Health Sciences | 28 | 2.4% |
| Psychology | 15 | 1.3% |
| Social Sciences | 32 | 2.8% |
| Engineering | 112 | 9.7% |
| Multidisciplinary Studies | 4 | 0.4% |
| Science & Technology | 73 | 6.3% |
| Business | 181 | 15.7% |
| Education | 241 | 20.9% |
| Literature & Languages | 53 | 4.6% |
| Liberal Arts & History | 54 | 4.7% |
| Visual & Performing Arts | 68 | 5.9% |
| Communications | 123 | 10.6% |
| Arts & Humanities | 91 | 7.9% |
| Total | 1,155 | 100.0% |
Transportation & Commute in Boyne City
Vehicle Availability by Sex in Boyne City
The most prevalent vehicle ownership categories in Boyne City are males with 2 vehicles (522, accounting for 53.5%) and females with 2 vehicles (519, making up 54.9%).
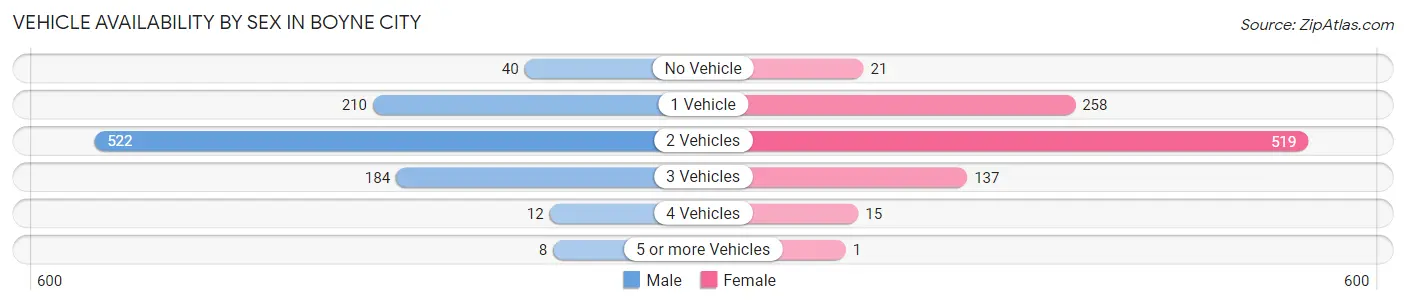
| Vehicles Available | Male | Female |
| No Vehicle | 40 (4.1%) | 21 (2.2%) |
| 1 Vehicle | 210 (21.5%) | 258 (27.1%) |
| 2 Vehicles | 522 (53.5%) | 519 (54.6%) |
| 3 Vehicles | 184 (18.9%) | 137 (14.4%) |
| 4 Vehicles | 12 (1.2%) | 15 (1.6%) |
| 5 or more Vehicles | 8 (0.8%) | 1 (0.1%) |
| Total | 976 (100.0%) | 951 (100.0%) |
Commute Time in Boyne City
The most frequently occuring commute durations in Boyne City are 5 to 9 minutes (348 commuters, 20.6%), less than 5 minutes (281 commuters, 16.6%), and 10 to 14 minutes (241 commuters, 14.2%).
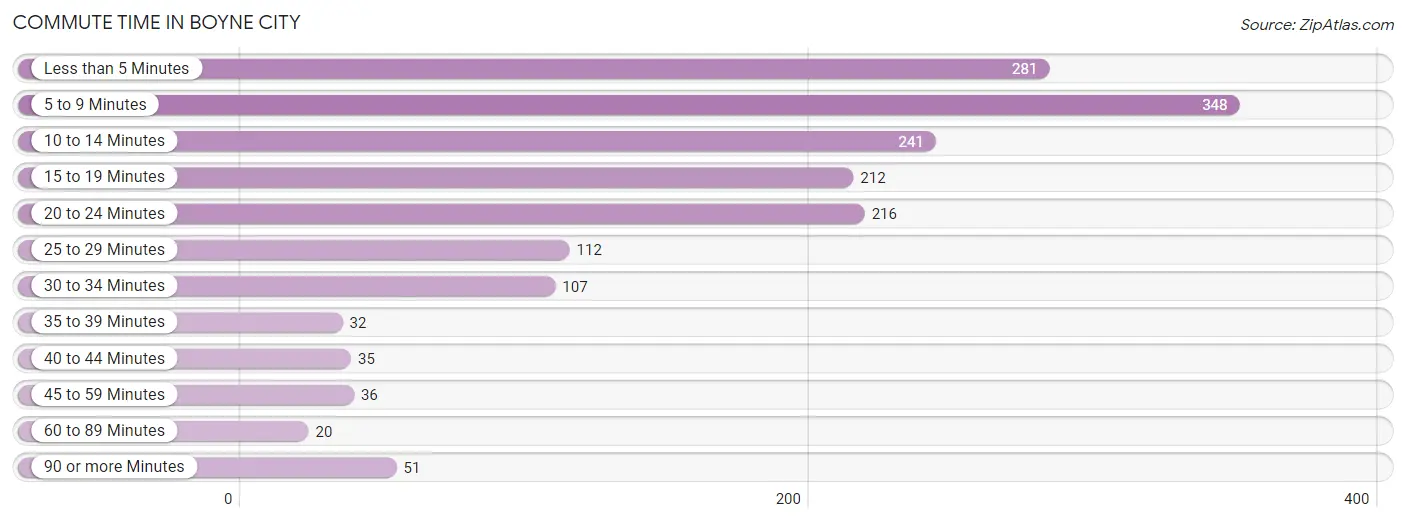
| Commute Time | # Commuters | % Commuters |
| Less than 5 Minutes | 281 | 16.6% |
| 5 to 9 Minutes | 348 | 20.6% |
| 10 to 14 Minutes | 241 | 14.2% |
| 15 to 19 Minutes | 212 | 12.5% |
| 20 to 24 Minutes | 216 | 12.8% |
| 25 to 29 Minutes | 112 | 6.6% |
| 30 to 34 Minutes | 107 | 6.3% |
| 35 to 39 Minutes | 32 | 1.9% |
| 40 to 44 Minutes | 35 | 2.1% |
| 45 to 59 Minutes | 36 | 2.1% |
| 60 to 89 Minutes | 20 | 1.2% |
| 90 or more Minutes | 51 | 3.0% |
Commute Time by Sex in Boyne City
The most common commute times in Boyne City are 10 to 14 minutes (147 commuters, 18.9%) for males and 5 to 9 minutes (214 commuters, 23.5%) for females.
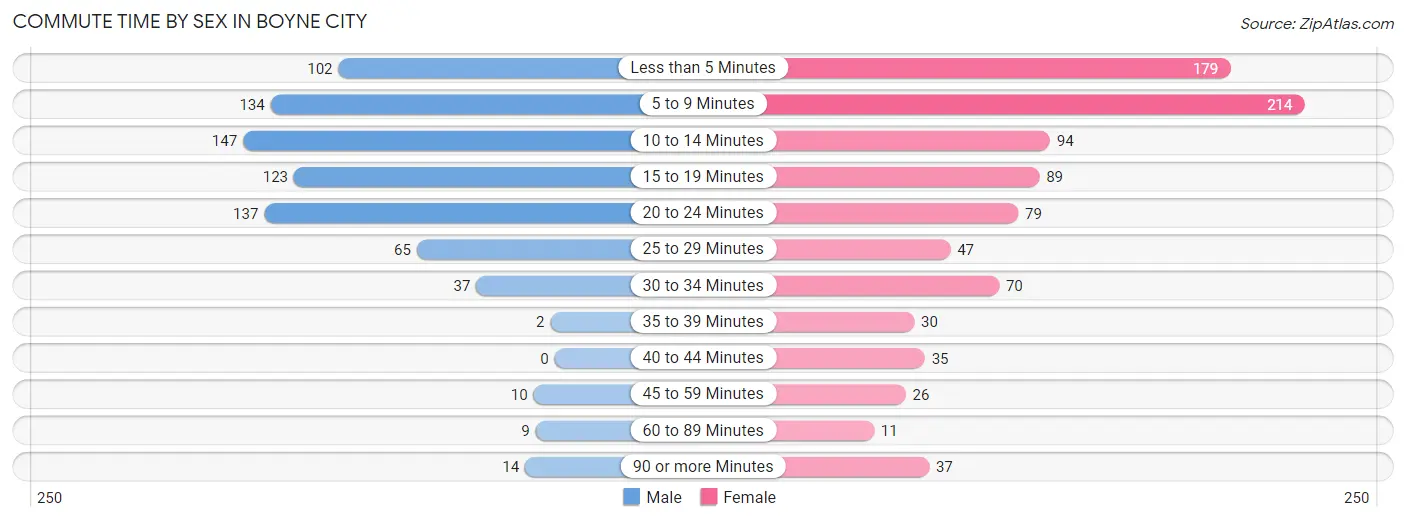
| Commute Time | Male | Female |
| Less than 5 Minutes | 102 (13.1%) | 179 (19.7%) |
| 5 to 9 Minutes | 134 (17.2%) | 214 (23.5%) |
| 10 to 14 Minutes | 147 (18.9%) | 94 (10.3%) |
| 15 to 19 Minutes | 123 (15.8%) | 89 (9.8%) |
| 20 to 24 Minutes | 137 (17.6%) | 79 (8.7%) |
| 25 to 29 Minutes | 65 (8.3%) | 47 (5.2%) |
| 30 to 34 Minutes | 37 (4.7%) | 70 (7.7%) |
| 35 to 39 Minutes | 2 (0.3%) | 30 (3.3%) |
| 40 to 44 Minutes | 0 (0.0%) | 35 (3.8%) |
| 45 to 59 Minutes | 10 (1.3%) | 26 (2.9%) |
| 60 to 89 Minutes | 9 (1.1%) | 11 (1.2%) |
| 90 or more Minutes | 14 (1.8%) | 37 (4.1%) |
Time of Departure to Work by Sex in Boyne City
The most frequent times of departure to work in Boyne City are 7:30 AM to 7:59 AM (141, 18.1%) for males and 7:30 AM to 7:59 AM (226, 24.8%) for females.
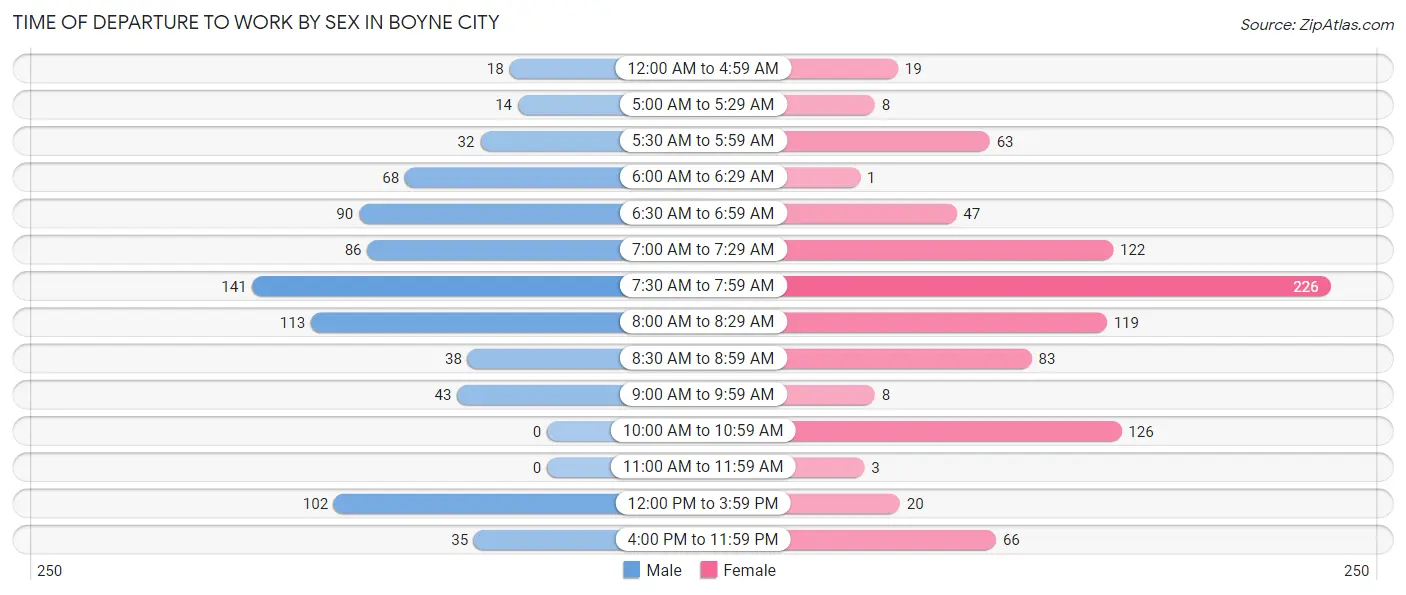
| Time of Departure | Male | Female |
| 12:00 AM to 4:59 AM | 18 (2.3%) | 19 (2.1%) |
| 5:00 AM to 5:29 AM | 14 (1.8%) | 8 (0.9%) |
| 5:30 AM to 5:59 AM | 32 (4.1%) | 63 (6.9%) |
| 6:00 AM to 6:29 AM | 68 (8.7%) | 1 (0.1%) |
| 6:30 AM to 6:59 AM | 90 (11.5%) | 47 (5.2%) |
| 7:00 AM to 7:29 AM | 86 (11.0%) | 122 (13.4%) |
| 7:30 AM to 7:59 AM | 141 (18.1%) | 226 (24.8%) |
| 8:00 AM to 8:29 AM | 113 (14.5%) | 119 (13.1%) |
| 8:30 AM to 8:59 AM | 38 (4.9%) | 83 (9.1%) |
| 9:00 AM to 9:59 AM | 43 (5.5%) | 8 (0.9%) |
| 10:00 AM to 10:59 AM | 0 (0.0%) | 126 (13.8%) |
| 11:00 AM to 11:59 AM | 0 (0.0%) | 3 (0.3%) |
| 12:00 PM to 3:59 PM | 102 (13.1%) | 20 (2.2%) |
| 4:00 PM to 11:59 PM | 35 (4.5%) | 66 (7.2%) |
| Total | 780 (100.0%) | 911 (100.0%) |
Housing Occupancy in Boyne City
Occupancy by Ownership in Boyne City
Of the total 1,915 dwellings in Boyne City, owner-occupied units account for 1,370 (71.5%), while renter-occupied units make up 545 (28.5%).
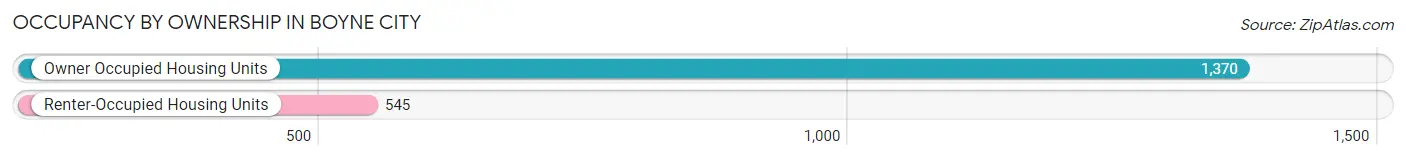
| Occupancy | # Housing Units | % Housing Units |
| Owner Occupied Housing Units | 1,370 | 71.5% |
| Renter-Occupied Housing Units | 545 | 28.5% |
| Total Occupied Housing Units | 1,915 | 100.0% |
Occupancy by Household Size in Boyne City
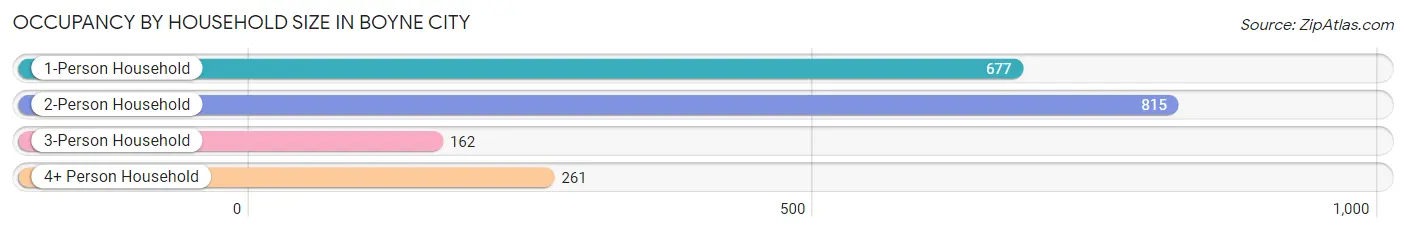
| Household Size | # Housing Units | % Housing Units |
| 1-Person Household | 677 | 35.3% |
| 2-Person Household | 815 | 42.6% |
| 3-Person Household | 162 | 8.5% |
| 4+ Person Household | 261 | 13.6% |
| Total Housing Units | 1,915 | 100.0% |
Occupancy by Ownership by Household Size in Boyne City
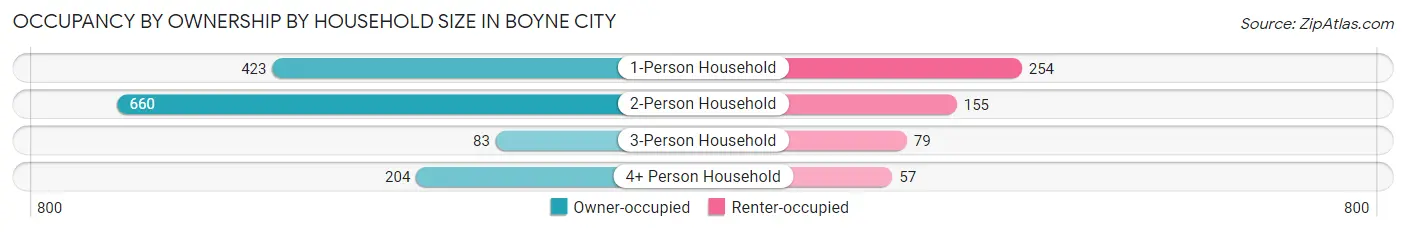
| Household Size | Owner-occupied | Renter-occupied |
| 1-Person Household | 423 (62.5%) | 254 (37.5%) |
| 2-Person Household | 660 (81.0%) | 155 (19.0%) |
| 3-Person Household | 83 (51.2%) | 79 (48.8%) |
| 4+ Person Household | 204 (78.2%) | 57 (21.8%) |
| Total Housing Units | 1,370 (71.5%) | 545 (28.5%) |
Occupancy by Educational Attainment in Boyne City
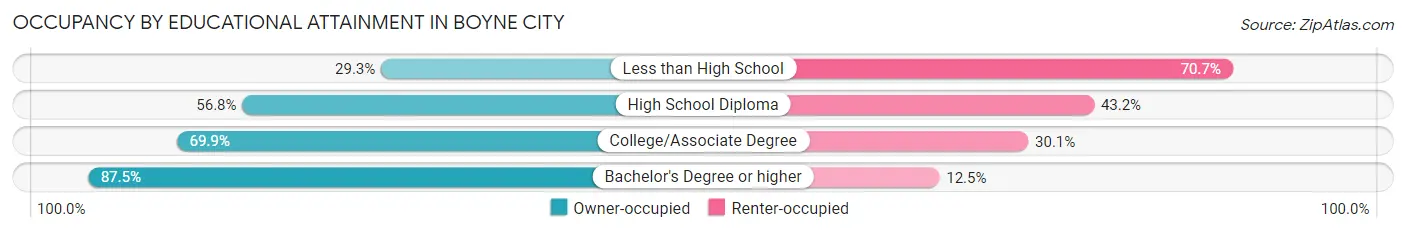
| Household Size | Owner-occupied | Renter-occupied |
| Less than High School | 17 (29.3%) | 41 (70.7%) |
| High School Diploma | 279 (56.8%) | 212 (43.2%) |
| College/Associate Degree | 480 (69.9%) | 207 (30.1%) |
| Bachelor's Degree or higher | 594 (87.5%) | 85 (12.5%) |
Occupancy by Age of Householder in Boyne City
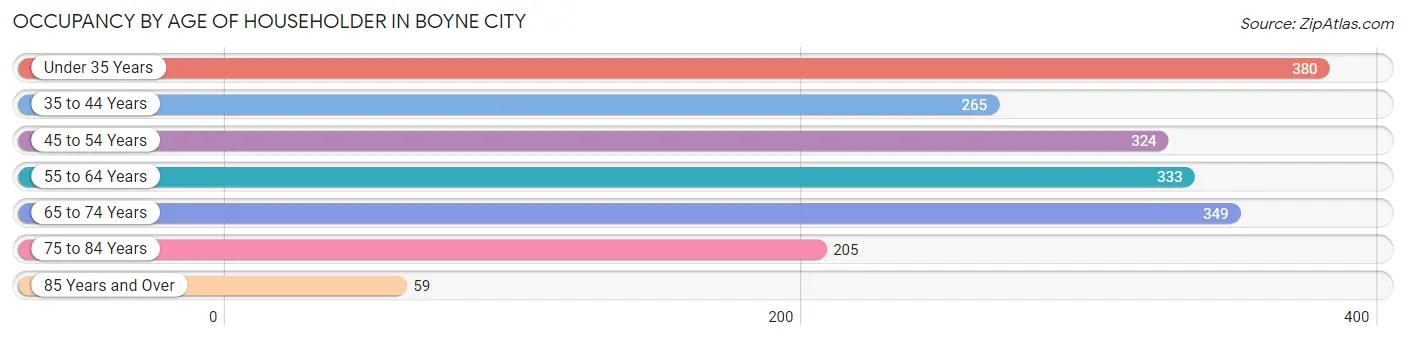
| Age Bracket | # Households | % Households |
| Under 35 Years | 380 | 19.8% |
| 35 to 44 Years | 265 | 13.8% |
| 45 to 54 Years | 324 | 16.9% |
| 55 to 64 Years | 333 | 17.4% |
| 65 to 74 Years | 349 | 18.2% |
| 75 to 84 Years | 205 | 10.7% |
| 85 Years and Over | 59 | 3.1% |
| Total | 1,915 | 100.0% |
Housing Finances in Boyne City
Median Income by Occupancy in Boyne City
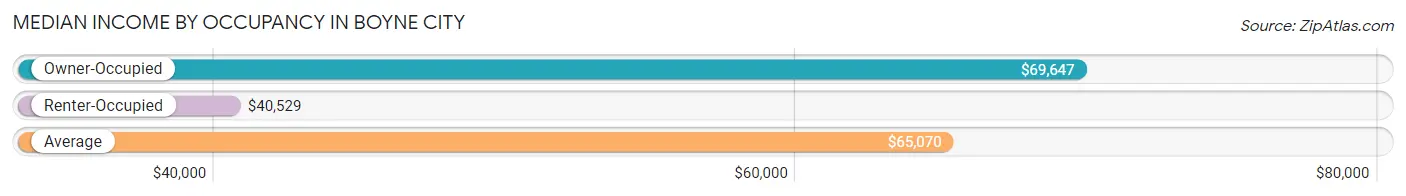
| Occupancy Type | # Households | Median Income |
| Owner-Occupied | 1,370 (71.5%) | $69,647 |
| Renter-Occupied | 545 (28.5%) | $40,529 |
| Average | 1,915 (100.0%) | $65,070 |
Occupancy by Householder Income Bracket in Boyne City
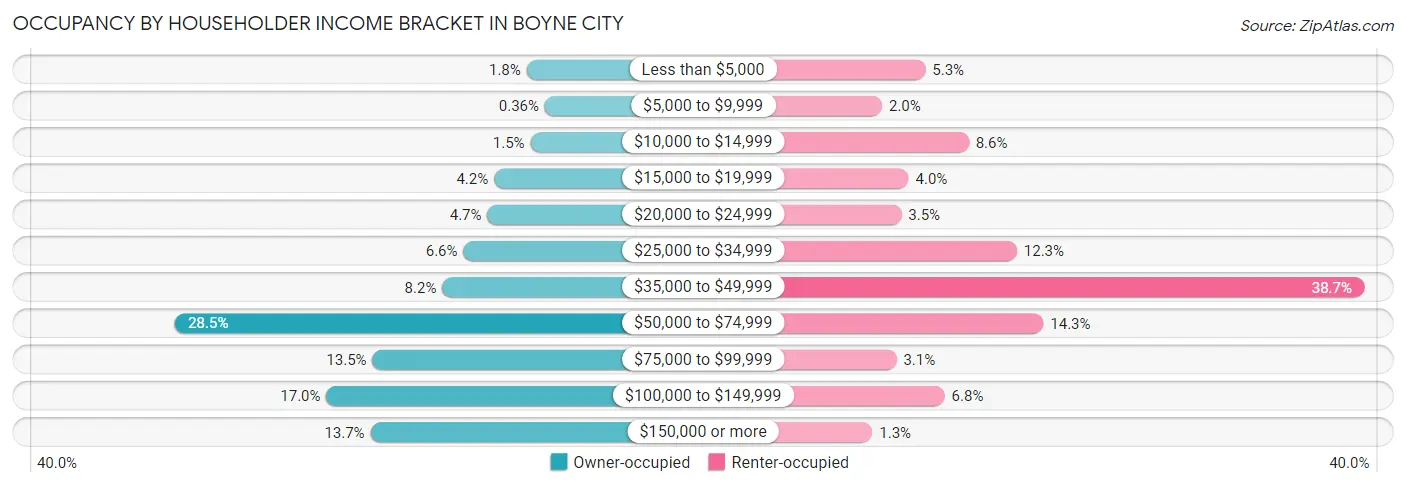
| Income Bracket | Owner-occupied | Renter-occupied |
| Less than $5,000 | 24 (1.8%) | 29 (5.3%) |
| $5,000 to $9,999 | 5 (0.4%) | 11 (2.0%) |
| $10,000 to $14,999 | 20 (1.5%) | 47 (8.6%) |
| $15,000 to $19,999 | 58 (4.2%) | 22 (4.0%) |
| $20,000 to $24,999 | 65 (4.7%) | 19 (3.5%) |
| $25,000 to $34,999 | 90 (6.6%) | 67 (12.3%) |
| $35,000 to $49,999 | 112 (8.2%) | 211 (38.7%) |
| $50,000 to $74,999 | 391 (28.5%) | 78 (14.3%) |
| $75,000 to $99,999 | 185 (13.5%) | 17 (3.1%) |
| $100,000 to $149,999 | 233 (17.0%) | 37 (6.8%) |
| $150,000 or more | 187 (13.7%) | 7 (1.3%) |
| Total | 1,370 (100.0%) | 545 (100.0%) |
Monthly Housing Cost Tiers in Boyne City
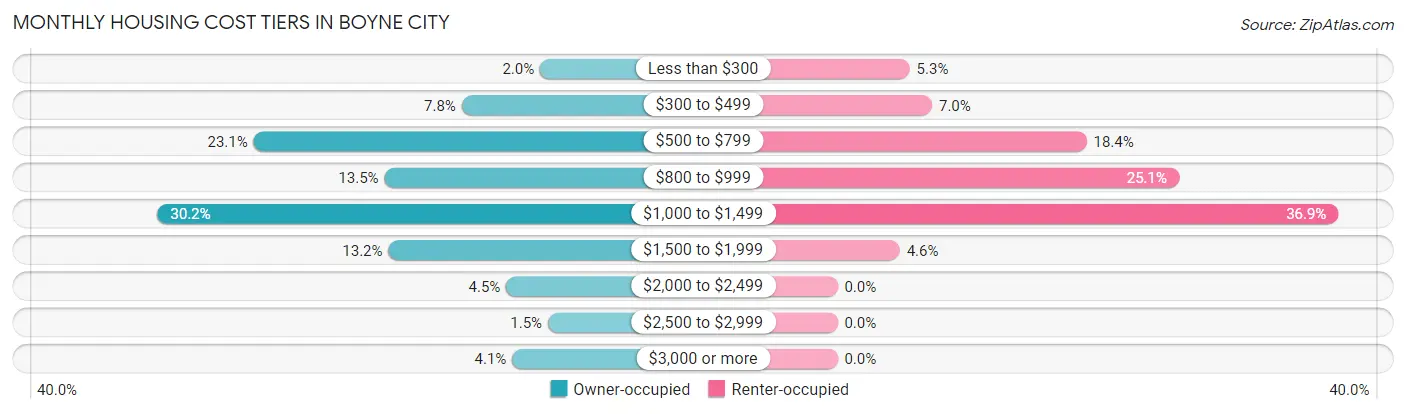
| Monthly Cost | Owner-occupied | Renter-occupied |
| Less than $300 | 28 (2.0%) | 29 (5.3%) |
| $300 to $499 | 107 (7.8%) | 38 (7.0%) |
| $500 to $799 | 317 (23.1%) | 100 (18.3%) |
| $800 to $999 | 185 (13.5%) | 137 (25.1%) |
| $1,000 to $1,499 | 414 (30.2%) | 201 (36.9%) |
| $1,500 to $1,999 | 181 (13.2%) | 25 (4.6%) |
| $2,000 to $2,499 | 62 (4.5%) | 0 (0.0%) |
| $2,500 to $2,999 | 20 (1.5%) | 0 (0.0%) |
| $3,000 or more | 56 (4.1%) | 0 (0.0%) |
| Total | 1,370 (100.0%) | 545 (100.0%) |
Physical Housing Characteristics in Boyne City
Housing Structures in Boyne City
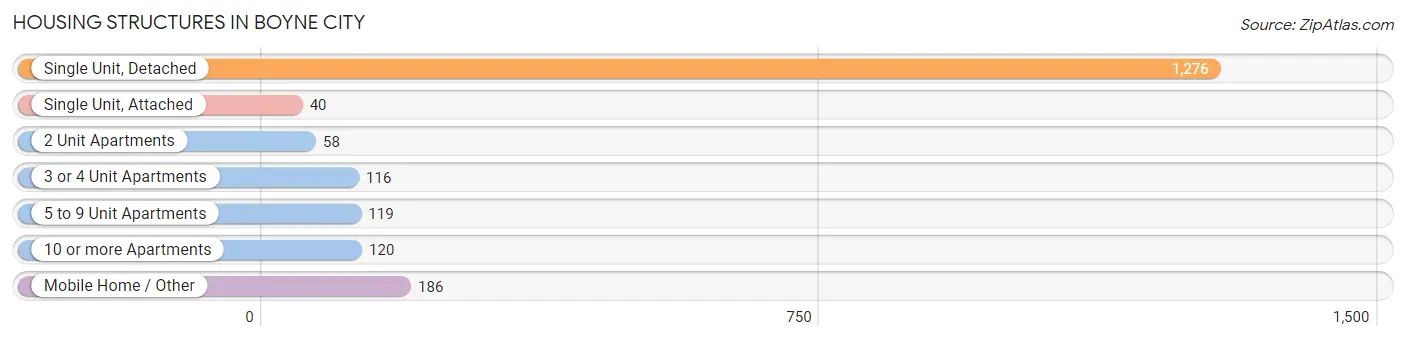
| Structure Type | # Housing Units | % Housing Units |
| Single Unit, Detached | 1,276 | 66.6% |
| Single Unit, Attached | 40 | 2.1% |
| 2 Unit Apartments | 58 | 3.0% |
| 3 or 4 Unit Apartments | 116 | 6.1% |
| 5 to 9 Unit Apartments | 119 | 6.2% |
| 10 or more Apartments | 120 | 6.3% |
| Mobile Home / Other | 186 | 9.7% |
| Total | 1,915 | 100.0% |
Housing Structures by Occupancy in Boyne City
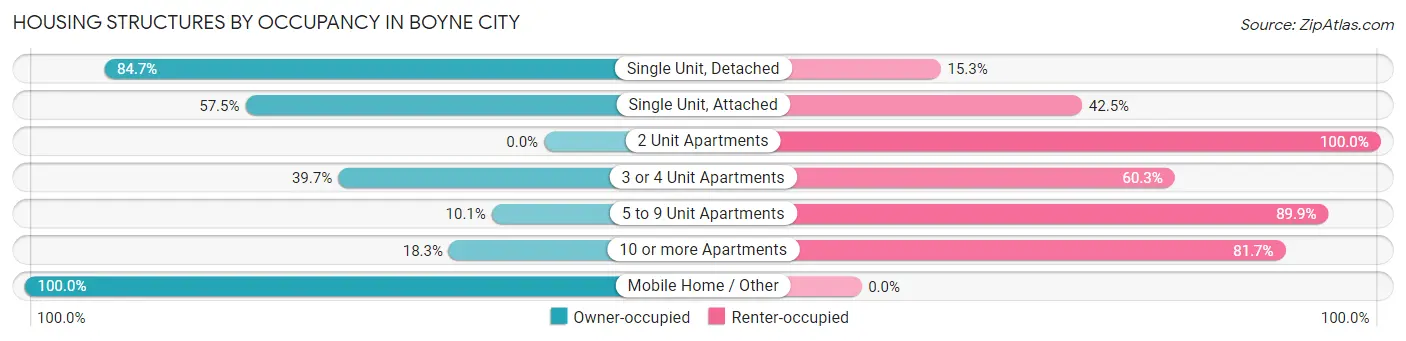
| Structure Type | Owner-occupied | Renter-occupied |
| Single Unit, Detached | 1,081 (84.7%) | 195 (15.3%) |
| Single Unit, Attached | 23 (57.5%) | 17 (42.5%) |
| 2 Unit Apartments | 0 (0.0%) | 58 (100.0%) |
| 3 or 4 Unit Apartments | 46 (39.7%) | 70 (60.3%) |
| 5 to 9 Unit Apartments | 12 (10.1%) | 107 (89.9%) |
| 10 or more Apartments | 22 (18.3%) | 98 (81.7%) |
| Mobile Home / Other | 186 (100.0%) | 0 (0.0%) |
| Total | 1,370 (71.5%) | 545 (28.5%) |
Housing Structures by Number of Rooms in Boyne City
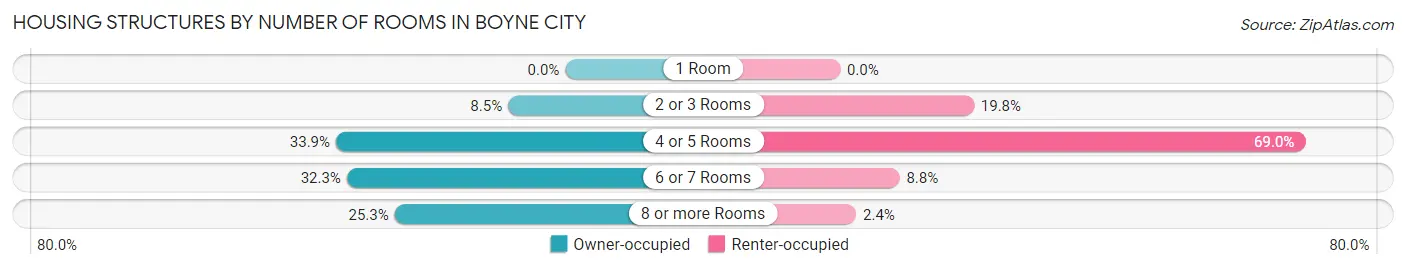
| Number of Rooms | Owner-occupied | Renter-occupied |
| 1 Room | 0 (0.0%) | 0 (0.0%) |
| 2 or 3 Rooms | 116 (8.5%) | 108 (19.8%) |
| 4 or 5 Rooms | 465 (33.9%) | 376 (69.0%) |
| 6 or 7 Rooms | 443 (32.3%) | 48 (8.8%) |
| 8 or more Rooms | 346 (25.3%) | 13 (2.4%) |
| Total | 1,370 (100.0%) | 545 (100.0%) |
Housing Structure by Heating Type in Boyne City
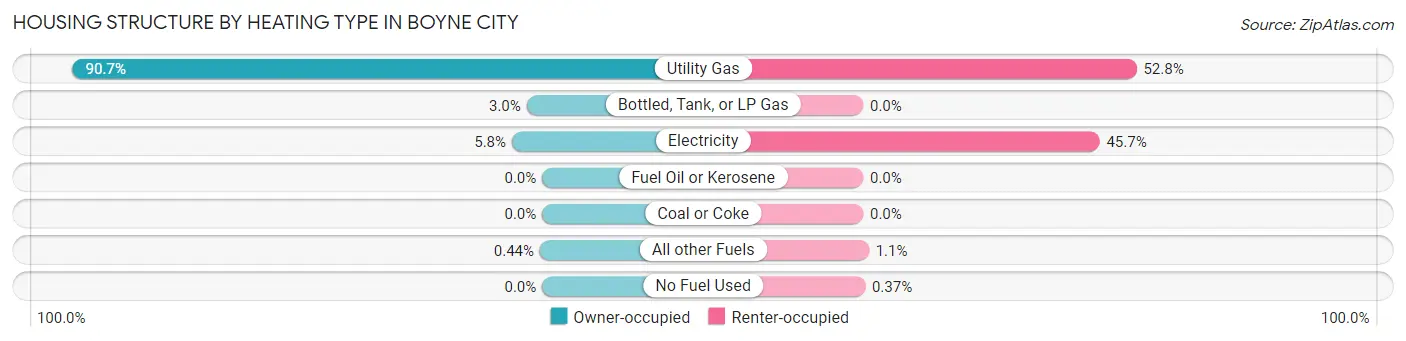
| Heating Type | Owner-occupied | Renter-occupied |
| Utility Gas | 1,243 (90.7%) | 288 (52.8%) |
| Bottled, Tank, or LP Gas | 41 (3.0%) | 0 (0.0%) |
| Electricity | 80 (5.8%) | 249 (45.7%) |
| Fuel Oil or Kerosene | 0 (0.0%) | 0 (0.0%) |
| Coal or Coke | 0 (0.0%) | 0 (0.0%) |
| All other Fuels | 6 (0.4%) | 6 (1.1%) |
| No Fuel Used | 0 (0.0%) | 2 (0.4%) |
| Total | 1,370 (100.0%) | 545 (100.0%) |
Household Vehicle Usage in Boyne City
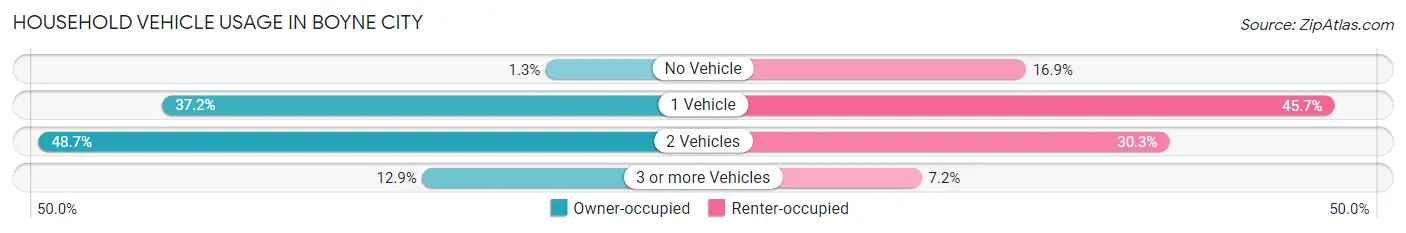
| Vehicles per Household | Owner-occupied | Renter-occupied |
| No Vehicle | 18 (1.3%) | 92 (16.9%) |
| 1 Vehicle | 509 (37.1%) | 249 (45.7%) |
| 2 Vehicles | 667 (48.7%) | 165 (30.3%) |
| 3 or more Vehicles | 176 (12.9%) | 39 (7.2%) |
| Total | 1,370 (100.0%) | 545 (100.0%) |
Real Estate & Mortgages in Boyne City
Real Estate and Mortgage Overview in Boyne City
| Characteristic | Without Mortgage | With Mortgage |
| Housing Units | 539 | 831 |
| Median Property Value | $179,900 | $205,800 |
| Median Household Income | $56,655 | $108 |
| Monthly Housing Costs | $628 | $56 |
| Real Estate Taxes | $2,766 | $37 |
Property Value by Mortgage Status in Boyne City
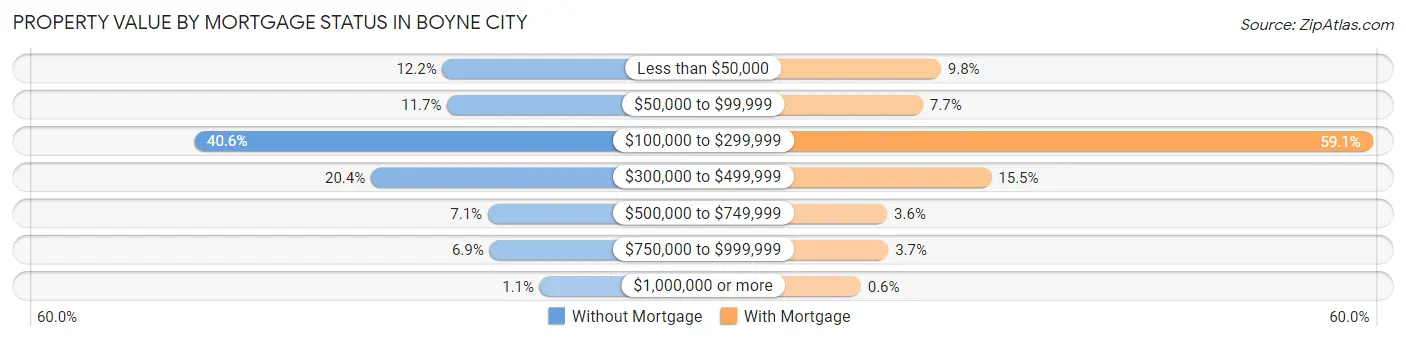
| Property Value | Without Mortgage | With Mortgage |
| Less than $50,000 | 66 (12.2%) | 81 (9.8%) |
| $50,000 to $99,999 | 63 (11.7%) | 64 (7.7%) |
| $100,000 to $299,999 | 219 (40.6%) | 491 (59.1%) |
| $300,000 to $499,999 | 110 (20.4%) | 129 (15.5%) |
| $500,000 to $749,999 | 38 (7.0%) | 30 (3.6%) |
| $750,000 to $999,999 | 37 (6.9%) | 31 (3.7%) |
| $1,000,000 or more | 6 (1.1%) | 5 (0.6%) |
| Total | 539 (100.0%) | 831 (100.0%) |
Household Income by Mortgage Status in Boyne City
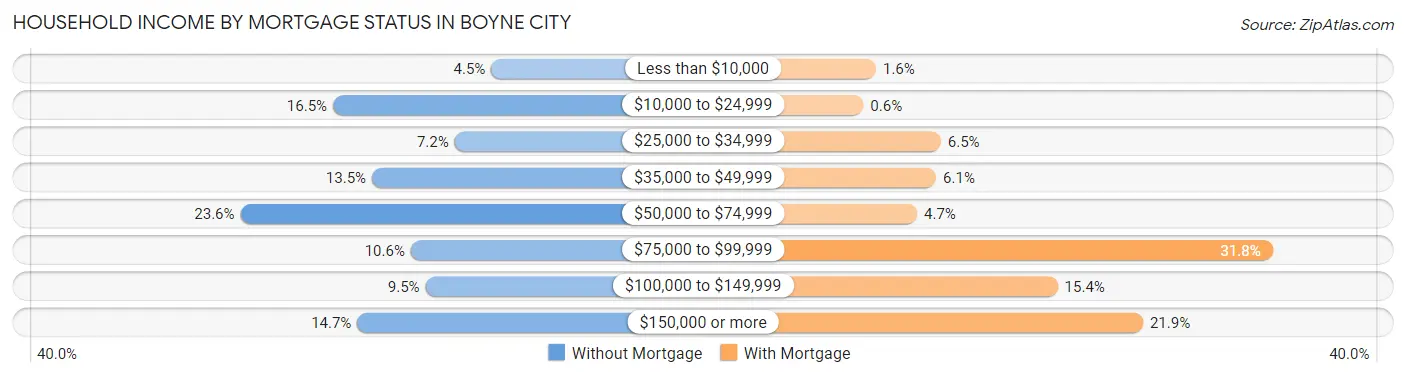
| Household Income | Without Mortgage | With Mortgage |
| Less than $10,000 | 24 (4.4%) | 13 (1.6%) |
| $10,000 to $24,999 | 89 (16.5%) | 5 (0.6%) |
| $25,000 to $34,999 | 39 (7.2%) | 54 (6.5%) |
| $35,000 to $49,999 | 73 (13.5%) | 51 (6.1%) |
| $50,000 to $74,999 | 127 (23.6%) | 39 (4.7%) |
| $75,000 to $99,999 | 57 (10.6%) | 264 (31.8%) |
| $100,000 to $149,999 | 51 (9.5%) | 128 (15.4%) |
| $150,000 or more | 79 (14.7%) | 182 (21.9%) |
| Total | 539 (100.0%) | 831 (100.0%) |
Property Value to Household Income Ratio in Boyne City
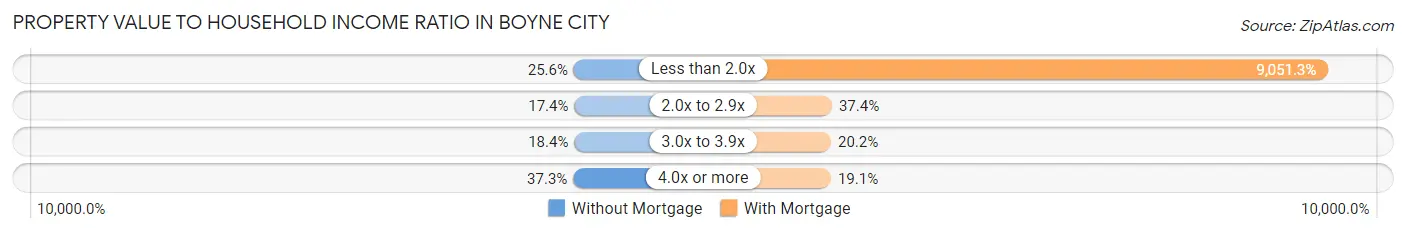
| Value-to-Income Ratio | Without Mortgage | With Mortgage |
| Less than 2.0x | 138 (25.6%) | 75,216 (9,051.3%) |
| 2.0x to 2.9x | 94 (17.4%) | 311 (37.4%) |
| 3.0x to 3.9x | 99 (18.4%) | 168 (20.2%) |
| 4.0x or more | 201 (37.3%) | 159 (19.1%) |
| Total | 539 (100.0%) | 831 (100.0%) |
Real Estate Taxes by Mortgage Status in Boyne City
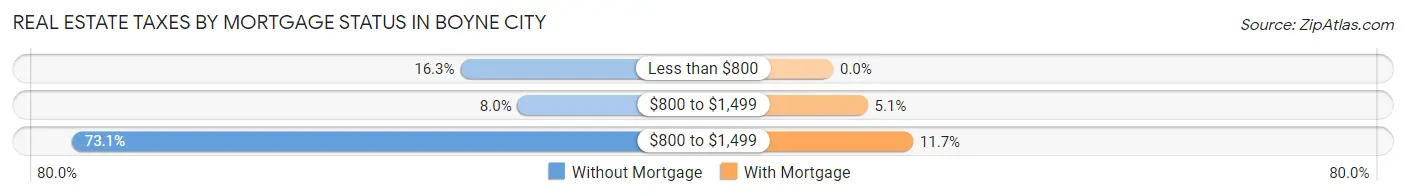
| Property Taxes | Without Mortgage | With Mortgage |
| Less than $800 | 88 (16.3%) | 0 (0.0%) |
| $800 to $1,499 | 43 (8.0%) | 42 (5.1%) |
| $800 to $1,499 | 394 (73.1%) | 97 (11.7%) |
| Total | 539 (100.0%) | 831 (100.0%) |
Health & Disability in Boyne City
Health Insurance Coverage by Age in Boyne City
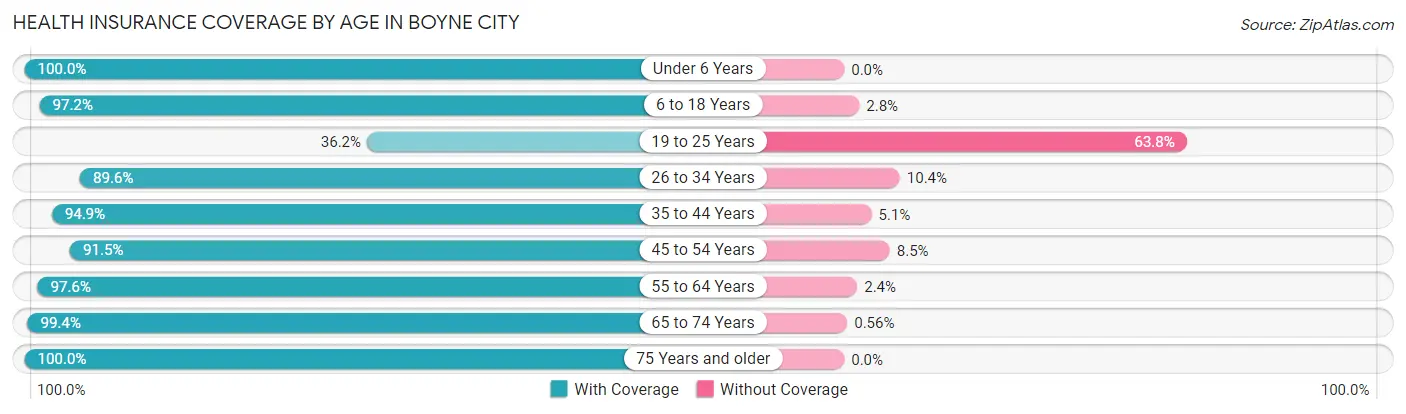
| Age Bracket | With Coverage | Without Coverage |
| Under 6 Years | 142 (100.0%) | 0 (0.0%) |
| 6 to 18 Years | 553 (97.2%) | 16 (2.8%) |
| 19 to 25 Years | 144 (36.2%) | 254 (63.8%) |
| 26 to 34 Years | 320 (89.6%) | 37 (10.4%) |
| 35 to 44 Years | 410 (94.9%) | 22 (5.1%) |
| 45 to 54 Years | 420 (91.5%) | 39 (8.5%) |
| 55 to 64 Years | 524 (97.6%) | 13 (2.4%) |
| 65 to 74 Years | 532 (99.4%) | 3 (0.6%) |
| 75 Years and older | 392 (100.0%) | 0 (0.0%) |
| Total | 3,437 (89.9%) | 384 (10.1%) |
Health Insurance Coverage by Citizenship Status in Boyne City
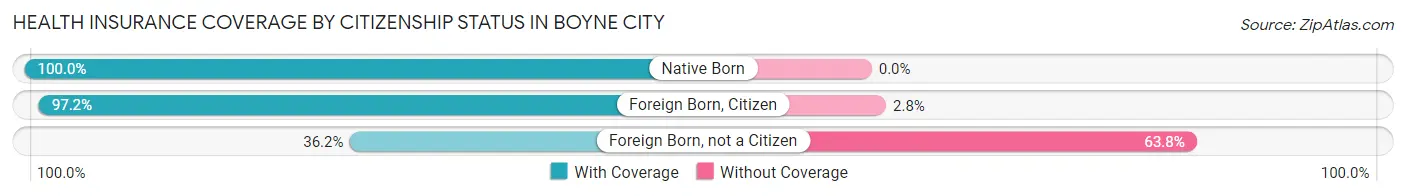
| Citizenship Status | With Coverage | Without Coverage |
| Native Born | 142 (100.0%) | 0 (0.0%) |
| Foreign Born, Citizen | 553 (97.2%) | 16 (2.8%) |
| Foreign Born, not a Citizen | 144 (36.2%) | 254 (63.8%) |
Health Insurance Coverage by Household Income in Boyne City
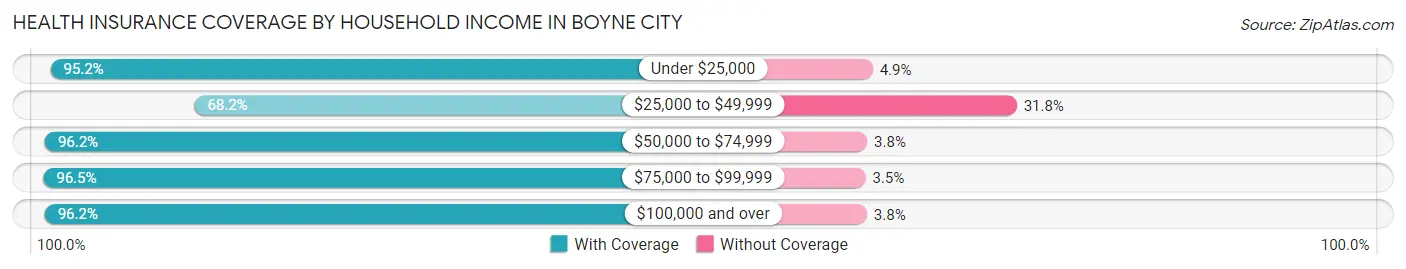
| Household Income | With Coverage | Without Coverage |
| Under $25,000 | 392 (95.2%) | 20 (4.9%) |
| $25,000 to $49,999 | 576 (68.2%) | 269 (31.8%) |
| $50,000 to $74,999 | 832 (96.2%) | 33 (3.8%) |
| $75,000 to $99,999 | 467 (96.5%) | 17 (3.5%) |
| $100,000 and over | 1,150 (96.2%) | 45 (3.8%) |
Public vs Private Health Insurance Coverage by Age in Boyne City
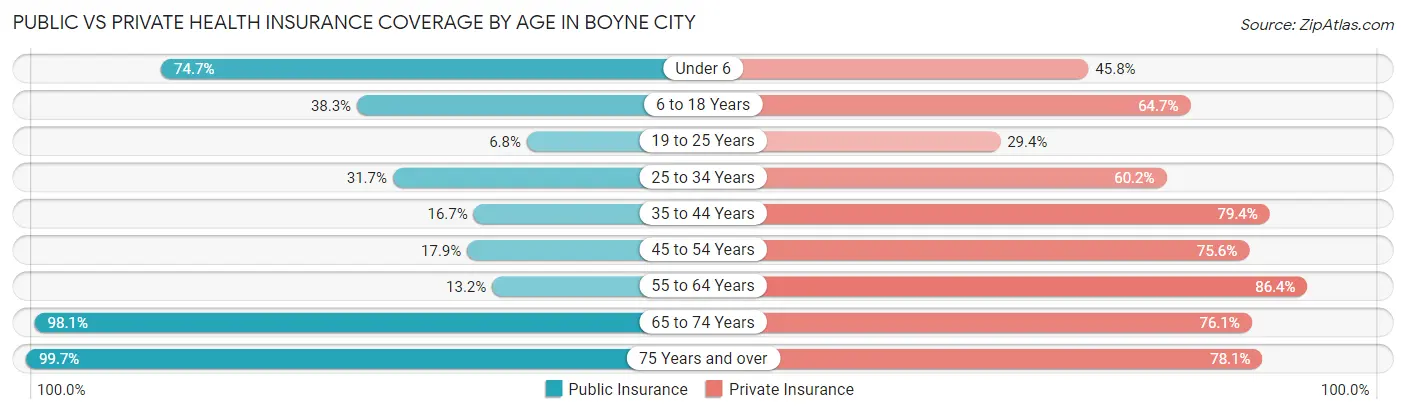
| Age Bracket | Public Insurance | Private Insurance |
| Under 6 | 106 (74.7%) | 65 (45.8%) |
| 6 to 18 Years | 218 (38.3%) | 368 (64.7%) |
| 19 to 25 Years | 27 (6.8%) | 117 (29.4%) |
| 25 to 34 Years | 113 (31.7%) | 215 (60.2%) |
| 35 to 44 Years | 72 (16.7%) | 343 (79.4%) |
| 45 to 54 Years | 82 (17.9%) | 347 (75.6%) |
| 55 to 64 Years | 71 (13.2%) | 464 (86.4%) |
| 65 to 74 Years | 525 (98.1%) | 407 (76.1%) |
| 75 Years and over | 391 (99.7%) | 306 (78.1%) |
| Total | 1,605 (42.0%) | 2,632 (68.9%) |
Disability Status by Sex by Age in Boyne City
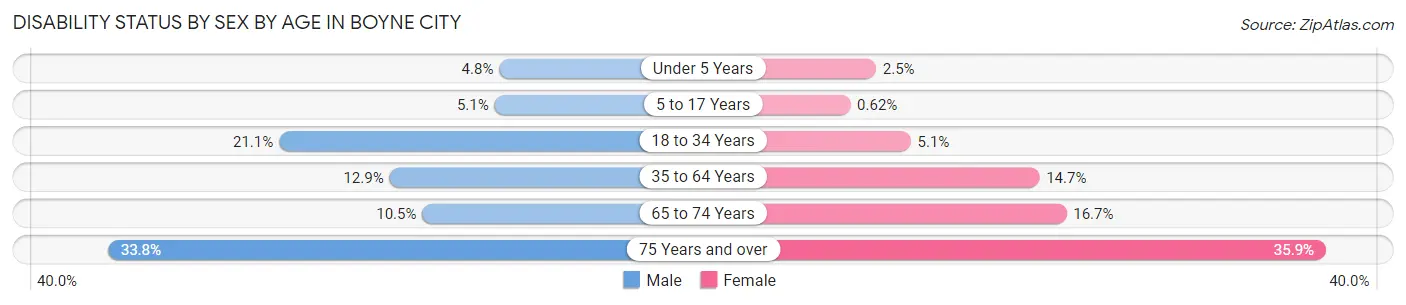
| Age Bracket | Male | Female |
| Under 5 Years | 2 (4.8%) | 2 (2.5%) |
| 5 to 17 Years | 12 (5.1%) | 2 (0.6%) |
| 18 to 34 Years | 80 (21.1%) | 21 (5.1%) |
| 35 to 64 Years | 91 (12.9%) | 106 (14.7%) |
| 65 to 74 Years | 29 (10.5%) | 43 (16.7%) |
| 75 Years and over | 46 (33.8%) | 92 (35.9%) |
Disability Class by Sex by Age in Boyne City
Disability Class: Hearing Difficulty
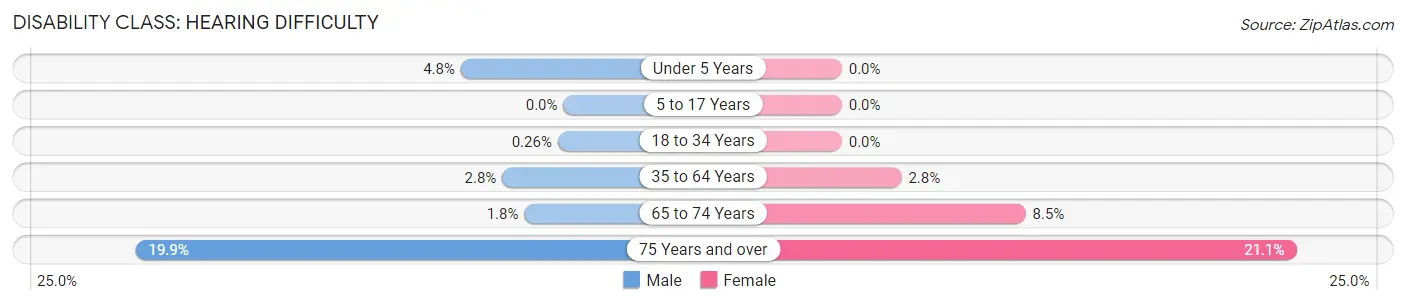
| Age Bracket | Male | Female |
| Under 5 Years | 2 (4.8%) | 0 (0.0%) |
| 5 to 17 Years | 0 (0.0%) | 0 (0.0%) |
| 18 to 34 Years | 1 (0.3%) | 0 (0.0%) |
| 35 to 64 Years | 20 (2.8%) | 20 (2.8%) |
| 65 to 74 Years | 5 (1.8%) | 22 (8.5%) |
| 75 Years and over | 27 (19.9%) | 54 (21.1%) |
Disability Class: Vision Difficulty
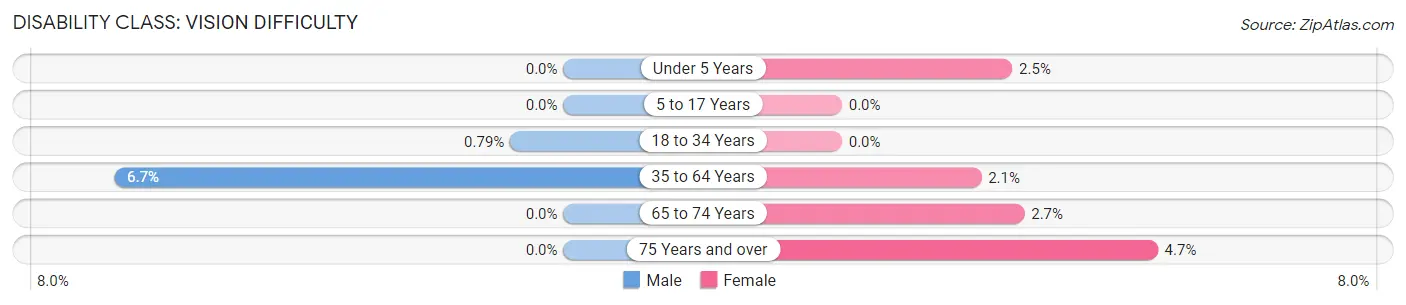
| Age Bracket | Male | Female |
| Under 5 Years | 0 (0.0%) | 2 (2.5%) |
| 5 to 17 Years | 0 (0.0%) | 0 (0.0%) |
| 18 to 34 Years | 3 (0.8%) | 0 (0.0%) |
| 35 to 64 Years | 47 (6.7%) | 15 (2.1%) |
| 65 to 74 Years | 0 (0.0%) | 7 (2.7%) |
| 75 Years and over | 0 (0.0%) | 12 (4.7%) |
Disability Class: Cognitive Difficulty
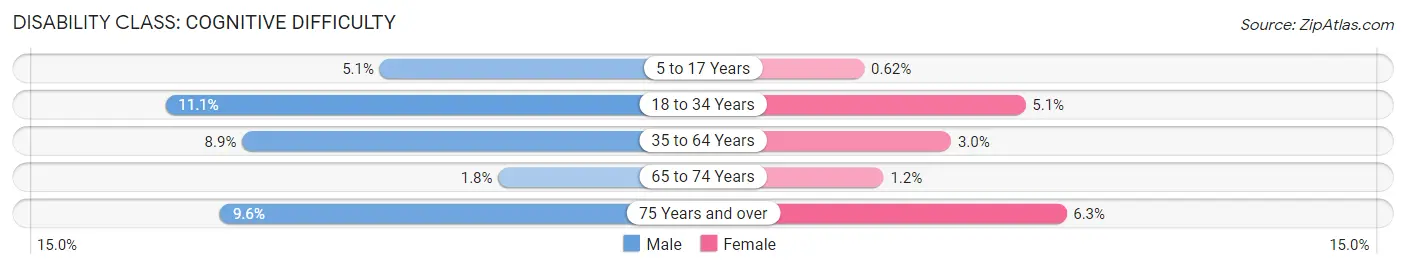
| Age Bracket | Male | Female |
| 5 to 17 Years | 12 (5.1%) | 2 (0.6%) |
| 18 to 34 Years | 42 (11.1%) | 21 (5.1%) |
| 35 to 64 Years | 63 (8.9%) | 22 (3.0%) |
| 65 to 74 Years | 5 (1.8%) | 3 (1.2%) |
| 75 Years and over | 13 (9.6%) | 16 (6.2%) |
Disability Class: Ambulatory Difficulty
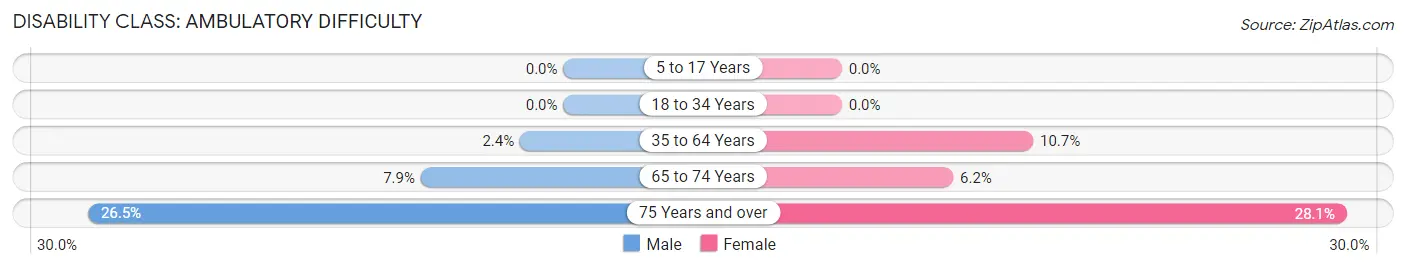
| Age Bracket | Male | Female |
| 5 to 17 Years | 0 (0.0%) | 0 (0.0%) |
| 18 to 34 Years | 0 (0.0%) | 0 (0.0%) |
| 35 to 64 Years | 17 (2.4%) | 77 (10.6%) |
| 65 to 74 Years | 22 (7.9%) | 16 (6.2%) |
| 75 Years and over | 36 (26.5%) | 72 (28.1%) |
Disability Class: Self-Care Difficulty
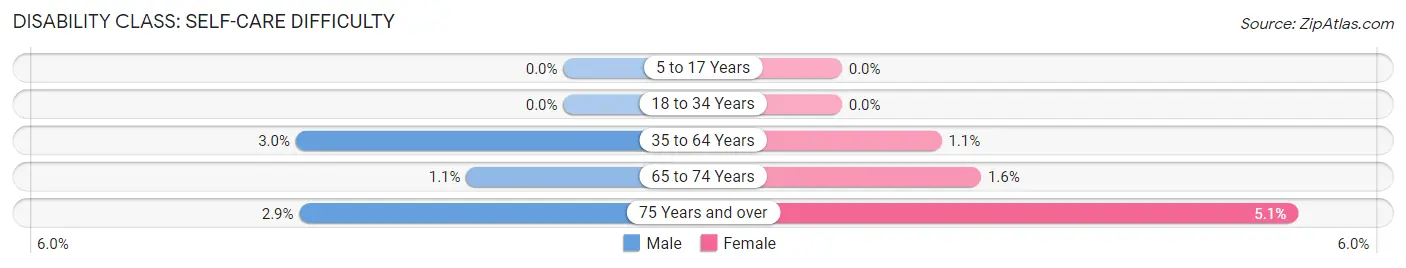
| Age Bracket | Male | Female |
| 5 to 17 Years | 0 (0.0%) | 0 (0.0%) |
| 18 to 34 Years | 0 (0.0%) | 0 (0.0%) |
| 35 to 64 Years | 21 (3.0%) | 8 (1.1%) |
| 65 to 74 Years | 3 (1.1%) | 4 (1.5%) |
| 75 Years and over | 4 (2.9%) | 13 (5.1%) |
Technology Access in Boyne City
Computing Device Access in Boyne City
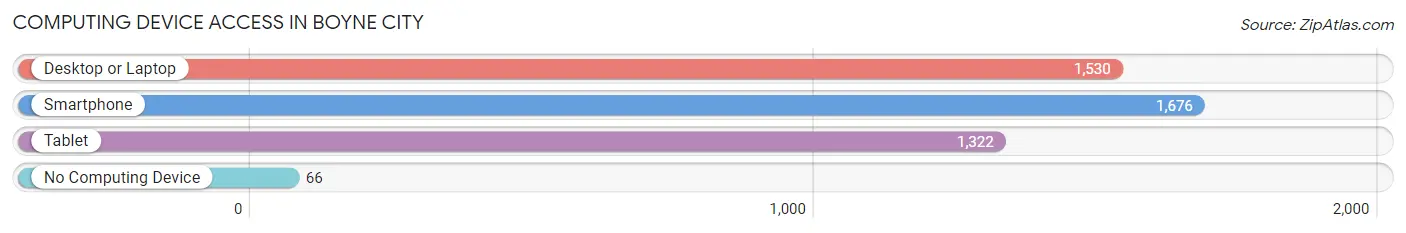
| Device Type | # Households | % Households |
| Desktop or Laptop | 1,530 | 79.9% |
| Smartphone | 1,676 | 87.5% |
| Tablet | 1,322 | 69.0% |
| No Computing Device | 66 | 3.5% |
| Total | 1,915 | 100.0% |
Internet Access in Boyne City
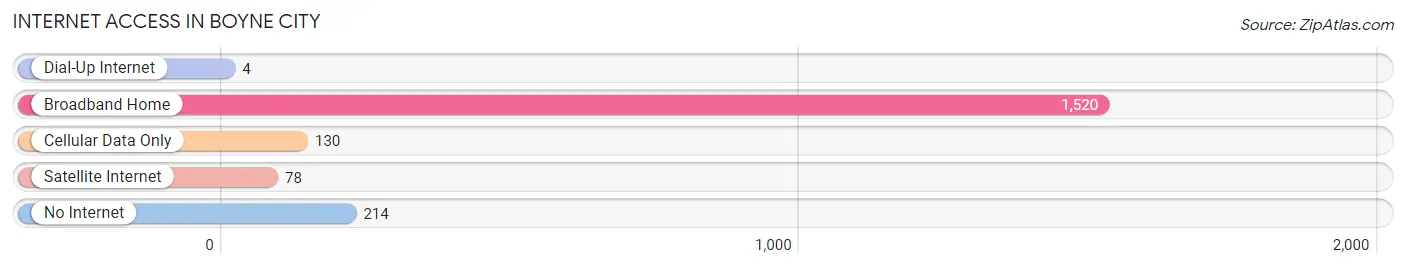
| Internet Type | # Households | % Households |
| Dial-Up Internet | 4 | 0.2% |
| Broadband Home | 1,520 | 79.4% |
| Cellular Data Only | 130 | 6.8% |
| Satellite Internet | 78 | 4.1% |
| No Internet | 214 | 11.2% |
| Total | 1,915 | 100.0% |
Boyne City Summary
Boyne City is a small city located in the northwest corner of Michigan’s Lower Peninsula. It is situated on the shores of Lake Charlevoix, a large lake that is part of the Great Lakes system. The city is the county seat of Charlevoix County and is home to a population of approximately 3,000 people.
History
Boyne City was founded in 1856 by William Conklin, a lumberman from New York. He named the city after the Boyne River in Ireland, which was the site of a famous battle in 1690. The city was incorporated in 1882 and quickly became a hub for the lumber industry. By the early 1900s, the city had become a popular tourist destination, with many people coming to enjoy the lake and the surrounding countryside.
In the 1950s, the city began to experience a decline in the lumber industry, and the population began to decline as well. However, in the late 1970s, the city began to experience a resurgence in tourism, and the population began to grow again. Today, Boyne City is a popular tourist destination, with many people coming to enjoy the lake and the surrounding countryside.
Geography
Boyne City is located in the northwest corner of Michigan’s Lower Peninsula, on the shores of Lake Charlevoix. The city is situated at the mouth of the Boyne River, which flows into Lake Charlevoix. The city is surrounded by rolling hills and forests, and is located about 30 miles east of Traverse City.
The climate in Boyne City is generally mild, with warm summers and cold winters. The average temperature in the summer is around 70 degrees Fahrenheit, and the average temperature in the winter is around 20 degrees Fahrenheit.
Economy
The economy of Boyne City is largely based on tourism. The city is a popular destination for people looking to enjoy the lake and the surrounding countryside. The city also has a thriving arts and culture scene, with many galleries, museums, and theaters.
In addition to tourism, the city also has a strong manufacturing base. The city is home to several factories, including a paper mill, a furniture factory, and a plastics factory. The city also has a strong agricultural sector, with many farms located in the surrounding area.
Demographics
As of the 2010 census, the population of Boyne City was 2,945. The racial makeup of the city was 95.3% White, 0.7% African American, 0.3% Native American, 0.7% Asian, 0.1% Pacific Islander, and 2.0% from other races. The median household income was $37,917, and the median family income was $45,938.
Conclusion
Boyne City is a small city located in the northwest corner of Michigan’s Lower Peninsula. It is situated on the shores of Lake Charlevoix and is home to a population of approximately 3,000 people. The city’s economy is largely based on tourism, with many people coming to enjoy the lake and the surrounding countryside. The city also has a strong manufacturing base and a thriving agricultural sector. The population of Boyne City is predominantly white, with a median household income of $37,917.
Common Questions
What is Per Capita Income in Boyne City?
Per Capita income in Boyne City is $38,115.
What is the Median Family Income in Boyne City?
Median Family Income in Boyne City is $78,229.
What is the Median Household income in Boyne City?
Median Household Income in Boyne City is $65,070.
What is Income or Wage Gap in Boyne City?
Income or Wage Gap in Boyne City is 30.0%.
Women in Boyne City earn 70.0 cents for every dollar earned by a man.
What is Inequality or Gini Index in Boyne City?
Inequality or Gini Index in Boyne City is 0.42.
What is the Total Population of Boyne City?
Total Population of Boyne City is 3,821.
What is the Total Male Population of Boyne City?
Total Male Population of Boyne City is 1,774.
What is the Total Female Population of Boyne City?
Total Female Population of Boyne City is 2,047.
What is the Ratio of Males per 100 Females in Boyne City?
There are 86.66 Males per 100 Females in Boyne City.
What is the Ratio of Females per 100 Males in Boyne City?
There are 115.39 Females per 100 Males in Boyne City.
What is the Median Population Age in Boyne City?
Median Population Age in Boyne City is 45.5 Years.
What is the Average Family Size in Boyne City
Average Family Size in Boyne City is 2.5 People.
What is the Average Household Size in Boyne City
Average Household Size in Boyne City is 2.0 People.
How Large is the Labor Force in Boyne City?
There are 2,085 People in the Labor Forcein in Boyne City.
What is the Percentage of People in the Labor Force in Boyne City?
64.8% of People are in the Labor Force in Boyne City.
What is the Unemployment Rate in Boyne City?
Unemployment Rate in Boyne City is 6.2%.