Bay Shore, MI Map & Demographics
Bay Shore Map
Bay Shore Overview
$43,393
PER CAPITA INCOME
$71,250
AVG FAMILY INCOME
$64,444
AVG HOUSEHOLD INCOME
0.43
INEQUALITY / GINI INDEX
533
TOTAL POPULATION
253
MALE POPULATION
280
FEMALE POPULATION
90.36
MALES / 100 FEMALES
110.67
FEMALES / 100 MALES
51.3
MEDIAN AGE
2.3
AVG FAMILY SIZE
2.0
AVG HOUSEHOLD SIZE
304
LABOR FORCE [ PEOPLE ]
61.0%
PERCENT IN LABOR FORCE
2.3%
UNEMPLOYMENT RATE
Bay Shore Area Codes
Income in Bay Shore
Income Overview in Bay Shore
Per Capita Income in Bay Shore is $43,393, while median incomes of families and households are $71,250 and $64,444 respectively.
| Characteristic | Number | Measure |
| Per Capita Income | 533 | $43,393 |
| Median Family Income | 184 | $71,250 |
| Mean Family Income | 184 | $100,565 |
| Median Household Income | 266 | $64,444 |
| Mean Household Income | 266 | $84,064 |
| Income Deficit | 184 | $0 |
| Wage / Income Gap (%) | 533 | 0.00% |
| Wage / Income Gap ($) | 533 | 100.00¢ per $1 |
| Gini / Inequality Index | 533 | 0.43 |
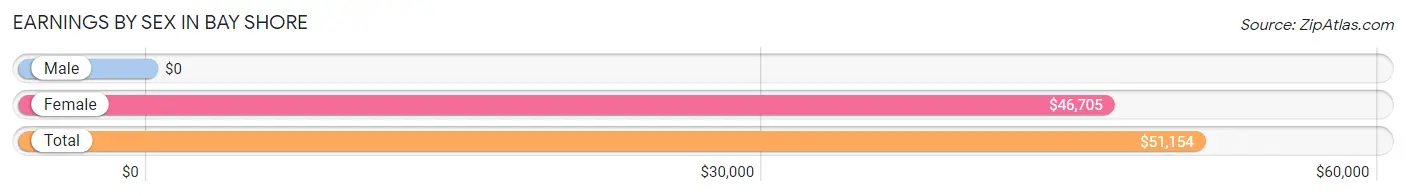
Earnings by Sex in Bay Shore
| Sex | Number | Average Earnings |
| Male | 163 (52.9%) | $0 |
| Female | 145 (47.1%) | $46,705 |
| Total | 308 (100.0%) | $51,154 |
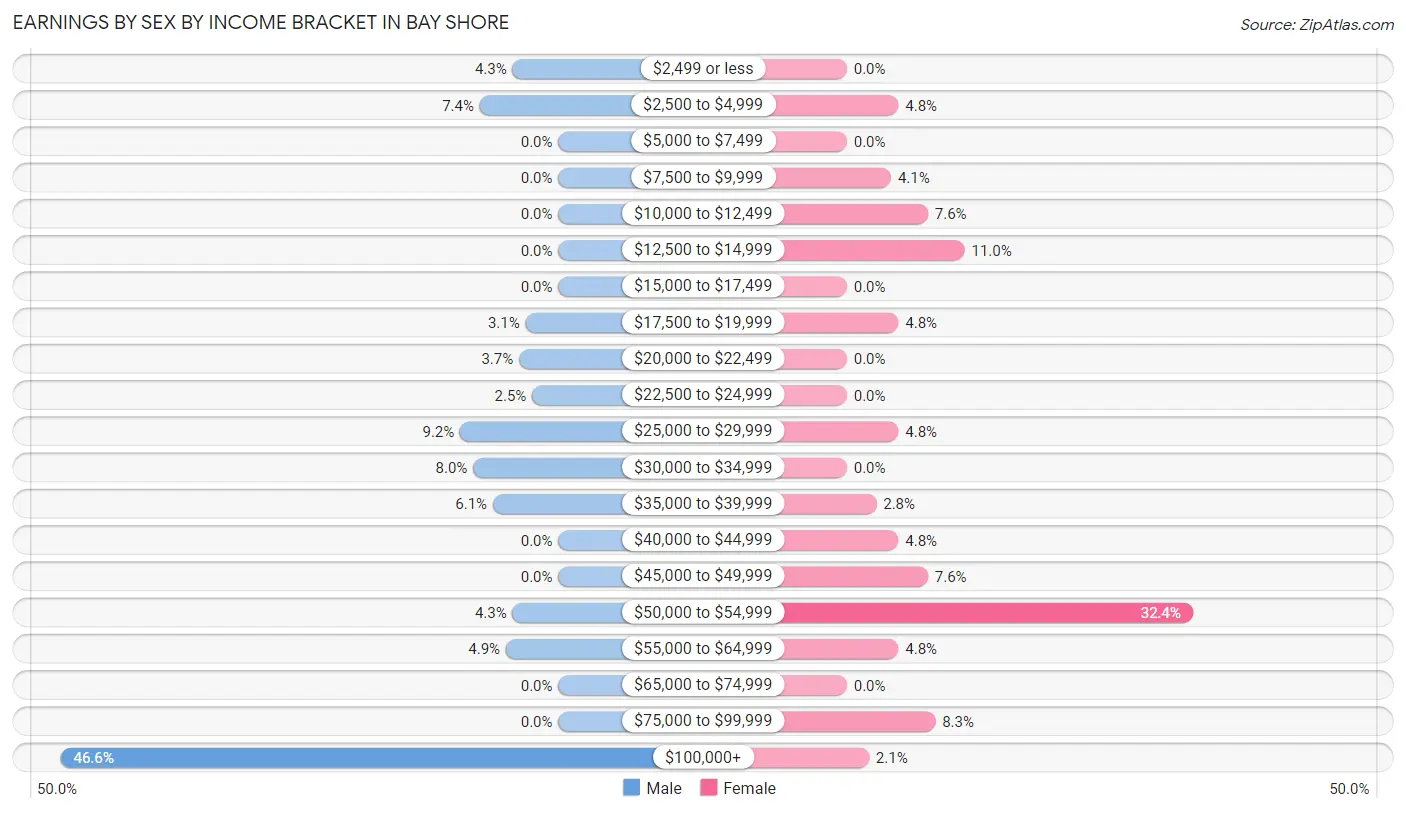
Earnings by Sex by Income Bracket in Bay Shore
The most common earnings brackets in Bay Shore are $100,000+ for men (76 | 46.6%) and $50,000 to $54,999 for women (47 | 32.4%).
| Income | Male | Female |
| $2,499 or less | 7 (4.3%) | 0 (0.0%) |
| $2,500 to $4,999 | 12 (7.4%) | 7 (4.8%) |
| $5,000 to $7,499 | 0 (0.0%) | 0 (0.0%) |
| $7,500 to $9,999 | 0 (0.0%) | 6 (4.1%) |
| $10,000 to $12,499 | 0 (0.0%) | 11 (7.6%) |
| $12,500 to $14,999 | 0 (0.0%) | 16 (11.0%) |
| $15,000 to $17,499 | 0 (0.0%) | 0 (0.0%) |
| $17,500 to $19,999 | 5 (3.1%) | 7 (4.8%) |
| $20,000 to $22,499 | 6 (3.7%) | 0 (0.0%) |
| $22,500 to $24,999 | 4 (2.5%) | 0 (0.0%) |
| $25,000 to $29,999 | 15 (9.2%) | 7 (4.8%) |
| $30,000 to $34,999 | 13 (8.0%) | 0 (0.0%) |
| $35,000 to $39,999 | 10 (6.1%) | 4 (2.8%) |
| $40,000 to $44,999 | 0 (0.0%) | 7 (4.8%) |
| $45,000 to $49,999 | 0 (0.0%) | 11 (7.6%) |
| $50,000 to $54,999 | 7 (4.3%) | 47 (32.4%) |
| $55,000 to $64,999 | 8 (4.9%) | 7 (4.8%) |
| $65,000 to $74,999 | 0 (0.0%) | 0 (0.0%) |
| $75,000 to $99,999 | 0 (0.0%) | 12 (8.3%) |
| $100,000+ | 76 (46.6%) | 3 (2.1%) |
| Total | 163 (100.0%) | 145 (100.0%) |
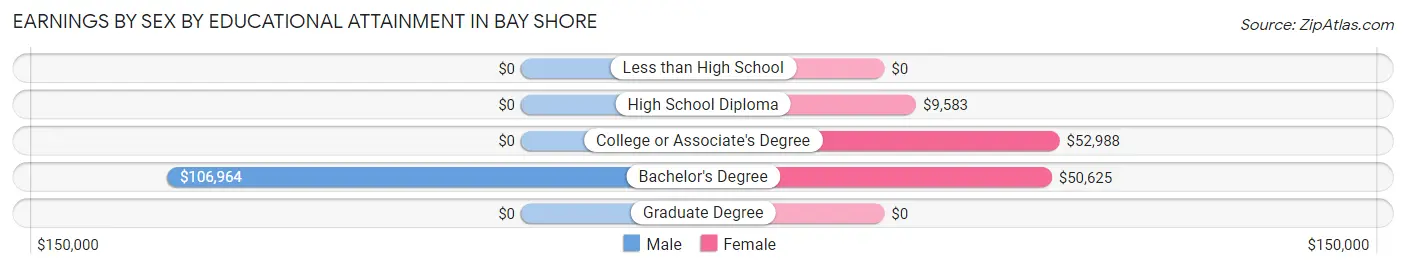
Earnings by Sex by Educational Attainment in Bay Shore
| Educational Attainment | Male Income | Female Income |
| Less than High School | - | - |
| High School Diploma | - | - |
| College or Associate's Degree | - | - |
| Bachelor's Degree | $106,964 | $50,625 |
| Graduate Degree | - | - |
| Total | - | - |
Family Income in Bay Shore
Family Income Brackets in Bay Shore
According to the Bay Shore family income data, there are 73 families falling into the $50,000 to $74,999 income range, which is the most common income bracket and makes up 39.7% of all families.
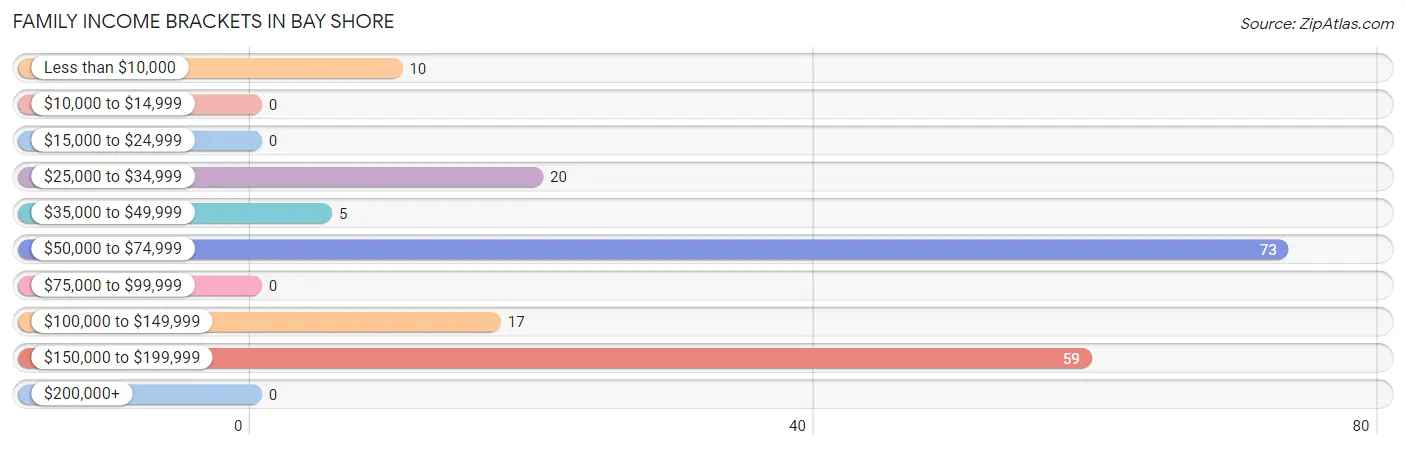
| Income Bracket | # Families | % Families |
| Less than $10,000 | 10 | 5.4% |
| $10,000 to $14,999 | 0 | 0.0% |
| $15,000 to $24,999 | 0 | 0.0% |
| $25,000 to $34,999 | 20 | 10.9% |
| $35,000 to $49,999 | 5 | 2.7% |
| $50,000 to $74,999 | 73 | 39.7% |
| $75,000 to $99,999 | 0 | 0.0% |
| $100,000 to $149,999 | 17 | 9.2% |
| $150,000 to $199,999 | 59 | 32.1% |
| $200,000+ | 0 | 0.0% |
Family Income by Famaliy Size in Bay Shore
2-person families (114 | 62.0%) account for the highest median family income in Bay Shore with $69,688 per family, while 2-person families (114 | 62.0%) have the highest median income of $34,844 per family member.
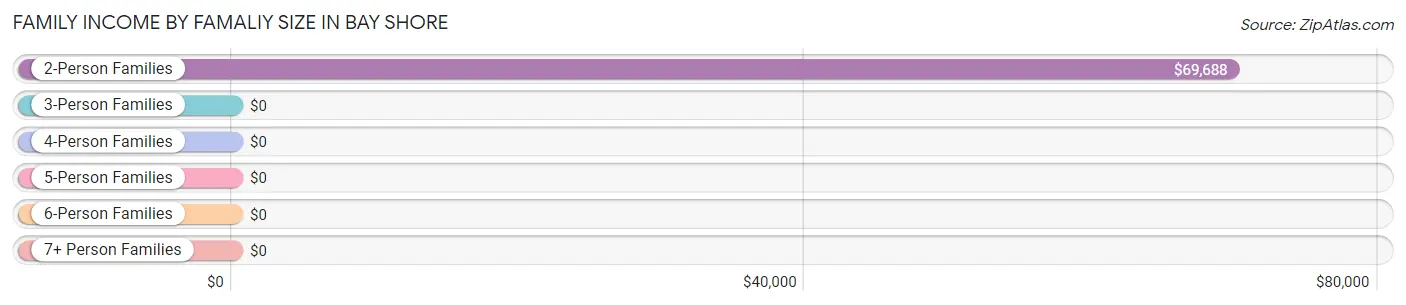
| Income Bracket | # Families | Median Income |
| 2-Person Families | 114 (62.0%) | $69,688 |
| 3-Person Families | 17 (9.2%) | $0 |
| 4-Person Families | 7 (3.8%) | $0 |
| 5-Person Families | 45 (24.5%) | $0 |
| 6-Person Families | 1 (0.5%) | $0 |
| 7+ Person Families | 0 (0.0%) | $0 |
| Total | 184 (100.0%) | $71,250 |
Family Income by Number of Earners in Bay Shore
The median family income in Bay Shore is $71,250, with families comprising 3+ earners (49) having the highest median family income of $183,506, while families with 1 earner (40) have the lowest median family income of $61,250, accounting for 26.6% and 21.7% of families, respectively.
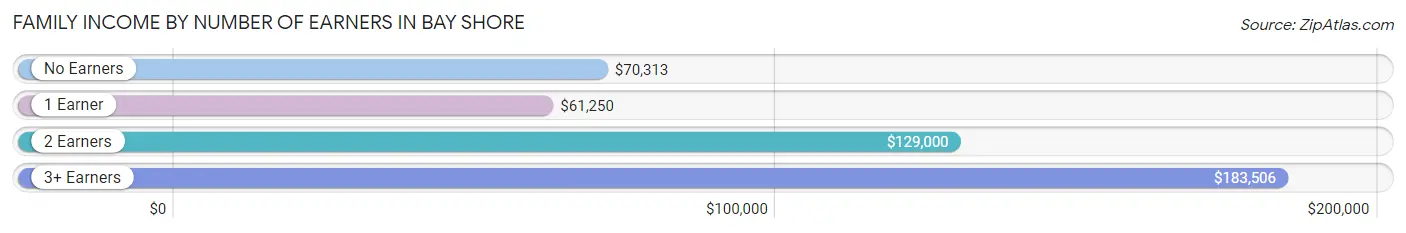
| Number of Earners | # Families | Median Income |
| No Earners | 49 (26.6%) | $70,313 |
| 1 Earner | 40 (21.7%) | $61,250 |
| 2 Earners | 46 (25.0%) | $129,000 |
| 3+ Earners | 49 (26.6%) | $183,506 |
| Total | 184 (100.0%) | $71,250 |
Household Income in Bay Shore
Household Income Brackets in Bay Shore
With 70 households falling in the category, the $150,000 to $199,999 income range is the most frequent in Bay Shore, accounting for 26.3% of all households.
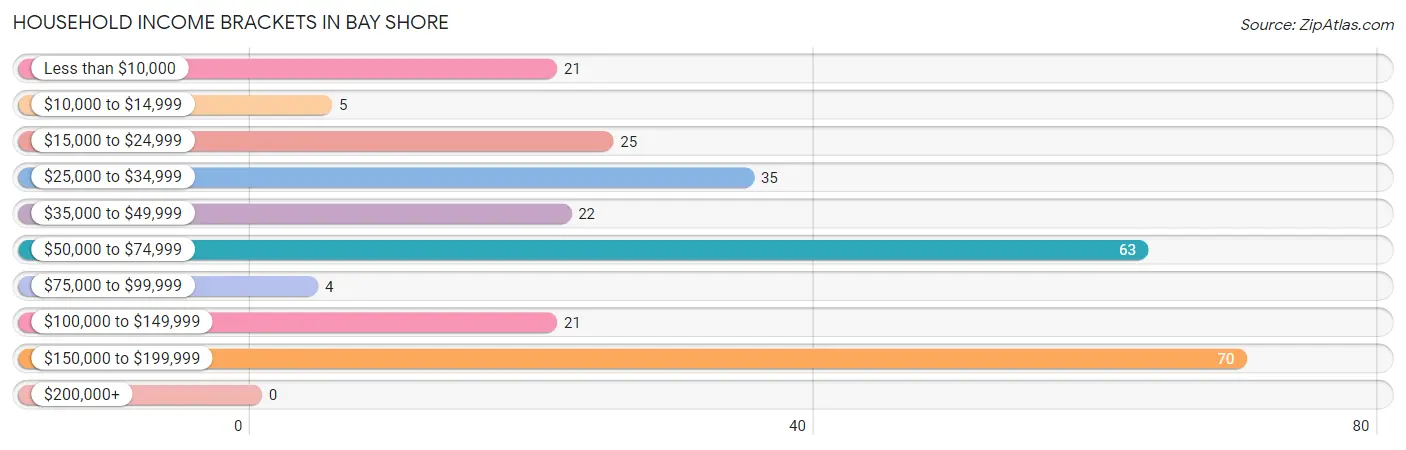
| Income Bracket | # Households | % Households |
| Less than $10,000 | 21 | 7.9% |
| $10,000 to $14,999 | 5 | 1.9% |
| $15,000 to $24,999 | 25 | 9.4% |
| $25,000 to $34,999 | 35 | 13.2% |
| $35,000 to $49,999 | 22 | 8.3% |
| $50,000 to $74,999 | 63 | 23.7% |
| $75,000 to $99,999 | 4 | 1.5% |
| $100,000 to $149,999 | 21 | 7.9% |
| $150,000 to $199,999 | 70 | 26.3% |
| $200,000+ | 0 | 0.0% |
Household Income by Householder Age in Bay Shore
The median household income in Bay Shore is $64,444, with the highest median household income of $61,042 found in the 65+ years age bracket for the primary householder. A total of 101 households (38.0%) fall into this category.
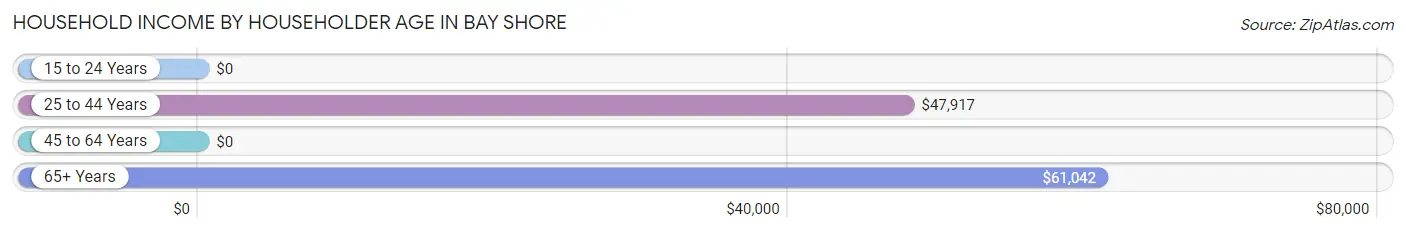
| Income Bracket | # Households | Median Income |
| 15 to 24 Years | 0 (0.0%) | $0 |
| 25 to 44 Years | 54 (20.3%) | $47,917 |
| 45 to 64 Years | 111 (41.7%) | $0 |
| 65+ Years | 101 (38.0%) | $61,042 |
| Total | 266 (100.0%) | $64,444 |
Poverty in Bay Shore
Income Below Poverty by Sex and Age in Bay Shore
With 6.7% poverty level for males and 9.6% for females among the residents of Bay Shore, 6 to 11 year old males and 6 to 11 year old females are the most vulnerable to poverty, with 2 males (100.0%) and 1 females (100.0%) in their respective age groups living below the poverty level.
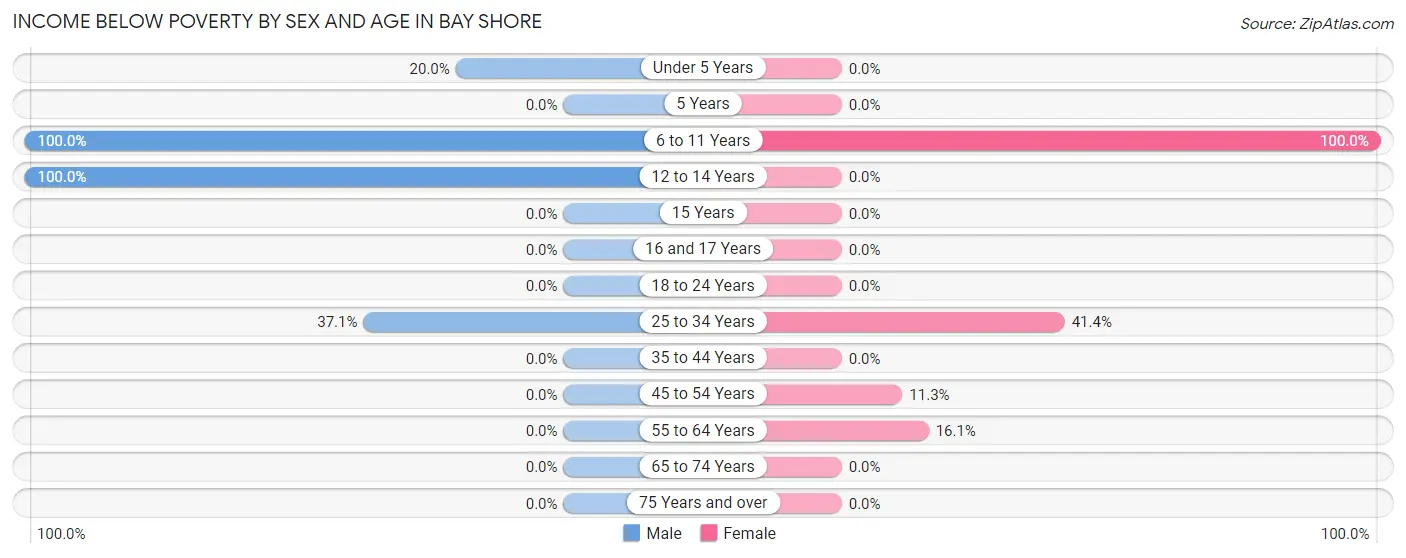
| Age Bracket | Male | Female |
| Under 5 Years | 1 (20.0%) | 0 (0.0%) |
| 5 Years | 0 (0.0%) | 0 (0.0%) |
| 6 to 11 Years | 2 (100.0%) | 1 (100.0%) |
| 12 to 14 Years | 1 (100.0%) | 0 (0.0%) |
| 15 Years | 0 (0.0%) | 0 (0.0%) |
| 16 and 17 Years | 0 (0.0%) | 0 (0.0%) |
| 18 to 24 Years | 0 (0.0%) | 0 (0.0%) |
| 25 to 34 Years | 13 (37.1%) | 12 (41.4%) |
| 35 to 44 Years | 0 (0.0%) | 0 (0.0%) |
| 45 to 54 Years | 0 (0.0%) | 9 (11.3%) |
| 55 to 64 Years | 0 (0.0%) | 5 (16.1%) |
| 65 to 74 Years | 0 (0.0%) | 0 (0.0%) |
| 75 Years and over | 0 (0.0%) | 0 (0.0%) |
| Total | 17 (6.7%) | 27 (9.6%) |
Income Above Poverty by Sex and Age in Bay Shore
According to the poverty statistics in Bay Shore, males aged 16 and 17 years and females aged under 5 years are the age groups that are most secure financially, with 100.0% of males and 100.0% of females in these age groups living above the poverty line.
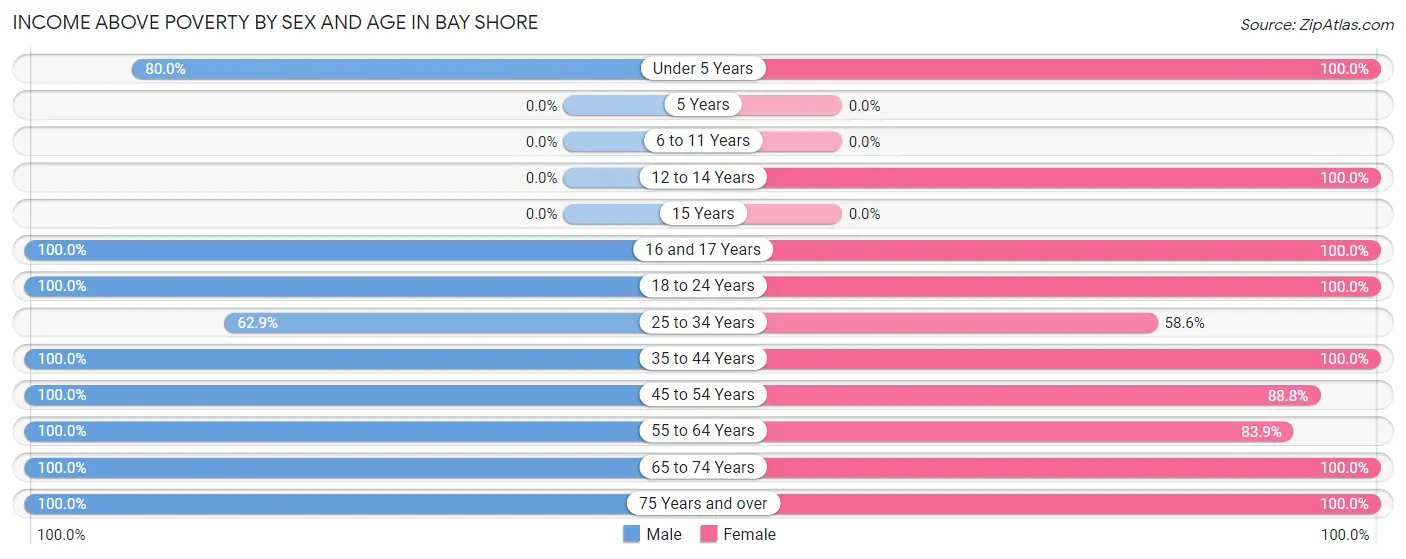
| Age Bracket | Male | Female |
| Under 5 Years | 4 (80.0%) | 4 (100.0%) |
| 5 Years | 0 (0.0%) | 0 (0.0%) |
| 6 to 11 Years | 0 (0.0%) | 0 (0.0%) |
| 12 to 14 Years | 0 (0.0%) | 22 (100.0%) |
| 15 Years | 0 (0.0%) | 0 (0.0%) |
| 16 and 17 Years | 7 (100.0%) | 10 (100.0%) |
| 18 to 24 Years | 6 (100.0%) | 14 (100.0%) |
| 25 to 34 Years | 22 (62.9%) | 17 (58.6%) |
| 35 to 44 Years | 24 (100.0%) | 20 (100.0%) |
| 45 to 54 Years | 71 (100.0%) | 71 (88.7%) |
| 55 to 64 Years | 35 (100.0%) | 26 (83.9%) |
| 65 to 74 Years | 55 (100.0%) | 39 (100.0%) |
| 75 Years and over | 12 (100.0%) | 30 (100.0%) |
| Total | 236 (93.3%) | 253 (90.4%) |
Income Below Poverty Among Married-Couple Families in Bay Shore
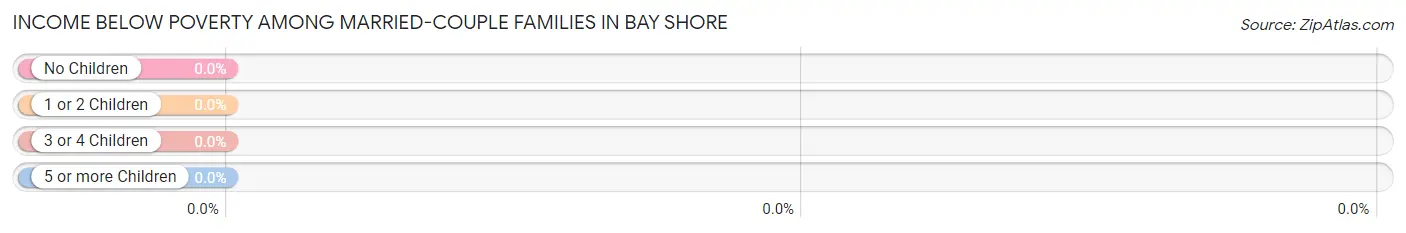
| Children | Above Poverty | Below Poverty |
| No Children | 99 (100.0%) | 0 (0.0%) |
| 1 or 2 Children | 55 (100.0%) | 0 (0.0%) |
| 3 or 4 Children | 0 (0.0%) | 0 (0.0%) |
| 5 or more Children | 0 (0.0%) | 0 (0.0%) |
| Total | 154 (100.0%) | 0 (0.0%) |
Income Below Poverty Among Single-Parent Households in Bay Shore
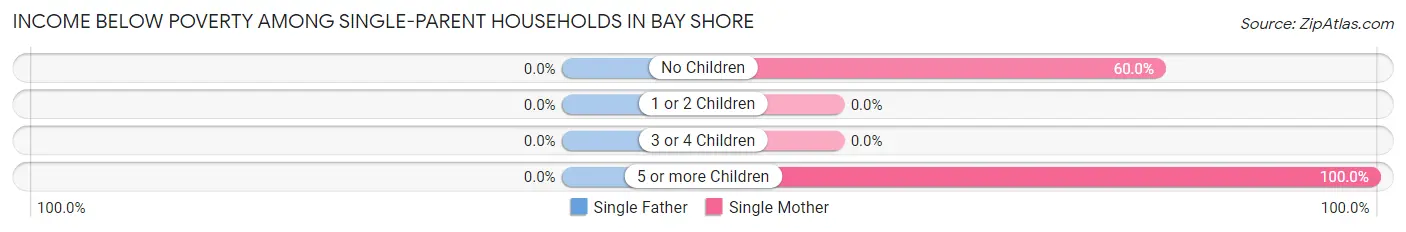
| Children | Single Father | Single Mother |
| No Children | 0 (0.0%) | 9 (60.0%) |
| 1 or 2 Children | 0 (0.0%) | 0 (0.0%) |
| 3 or 4 Children | 0 (0.0%) | 0 (0.0%) |
| 5 or more Children | 0 (0.0%) | 1 (100.0%) |
| Total | 0 (0.0%) | 10 (38.5%) |
Income Below Poverty Among Married-Couple vs Single-Parent Households in Bay Shore
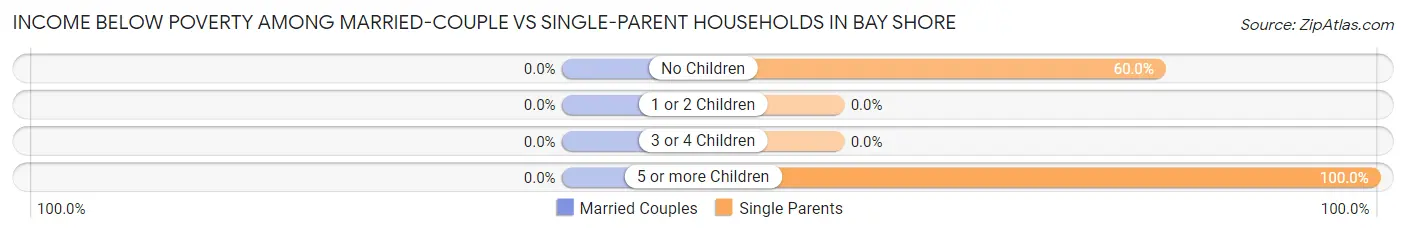
| Children | Married-Couple Families | Single-Parent Households |
| No Children | 0 (0.0%) | 9 (60.0%) |
| 1 or 2 Children | 0 (0.0%) | 0 (0.0%) |
| 3 or 4 Children | 0 (0.0%) | 0 (0.0%) |
| 5 or more Children | 0 (0.0%) | 1 (100.0%) |
| Total | 0 (0.0%) | 10 (33.3%) |
Race in Bay Shore
The most populous races in Bay Shore are White / Caucasian (480 | 90.1%), Asian (21 | 3.9%), and Native / Alaskan (19 | 3.6%).
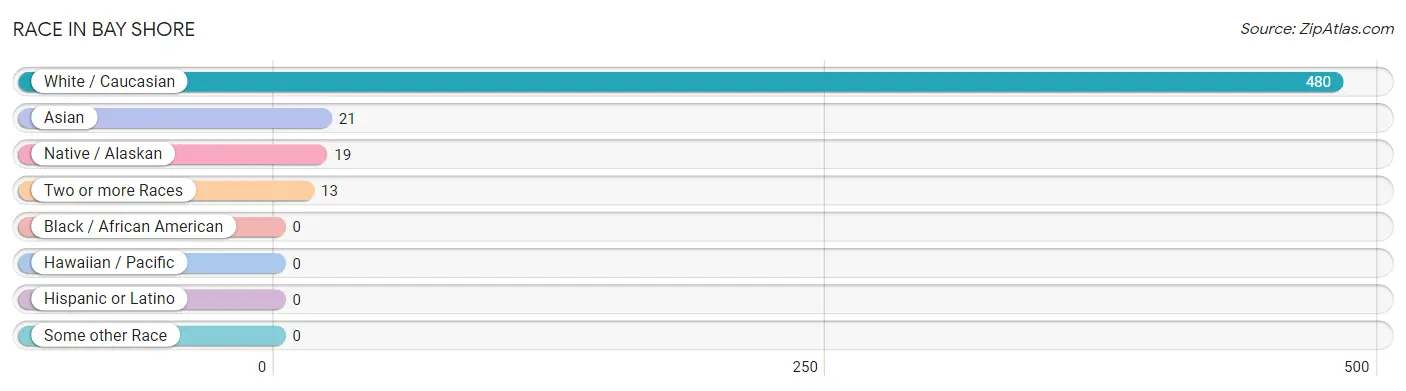
| Race | # Population | % Population |
| Asian | 21 | 3.9% |
| Black / African American | 0 | 0.0% |
| Hawaiian / Pacific | 0 | 0.0% |
| Hispanic or Latino | 0 | 0.0% |
| Native / Alaskan | 19 | 3.6% |
| White / Caucasian | 480 | 90.1% |
| Two or more Races | 13 | 2.4% |
| Some other Race | 0 | 0.0% |
| Total | 533 | 100.0% |
Ancestry in Bay Shore
The most populous ancestries reported in Bay Shore are English (152 | 28.5%), German (102 | 19.1%), Irish (95 | 17.8%), Finnish (77 | 14.4%), and Northern European (25 | 4.7%), together accounting for 84.6% of all Bay Shore residents.
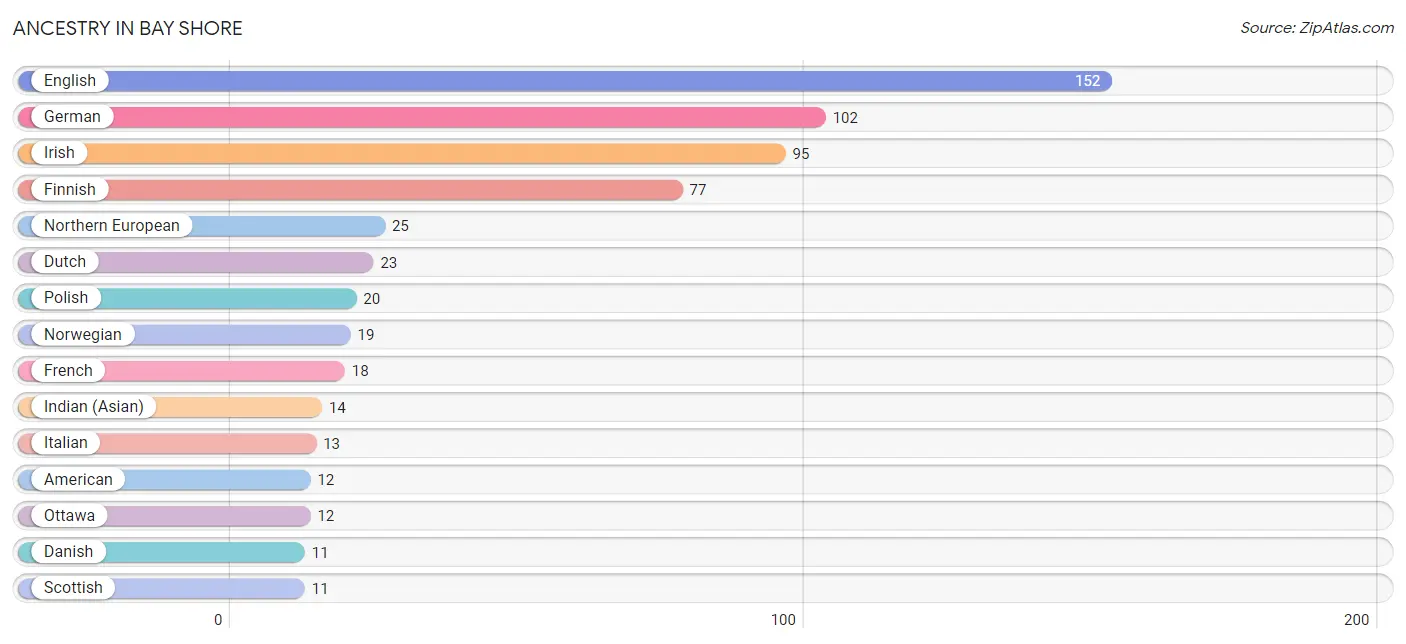
| Ancestry | # Population | % Population |
| American | 12 | 2.2% |
| British | 3 | 0.6% |
| Burmese | 7 | 1.3% |
| Canadian | 7 | 1.3% |
| Czech | 3 | 0.6% |
| Danish | 11 | 2.1% |
| Dutch | 23 | 4.3% |
| Eastern European | 4 | 0.7% |
| English | 152 | 28.5% |
| Finnish | 77 | 14.4% |
| French | 18 | 3.4% |
| German | 102 | 19.1% |
| Indian (Asian) | 14 | 2.6% |
| Irish | 95 | 17.8% |
| Italian | 13 | 2.4% |
| Northern European | 25 | 4.7% |
| Norwegian | 19 | 3.6% |
| Ottawa | 12 | 2.2% |
| Polish | 20 | 3.7% |
| Russian | 7 | 1.3% |
| Scottish | 11 | 2.1% |
| Swedish | 5 | 0.9% | View All 22 Rows |
Immigrants in Bay Shore
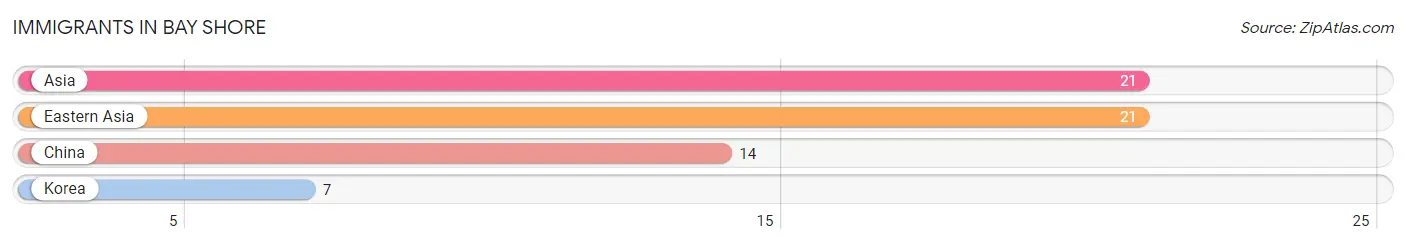
The most numerous immigrant groups reported in Bay Shore came from Asia (21 | 3.9%), Eastern Asia (21 | 3.9%), China (14 | 2.6%), and Korea (7 | 1.3%), together accounting for 11.8% of all Bay Shore residents.
| Immigration Origin | # Population | % Population |
| Asia | 21 | 3.9% |
| China | 14 | 2.6% |
| Eastern Asia | 21 | 3.9% |
| Korea | 7 | 1.3% | View All 4 Rows |
Sex and Age in Bay Shore
Sex and Age in Bay Shore
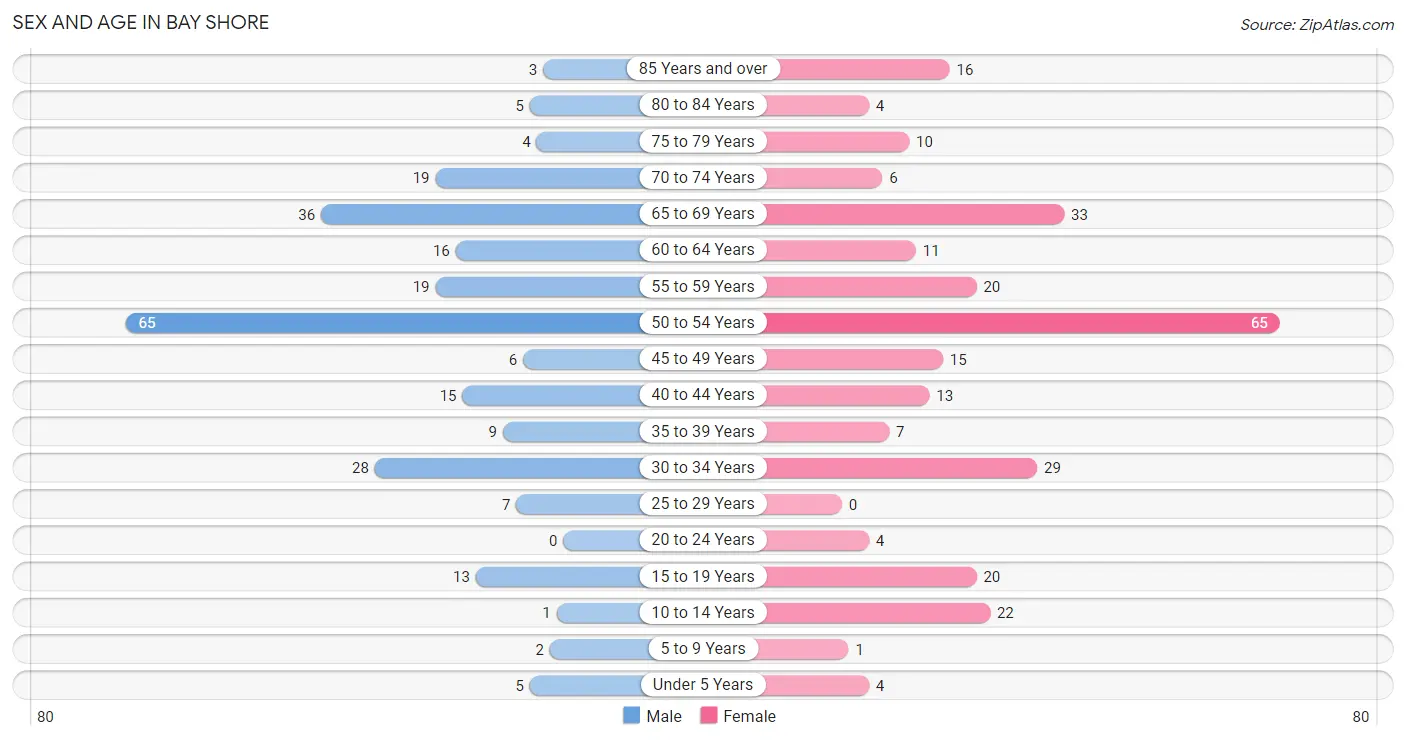
The most populous age groups in Bay Shore are 50 to 54 Years (65 | 25.7%) for men and 50 to 54 Years (65 | 23.2%) for women.
| Age Bracket | Male | Female |
| Under 5 Years | 5 (2.0%) | 4 (1.4%) |
| 5 to 9 Years | 2 (0.8%) | 1 (0.4%) |
| 10 to 14 Years | 1 (0.4%) | 22 (7.9%) |
| 15 to 19 Years | 13 (5.1%) | 20 (7.1%) |
| 20 to 24 Years | 0 (0.0%) | 4 (1.4%) |
| 25 to 29 Years | 7 (2.8%) | 0 (0.0%) |
| 30 to 34 Years | 28 (11.1%) | 29 (10.4%) |
| 35 to 39 Years | 9 (3.6%) | 7 (2.5%) |
| 40 to 44 Years | 15 (5.9%) | 13 (4.6%) |
| 45 to 49 Years | 6 (2.4%) | 15 (5.4%) |
| 50 to 54 Years | 65 (25.7%) | 65 (23.2%) |
| 55 to 59 Years | 19 (7.5%) | 20 (7.1%) |
| 60 to 64 Years | 16 (6.3%) | 11 (3.9%) |
| 65 to 69 Years | 36 (14.2%) | 33 (11.8%) |
| 70 to 74 Years | 19 (7.5%) | 6 (2.1%) |
| 75 to 79 Years | 4 (1.6%) | 10 (3.6%) |
| 80 to 84 Years | 5 (2.0%) | 4 (1.4%) |
| 85 Years and over | 3 (1.2%) | 16 (5.7%) |
| Total | 253 (100.0%) | 280 (100.0%) |
Families and Households in Bay Shore
Median Family Size in Bay Shore
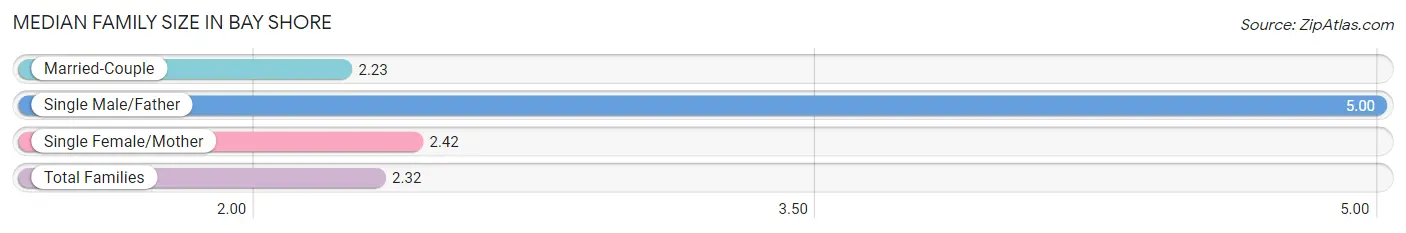
The median family size in Bay Shore is 2.32 persons per family, with single male/father families (4 | 2.2%) accounting for the largest median family size of 5 persons per family. On the other hand, married-couple families (154 | 83.7%) represent the smallest median family size with 2.23 persons per family.
| Family Type | # Families | Family Size |
| Married-Couple | 154 (83.7%) | 2.23 |
| Single Male/Father | 4 (2.2%) | 5.00 |
| Single Female/Mother | 26 (14.1%) | 2.42 |
| Total Families | 184 (100.0%) | 2.32 |
Median Household Size in Bay Shore
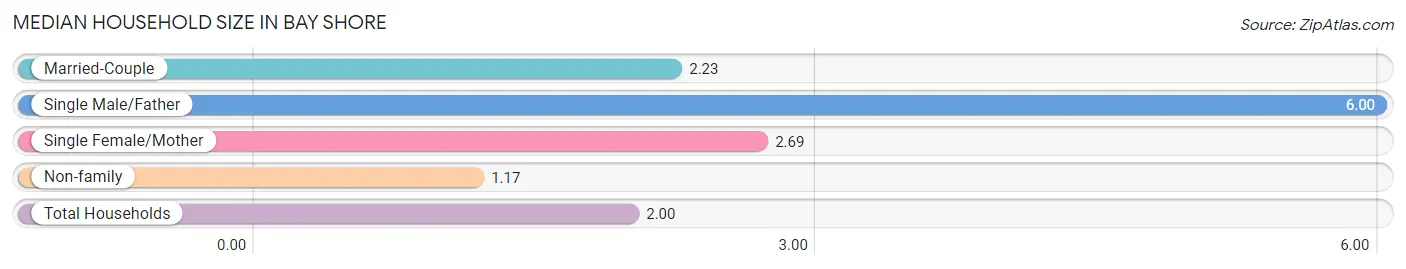
The median household size in Bay Shore is 2.00 persons per household, with single male/father households (4 | 1.5%) accounting for the largest median household size of 6 persons per household. non-family households (82 | 30.8%) represent the smallest median household size with 1.17 persons per household.
| Household Type | # Households | Household Size |
| Married-Couple | 154 (57.9%) | 2.23 |
| Single Male/Father | 4 (1.5%) | 6.00 |
| Single Female/Mother | 26 (9.8%) | 2.69 |
| Non-family | 82 (30.8%) | 1.17 |
| Total Households | 266 (100.0%) | 2.00 |
Household Size by Marriage Status in Bay Shore
Out of a total of 266 households in Bay Shore, 184 (69.2%) are family households, while 82 (30.8%) are nonfamily households. The most numerous type of family households are 2-person households, comprising 114, and the most common type of nonfamily households are 1-person households, comprising 69.
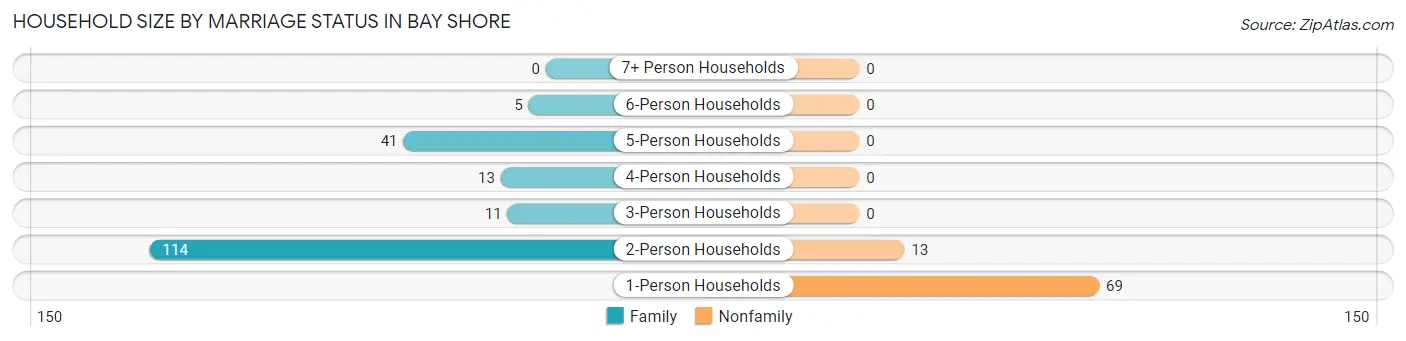
| Household Size | Family Households | Nonfamily Households |
| 1-Person Households | - | 69 (25.9%) |
| 2-Person Households | 114 (42.9%) | 13 (4.9%) |
| 3-Person Households | 11 (4.1%) | 0 (0.0%) |
| 4-Person Households | 13 (4.9%) | 0 (0.0%) |
| 5-Person Households | 41 (15.4%) | 0 (0.0%) |
| 6-Person Households | 5 (1.9%) | 0 (0.0%) |
| 7+ Person Households | 0 (0.0%) | 0 (0.0%) |
| Total | 184 (69.2%) | 82 (30.8%) |
Female Fertility in Bay Shore
Fertility by Age in Bay Shore
| Age Bracket | Women with Births | Births / 1,000 Women |
| 15 to 19 years | 0 (0.0%) | 0.0 |
| 20 to 34 years | 0 (0.0%) | 0.0 |
| 35 to 50 years | 0 (0.0%) | 0.0 |
| Total | 0 (0.0%) | 0.0 |
Fertility by Age by Marriage Status in Bay Shore
| Age Bracket | Married | Unmarried |
| 15 to 19 years | 0 (0.0%) | 0 (0.0%) |
| 20 to 34 years | 0 (0.0%) | 0 (0.0%) |
| 35 to 50 years | 0 (0.0%) | 0 (0.0%) |
| Total | 0 (0.0%) | 0 (0.0%) |
Fertility by Education in Bay Shore
| Educational Attainment | Women with Births | Births / 1,000 Women |
| Less than High School | 0 (0.0%) | 0.0 |
| High School Diploma | 0 (0.0%) | 0.0 |
| College or Associate's Degree | 0 (0.0%) | 0.0 |
| Bachelor's Degree | 0 (0.0%) | 0.0 |
| Graduate Degree | 0 (0.0%) | 0.0 |
| Total | 0 (0.0%) | 0.0 |
Fertility by Education by Marriage Status in Bay Shore
| Educational Attainment | Married | Unmarried |
| Less than High School | 0 (0.0%) | 0 (0.0%) |
| High School Diploma | 0 (0.0%) | 0 (0.0%) |
| College or Associate's Degree | 0 (0.0%) | 0 (0.0%) |
| Bachelor's Degree | 0 (0.0%) | 0 (0.0%) |
| Graduate Degree | 0 (0.0%) | 0 (0.0%) |
| Total | 0 (0.0%) | 0 (0.0%) |
Employment Characteristics in Bay Shore
Employment by Class of Employer in Bay Shore
Among the 292 employed individuals in Bay Shore, private company employees (235 | 80.5%), self-employed (not incorporated) (21 | 7.2%), and local government employees (17 | 5.8%) make up the most common classes of employment.
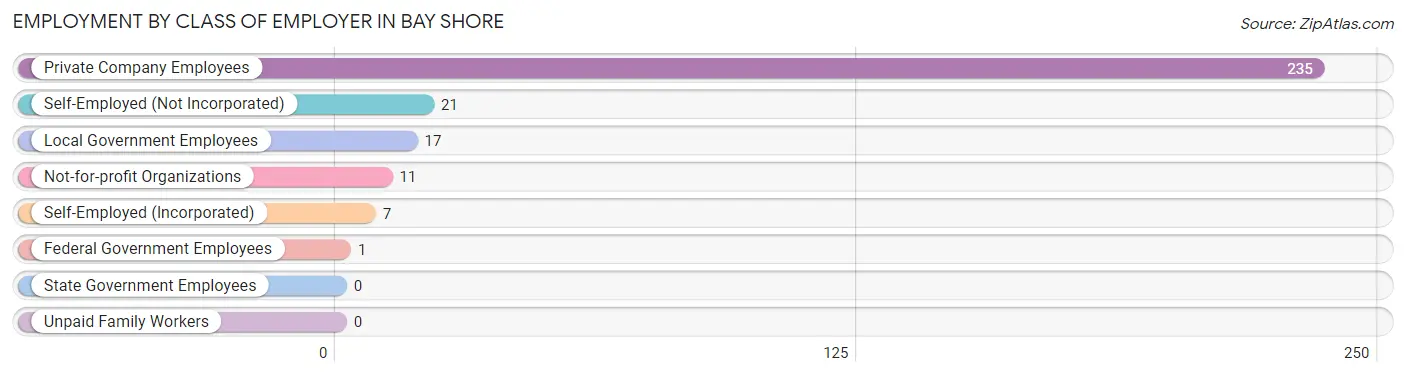
| Employer Class | # Employees | % Employees |
| Private Company Employees | 235 | 80.5% |
| Self-Employed (Incorporated) | 7 | 2.4% |
| Self-Employed (Not Incorporated) | 21 | 7.2% |
| Not-for-profit Organizations | 11 | 3.8% |
| Local Government Employees | 17 | 5.8% |
| State Government Employees | 0 | 0.0% |
| Federal Government Employees | 1 | 0.3% |
| Unpaid Family Workers | 0 | 0.0% |
| Total | 292 | 100.0% |
Employment Status by Age in Bay Shore
According to the labor force statistics for Bay Shore, out of the total population over 16 years of age (498), 61.0% or 304 individuals are in the labor force, with 2.3% or 7 of them unemployed. The age group with the highest labor force participation rate is 20 to 24 years, with 100.0% or 4 individuals in the labor force. Within the labor force, the 45 to 54 years age range has the highest percentage of unemployed individuals, with 5.2% or 7 of them being unemployed.
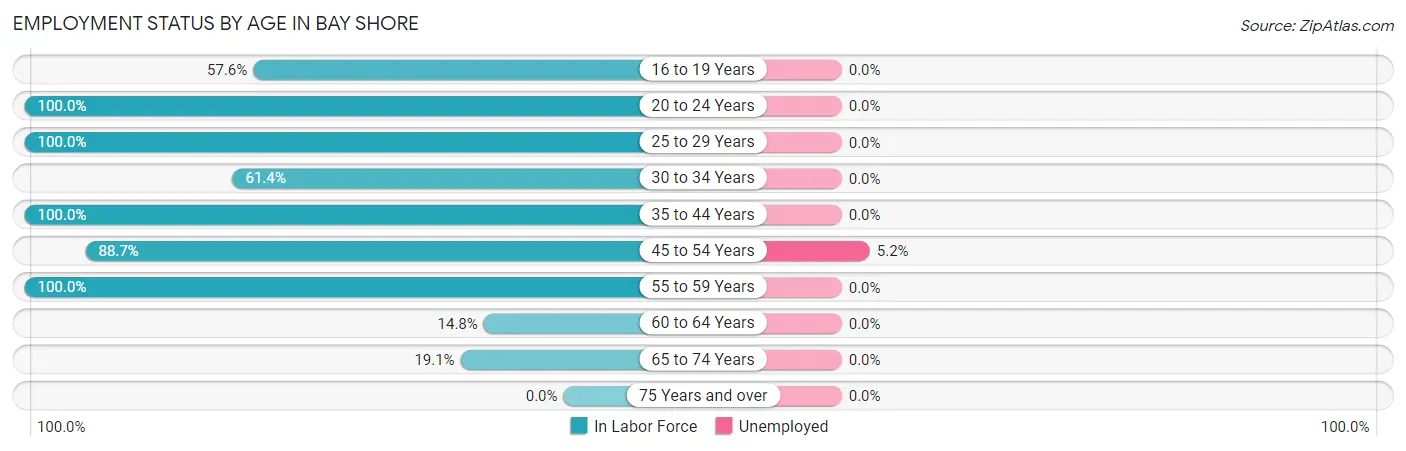
| Age Bracket | In Labor Force | Unemployed |
| 16 to 19 Years | 19 (57.6%) | 0 (0.0%) |
| 20 to 24 Years | 4 (100.0%) | 0 (0.0%) |
| 25 to 29 Years | 7 (100.0%) | 0 (0.0%) |
| 30 to 34 Years | 35 (61.4%) | 0 (0.0%) |
| 35 to 44 Years | 44 (100.0%) | 0 (0.0%) |
| 45 to 54 Years | 134 (88.7%) | 7 (5.2%) |
| 55 to 59 Years | 39 (100.0%) | 0 (0.0%) |
| 60 to 64 Years | 4 (14.8%) | 0 (0.0%) |
| 65 to 74 Years | 18 (19.1%) | 0 (0.0%) |
| 75 Years and over | 0 (0.0%) | 0 (0.0%) |
| Total | 304 (61.0%) | 7 (2.3%) |
Employment Status by Educational Attainment in Bay Shore
According to labor force statistics for Bay Shore, 80.9% of individuals (263) out of the total population between 25 and 64 years of age (325) are in the labor force, with 2.7% or 7 of them being unemployed. The group with the highest labor force participation rate are those with the educational attainment of bachelor's degree or higher, with 89.2% or 66 individuals in the labor force. Within the labor force, individuals with college / associate degree education have the highest percentage of unemployment, with 4.0% or 7 of them being unemployed.
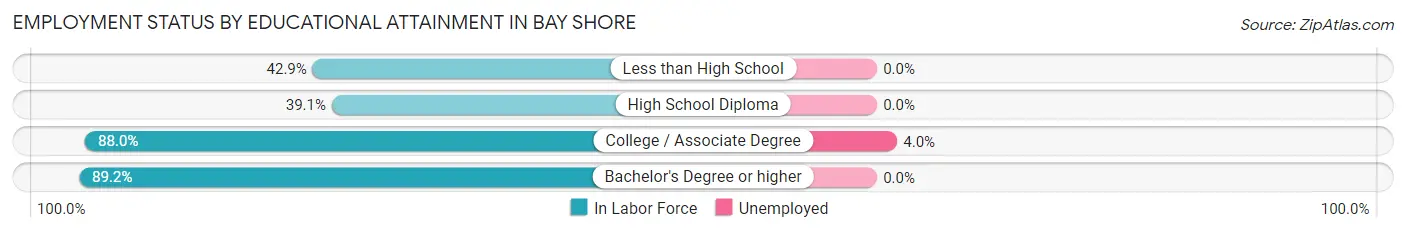
| Educational Attainment | In Labor Force | Unemployed |
| Less than High School | 12 (42.9%) | 0 (0.0%) |
| High School Diploma | 9 (39.1%) | 0 (0.0%) |
| College / Associate Degree | 176 (88.0%) | 8 (4.0%) |
| Bachelor's Degree or higher | 66 (89.2%) | 0 (0.0%) |
| Total | 263 (80.9%) | 9 (2.7%) |
Employment Occupations by Sex in Bay Shore
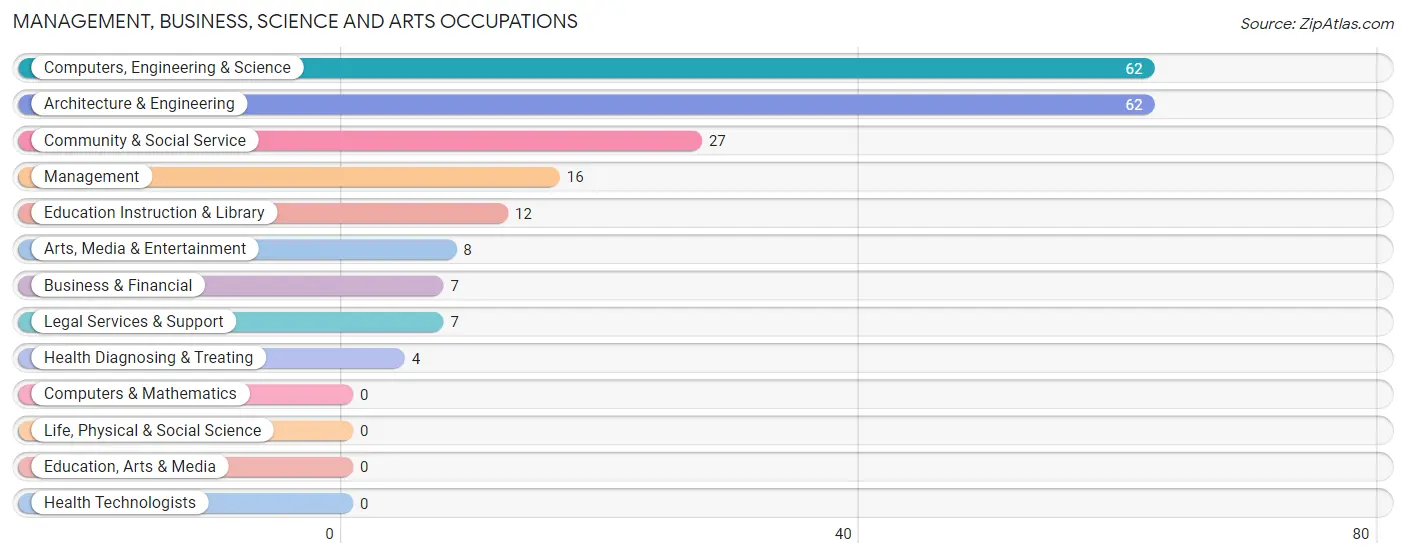
Management, Business, Science and Arts Occupations
The most common Management, Business, Science and Arts occupations in Bay Shore are Computers, Engineering & Science (62 | 20.9%), Architecture & Engineering (62 | 20.9%), Community & Social Service (27 | 9.1%), Management (16 | 5.4%), and Education Instruction & Library (12 | 4.0%).
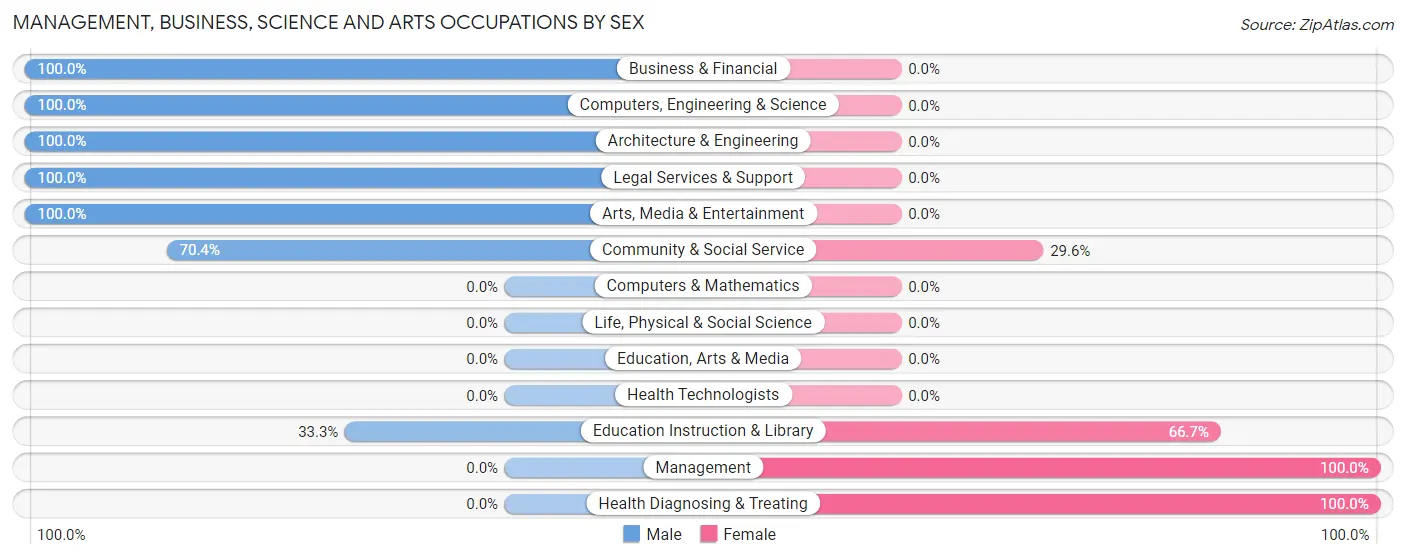
Management, Business, Science and Arts Occupations by Sex
Within the Management, Business, Science and Arts occupations in Bay Shore, the most male-oriented occupations are Business & Financial (100.0%), Computers, Engineering & Science (100.0%), and Architecture & Engineering (100.0%), while the most female-oriented occupations are Management (100.0%), Health Diagnosing & Treating (100.0%), and Education Instruction & Library (66.7%).
| Occupation | Male | Female |
| Management | 0 (0.0%) | 16 (100.0%) |
| Business & Financial | 7 (100.0%) | 0 (0.0%) |
| Computers, Engineering & Science | 62 (100.0%) | 0 (0.0%) |
| Computers & Mathematics | 0 (0.0%) | 0 (0.0%) |
| Architecture & Engineering | 62 (100.0%) | 0 (0.0%) |
| Life, Physical & Social Science | 0 (0.0%) | 0 (0.0%) |
| Community & Social Service | 19 (70.4%) | 8 (29.6%) |
| Education, Arts & Media | 0 (0.0%) | 0 (0.0%) |
| Legal Services & Support | 7 (100.0%) | 0 (0.0%) |
| Education Instruction & Library | 4 (33.3%) | 8 (66.7%) |
| Arts, Media & Entertainment | 8 (100.0%) | 0 (0.0%) |
| Health Diagnosing & Treating | 0 (0.0%) | 4 (100.0%) |
| Health Technologists | 0 (0.0%) | 0 (0.0%) |
| Total (Category) | 88 (75.9%) | 28 (24.1%) |
| Total (Overall) | 156 (52.5%) | 141 (47.5%) |
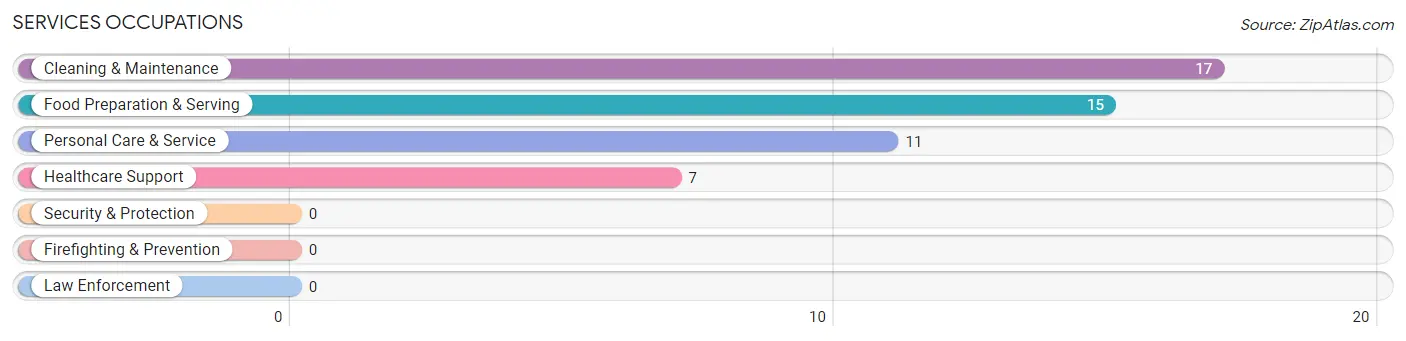
Services Occupations
The most common Services occupations in Bay Shore are Cleaning & Maintenance (17 | 5.7%), Food Preparation & Serving (15 | 5.1%), Personal Care & Service (11 | 3.7%), and Healthcare Support (7 | 2.4%).
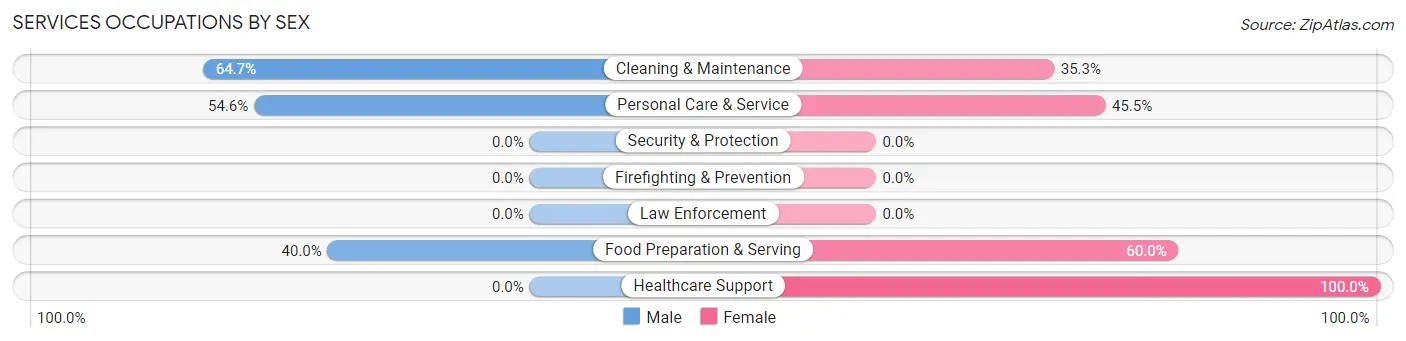
Services Occupations by Sex
Within the Services occupations in Bay Shore, the most male-oriented occupations are Cleaning & Maintenance (64.7%), Personal Care & Service (54.5%), and Food Preparation & Serving (40.0%), while the most female-oriented occupations are Healthcare Support (100.0%), Food Preparation & Serving (60.0%), and Personal Care & Service (45.5%).
| Occupation | Male | Female |
| Healthcare Support | 0 (0.0%) | 7 (100.0%) |
| Security & Protection | 0 (0.0%) | 0 (0.0%) |
| Firefighting & Prevention | 0 (0.0%) | 0 (0.0%) |
| Law Enforcement | 0 (0.0%) | 0 (0.0%) |
| Food Preparation & Serving | 6 (40.0%) | 9 (60.0%) |
| Cleaning & Maintenance | 11 (64.7%) | 6 (35.3%) |
| Personal Care & Service | 6 (54.5%) | 5 (45.5%) |
| Total (Category) | 23 (46.0%) | 27 (54.0%) |
| Total (Overall) | 156 (52.5%) | 141 (47.5%) |
Sales and Office Occupations
The most common Sales and Office occupations in Bay Shore are Office & Administration (46 | 15.5%), and Sales & Related (26 | 8.7%).
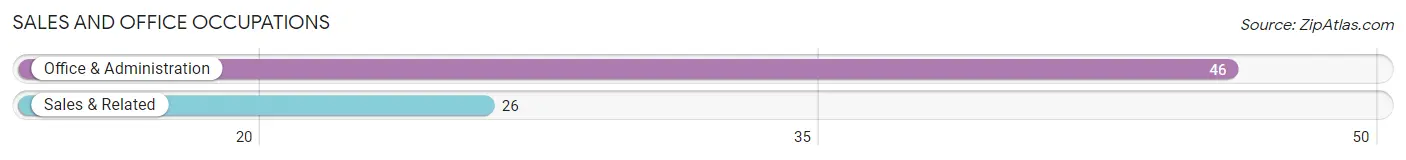
Sales and Office Occupations by Sex
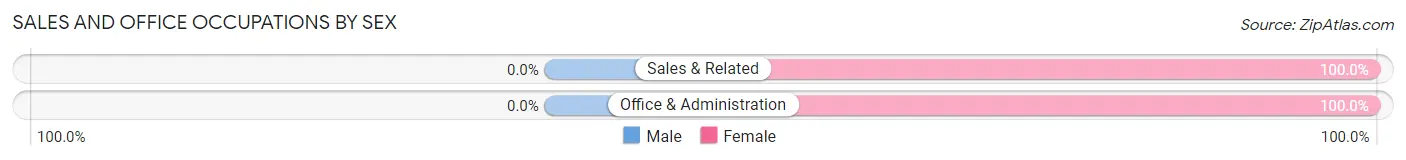
| Occupation | Male | Female |
| Sales & Related | 0 (0.0%) | 26 (100.0%) |
| Office & Administration | 0 (0.0%) | 46 (100.0%) |
| Total (Category) | 0 (0.0%) | 72 (100.0%) |
| Total (Overall) | 156 (52.5%) | 141 (47.5%) |
Natural Resources, Construction and Maintenance Occupations
The most common Natural Resources, Construction and Maintenance occupations in Bay Shore are , and Construction & Extraction (26 | 8.7%).
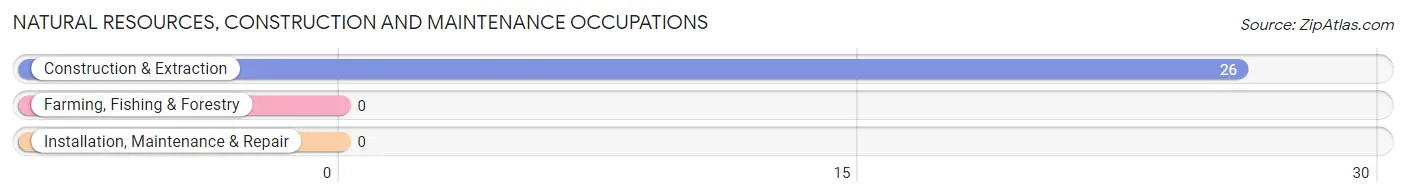
Natural Resources, Construction and Maintenance Occupations by Sex
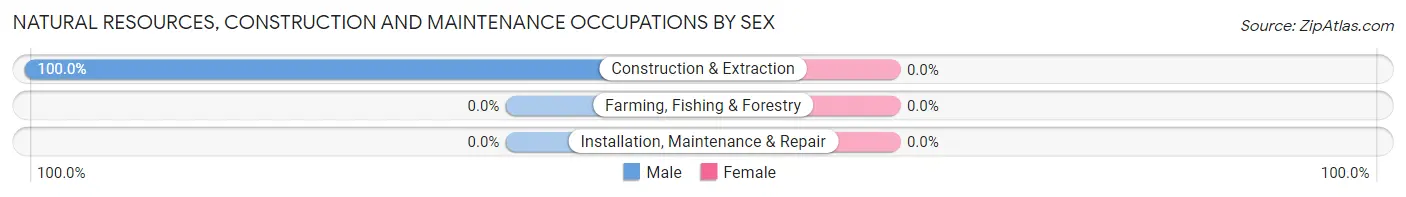
| Occupation | Male | Female |
| Farming, Fishing & Forestry | 0 (0.0%) | 0 (0.0%) |
| Construction & Extraction | 26 (100.0%) | 0 (0.0%) |
| Installation, Maintenance & Repair | 0 (0.0%) | 0 (0.0%) |
| Total (Category) | 26 (100.0%) | 0 (0.0%) |
| Total (Overall) | 156 (52.5%) | 141 (47.5%) |
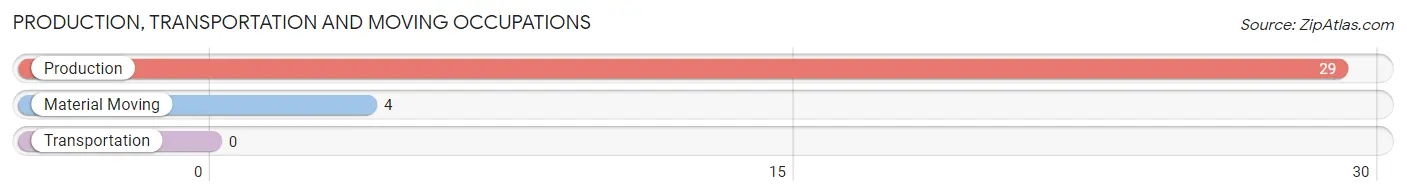
Production, Transportation and Moving Occupations
The most common Production, Transportation and Moving occupations in Bay Shore are Production (29 | 9.8%), and Material Moving (4 | 1.3%).
Production, Transportation and Moving Occupations by Sex
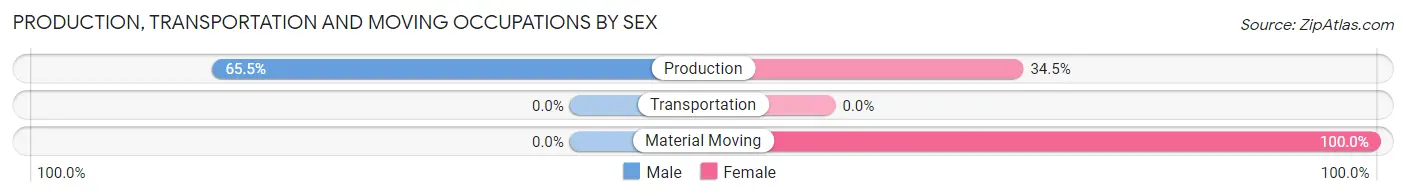
| Occupation | Male | Female |
| Production | 19 (65.5%) | 10 (34.5%) |
| Transportation | 0 (0.0%) | 0 (0.0%) |
| Material Moving | 0 (0.0%) | 4 (100.0%) |
| Total (Category) | 19 (57.6%) | 14 (42.4%) |
| Total (Overall) | 156 (52.5%) | 141 (47.5%) |
Employment Industries by Sex in Bay Shore
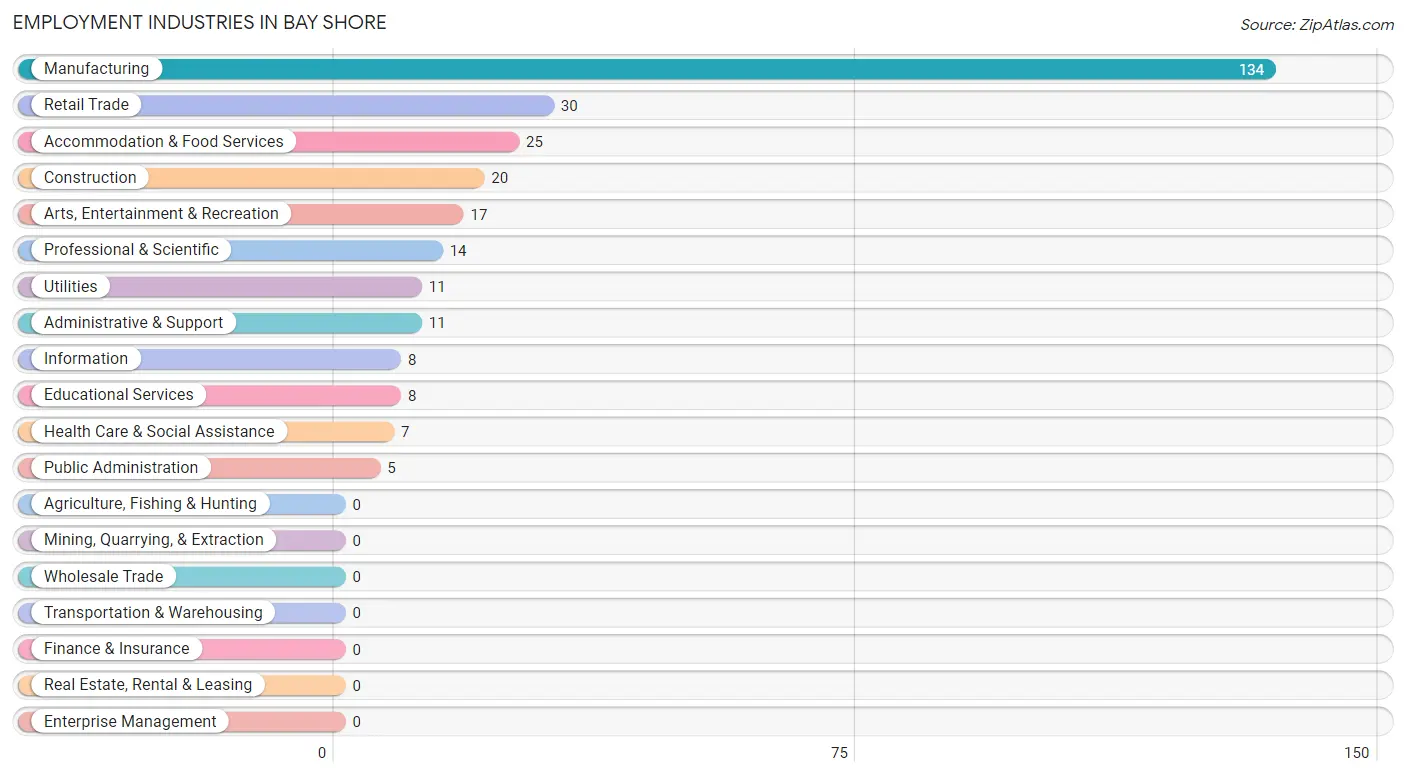
Employment Industries in Bay Shore
The major employment industries in Bay Shore include Manufacturing (134 | 45.1%), Retail Trade (30 | 10.1%), Accommodation & Food Services (25 | 8.4%), Construction (20 | 6.7%), and Arts, Entertainment & Recreation (17 | 5.7%).
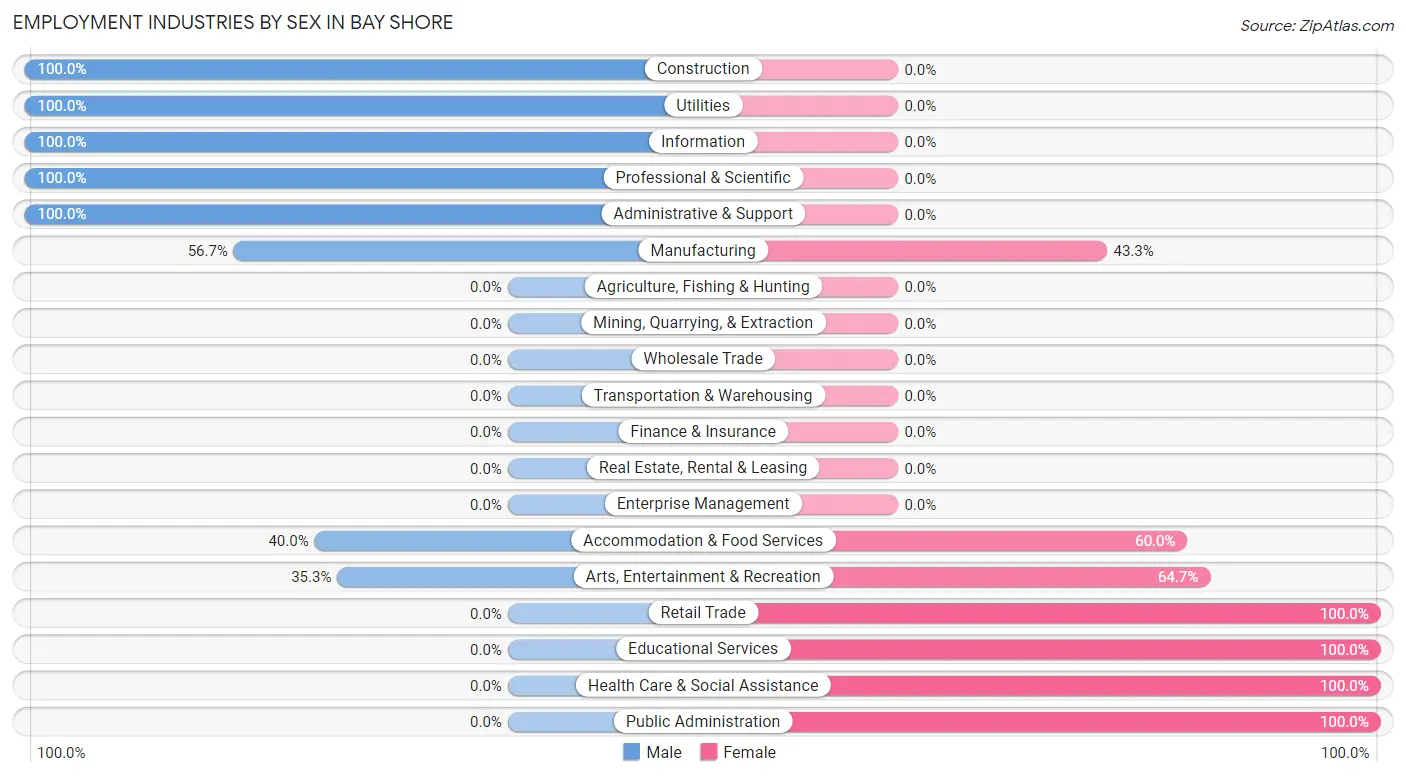
Employment Industries by Sex in Bay Shore
The Bay Shore industries that see more men than women are Construction (100.0%), Utilities (100.0%), and Information (100.0%), whereas the industries that tend to have a higher number of women are Retail Trade (100.0%), Educational Services (100.0%), and Health Care & Social Assistance (100.0%).
| Industry | Male | Female |
| Agriculture, Fishing & Hunting | 0 (0.0%) | 0 (0.0%) |
| Mining, Quarrying, & Extraction | 0 (0.0%) | 0 (0.0%) |
| Construction | 20 (100.0%) | 0 (0.0%) |
| Manufacturing | 76 (56.7%) | 58 (43.3%) |
| Wholesale Trade | 0 (0.0%) | 0 (0.0%) |
| Retail Trade | 0 (0.0%) | 30 (100.0%) |
| Transportation & Warehousing | 0 (0.0%) | 0 (0.0%) |
| Utilities | 11 (100.0%) | 0 (0.0%) |
| Information | 8 (100.0%) | 0 (0.0%) |
| Finance & Insurance | 0 (0.0%) | 0 (0.0%) |
| Real Estate, Rental & Leasing | 0 (0.0%) | 0 (0.0%) |
| Professional & Scientific | 14 (100.0%) | 0 (0.0%) |
| Enterprise Management | 0 (0.0%) | 0 (0.0%) |
| Administrative & Support | 11 (100.0%) | 0 (0.0%) |
| Educational Services | 0 (0.0%) | 8 (100.0%) |
| Health Care & Social Assistance | 0 (0.0%) | 7 (100.0%) |
| Arts, Entertainment & Recreation | 6 (35.3%) | 11 (64.7%) |
| Accommodation & Food Services | 10 (40.0%) | 15 (60.0%) |
| Public Administration | 0 (0.0%) | 5 (100.0%) |
| Total | 156 (52.5%) | 141 (47.5%) |
Education in Bay Shore
School Enrollment in Bay Shore
The most common levels of schooling among the 77 students in Bay Shore are high school (29 | 37.7%), college / undergraduate (20 | 26.0%), and middle school (17 | 22.1%).
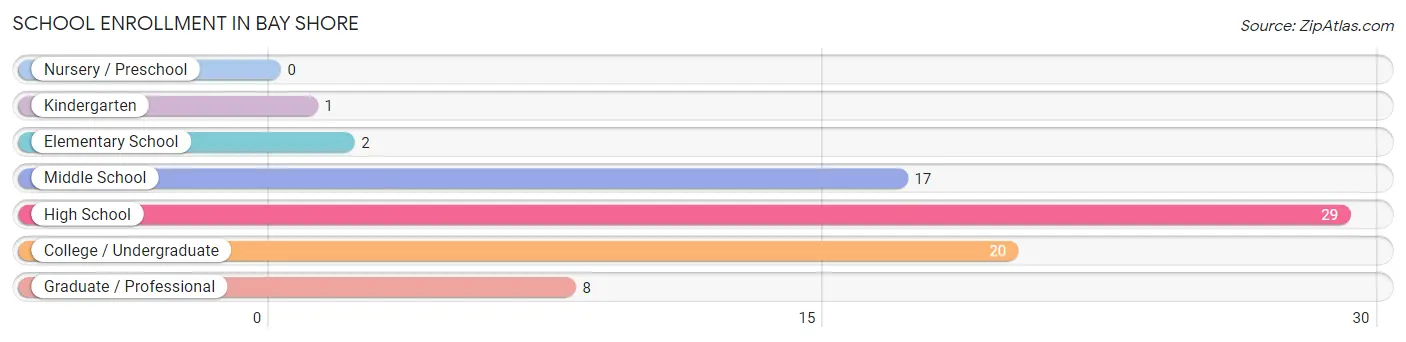
| School Level | # Students | % Students |
| Nursery / Preschool | 0 | 0.0% |
| Kindergarten | 1 | 1.3% |
| Elementary School | 2 | 2.6% |
| Middle School | 17 | 22.1% |
| High School | 29 | 37.7% |
| College / Undergraduate | 20 | 26.0% |
| Graduate / Professional | 8 | 10.4% |
| Total | 77 | 100.0% |
School Enrollment by Age by Funding Source in Bay Shore
Out of a total of 77 students who are enrolled in schools in Bay Shore, 7 (9.1%) attend a private institution, while the remaining 70 (90.9%) are enrolled in public schools. The age group of 25 to 34 year olds has the highest likelihood of being enrolled in private schools, with 7 (100.0% in the age bracket) enrolled. Conversely, the age group of 5 to 9 year old has the lowest likelihood of being enrolled in a private school, with 3 (100.0% in the age bracket) attending a public institution.
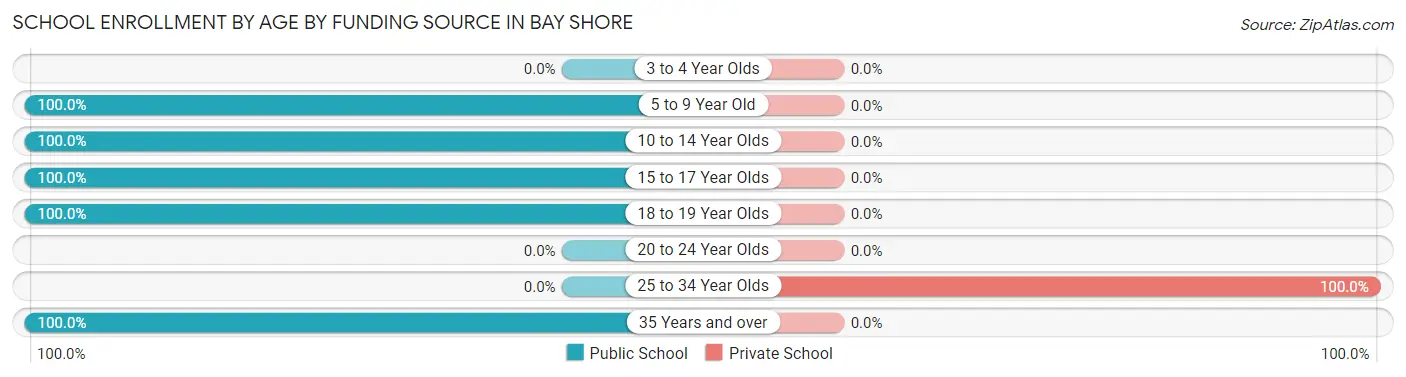
| Age Bracket | Public School | Private School |
| 3 to 4 Year Olds | 0 (0.0%) | 0 (0.0%) |
| 5 to 9 Year Old | 3 (100.0%) | 0 (0.0%) |
| 10 to 14 Year Olds | 23 (100.0%) | 0 (0.0%) |
| 15 to 17 Year Olds | 17 (100.0%) | 0 (0.0%) |
| 18 to 19 Year Olds | 16 (100.0%) | 0 (0.0%) |
| 20 to 24 Year Olds | 0 (0.0%) | 0 (0.0%) |
| 25 to 34 Year Olds | 0 (0.0%) | 7 (100.0%) |
| 35 Years and over | 11 (100.0%) | 0 (0.0%) |
| Total | 70 (90.9%) | 7 (9.1%) |
Educational Attainment by Field of Study in Bay Shore
Business (35 | 24.3%), education (31 | 21.5%), literature & languages (22 | 15.3%), social sciences (19 | 13.2%), and engineering (11 | 7.6%) are the most common fields of study among 144 individuals in Bay Shore who have obtained a bachelor's degree or higher.
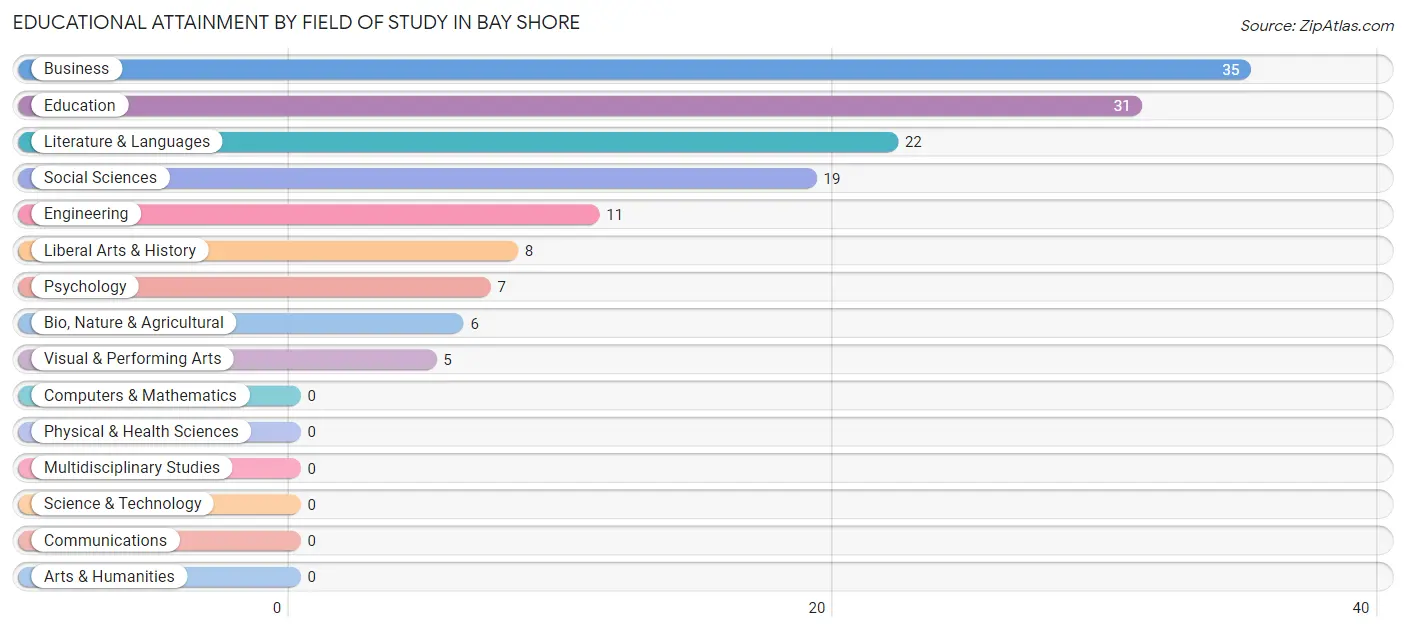
| Field of Study | # Graduates | % Graduates |
| Computers & Mathematics | 0 | 0.0% |
| Bio, Nature & Agricultural | 6 | 4.2% |
| Physical & Health Sciences | 0 | 0.0% |
| Psychology | 7 | 4.9% |
| Social Sciences | 19 | 13.2% |
| Engineering | 11 | 7.6% |
| Multidisciplinary Studies | 0 | 0.0% |
| Science & Technology | 0 | 0.0% |
| Business | 35 | 24.3% |
| Education | 31 | 21.5% |
| Literature & Languages | 22 | 15.3% |
| Liberal Arts & History | 8 | 5.6% |
| Visual & Performing Arts | 5 | 3.5% |
| Communications | 0 | 0.0% |
| Arts & Humanities | 0 | 0.0% |
| Total | 144 | 100.0% |
Transportation & Commute in Bay Shore
Vehicle Availability by Sex in Bay Shore
The most prevalent vehicle ownership categories in Bay Shore are males with 3 vehicles (82, accounting for 54.3%) and females with 3 vehicles (71, making up 58.2%).
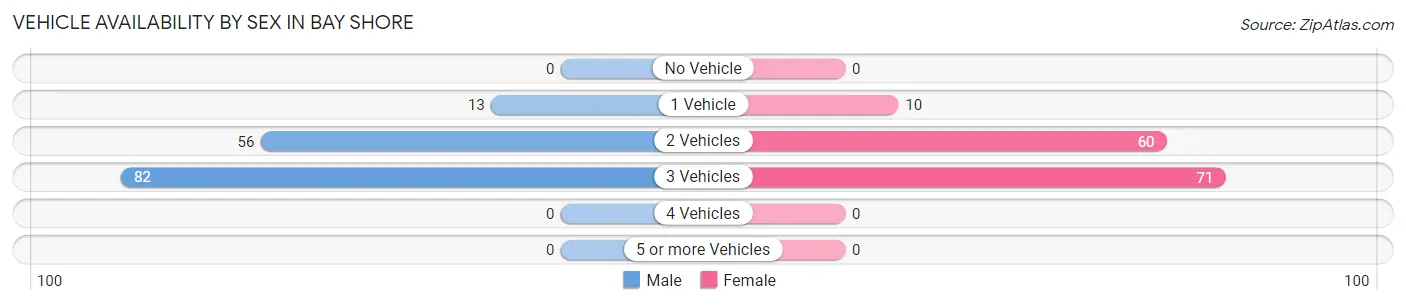
| Vehicles Available | Male | Female |
| No Vehicle | 0 (0.0%) | 0 (0.0%) |
| 1 Vehicle | 13 (8.6%) | 10 (7.1%) |
| 2 Vehicles | 56 (37.1%) | 60 (42.5%) |
| 3 Vehicles | 82 (54.3%) | 71 (50.3%) |
| 4 Vehicles | 0 (0.0%) | 0 (0.0%) |
| 5 or more Vehicles | 0 (0.0%) | 0 (0.0%) |
| Total | 151 (100.0%) | 141 (100.0%) |
Commute Time in Bay Shore
The most frequently occuring commute durations in Bay Shore are 10 to 14 minutes (146 commuters, 52.9%), 15 to 19 minutes (46 commuters, 16.7%), and 30 to 34 minutes (22 commuters, 8.0%).
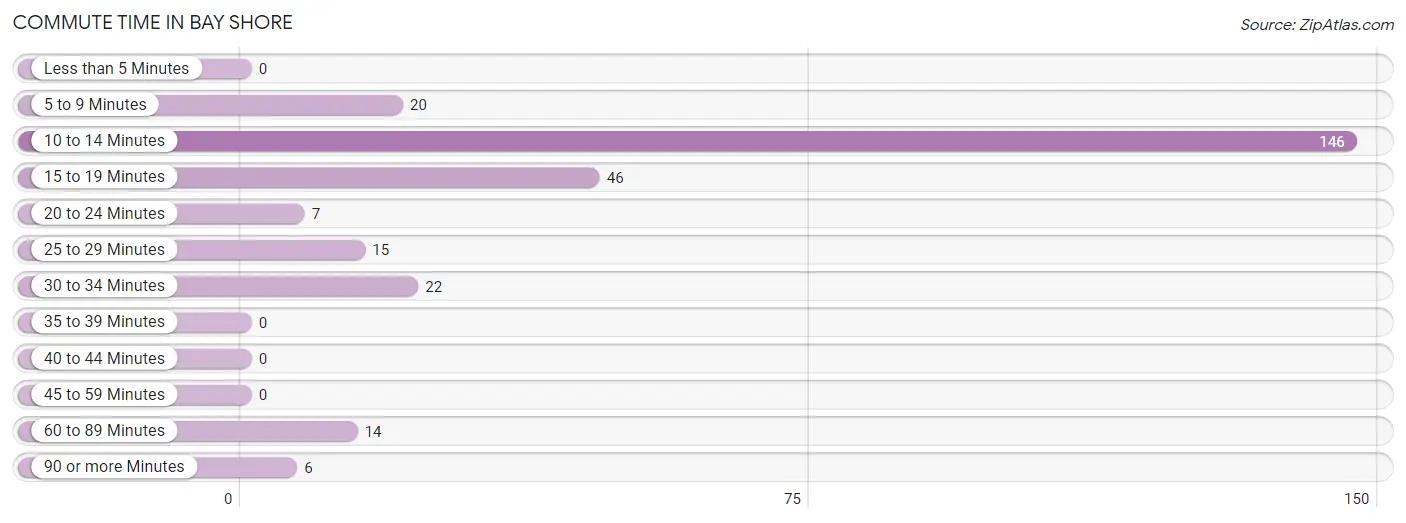
| Commute Time | # Commuters | % Commuters |
| Less than 5 Minutes | 0 | 0.0% |
| 5 to 9 Minutes | 20 | 7.2% |
| 10 to 14 Minutes | 146 | 52.9% |
| 15 to 19 Minutes | 46 | 16.7% |
| 20 to 24 Minutes | 7 | 2.5% |
| 25 to 29 Minutes | 15 | 5.4% |
| 30 to 34 Minutes | 22 | 8.0% |
| 35 to 39 Minutes | 0 | 0.0% |
| 40 to 44 Minutes | 0 | 0.0% |
| 45 to 59 Minutes | 0 | 0.0% |
| 60 to 89 Minutes | 14 | 5.1% |
| 90 or more Minutes | 6 | 2.2% |
Commute Time by Sex in Bay Shore
The most common commute times in Bay Shore are 10 to 14 minutes (73 commuters, 52.5%) for males and 10 to 14 minutes (73 commuters, 53.3%) for females.
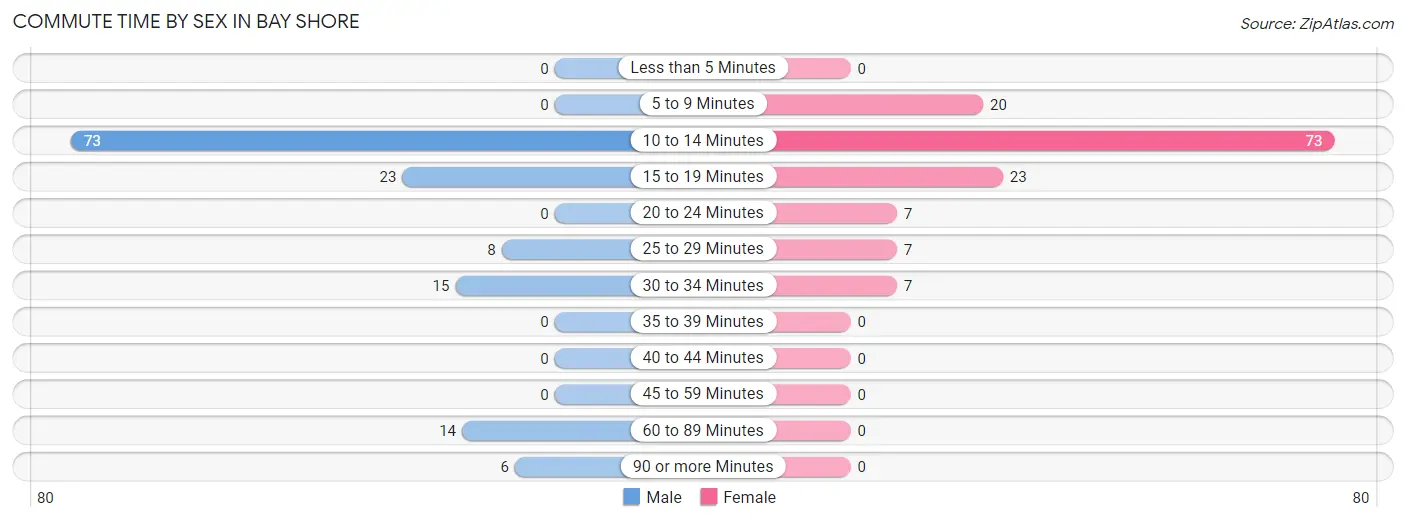
| Commute Time | Male | Female |
| Less than 5 Minutes | 0 (0.0%) | 0 (0.0%) |
| 5 to 9 Minutes | 0 (0.0%) | 20 (14.6%) |
| 10 to 14 Minutes | 73 (52.5%) | 73 (53.3%) |
| 15 to 19 Minutes | 23 (16.6%) | 23 (16.8%) |
| 20 to 24 Minutes | 0 (0.0%) | 7 (5.1%) |
| 25 to 29 Minutes | 8 (5.8%) | 7 (5.1%) |
| 30 to 34 Minutes | 15 (10.8%) | 7 (5.1%) |
| 35 to 39 Minutes | 0 (0.0%) | 0 (0.0%) |
| 40 to 44 Minutes | 0 (0.0%) | 0 (0.0%) |
| 45 to 59 Minutes | 0 (0.0%) | 0 (0.0%) |
| 60 to 89 Minutes | 14 (10.1%) | 0 (0.0%) |
| 90 or more Minutes | 6 (4.3%) | 0 (0.0%) |
Time of Departure to Work by Sex in Bay Shore
The most frequent times of departure to work in Bay Shore are 6:00 AM to 6:29 AM (55, 39.6%) for males and 6:00 AM to 6:29 AM (47, 34.3%) for females.
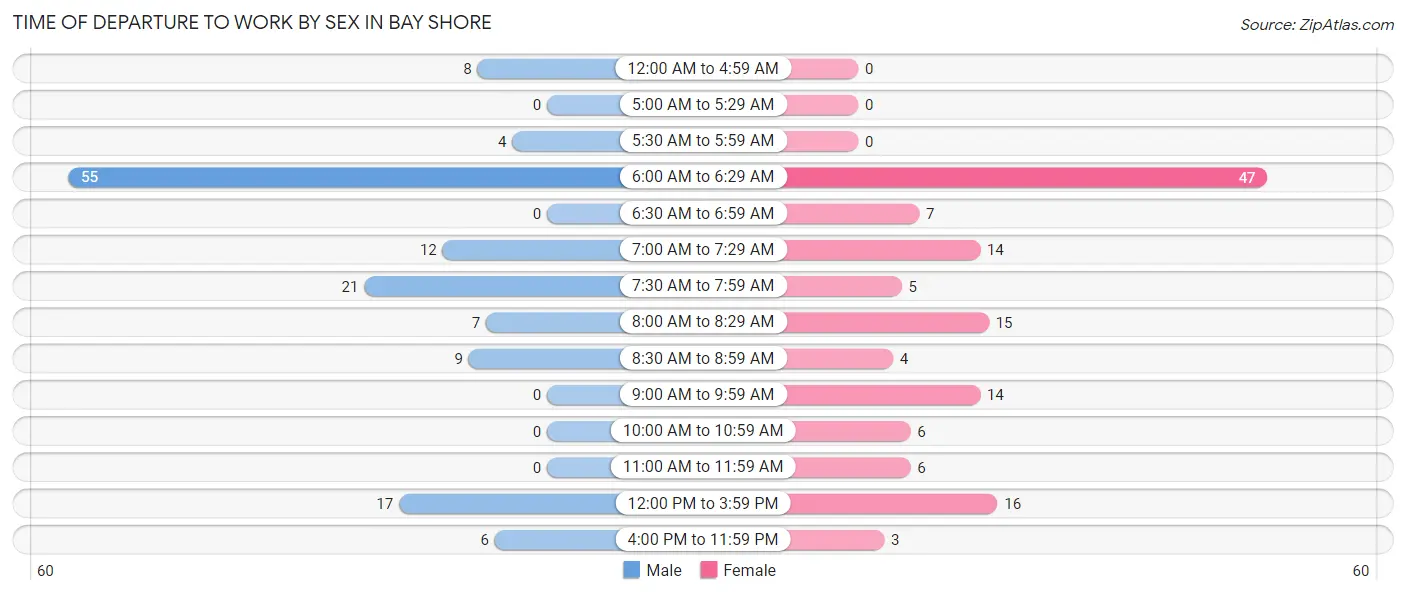
| Time of Departure | Male | Female |
| 12:00 AM to 4:59 AM | 8 (5.8%) | 0 (0.0%) |
| 5:00 AM to 5:29 AM | 0 (0.0%) | 0 (0.0%) |
| 5:30 AM to 5:59 AM | 4 (2.9%) | 0 (0.0%) |
| 6:00 AM to 6:29 AM | 55 (39.6%) | 47 (34.3%) |
| 6:30 AM to 6:59 AM | 0 (0.0%) | 7 (5.1%) |
| 7:00 AM to 7:29 AM | 12 (8.6%) | 14 (10.2%) |
| 7:30 AM to 7:59 AM | 21 (15.1%) | 5 (3.6%) |
| 8:00 AM to 8:29 AM | 7 (5.0%) | 15 (11.0%) |
| 8:30 AM to 8:59 AM | 9 (6.5%) | 4 (2.9%) |
| 9:00 AM to 9:59 AM | 0 (0.0%) | 14 (10.2%) |
| 10:00 AM to 10:59 AM | 0 (0.0%) | 6 (4.4%) |
| 11:00 AM to 11:59 AM | 0 (0.0%) | 6 (4.4%) |
| 12:00 PM to 3:59 PM | 17 (12.2%) | 16 (11.7%) |
| 4:00 PM to 11:59 PM | 6 (4.3%) | 3 (2.2%) |
| Total | 139 (100.0%) | 137 (100.0%) |
Housing Occupancy in Bay Shore
Occupancy by Ownership in Bay Shore
Of the total 266 dwellings in Bay Shore, owner-occupied units account for 244 (91.7%), while renter-occupied units make up 22 (8.3%).
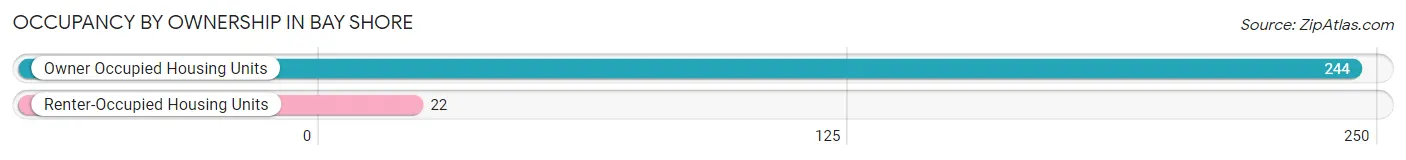
| Occupancy | # Housing Units | % Housing Units |
| Owner Occupied Housing Units | 244 | 91.7% |
| Renter-Occupied Housing Units | 22 | 8.3% |
| Total Occupied Housing Units | 266 | 100.0% |
Occupancy by Household Size in Bay Shore
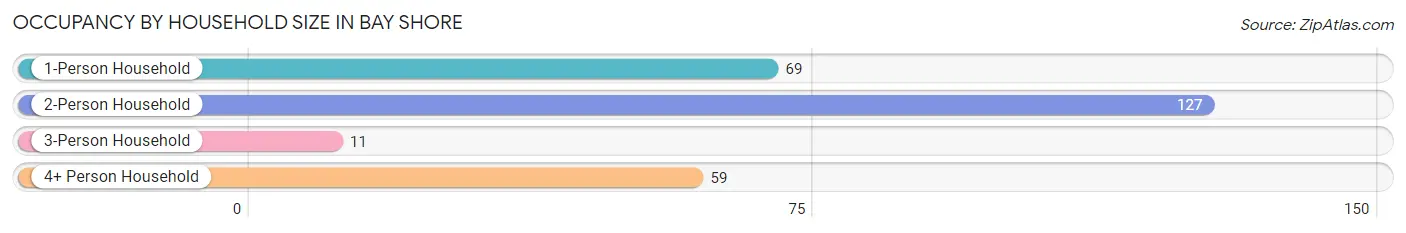
| Household Size | # Housing Units | % Housing Units |
| 1-Person Household | 69 | 25.9% |
| 2-Person Household | 127 | 47.7% |
| 3-Person Household | 11 | 4.1% |
| 4+ Person Household | 59 | 22.2% |
| Total Housing Units | 266 | 100.0% |
Occupancy by Ownership by Household Size in Bay Shore
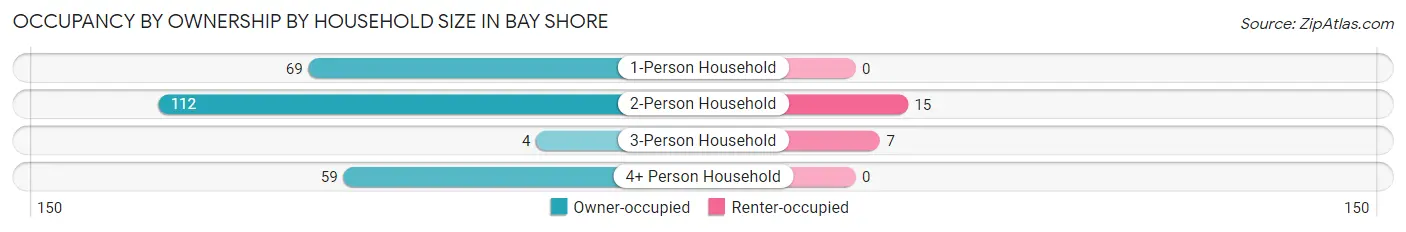
| Household Size | Owner-occupied | Renter-occupied |
| 1-Person Household | 69 (100.0%) | 0 (0.0%) |
| 2-Person Household | 112 (88.2%) | 15 (11.8%) |
| 3-Person Household | 4 (36.4%) | 7 (63.6%) |
| 4+ Person Household | 59 (100.0%) | 0 (0.0%) |
| Total Housing Units | 244 (91.7%) | 22 (8.3%) |
Occupancy by Educational Attainment in Bay Shore
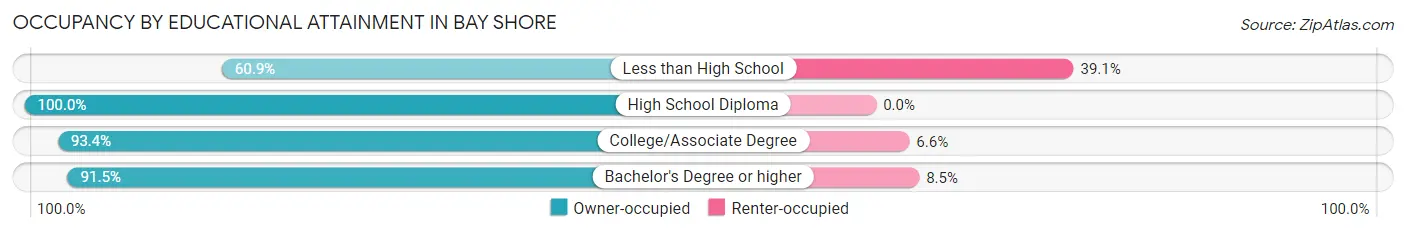
| Household Size | Owner-occupied | Renter-occupied |
| Less than High School | 14 (60.9%) | 9 (39.1%) |
| High School Diploma | 70 (100.0%) | 0 (0.0%) |
| College/Associate Degree | 85 (93.4%) | 6 (6.6%) |
| Bachelor's Degree or higher | 75 (91.5%) | 7 (8.5%) |
Occupancy by Age of Householder in Bay Shore
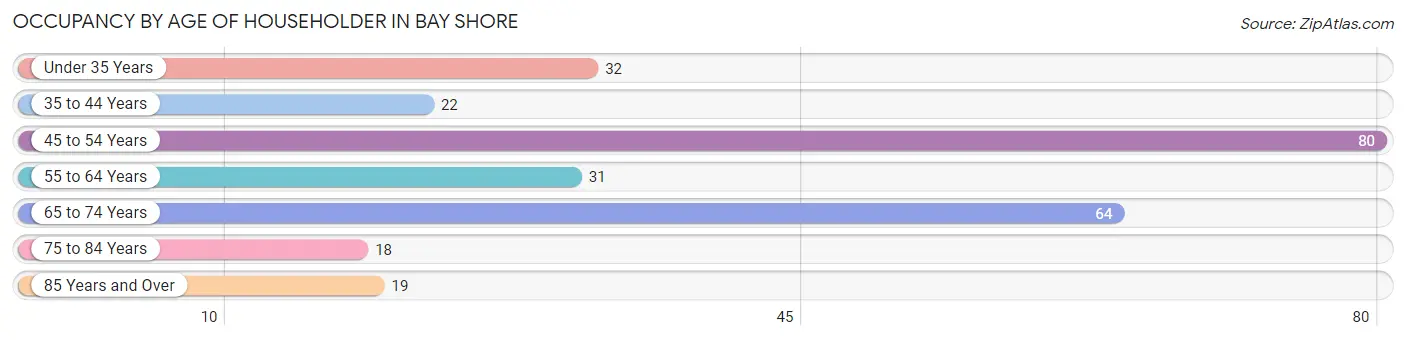
| Age Bracket | # Households | % Households |
| Under 35 Years | 32 | 12.0% |
| 35 to 44 Years | 22 | 8.3% |
| 45 to 54 Years | 80 | 30.1% |
| 55 to 64 Years | 31 | 11.7% |
| 65 to 74 Years | 64 | 24.1% |
| 75 to 84 Years | 18 | 6.8% |
| 85 Years and Over | 19 | 7.1% |
| Total | 266 | 100.0% |
Housing Finances in Bay Shore
Median Income by Occupancy in Bay Shore
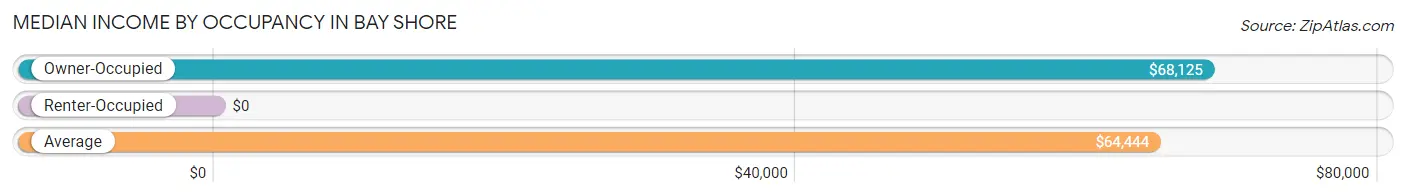
| Occupancy Type | # Households | Median Income |
| Owner-Occupied | 244 (91.7%) | $68,125 |
| Renter-Occupied | 22 (8.3%) | $0 |
| Average | 266 (100.0%) | $64,444 |
Occupancy by Householder Income Bracket in Bay Shore
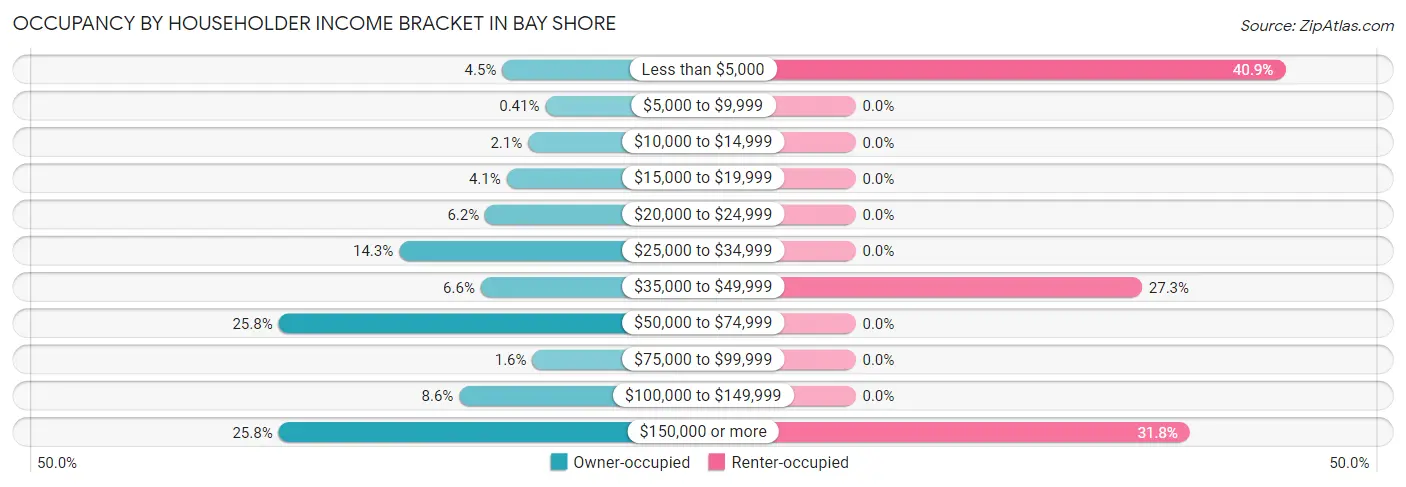
| Income Bracket | Owner-occupied | Renter-occupied |
| Less than $5,000 | 11 (4.5%) | 9 (40.9%) |
| $5,000 to $9,999 | 1 (0.4%) | 0 (0.0%) |
| $10,000 to $14,999 | 5 (2.1%) | 0 (0.0%) |
| $15,000 to $19,999 | 10 (4.1%) | 0 (0.0%) |
| $20,000 to $24,999 | 15 (6.1%) | 0 (0.0%) |
| $25,000 to $34,999 | 35 (14.3%) | 0 (0.0%) |
| $35,000 to $49,999 | 16 (6.6%) | 6 (27.3%) |
| $50,000 to $74,999 | 63 (25.8%) | 0 (0.0%) |
| $75,000 to $99,999 | 4 (1.6%) | 0 (0.0%) |
| $100,000 to $149,999 | 21 (8.6%) | 0 (0.0%) |
| $150,000 or more | 63 (25.8%) | 7 (31.8%) |
| Total | 244 (100.0%) | 22 (100.0%) |
Monthly Housing Cost Tiers in Bay Shore
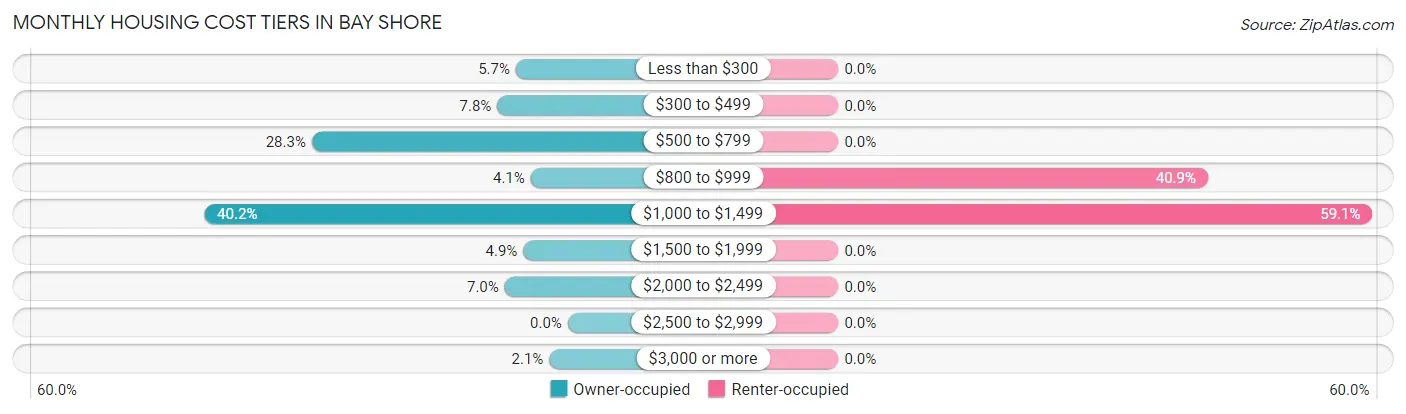
| Monthly Cost | Owner-occupied | Renter-occupied |
| Less than $300 | 14 (5.7%) | 0 (0.0%) |
| $300 to $499 | 19 (7.8%) | 0 (0.0%) |
| $500 to $799 | 69 (28.3%) | 0 (0.0%) |
| $800 to $999 | 10 (4.1%) | 9 (40.9%) |
| $1,000 to $1,499 | 98 (40.2%) | 13 (59.1%) |
| $1,500 to $1,999 | 12 (4.9%) | 0 (0.0%) |
| $2,000 to $2,499 | 17 (7.0%) | 0 (0.0%) |
| $2,500 to $2,999 | 0 (0.0%) | 0 (0.0%) |
| $3,000 or more | 5 (2.1%) | 0 (0.0%) |
| Total | 244 (100.0%) | 22 (100.0%) |
Physical Housing Characteristics in Bay Shore
Housing Structures in Bay Shore
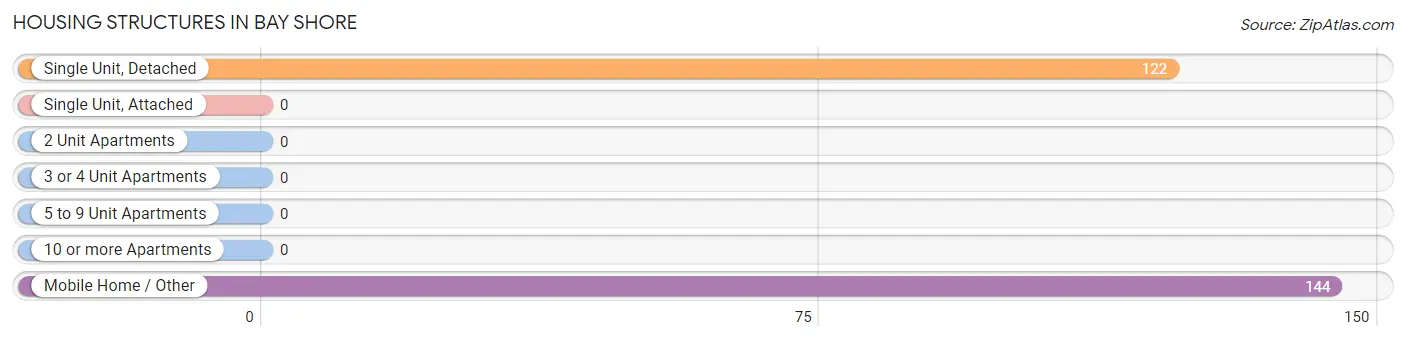
| Structure Type | # Housing Units | % Housing Units |
| Single Unit, Detached | 122 | 45.9% |
| Single Unit, Attached | 0 | 0.0% |
| 2 Unit Apartments | 0 | 0.0% |
| 3 or 4 Unit Apartments | 0 | 0.0% |
| 5 to 9 Unit Apartments | 0 | 0.0% |
| 10 or more Apartments | 0 | 0.0% |
| Mobile Home / Other | 144 | 54.1% |
| Total | 266 | 100.0% |
Housing Structures by Occupancy in Bay Shore
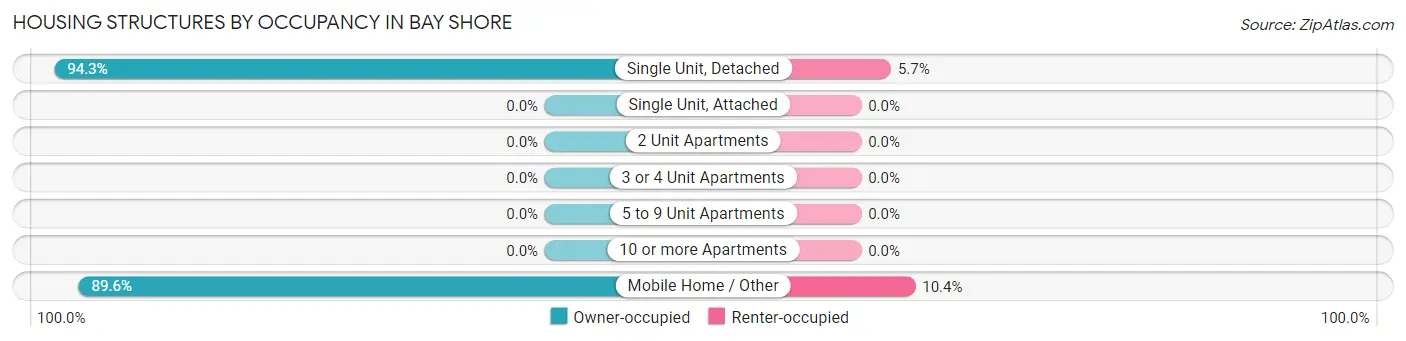
| Structure Type | Owner-occupied | Renter-occupied |
| Single Unit, Detached | 115 (94.3%) | 7 (5.7%) |
| Single Unit, Attached | 0 (0.0%) | 0 (0.0%) |
| 2 Unit Apartments | 0 (0.0%) | 0 (0.0%) |
| 3 or 4 Unit Apartments | 0 (0.0%) | 0 (0.0%) |
| 5 to 9 Unit Apartments | 0 (0.0%) | 0 (0.0%) |
| 10 or more Apartments | 0 (0.0%) | 0 (0.0%) |
| Mobile Home / Other | 129 (89.6%) | 15 (10.4%) |
| Total | 244 (91.7%) | 22 (8.3%) |
Housing Structures by Number of Rooms in Bay Shore
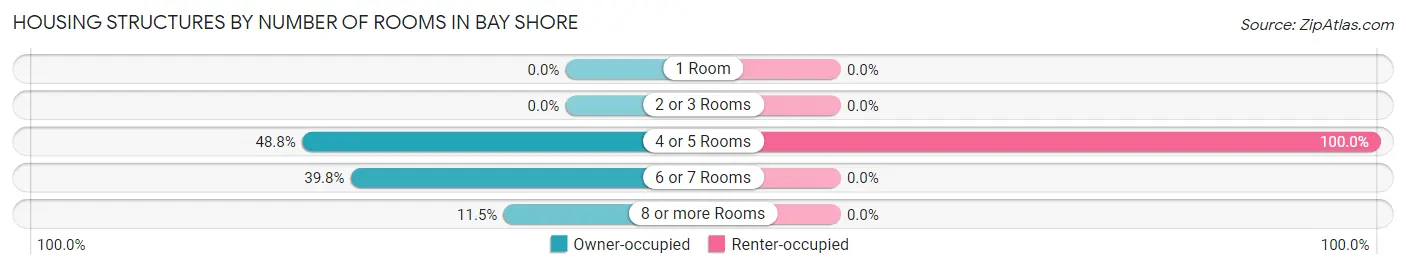
| Number of Rooms | Owner-occupied | Renter-occupied |
| 1 Room | 0 (0.0%) | 0 (0.0%) |
| 2 or 3 Rooms | 0 (0.0%) | 0 (0.0%) |
| 4 or 5 Rooms | 119 (48.8%) | 22 (100.0%) |
| 6 or 7 Rooms | 97 (39.8%) | 0 (0.0%) |
| 8 or more Rooms | 28 (11.5%) | 0 (0.0%) |
| Total | 244 (100.0%) | 22 (100.0%) |
Housing Structure by Heating Type in Bay Shore
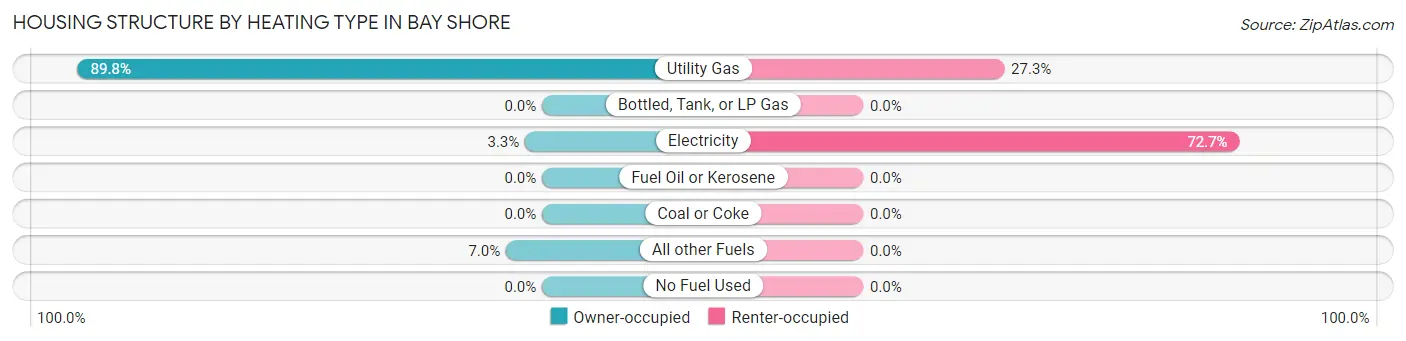
| Heating Type | Owner-occupied | Renter-occupied |
| Utility Gas | 219 (89.7%) | 6 (27.3%) |
| Bottled, Tank, or LP Gas | 0 (0.0%) | 0 (0.0%) |
| Electricity | 8 (3.3%) | 16 (72.7%) |
| Fuel Oil or Kerosene | 0 (0.0%) | 0 (0.0%) |
| Coal or Coke | 0 (0.0%) | 0 (0.0%) |
| All other Fuels | 17 (7.0%) | 0 (0.0%) |
| No Fuel Used | 0 (0.0%) | 0 (0.0%) |
| Total | 244 (100.0%) | 22 (100.0%) |
Household Vehicle Usage in Bay Shore
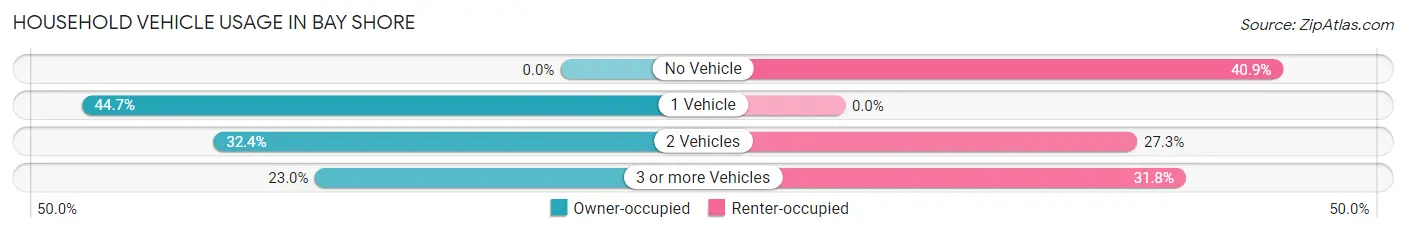
| Vehicles per Household | Owner-occupied | Renter-occupied |
| No Vehicle | 0 (0.0%) | 9 (40.9%) |
| 1 Vehicle | 109 (44.7%) | 0 (0.0%) |
| 2 Vehicles | 79 (32.4%) | 6 (27.3%) |
| 3 or more Vehicles | 56 (23.0%) | 7 (31.8%) |
| Total | 244 (100.0%) | 22 (100.0%) |
Real Estate & Mortgages in Bay Shore
Real Estate and Mortgage Overview in Bay Shore
| Characteristic | Without Mortgage | With Mortgage |
| Housing Units | 87 | 157 |
| Median Property Value | - | - |
| Median Household Income | - | - |
| Monthly Housing Costs | $536 | $5 |
| Real Estate Taxes | - | - |
Property Value by Mortgage Status in Bay Shore
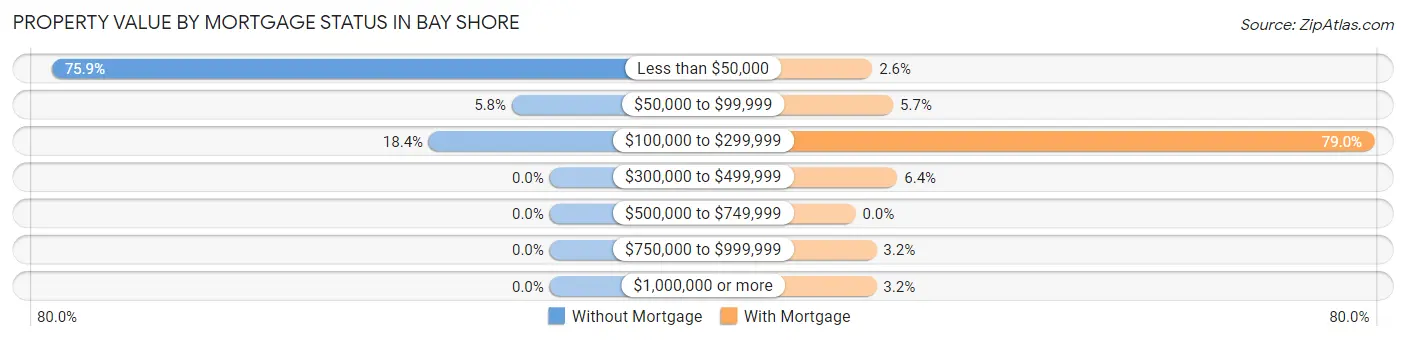
| Property Value | Without Mortgage | With Mortgage |
| Less than $50,000 | 66 (75.9%) | 4 (2.5%) |
| $50,000 to $99,999 | 5 (5.8%) | 9 (5.7%) |
| $100,000 to $299,999 | 16 (18.4%) | 124 (79.0%) |
| $300,000 to $499,999 | 0 (0.0%) | 10 (6.4%) |
| $500,000 to $749,999 | 0 (0.0%) | 0 (0.0%) |
| $750,000 to $999,999 | 0 (0.0%) | 5 (3.2%) |
| $1,000,000 or more | 0 (0.0%) | 5 (3.2%) |
| Total | 87 (100.0%) | 157 (100.0%) |
Household Income by Mortgage Status in Bay Shore
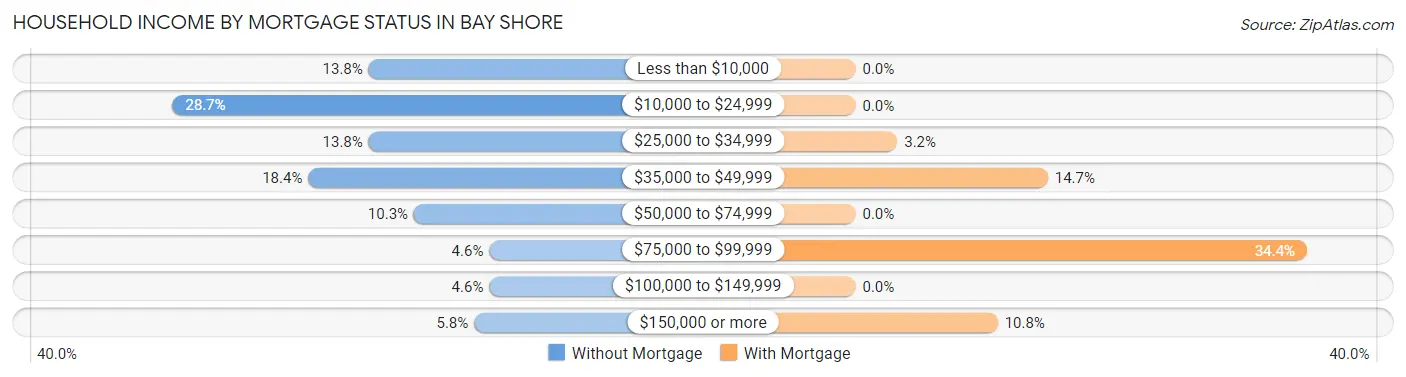
| Household Income | Without Mortgage | With Mortgage |
| Less than $10,000 | 12 (13.8%) | 0 (0.0%) |
| $10,000 to $24,999 | 25 (28.7%) | 0 (0.0%) |
| $25,000 to $34,999 | 12 (13.8%) | 5 (3.2%) |
| $35,000 to $49,999 | 16 (18.4%) | 23 (14.6%) |
| $50,000 to $74,999 | 9 (10.3%) | 0 (0.0%) |
| $75,000 to $99,999 | 4 (4.6%) | 54 (34.4%) |
| $100,000 to $149,999 | 4 (4.6%) | 0 (0.0%) |
| $150,000 or more | 5 (5.8%) | 17 (10.8%) |
| Total | 87 (100.0%) | 157 (100.0%) |
Property Value to Household Income Ratio in Bay Shore
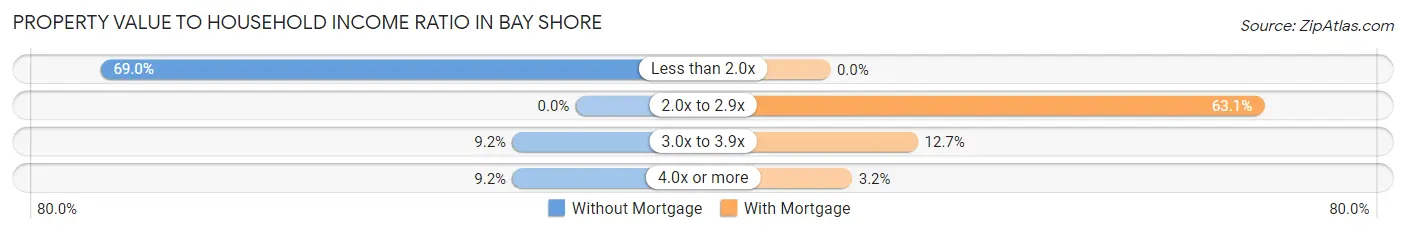
| Value-to-Income Ratio | Without Mortgage | With Mortgage |
| Less than 2.0x | 60 (69.0%) | 0 (0.0%) |
| 2.0x to 2.9x | 0 (0.0%) | 99 (63.1%) |
| 3.0x to 3.9x | 8 (9.2%) | 20 (12.7%) |
| 4.0x or more | 8 (9.2%) | 5 (3.2%) |
| Total | 87 (100.0%) | 157 (100.0%) |
Real Estate Taxes by Mortgage Status in Bay Shore
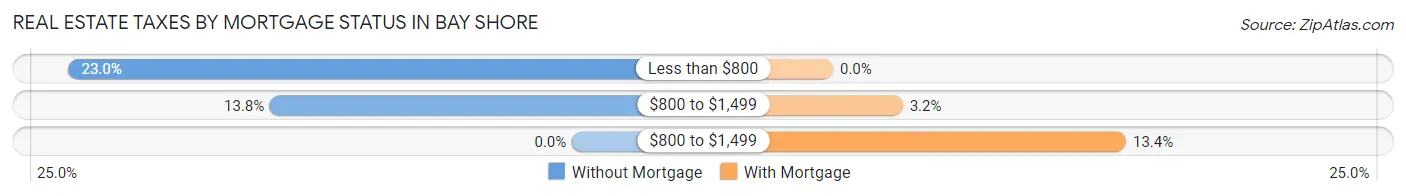
| Property Taxes | Without Mortgage | With Mortgage |
| Less than $800 | 20 (23.0%) | 0 (0.0%) |
| $800 to $1,499 | 12 (13.8%) | 5 (3.2%) |
| $800 to $1,499 | 0 (0.0%) | 21 (13.4%) |
| Total | 87 (100.0%) | 157 (100.0%) |
Health & Disability in Bay Shore
Health Insurance Coverage by Age in Bay Shore
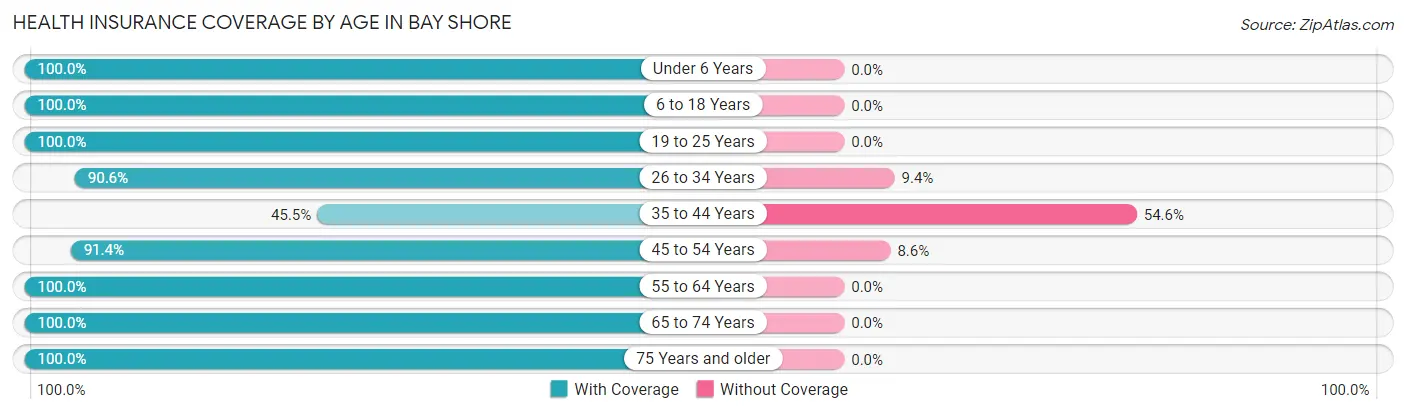
| Age Bracket | With Coverage | Without Coverage |
| Under 6 Years | 9 (100.0%) | 0 (0.0%) |
| 6 to 18 Years | 55 (100.0%) | 0 (0.0%) |
| 19 to 25 Years | 8 (100.0%) | 0 (0.0%) |
| 26 to 34 Years | 58 (90.6%) | 6 (9.4%) |
| 35 to 44 Years | 20 (45.5%) | 24 (54.5%) |
| 45 to 54 Years | 138 (91.4%) | 13 (8.6%) |
| 55 to 64 Years | 66 (100.0%) | 0 (0.0%) |
| 65 to 74 Years | 94 (100.0%) | 0 (0.0%) |
| 75 Years and older | 42 (100.0%) | 0 (0.0%) |
| Total | 490 (91.9%) | 43 (8.1%) |
Health Insurance Coverage by Citizenship Status in Bay Shore
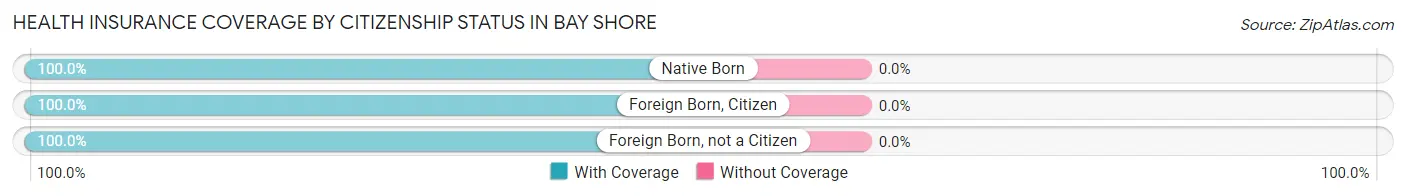
| Citizenship Status | With Coverage | Without Coverage |
| Native Born | 9 (100.0%) | 0 (0.0%) |
| Foreign Born, Citizen | 55 (100.0%) | 0 (0.0%) |
| Foreign Born, not a Citizen | 8 (100.0%) | 0 (0.0%) |
Health Insurance Coverage by Household Income in Bay Shore
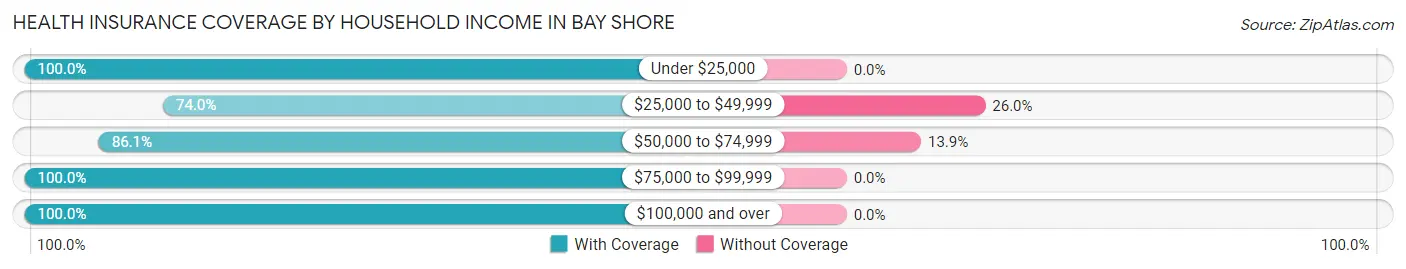
| Household Income | With Coverage | Without Coverage |
| Under $25,000 | 63 (100.0%) | 0 (0.0%) |
| $25,000 to $49,999 | 77 (74.0%) | 27 (26.0%) |
| $50,000 to $74,999 | 99 (86.1%) | 16 (13.9%) |
| $75,000 to $99,999 | 4 (100.0%) | 0 (0.0%) |
| $100,000 and over | 247 (100.0%) | 0 (0.0%) |
Public vs Private Health Insurance Coverage by Age in Bay Shore
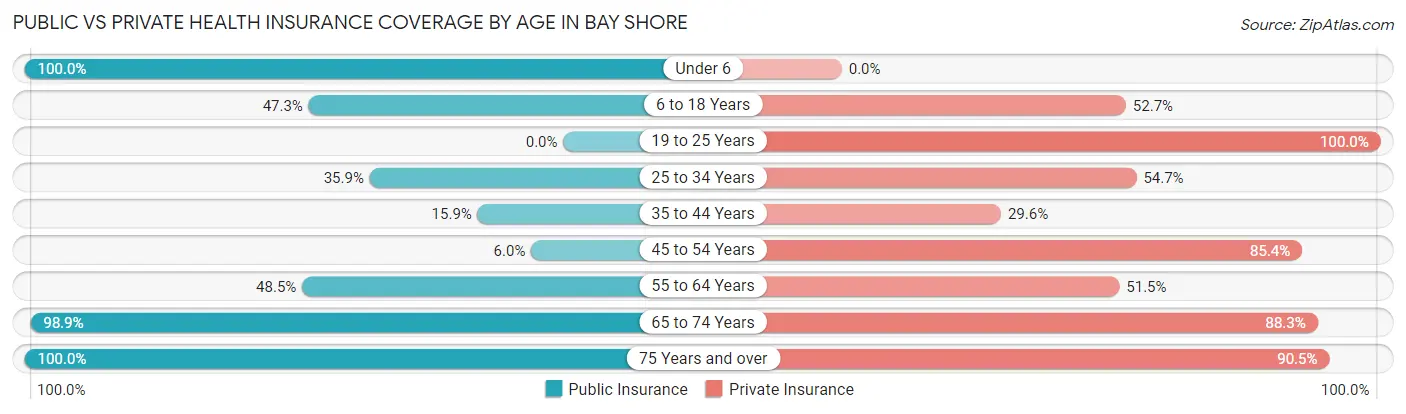
| Age Bracket | Public Insurance | Private Insurance |
| Under 6 | 9 (100.0%) | 0 (0.0%) |
| 6 to 18 Years | 26 (47.3%) | 29 (52.7%) |
| 19 to 25 Years | 0 (0.0%) | 8 (100.0%) |
| 25 to 34 Years | 23 (35.9%) | 35 (54.7%) |
| 35 to 44 Years | 7 (15.9%) | 13 (29.5%) |
| 45 to 54 Years | 9 (6.0%) | 129 (85.4%) |
| 55 to 64 Years | 32 (48.5%) | 34 (51.5%) |
| 65 to 74 Years | 93 (98.9%) | 83 (88.3%) |
| 75 Years and over | 42 (100.0%) | 38 (90.5%) |
| Total | 241 (45.2%) | 369 (69.2%) |
Disability Status by Sex by Age in Bay Shore
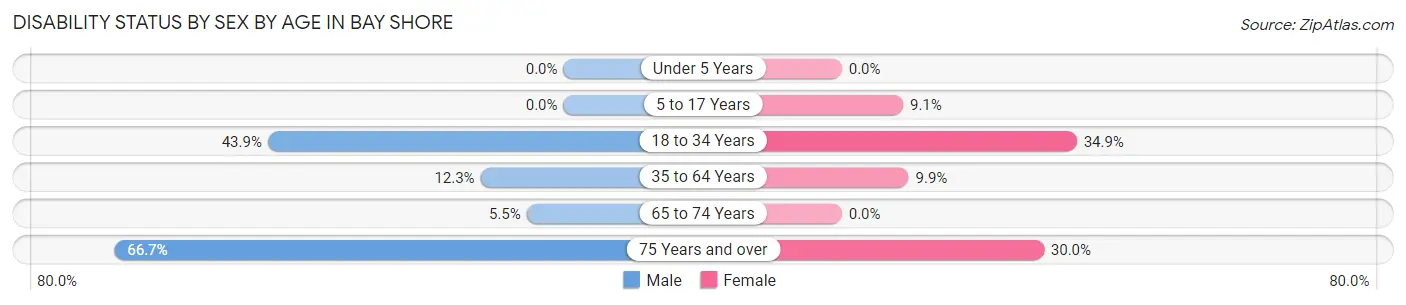
| Age Bracket | Male | Female |
| Under 5 Years | 0 (0.0%) | 0 (0.0%) |
| 5 to 17 Years | 0 (0.0%) | 3 (9.1%) |
| 18 to 34 Years | 18 (43.9%) | 15 (34.9%) |
| 35 to 64 Years | 16 (12.3%) | 13 (9.9%) |
| 65 to 74 Years | 3 (5.4%) | 0 (0.0%) |
| 75 Years and over | 8 (66.7%) | 9 (30.0%) |
Disability Class by Sex by Age in Bay Shore
Disability Class: Hearing Difficulty
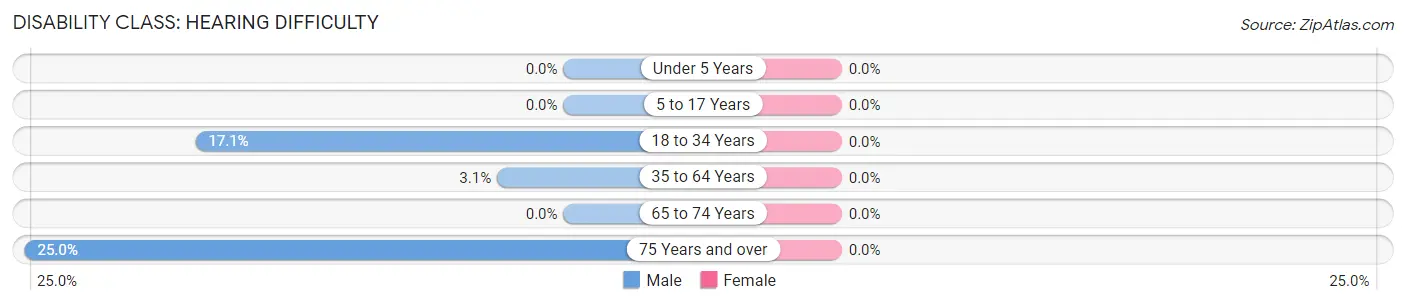
| Age Bracket | Male | Female |
| Under 5 Years | 0 (0.0%) | 0 (0.0%) |
| 5 to 17 Years | 0 (0.0%) | 0 (0.0%) |
| 18 to 34 Years | 7 (17.1%) | 0 (0.0%) |
| 35 to 64 Years | 4 (3.1%) | 0 (0.0%) |
| 65 to 74 Years | 0 (0.0%) | 0 (0.0%) |
| 75 Years and over | 3 (25.0%) | 0 (0.0%) |
Disability Class: Vision Difficulty
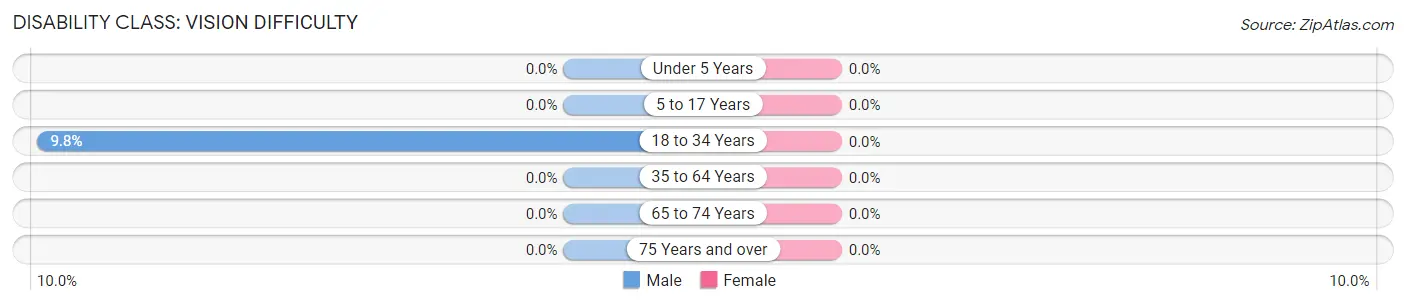
| Age Bracket | Male | Female |
| Under 5 Years | 0 (0.0%) | 0 (0.0%) |
| 5 to 17 Years | 0 (0.0%) | 0 (0.0%) |
| 18 to 34 Years | 4 (9.8%) | 0 (0.0%) |
| 35 to 64 Years | 0 (0.0%) | 0 (0.0%) |
| 65 to 74 Years | 0 (0.0%) | 0 (0.0%) |
| 75 Years and over | 0 (0.0%) | 0 (0.0%) |
Disability Class: Cognitive Difficulty
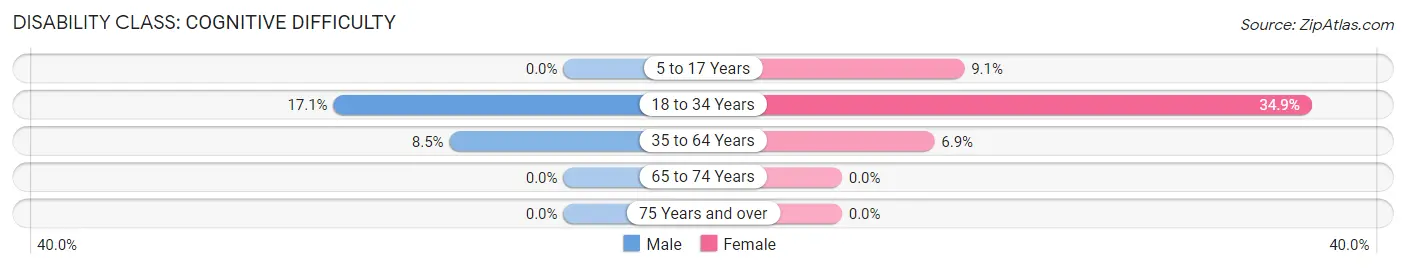
| Age Bracket | Male | Female |
| 5 to 17 Years | 0 (0.0%) | 3 (9.1%) |
| 18 to 34 Years | 7 (17.1%) | 15 (34.9%) |
| 35 to 64 Years | 11 (8.5%) | 9 (6.9%) |
| 65 to 74 Years | 0 (0.0%) | 0 (0.0%) |
| 75 Years and over | 0 (0.0%) | 0 (0.0%) |
Disability Class: Ambulatory Difficulty
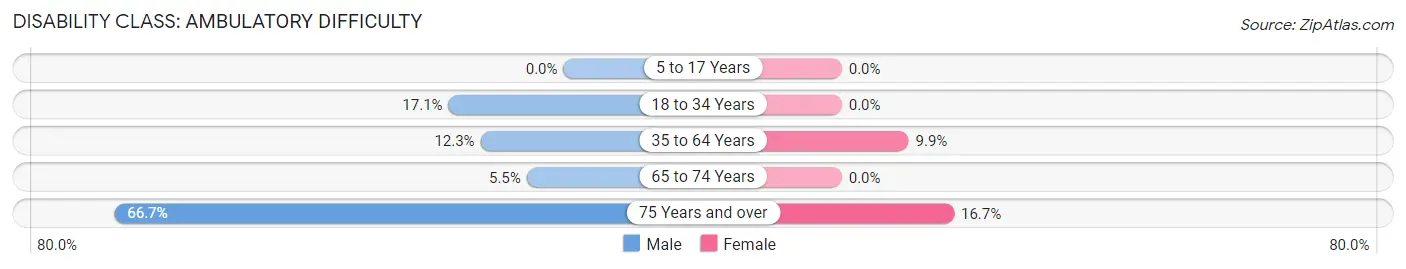
| Age Bracket | Male | Female |
| 5 to 17 Years | 0 (0.0%) | 0 (0.0%) |
| 18 to 34 Years | 7 (17.1%) | 0 (0.0%) |
| 35 to 64 Years | 16 (12.3%) | 13 (9.9%) |
| 65 to 74 Years | 3 (5.4%) | 0 (0.0%) |
| 75 Years and over | 8 (66.7%) | 5 (16.7%) |
Disability Class: Self-Care Difficulty
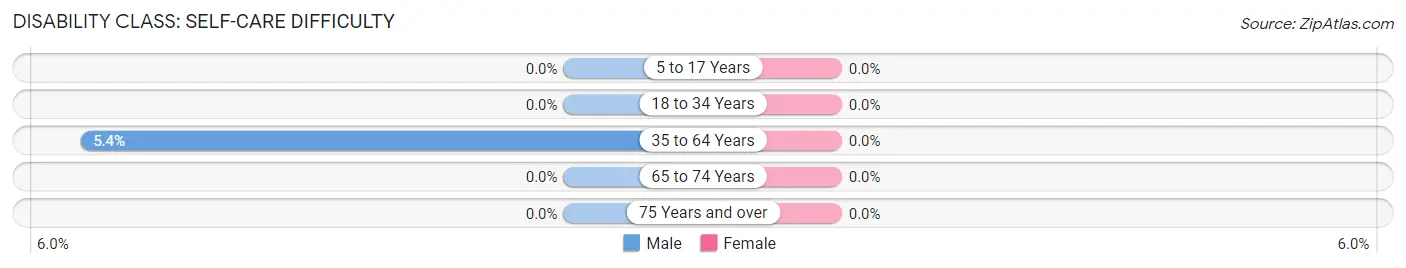
| Age Bracket | Male | Female |
| 5 to 17 Years | 0 (0.0%) | 0 (0.0%) |
| 18 to 34 Years | 0 (0.0%) | 0 (0.0%) |
| 35 to 64 Years | 7 (5.4%) | 0 (0.0%) |
| 65 to 74 Years | 0 (0.0%) | 0 (0.0%) |
| 75 Years and over | 0 (0.0%) | 0 (0.0%) |
Technology Access in Bay Shore
Computing Device Access in Bay Shore
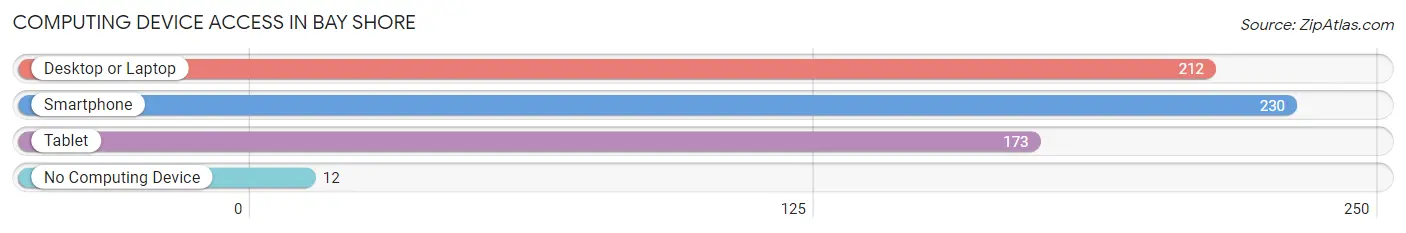
| Device Type | # Households | % Households |
| Desktop or Laptop | 212 | 79.7% |
| Smartphone | 230 | 86.5% |
| Tablet | 173 | 65.0% |
| No Computing Device | 12 | 4.5% |
| Total | 266 | 100.0% |
Internet Access in Bay Shore
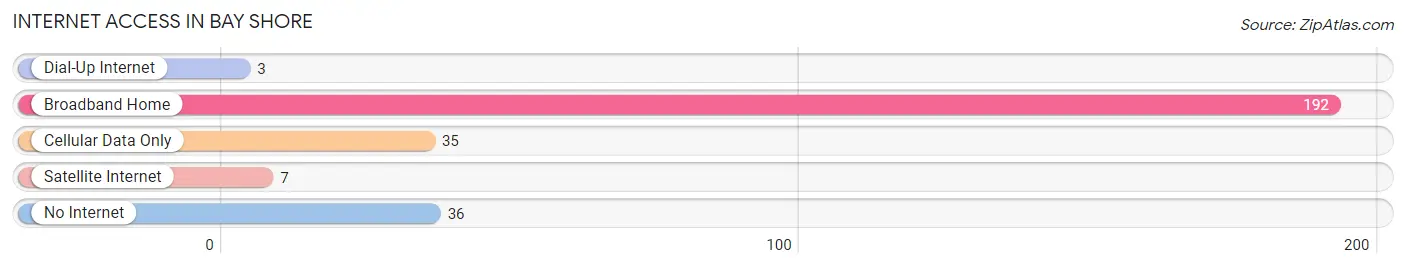
| Internet Type | # Households | % Households |
| Dial-Up Internet | 3 | 1.1% |
| Broadband Home | 192 | 72.2% |
| Cellular Data Only | 35 | 13.2% |
| Satellite Internet | 7 | 2.6% |
| No Internet | 36 | 13.5% |
| Total | 266 | 100.0% |
Bay Shore Summary
Bay Shore is a small village located in the state of Michigan, in the United States. It is situated in the southeastern corner of the state, on the shores of Lake Michigan. The village is part of the larger Bay Shore Township, which is located in the northern part of the state. The population of Bay Shore was 1,845 as of the 2010 census.
History
The area that is now Bay Shore was first settled in the early 1800s by French-Canadian fur traders. The village was officially founded in 1837, when the first post office was established. The village was named after the bay that it was situated on, which was named by the French-Canadian fur traders.
In the late 1800s, Bay Shore became a popular summer resort destination for wealthy families from Detroit and Chicago. The village was known for its beautiful beaches and its picturesque views of Lake Michigan.
In the early 1900s, Bay Shore began to develop into a more permanent settlement. The village was incorporated in 1921, and the first mayor was elected in 1922.
Geography
Bay Shore is located in the southeastern corner of Michigan, on the shores of Lake Michigan. The village is situated on the northern shore of the lake, and is bordered by the towns of Muskegon and Grand Haven to the north, and the cities of Holland and Grand Rapids to the south.
The village covers an area of 1.2 square miles, and has a population density of 1,521 people per square mile. The village is located at an elevation of 645 feet above sea level.
Economy
The economy of Bay Shore is largely based on tourism and recreation. The village is home to several popular beaches, including the Bay Shore Beach, which is a popular destination for swimming, fishing, and boating. The village also has several parks and recreational areas, including the Bay Shore Park, which is a popular spot for picnics and outdoor activities.
The village is also home to several small businesses, including restaurants, shops, and other services. The village is also home to several small manufacturing companies, which produce a variety of products, including furniture, clothing, and electronics.
Demographics
As of the 2010 census, the population of Bay Shore was 1,845. The racial makeup of the village was 95.3% White, 0.9% African American, 0.3% Native American, 0.7% Asian, 0.1% Pacific Islander, 0.7% from other races, and 1.9% from two or more races. Hispanic or Latino of any race were 2.2% of the population.
The median household income in Bay Shore was $45,938, and the median family income was $51,938. The per capita income for the village was $20,938. About 8.3% of families and 10.2% of the population were below the poverty line, including 14.2% of those under age 18 and 5.2% of those age 65 or over.
Common Questions
What is Per Capita Income in Bay Shore?
Per Capita income in Bay Shore is $43,393.
What is the Median Family Income in Bay Shore?
Median Family Income in Bay Shore is $71,250.
What is the Median Household income in Bay Shore?
Median Household Income in Bay Shore is $64,444.
What is Inequality or Gini Index in Bay Shore?
Inequality or Gini Index in Bay Shore is 0.43.
What is the Total Population of Bay Shore?
Total Population of Bay Shore is 533.
What is the Total Male Population of Bay Shore?
Total Male Population of Bay Shore is 253.
What is the Total Female Population of Bay Shore?
Total Female Population of Bay Shore is 280.
What is the Ratio of Males per 100 Females in Bay Shore?
There are 90.36 Males per 100 Females in Bay Shore.
What is the Ratio of Females per 100 Males in Bay Shore?
There are 110.67 Females per 100 Males in Bay Shore.
What is the Median Population Age in Bay Shore?
Median Population Age in Bay Shore is 51.3 Years.
What is the Average Family Size in Bay Shore
Average Family Size in Bay Shore is 2.3 People.
What is the Average Household Size in Bay Shore
Average Household Size in Bay Shore is 2.0 People.
How Large is the Labor Force in Bay Shore?
There are 304 People in the Labor Forcein in Bay Shore.
What is the Percentage of People in the Labor Force in Bay Shore?
61.0% of People are in the Labor Force in Bay Shore.
What is the Unemployment Rate in Bay Shore?
Unemployment Rate in Bay Shore is 2.3%.