Paw Paw Lake, MI Map & Demographics
Paw Paw Lake Map
Paw Paw Lake Overview
$33,776
PER CAPITA INCOME
$74,053
AVG FAMILY INCOME
$58,260
AVG HOUSEHOLD INCOME
40.8%
WAGE / INCOME GAP [ % ]
59.2¢/ $1
WAGE / INCOME GAP [ $ ]
0.48
INEQUALITY / GINI INDEX
3,643
TOTAL POPULATION
1,735
MALE POPULATION
1,908
FEMALE POPULATION
90.93
MALES / 100 FEMALES
109.97
FEMALES / 100 MALES
43.4
MEDIAN AGE
2.8
AVG FAMILY SIZE
2.3
AVG HOUSEHOLD SIZE
1,555
LABOR FORCE [ PEOPLE ]
53.2%
PERCENT IN LABOR FORCE
6.2%
UNEMPLOYMENT RATE
Income in Paw Paw Lake
Income Overview in Paw Paw Lake
Per Capita Income in Paw Paw Lake is $33,776, while median incomes of families and households are $74,053 and $58,260 respectively.
| Characteristic | Number | Measure |
| Per Capita Income | 3,643 | $33,776 |
| Median Family Income | 1,041 | $74,053 |
| Mean Family Income | 1,041 | $90,432 |
| Median Household Income | 1,580 | $58,260 |
| Mean Household Income | 1,580 | $75,538 |
| Income Deficit | 1,041 | $0 |
| Wage / Income Gap (%) | 3,643 | 40.78% |
| Wage / Income Gap ($) | 3,643 | 59.22¢ per $1 |
| Gini / Inequality Index | 3,643 | 0.48 |
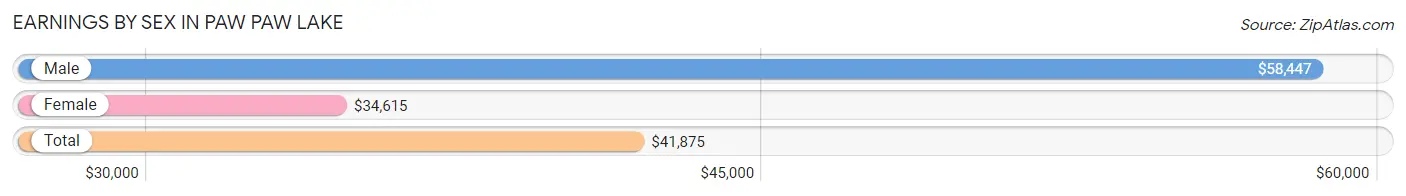
Earnings by Sex in Paw Paw Lake
Average Earnings in Paw Paw Lake are $41,875, $58,447 for men and $34,615 for women, a difference of 40.8%.
| Sex | Number | Average Earnings |
| Male | 721 (45.8%) | $58,447 |
| Female | 852 (54.2%) | $34,615 |
| Total | 1,573 (100.0%) | $41,875 |
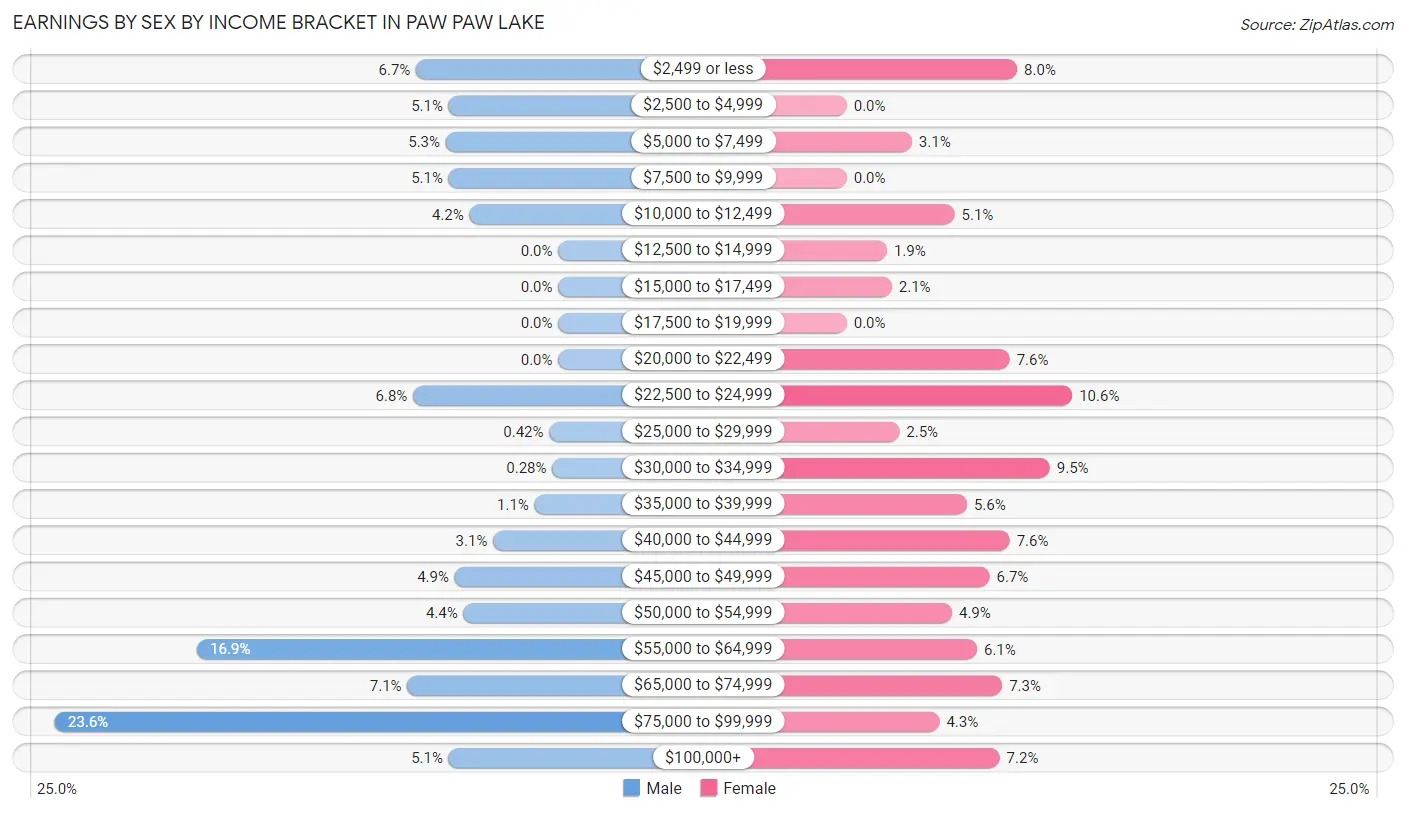
Earnings by Sex by Income Bracket in Paw Paw Lake
The most common earnings brackets in Paw Paw Lake are $75,000 to $99,999 for men (170 | 23.6%) and $22,500 to $24,999 for women (90 | 10.6%).
| Income | Male | Female |
| $2,499 or less | 48 (6.7%) | 68 (8.0%) |
| $2,500 to $4,999 | 37 (5.1%) | 0 (0.0%) |
| $5,000 to $7,499 | 38 (5.3%) | 26 (3.0%) |
| $7,500 to $9,999 | 37 (5.1%) | 0 (0.0%) |
| $10,000 to $12,499 | 30 (4.2%) | 43 (5.1%) |
| $12,500 to $14,999 | 0 (0.0%) | 16 (1.9%) |
| $15,000 to $17,499 | 0 (0.0%) | 18 (2.1%) |
| $17,500 to $19,999 | 0 (0.0%) | 0 (0.0%) |
| $20,000 to $22,499 | 0 (0.0%) | 65 (7.6%) |
| $22,500 to $24,999 | 49 (6.8%) | 90 (10.6%) |
| $25,000 to $29,999 | 3 (0.4%) | 21 (2.5%) |
| $30,000 to $34,999 | 2 (0.3%) | 81 (9.5%) |
| $35,000 to $39,999 | 8 (1.1%) | 48 (5.6%) |
| $40,000 to $44,999 | 22 (3.0%) | 65 (7.6%) |
| $45,000 to $49,999 | 35 (4.9%) | 57 (6.7%) |
| $50,000 to $54,999 | 32 (4.4%) | 42 (4.9%) |
| $55,000 to $64,999 | 122 (16.9%) | 52 (6.1%) |
| $65,000 to $74,999 | 51 (7.1%) | 62 (7.3%) |
| $75,000 to $99,999 | 170 (23.6%) | 37 (4.3%) |
| $100,000+ | 37 (5.1%) | 61 (7.2%) |
| Total | 721 (100.0%) | 852 (100.0%) |
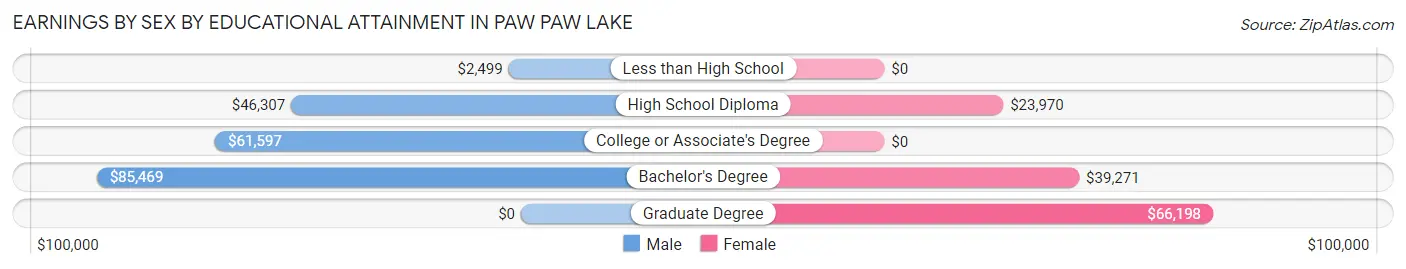
Earnings by Sex by Educational Attainment in Paw Paw Lake
Average earnings in Paw Paw Lake are $60,372 for men and $38,958 for women, a difference of 35.5%. Men with an educational attainment of bachelor's degree enjoy the highest average annual earnings of $85,469, while those with less than high school education earn the least with $2,499. Women with an educational attainment of graduate degree earn the most with the average annual earnings of $66,198, while those with high school diploma education have the smallest earnings of $23,970.
| Educational Attainment | Male Income | Female Income |
| Less than High School | $2,499 | $0 |
| High School Diploma | $46,307 | $23,970 |
| College or Associate's Degree | $61,597 | $0 |
| Bachelor's Degree | $85,469 | $39,271 |
| Graduate Degree | - | - |
| Total | $60,372 | $38,958 |
Family Income in Paw Paw Lake
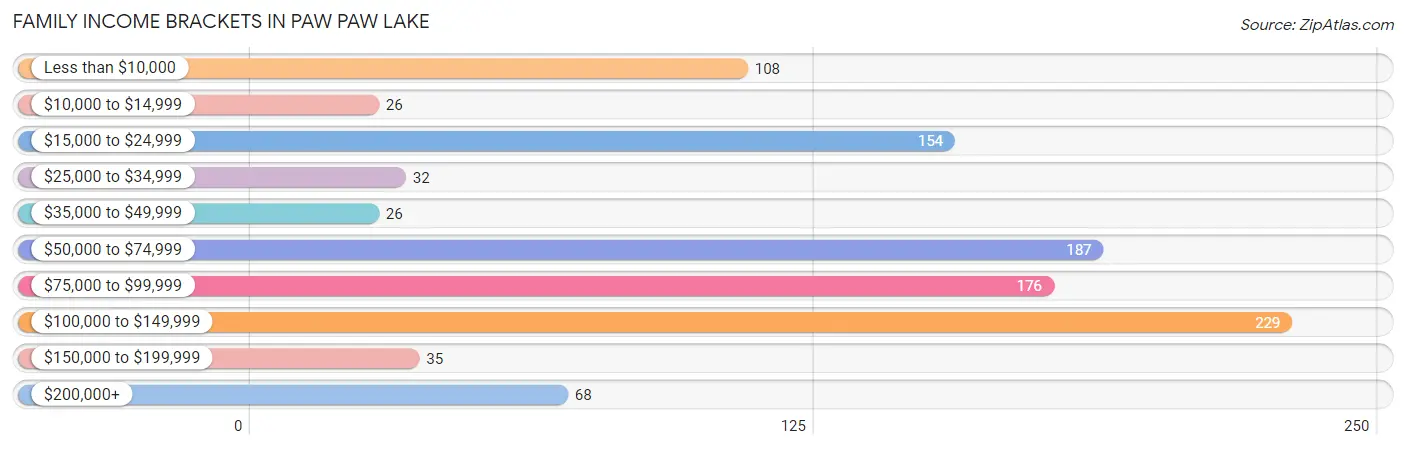
Family Income Brackets in Paw Paw Lake
According to the Paw Paw Lake family income data, there are 229 families falling into the $100,000 to $149,999 income range, which is the most common income bracket and makes up 22.0% of all families. Conversely, the $10,000 to $14,999 income bracket is the least frequent group with only 26 families (2.5%) belonging to this category.
| Income Bracket | # Families | % Families |
| Less than $10,000 | 108 | 10.4% |
| $10,000 to $14,999 | 26 | 2.5% |
| $15,000 to $24,999 | 154 | 14.8% |
| $25,000 to $34,999 | 32 | 3.1% |
| $35,000 to $49,999 | 26 | 2.5% |
| $50,000 to $74,999 | 187 | 18.0% |
| $75,000 to $99,999 | 176 | 16.9% |
| $100,000 to $149,999 | 229 | 22.0% |
| $150,000 to $199,999 | 35 | 3.4% |
| $200,000+ | 68 | 6.5% |
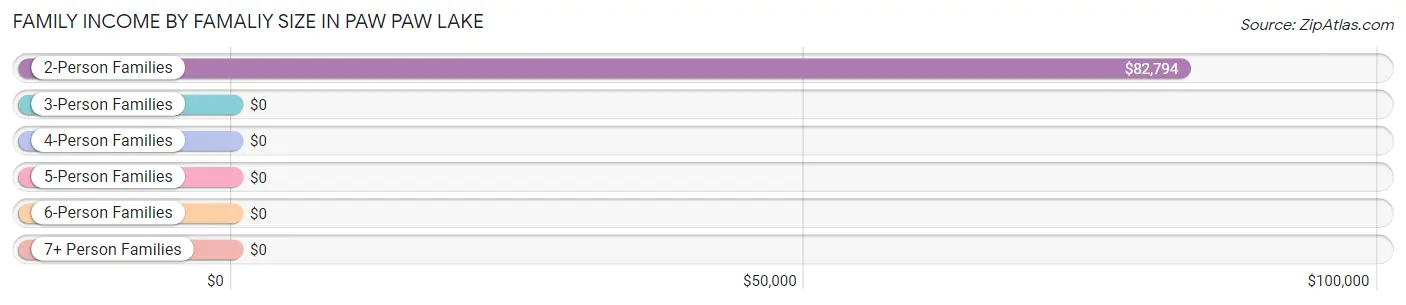
Family Income by Famaliy Size in Paw Paw Lake
2-person families (702 | 67.4%) account for the highest median family income in Paw Paw Lake with $82,794 per family, while 2-person families (702 | 67.4%) have the highest median income of $41,397 per family member.
| Income Bracket | # Families | Median Income |
| 2-Person Families | 702 (67.4%) | $82,794 |
| 3-Person Families | 83 (8.0%) | $0 |
| 4-Person Families | 140 (13.5%) | $0 |
| 5-Person Families | 112 (10.8%) | $0 |
| 6-Person Families | 0 (0.0%) | $0 |
| 7+ Person Families | 4 (0.4%) | $0 |
| Total | 1,041 (100.0%) | $74,053 |
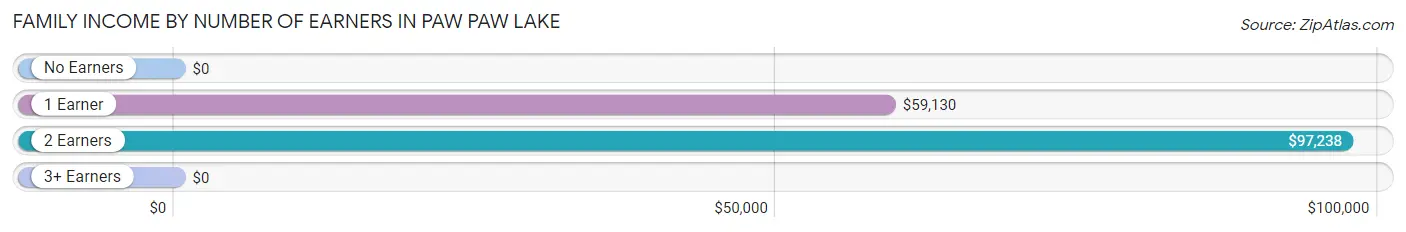
Family Income by Number of Earners in Paw Paw Lake
| Number of Earners | # Families | Median Income |
| No Earners | 259 (24.9%) | $0 |
| 1 Earner | 364 (35.0%) | $59,130 |
| 2 Earners | 393 (37.8%) | $97,238 |
| 3+ Earners | 25 (2.4%) | $0 |
| Total | 1,041 (100.0%) | $74,053 |
Household Income in Paw Paw Lake
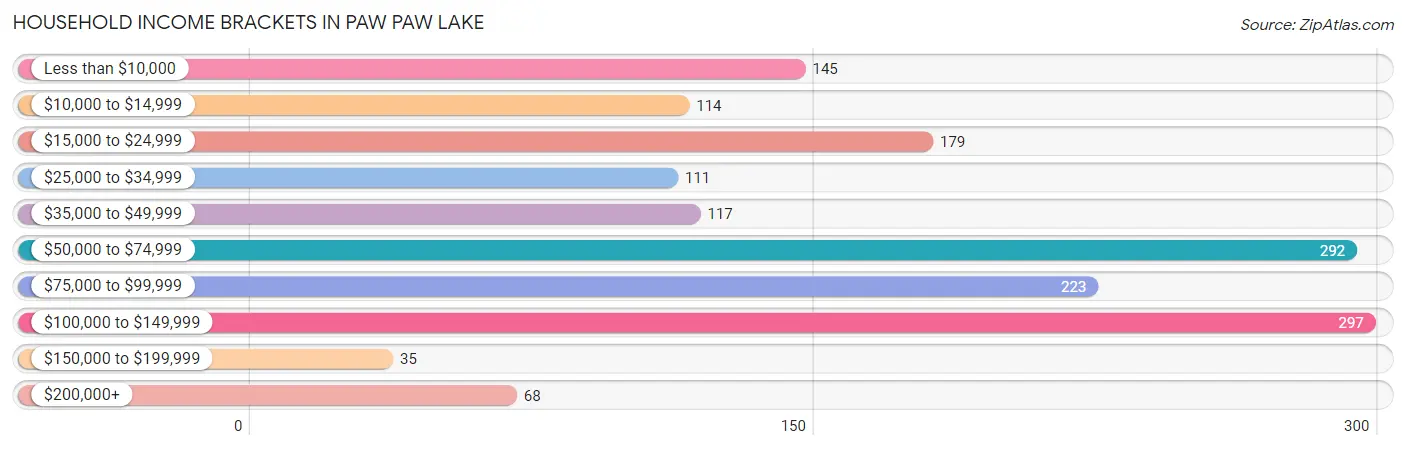
Household Income Brackets in Paw Paw Lake
With 297 households falling in the category, the $100,000 to $149,999 income range is the most frequent in Paw Paw Lake, accounting for 18.8% of all households. In contrast, only 35 households (2.2%) fall into the $150,000 to $199,999 income bracket, making it the least populous group.
| Income Bracket | # Households | % Households |
| Less than $10,000 | 145 | 9.2% |
| $10,000 to $14,999 | 114 | 7.2% |
| $15,000 to $24,999 | 179 | 11.3% |
| $25,000 to $34,999 | 111 | 7.0% |
| $35,000 to $49,999 | 117 | 7.4% |
| $50,000 to $74,999 | 292 | 18.5% |
| $75,000 to $99,999 | 223 | 14.1% |
| $100,000 to $149,999 | 297 | 18.8% |
| $150,000 to $199,999 | 35 | 2.2% |
| $200,000+ | 68 | 4.3% |
Household Income by Householder Age in Paw Paw Lake
The median household income in Paw Paw Lake is $58,260, with the highest median household income of $58,607 found in the 65+ years age bracket for the primary householder. A total of 453 households (28.7%) fall into this category. Meanwhile, the 15 to 24 years age bracket for the primary householder has the lowest median household income of $0, with 128 households (8.1%) in this group.
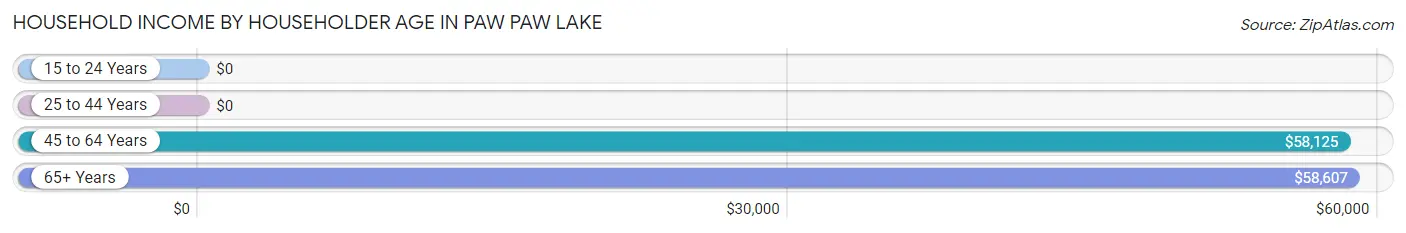
| Income Bracket | # Households | Median Income |
| 15 to 24 Years | 128 (8.1%) | $0 |
| 25 to 44 Years | 437 (27.7%) | $0 |
| 45 to 64 Years | 562 (35.6%) | $58,125 |
| 65+ Years | 453 (28.7%) | $58,607 |
| Total | 1,580 (100.0%) | $58,260 |
Poverty in Paw Paw Lake
Income Below Poverty by Sex and Age in Paw Paw Lake
With 26.3% poverty level for males and 21.2% for females among the residents of Paw Paw Lake, 5 year old males and under 5 year old females are the most vulnerable to poverty, with 48 males (100.0%) and 25 females (52.1%) in their respective age groups living below the poverty level.
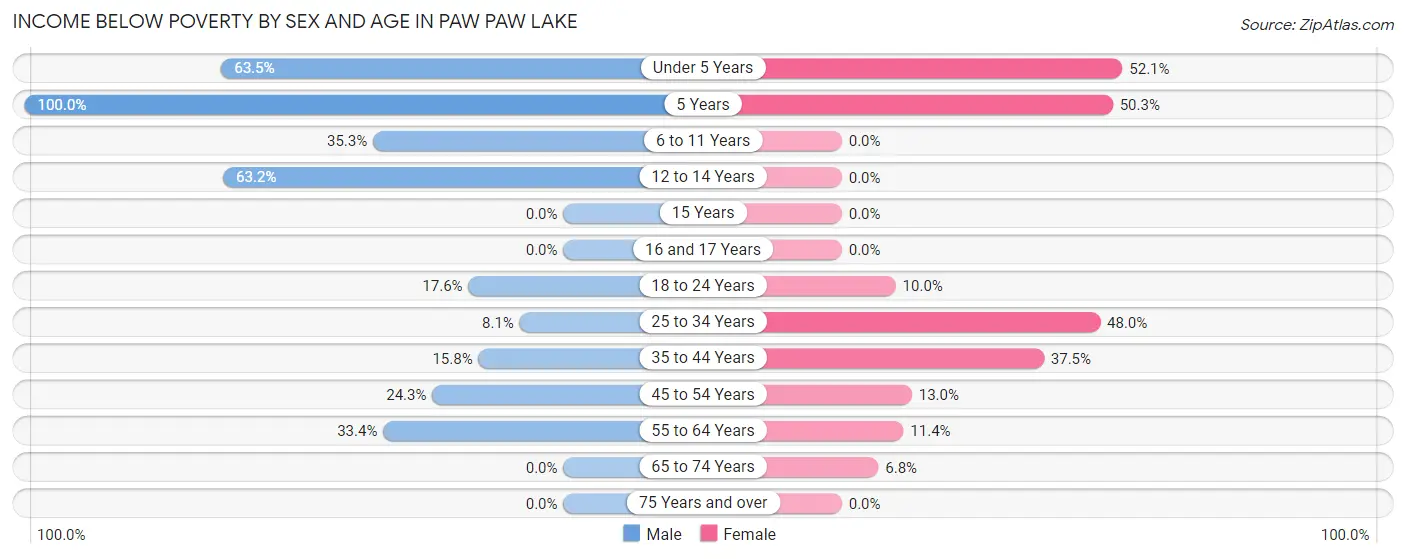
| Age Bracket | Male | Female |
| Under 5 Years | 113 (63.5%) | 25 (52.1%) |
| 5 Years | 48 (100.0%) | 87 (50.3%) |
| 6 to 11 Years | 71 (35.3%) | 0 (0.0%) |
| 12 to 14 Years | 24 (63.2%) | 0 (0.0%) |
| 15 Years | 0 (0.0%) | 0 (0.0%) |
| 16 and 17 Years | 0 (0.0%) | 0 (0.0%) |
| 18 to 24 Years | 34 (17.6%) | 16 (10.0%) |
| 25 to 34 Years | 12 (8.1%) | 105 (47.9%) |
| 35 to 44 Years | 23 (15.8%) | 96 (37.5%) |
| 45 to 54 Years | 18 (24.3%) | 29 (13.0%) |
| 55 to 64 Years | 114 (33.4%) | 31 (11.4%) |
| 65 to 74 Years | 0 (0.0%) | 15 (6.8%) |
| 75 Years and over | 0 (0.0%) | 0 (0.0%) |
| Total | 457 (26.3%) | 404 (21.2%) |
Income Above Poverty by Sex and Age in Paw Paw Lake
According to the poverty statistics in Paw Paw Lake, males aged 15 years and females aged 6 to 11 years are the age groups that are most secure financially, with 100.0% of males and 100.0% of females in these age groups living above the poverty line.
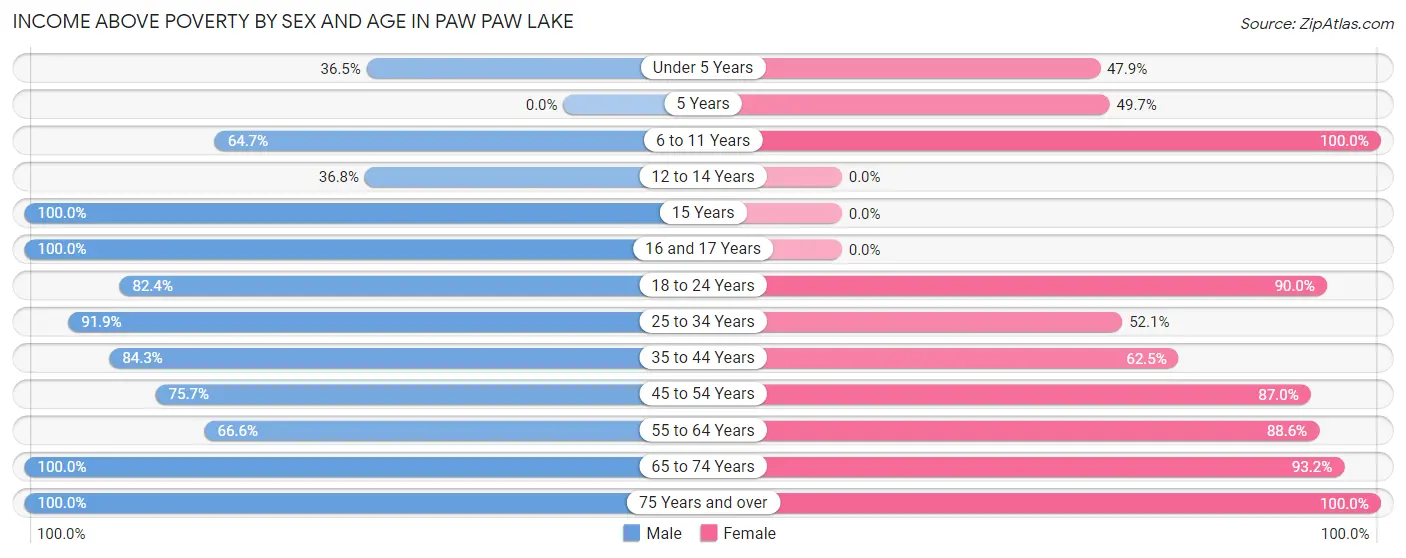
| Age Bracket | Male | Female |
| Under 5 Years | 65 (36.5%) | 23 (47.9%) |
| 5 Years | 0 (0.0%) | 86 (49.7%) |
| 6 to 11 Years | 130 (64.7%) | 29 (100.0%) |
| 12 to 14 Years | 14 (36.8%) | 0 (0.0%) |
| 15 Years | 5 (100.0%) | 0 (0.0%) |
| 16 and 17 Years | 26 (100.0%) | 0 (0.0%) |
| 18 to 24 Years | 159 (82.4%) | 144 (90.0%) |
| 25 to 34 Years | 136 (91.9%) | 114 (52.0%) |
| 35 to 44 Years | 123 (84.3%) | 160 (62.5%) |
| 45 to 54 Years | 56 (75.7%) | 194 (87.0%) |
| 55 to 64 Years | 227 (66.6%) | 240 (88.6%) |
| 65 to 74 Years | 137 (100.0%) | 206 (93.2%) |
| 75 Years and over | 200 (100.0%) | 308 (100.0%) |
| Total | 1,278 (73.7%) | 1,504 (78.8%) |
Income Below Poverty Among Married-Couple Families in Paw Paw Lake
The poverty statistics for married-couple families in Paw Paw Lake show that 3.4% or 27 of the total 787 families live below the poverty line. Families with no children have the highest poverty rate of 4.4%, comprising of 27 families. On the other hand, families with 1 or 2 children have the lowest poverty rate of 0.0%, which includes 0 families.
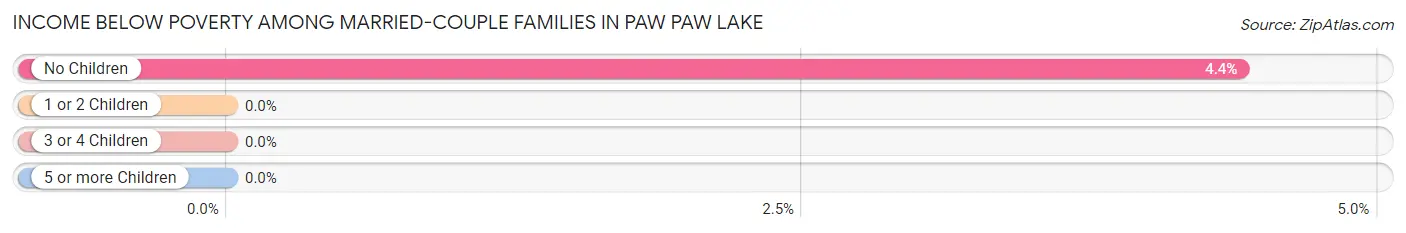
| Children | Above Poverty | Below Poverty |
| No Children | 587 (95.6%) | 27 (4.4%) |
| 1 or 2 Children | 132 (100.0%) | 0 (0.0%) |
| 3 or 4 Children | 41 (100.0%) | 0 (0.0%) |
| 5 or more Children | 0 (0.0%) | 0 (0.0%) |
| Total | 760 (96.6%) | 27 (3.4%) |
Income Below Poverty Among Single-Parent Households in Paw Paw Lake
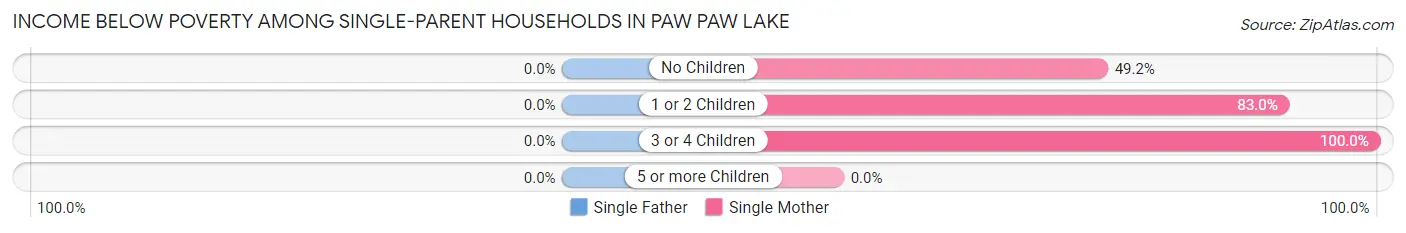
| Children | Single Father | Single Mother |
| No Children | 0 (0.0%) | 30 (49.2%) |
| 1 or 2 Children | 0 (0.0%) | 93 (83.0%) |
| 3 or 4 Children | 0 (0.0%) | 80 (100.0%) |
| 5 or more Children | 0 (0.0%) | 0 (0.0%) |
| Total | 0 (0.0%) | 203 (80.2%) |
Income Below Poverty Among Married-Couple vs Single-Parent Households in Paw Paw Lake
The poverty data for Paw Paw Lake shows that 27 of the married-couple family households (3.4%) and 203 of the single-parent households (79.9%) are living below the poverty level. Within the married-couple family households, those with no children have the highest poverty rate, with 27 households (4.4%) falling below the poverty line. Among the single-parent households, those with 3 or 4 children have the highest poverty rate, with 80 household (100.0%) living below poverty.
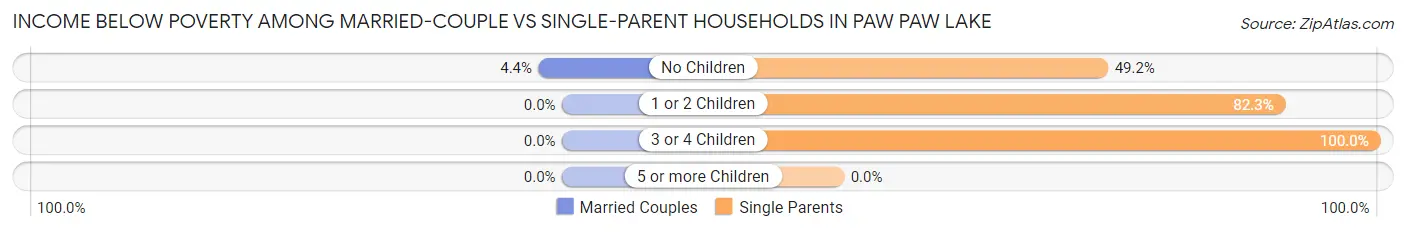
| Children | Married-Couple Families | Single-Parent Households |
| No Children | 27 (4.4%) | 30 (49.2%) |
| 1 or 2 Children | 0 (0.0%) | 93 (82.3%) |
| 3 or 4 Children | 0 (0.0%) | 80 (100.0%) |
| 5 or more Children | 0 (0.0%) | 0 (0.0%) |
| Total | 27 (3.4%) | 203 (79.9%) |
Race in Paw Paw Lake
The most populous races in Paw Paw Lake are White / Caucasian (3,286 | 90.2%), Some other Race (127 | 3.5%), and Two or more Races (107 | 2.9%).
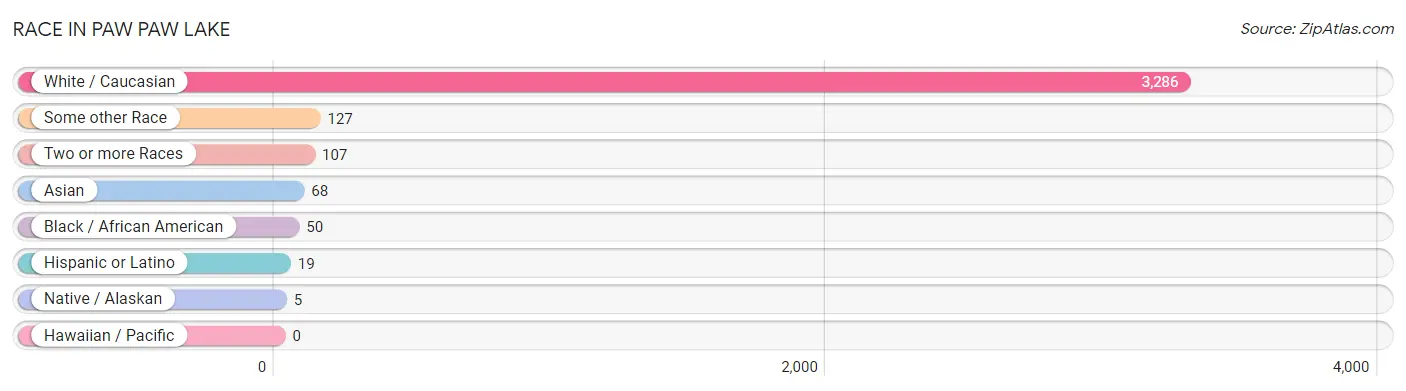
| Race | # Population | % Population |
| Asian | 68 | 1.9% |
| Black / African American | 50 | 1.4% |
| Hawaiian / Pacific | 0 | 0.0% |
| Hispanic or Latino | 19 | 0.5% |
| Native / Alaskan | 5 | 0.1% |
| White / Caucasian | 3,286 | 90.2% |
| Two or more Races | 107 | 2.9% |
| Some other Race | 127 | 3.5% |
| Total | 3,643 | 100.0% |
Ancestry in Paw Paw Lake
The most populous ancestries reported in Paw Paw Lake are German (880 | 24.2%), Irish (460 | 12.6%), English (358 | 9.8%), Polish (304 | 8.3%), and Dutch (276 | 7.6%), together accounting for 62.5% of all Paw Paw Lake residents.
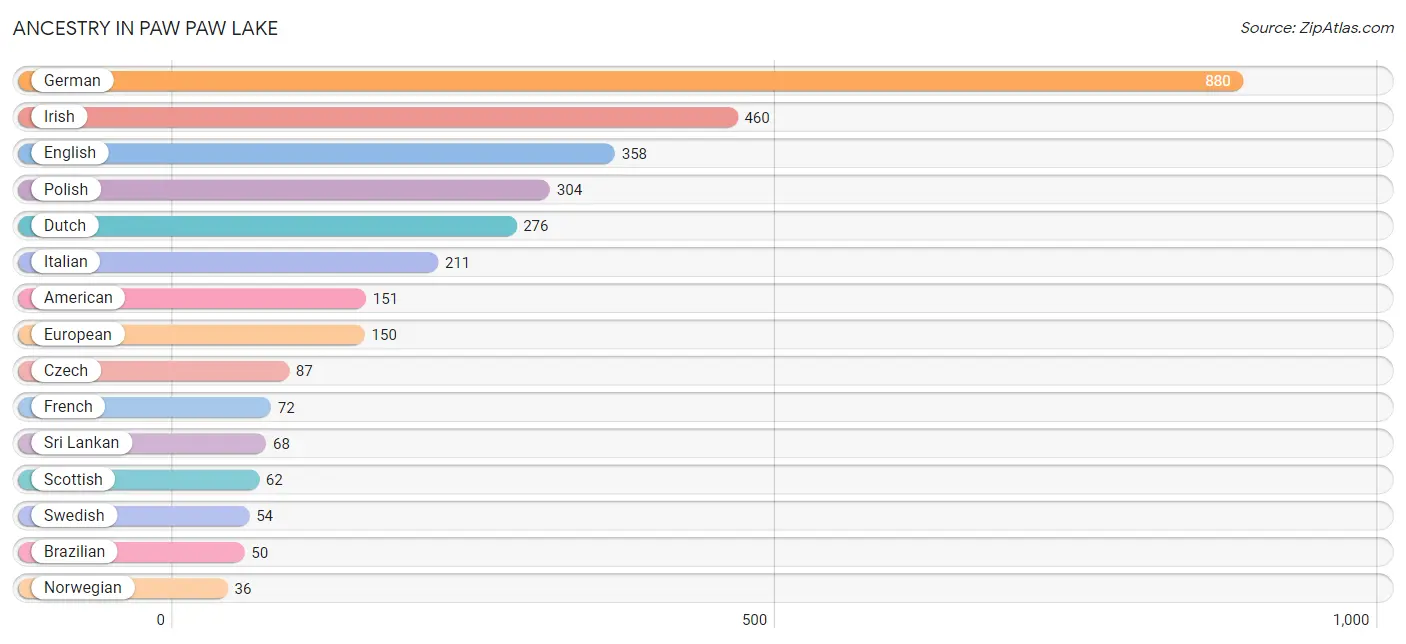
| Ancestry | # Population | % Population |
| American | 151 | 4.1% |
| Belgian | 2 | 0.1% |
| Blackfeet | 29 | 0.8% |
| Brazilian | 50 | 1.4% |
| British | 25 | 0.7% |
| Cherokee | 5 | 0.1% |
| Czech | 87 | 2.4% |
| Danish | 12 | 0.3% |
| Dutch | 276 | 7.6% |
| English | 358 | 9.8% |
| European | 150 | 4.1% |
| Finnish | 28 | 0.8% |
| French | 72 | 2.0% |
| German | 880 | 24.2% |
| Hungarian | 14 | 0.4% |
| Irish | 460 | 12.6% |
| Italian | 211 | 5.8% |
| Lithuanian | 25 | 0.7% |
| Mexican | 19 | 0.5% |
| Norwegian | 36 | 1.0% |
| Polish | 304 | 8.3% |
| Russian | 18 | 0.5% |
| Scotch-Irish | 14 | 0.4% |
| Scottish | 62 | 1.7% |
| Sri Lankan | 68 | 1.9% |
| Swedish | 54 | 1.5% | View All 26 Rows |
Immigrants in Paw Paw Lake
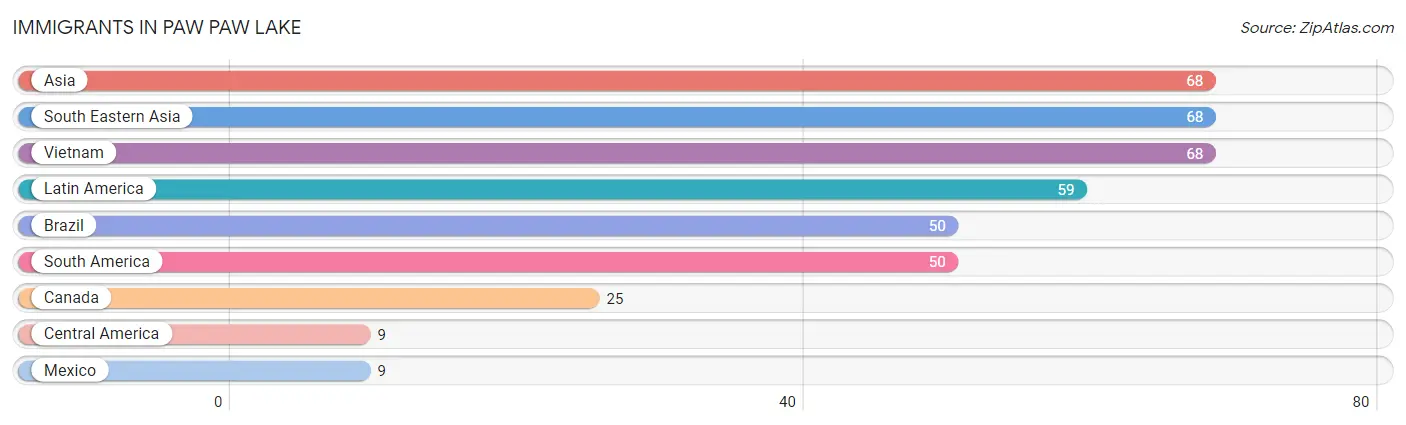
The most numerous immigrant groups reported in Paw Paw Lake came from Asia (68 | 1.9%), South Eastern Asia (68 | 1.9%), Vietnam (68 | 1.9%), Latin America (59 | 1.6%), and Brazil (50 | 1.4%), together accounting for 8.6% of all Paw Paw Lake residents.
| Immigration Origin | # Population | % Population |
| Asia | 68 | 1.9% |
| Brazil | 50 | 1.4% |
| Canada | 25 | 0.7% |
| Central America | 9 | 0.3% |
| Latin America | 59 | 1.6% |
| Mexico | 9 | 0.3% |
| South America | 50 | 1.4% |
| South Eastern Asia | 68 | 1.9% |
| Vietnam | 68 | 1.9% | View All 9 Rows |
Sex and Age in Paw Paw Lake
Sex and Age in Paw Paw Lake
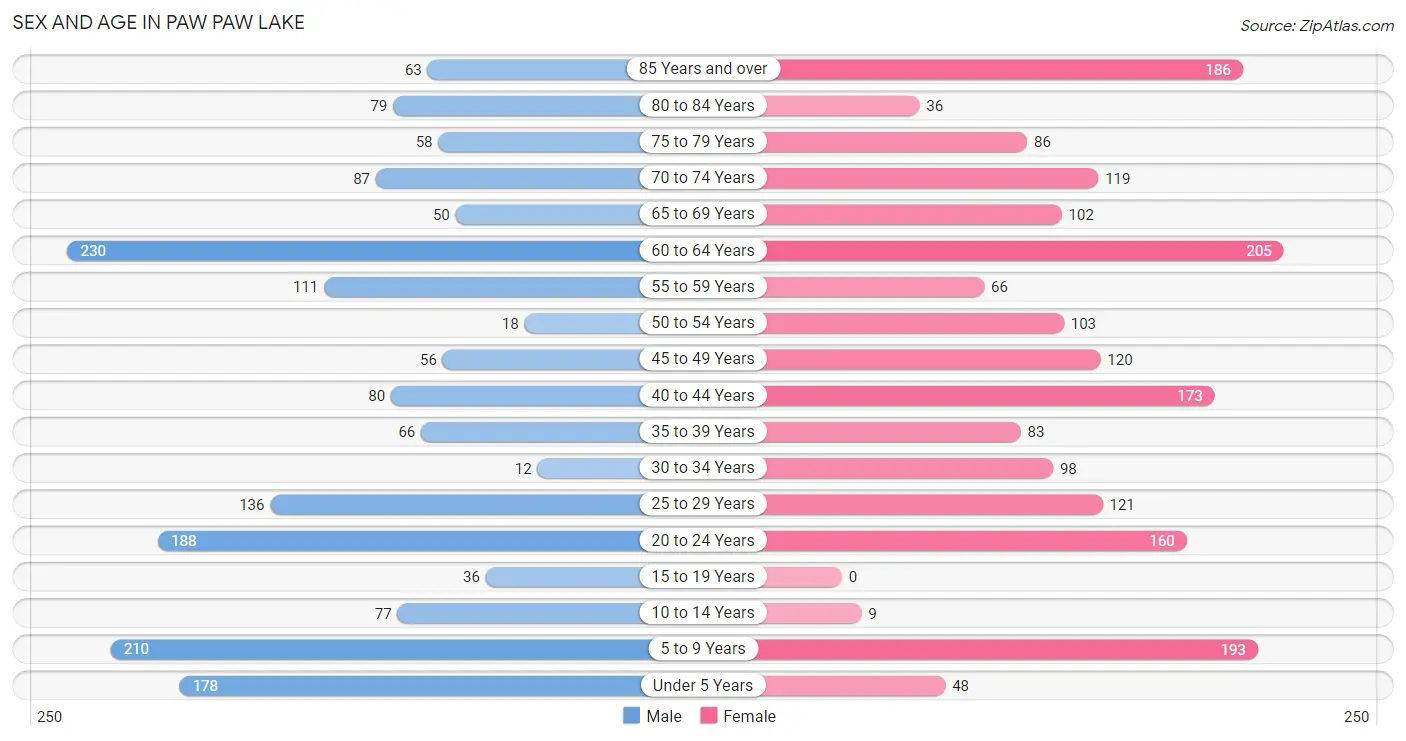
The most populous age groups in Paw Paw Lake are 60 to 64 Years (230 | 13.3%) for men and 60 to 64 Years (205 | 10.7%) for women.
| Age Bracket | Male | Female |
| Under 5 Years | 178 (10.3%) | 48 (2.5%) |
| 5 to 9 Years | 210 (12.1%) | 193 (10.1%) |
| 10 to 14 Years | 77 (4.4%) | 9 (0.5%) |
| 15 to 19 Years | 36 (2.1%) | 0 (0.0%) |
| 20 to 24 Years | 188 (10.8%) | 160 (8.4%) |
| 25 to 29 Years | 136 (7.8%) | 121 (6.3%) |
| 30 to 34 Years | 12 (0.7%) | 98 (5.1%) |
| 35 to 39 Years | 66 (3.8%) | 83 (4.3%) |
| 40 to 44 Years | 80 (4.6%) | 173 (9.1%) |
| 45 to 49 Years | 56 (3.2%) | 120 (6.3%) |
| 50 to 54 Years | 18 (1.0%) | 103 (5.4%) |
| 55 to 59 Years | 111 (6.4%) | 66 (3.5%) |
| 60 to 64 Years | 230 (13.3%) | 205 (10.7%) |
| 65 to 69 Years | 50 (2.9%) | 102 (5.3%) |
| 70 to 74 Years | 87 (5.0%) | 119 (6.2%) |
| 75 to 79 Years | 58 (3.3%) | 86 (4.5%) |
| 80 to 84 Years | 79 (4.5%) | 36 (1.9%) |
| 85 Years and over | 63 (3.6%) | 186 (9.8%) |
| Total | 1,735 (100.0%) | 1,908 (100.0%) |
Families and Households in Paw Paw Lake
Median Family Size in Paw Paw Lake
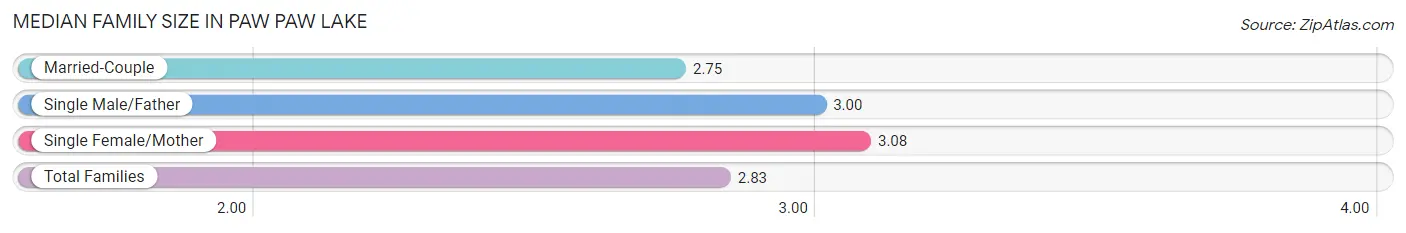
The median family size in Paw Paw Lake is 2.83 persons per family, with single female/mother families (253 | 24.3%) accounting for the largest median family size of 3.08 persons per family. On the other hand, married-couple families (787 | 75.6%) represent the smallest median family size with 2.75 persons per family.
| Family Type | # Families | Family Size |
| Married-Couple | 787 (75.6%) | 2.75 |
| Single Male/Father | 1 (0.1%) | 3.00 |
| Single Female/Mother | 253 (24.3%) | 3.08 |
| Total Families | 1,041 (100.0%) | 2.83 |
Median Household Size in Paw Paw Lake
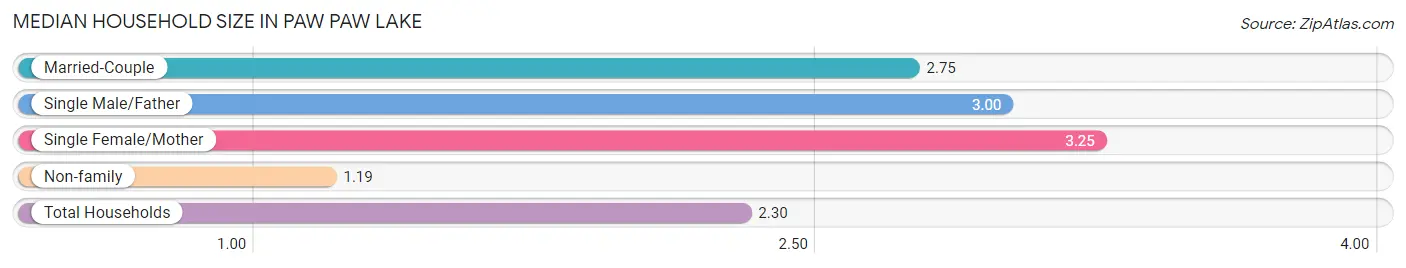
The median household size in Paw Paw Lake is 2.30 persons per household, with single female/mother households (253 | 16.0%) accounting for the largest median household size of 3.25 persons per household. non-family households (539 | 34.1%) represent the smallest median household size with 1.19 persons per household.
| Household Type | # Households | Household Size |
| Married-Couple | 787 (49.8%) | 2.75 |
| Single Male/Father | 1 (0.1%) | 3.00 |
| Single Female/Mother | 253 (16.0%) | 3.25 |
| Non-family | 539 (34.1%) | 1.19 |
| Total Households | 1,580 (100.0%) | 2.30 |
Household Size by Marriage Status in Paw Paw Lake
Out of a total of 1,580 households in Paw Paw Lake, 1,041 (65.9%) are family households, while 539 (34.1%) are nonfamily households. The most numerous type of family households are 2-person households, comprising 702, and the most common type of nonfamily households are 1-person households, comprising 437.
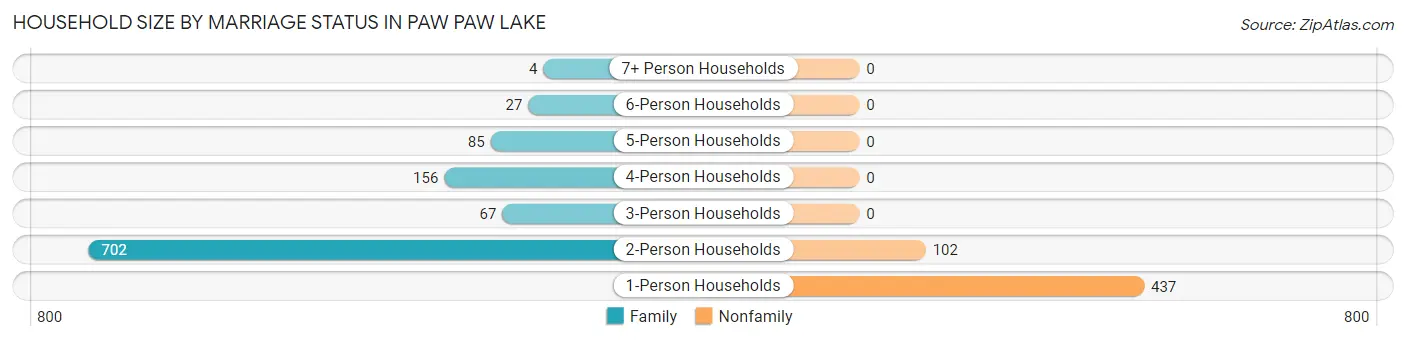
| Household Size | Family Households | Nonfamily Households |
| 1-Person Households | - | 437 (27.7%) |
| 2-Person Households | 702 (44.4%) | 102 (6.5%) |
| 3-Person Households | 67 (4.2%) | 0 (0.0%) |
| 4-Person Households | 156 (9.9%) | 0 (0.0%) |
| 5-Person Households | 85 (5.4%) | 0 (0.0%) |
| 6-Person Households | 27 (1.7%) | 0 (0.0%) |
| 7+ Person Households | 4 (0.3%) | 0 (0.0%) |
| Total | 1,041 (65.9%) | 539 (34.1%) |
Female Fertility in Paw Paw Lake
Fertility by Age in Paw Paw Lake
Average fertility rate in Paw Paw Lake is 44.0 births per 1,000 women. Women in the age bracket of 20 to 34 years have the highest fertility rate with 71.0 births per 1,000 women. Women in the age bracket of 20 to 34 years acount for 81.8% of all women with births.
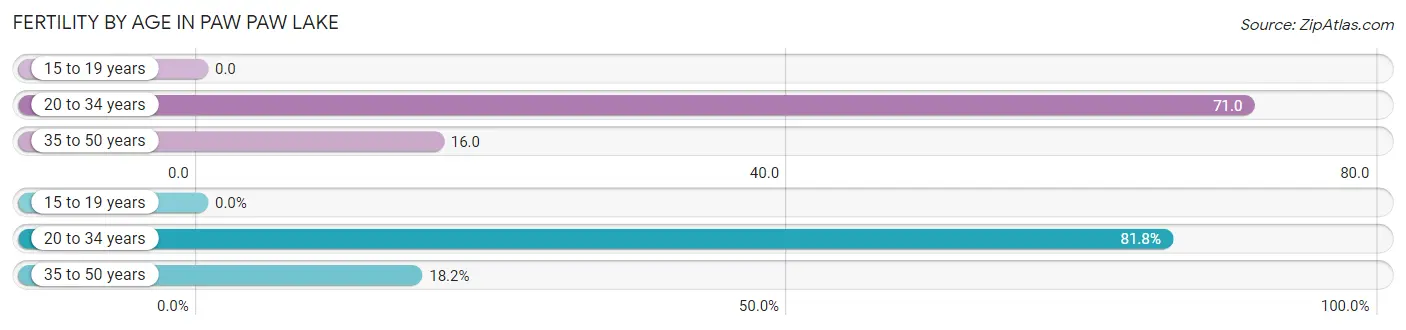
| Age Bracket | Women with Births | Births / 1,000 Women |
| 15 to 19 years | 0 (0.0%) | 0.0 |
| 20 to 34 years | 27 (81.8%) | 71.0 |
| 35 to 50 years | 6 (18.2%) | 16.0 |
| Total | 33 (100.0%) | 44.0 |
Fertility by Age by Marriage Status in Paw Paw Lake
18.2% of women with births (33) in Paw Paw Lake are married. The highest percentage of unmarried women with births falls into 20 to 34 years age bracket with 100.0% of them unmarried at the time of birth, while the lowest percentage of unmarried women with births belong to 35 to 50 years age bracket with 0.0% of them unmarried.
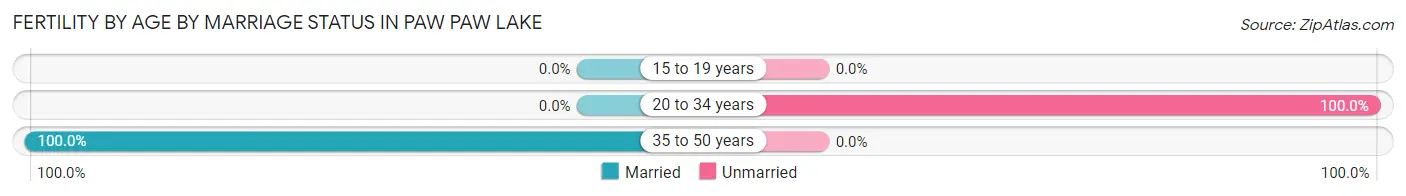
| Age Bracket | Married | Unmarried |
| 15 to 19 years | 0 (0.0%) | 0 (0.0%) |
| 20 to 34 years | 0 (0.0%) | 27 (100.0%) |
| 35 to 50 years | 6 (100.0%) | 0 (0.0%) |
| Total | 6 (18.2%) | 27 (81.8%) |
Fertility by Education in Paw Paw Lake
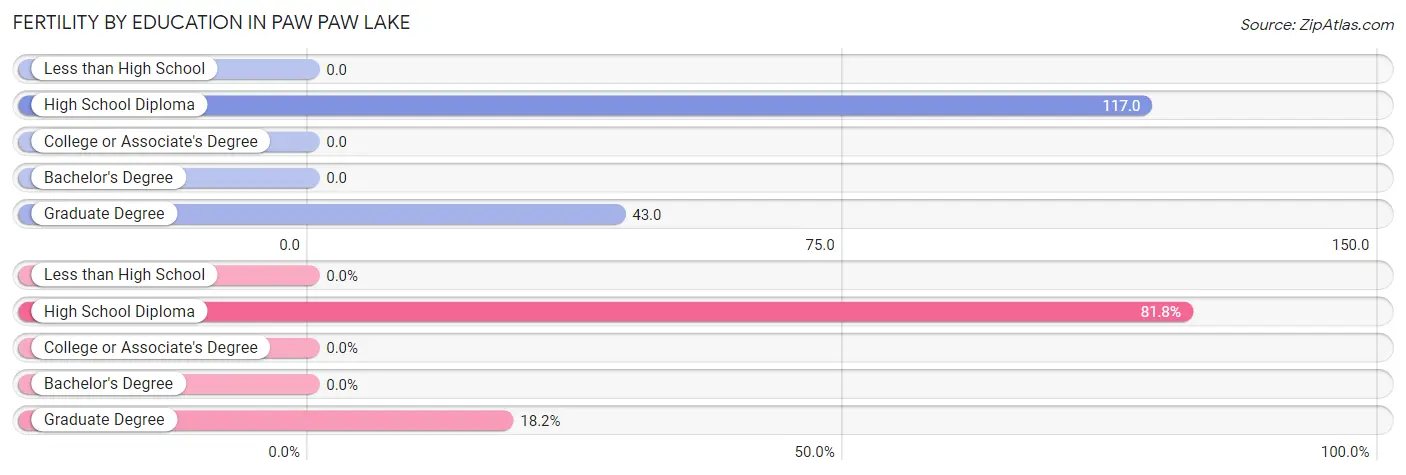
| Educational Attainment | Women with Births | Births / 1,000 Women |
| Less than High School | 0 (0.0%) | 0.0 |
| High School Diploma | 27 (81.8%) | 117.0 |
| College or Associate's Degree | 0 (0.0%) | 0.0 |
| Bachelor's Degree | 0 (0.0%) | 0.0 |
| Graduate Degree | 6 (18.2%) | 43.0 |
| Total | 33 (100.0%) | 44.0 |
Fertility by Education by Marriage Status in Paw Paw Lake
81.8% of women with births in Paw Paw Lake are unmarried. Women with the educational attainment of graduate degree are most likely to be married with 100.0% of them married at childbirth, while women with the educational attainment of high school diploma are least likely to be married with 100.0% of them unmarried at childbirth.
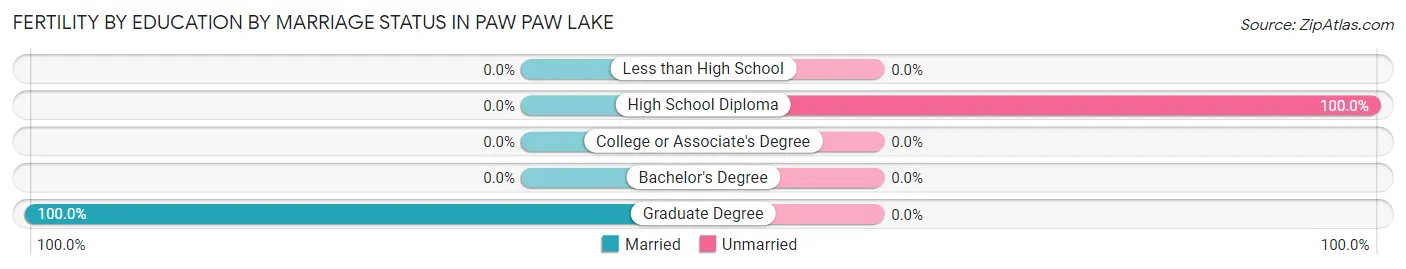
| Educational Attainment | Married | Unmarried |
| Less than High School | 0 (0.0%) | 0 (0.0%) |
| High School Diploma | 0 (0.0%) | 27 (100.0%) |
| College or Associate's Degree | 0 (0.0%) | 0 (0.0%) |
| Bachelor's Degree | 0 (0.0%) | 0 (0.0%) |
| Graduate Degree | 6 (100.0%) | 0 (0.0%) |
| Total | 6 (18.2%) | 27 (81.8%) |
Employment Characteristics in Paw Paw Lake
Employment by Class of Employer in Paw Paw Lake
Among the 1,445 employed individuals in Paw Paw Lake, private company employees (794 | 54.9%), local government employees (222 | 15.4%), and not-for-profit organizations (189 | 13.1%) make up the most common classes of employment.
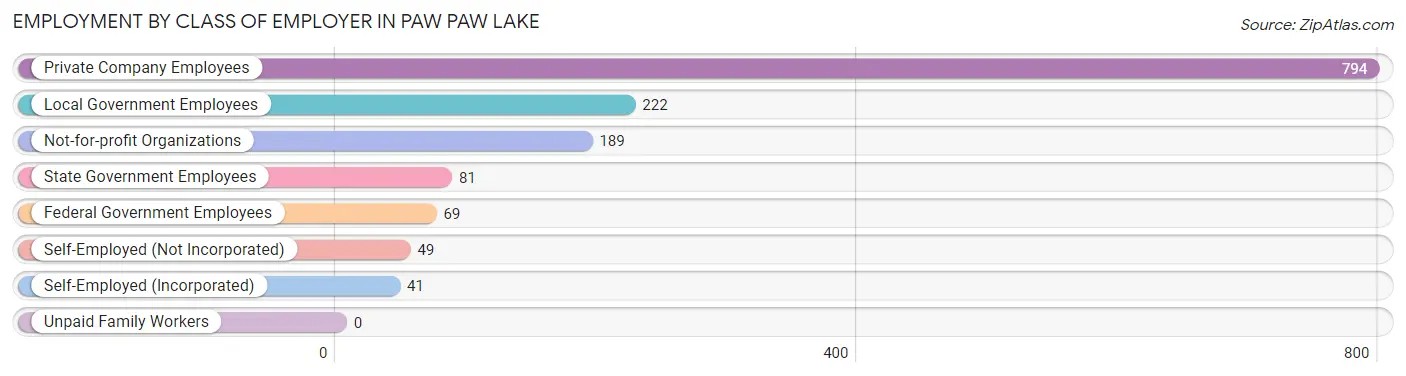
| Employer Class | # Employees | % Employees |
| Private Company Employees | 794 | 54.9% |
| Self-Employed (Incorporated) | 41 | 2.8% |
| Self-Employed (Not Incorporated) | 49 | 3.4% |
| Not-for-profit Organizations | 189 | 13.1% |
| Local Government Employees | 222 | 15.4% |
| State Government Employees | 81 | 5.6% |
| Federal Government Employees | 69 | 4.8% |
| Unpaid Family Workers | 0 | 0.0% |
| Total | 1,445 | 100.0% |
Employment Status by Age in Paw Paw Lake
According to the labor force statistics for Paw Paw Lake, out of the total population over 16 years of age (2,923), 53.2% or 1,555 individuals are in the labor force, with 6.2% or 96 of them unemployed. The age group with the highest labor force participation rate is 30 to 34 years, with 100.0% or 110 individuals in the labor force. Within the labor force, the 35 to 44 years age range has the highest percentage of unemployed individuals, with 13.7% or 39 of them being unemployed.
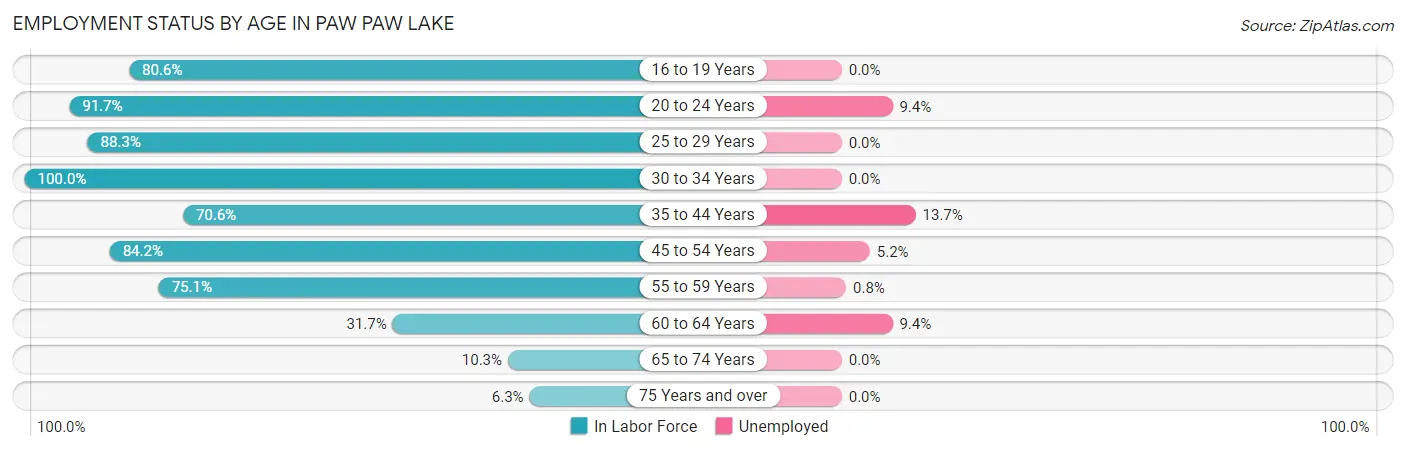
| Age Bracket | In Labor Force | Unemployed |
| 16 to 19 Years | 25 (80.6%) | 0 (0.0%) |
| 20 to 24 Years | 319 (91.7%) | 30 (9.4%) |
| 25 to 29 Years | 227 (88.3%) | 0 (0.0%) |
| 30 to 34 Years | 110 (100.0%) | 0 (0.0%) |
| 35 to 44 Years | 284 (70.6%) | 39 (13.7%) |
| 45 to 54 Years | 250 (84.2%) | 13 (5.2%) |
| 55 to 59 Years | 133 (75.1%) | 1 (0.8%) |
| 60 to 64 Years | 138 (31.7%) | 13 (9.4%) |
| 65 to 74 Years | 37 (10.3%) | 0 (0.0%) |
| 75 Years and over | 32 (6.3%) | 0 (0.0%) |
| Total | 1,555 (53.2%) | 96 (6.2%) |
Employment Status by Educational Attainment in Paw Paw Lake
According to labor force statistics for Paw Paw Lake, 68.1% of individuals (1,143) out of the total population between 25 and 64 years of age (1,678) are in the labor force, with 5.8% or 66 of them being unemployed. The group with the highest labor force participation rate are those with the educational attainment of bachelor's degree or higher, with 82.7% or 415 individuals in the labor force. Within the labor force, individuals with high school diploma education have the highest percentage of unemployment, with 12.0% or 52 of them being unemployed.
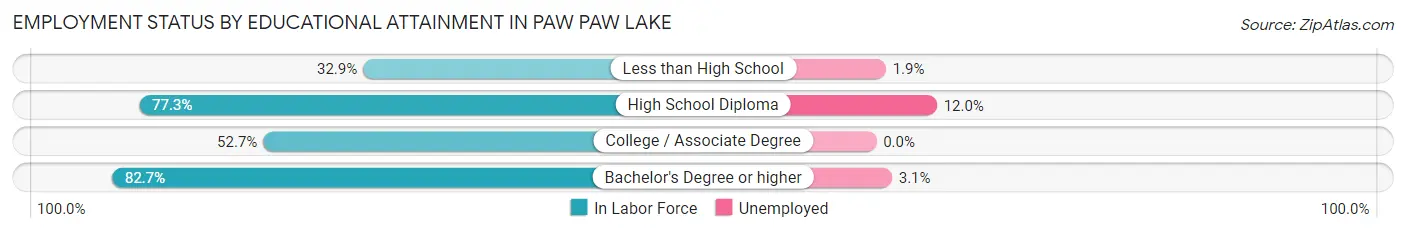
| Educational Attainment | In Labor Force | Unemployed |
| Less than High School | 52 (32.9%) | 3 (1.9%) |
| High School Diploma | 435 (77.3%) | 68 (12.0%) |
| College / Associate Degree | 240 (52.7%) | 0 (0.0%) |
| Bachelor's Degree or higher | 415 (82.7%) | 16 (3.1%) |
| Total | 1,143 (68.1%) | 97 (5.8%) |
Employment Occupations by Sex in Paw Paw Lake
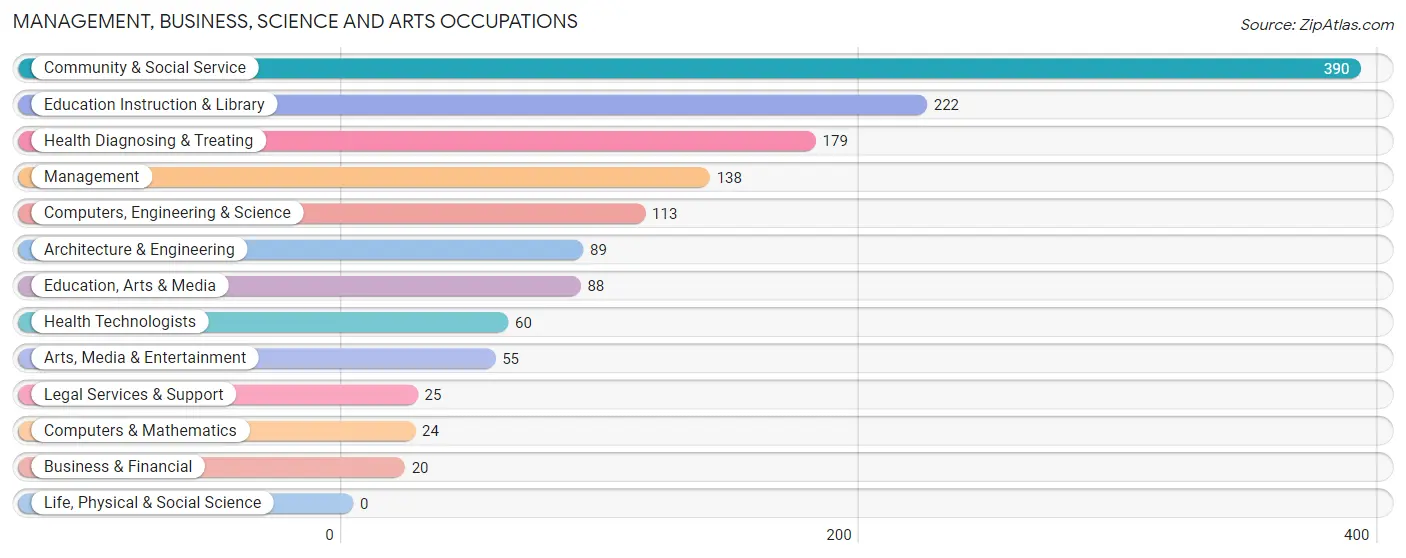
Management, Business, Science and Arts Occupations
The most common Management, Business, Science and Arts occupations in Paw Paw Lake are Community & Social Service (390 | 26.7%), Education Instruction & Library (222 | 15.2%), Health Diagnosing & Treating (179 | 12.3%), Management (138 | 9.5%), and Computers, Engineering & Science (113 | 7.7%).
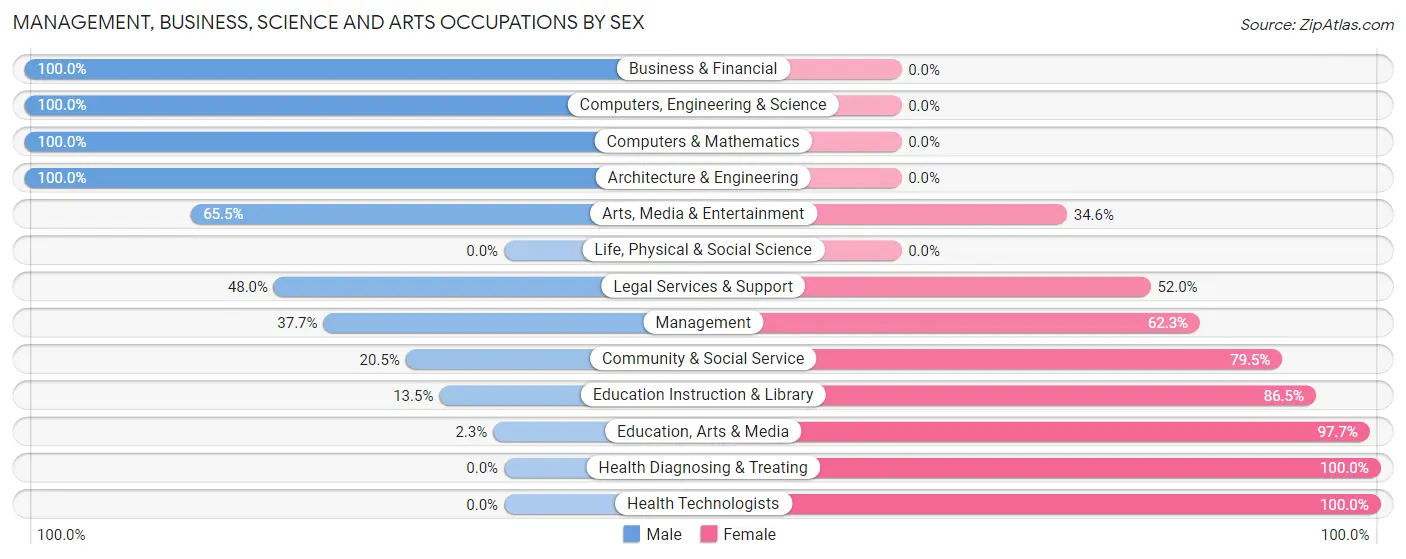
Management, Business, Science and Arts Occupations by Sex
Within the Management, Business, Science and Arts occupations in Paw Paw Lake, the most male-oriented occupations are Business & Financial (100.0%), Computers, Engineering & Science (100.0%), and Computers & Mathematics (100.0%), while the most female-oriented occupations are Health Diagnosing & Treating (100.0%), Health Technologists (100.0%), and Education, Arts & Media (97.7%).
| Occupation | Male | Female |
| Management | 52 (37.7%) | 86 (62.3%) |
| Business & Financial | 20 (100.0%) | 0 (0.0%) |
| Computers, Engineering & Science | 113 (100.0%) | 0 (0.0%) |
| Computers & Mathematics | 24 (100.0%) | 0 (0.0%) |
| Architecture & Engineering | 89 (100.0%) | 0 (0.0%) |
| Life, Physical & Social Science | 0 (0.0%) | 0 (0.0%) |
| Community & Social Service | 80 (20.5%) | 310 (79.5%) |
| Education, Arts & Media | 2 (2.3%) | 86 (97.7%) |
| Legal Services & Support | 12 (48.0%) | 13 (52.0%) |
| Education Instruction & Library | 30 (13.5%) | 192 (86.5%) |
| Arts, Media & Entertainment | 36 (65.4%) | 19 (34.5%) |
| Health Diagnosing & Treating | 0 (0.0%) | 179 (100.0%) |
| Health Technologists | 0 (0.0%) | 60 (100.0%) |
| Total (Category) | 265 (31.6%) | 575 (68.4%) |
| Total (Overall) | 647 (44.4%) | 812 (55.6%) |
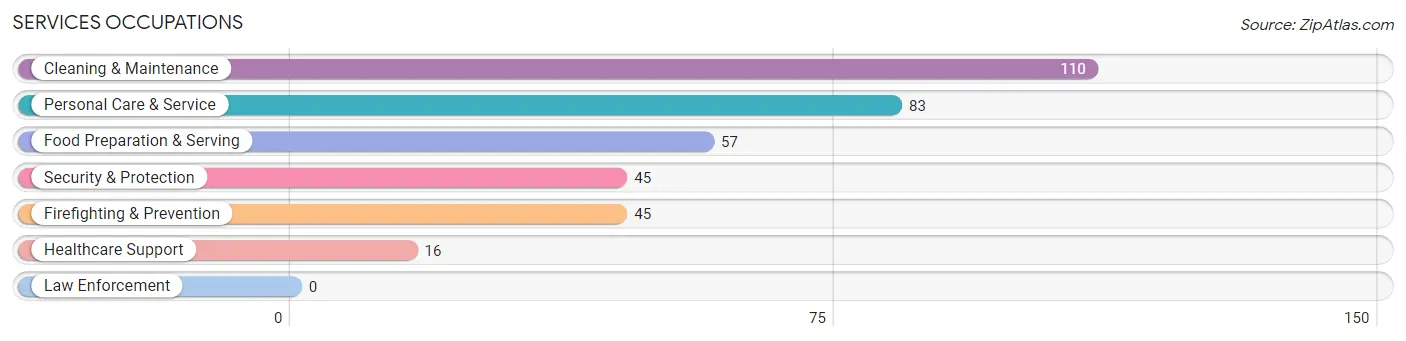
Services Occupations
The most common Services occupations in Paw Paw Lake are Cleaning & Maintenance (110 | 7.5%), Personal Care & Service (83 | 5.7%), Food Preparation & Serving (57 | 3.9%), Security & Protection (45 | 3.1%), and Firefighting & Prevention (45 | 3.1%).
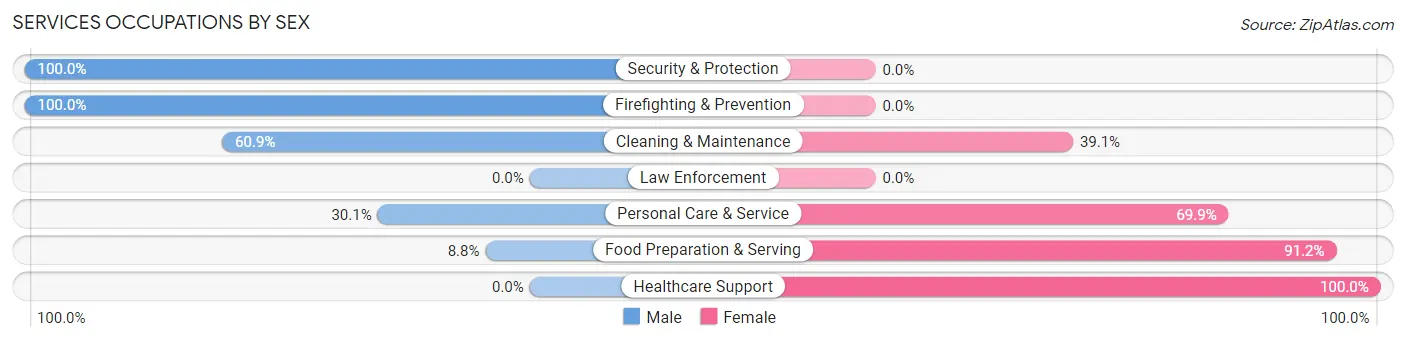
Services Occupations by Sex
Within the Services occupations in Paw Paw Lake, the most male-oriented occupations are Security & Protection (100.0%), Firefighting & Prevention (100.0%), and Cleaning & Maintenance (60.9%), while the most female-oriented occupations are Healthcare Support (100.0%), Food Preparation & Serving (91.2%), and Personal Care & Service (69.9%).
| Occupation | Male | Female |
| Healthcare Support | 0 (0.0%) | 16 (100.0%) |
| Security & Protection | 45 (100.0%) | 0 (0.0%) |
| Firefighting & Prevention | 45 (100.0%) | 0 (0.0%) |
| Law Enforcement | 0 (0.0%) | 0 (0.0%) |
| Food Preparation & Serving | 5 (8.8%) | 52 (91.2%) |
| Cleaning & Maintenance | 67 (60.9%) | 43 (39.1%) |
| Personal Care & Service | 25 (30.1%) | 58 (69.9%) |
| Total (Category) | 142 (45.7%) | 169 (54.3%) |
| Total (Overall) | 647 (44.4%) | 812 (55.6%) |
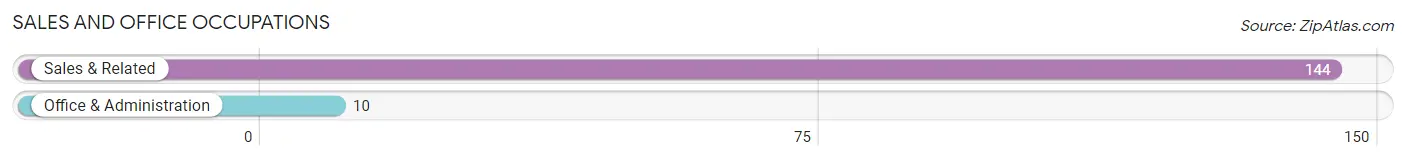
Sales and Office Occupations
The most common Sales and Office occupations in Paw Paw Lake are Sales & Related (144 | 9.9%), and Office & Administration (10 | 0.7%).
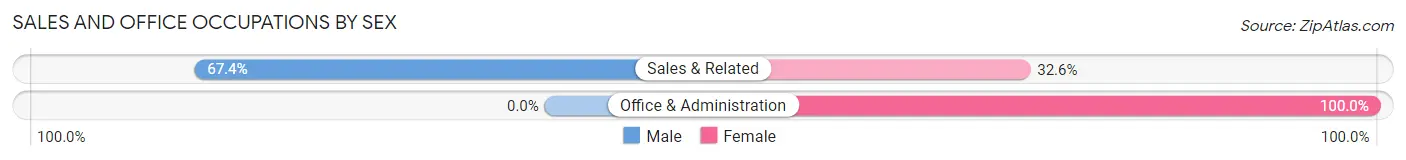
Sales and Office Occupations by Sex
| Occupation | Male | Female |
| Sales & Related | 97 (67.4%) | 47 (32.6%) |
| Office & Administration | 0 (0.0%) | 10 (100.0%) |
| Total (Category) | 97 (63.0%) | 57 (37.0%) |
| Total (Overall) | 647 (44.4%) | 812 (55.6%) |
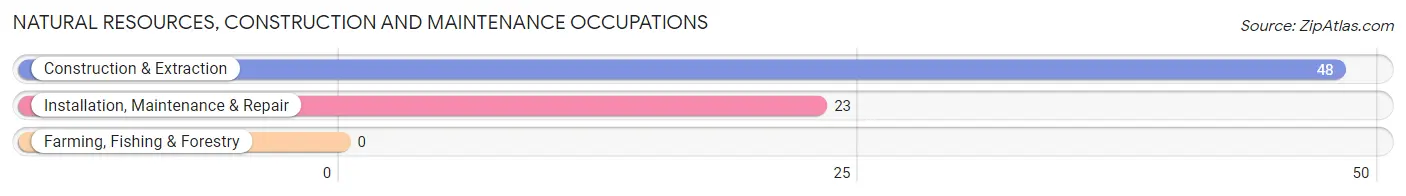
Natural Resources, Construction and Maintenance Occupations
The most common Natural Resources, Construction and Maintenance occupations in Paw Paw Lake are Construction & Extraction (48 | 3.3%), and Installation, Maintenance & Repair (23 | 1.6%).
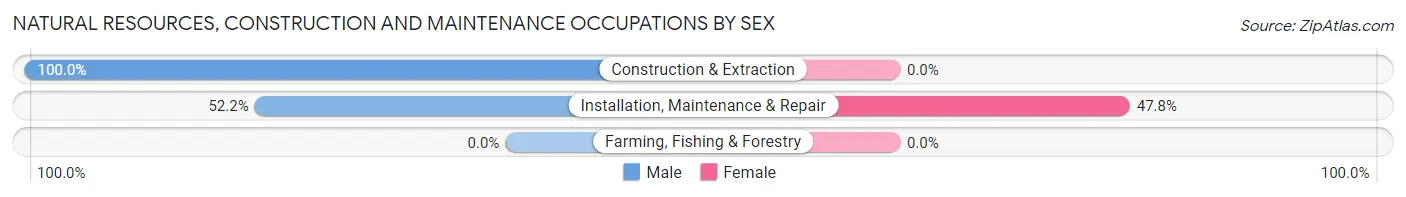
Natural Resources, Construction and Maintenance Occupations by Sex
| Occupation | Male | Female |
| Farming, Fishing & Forestry | 0 (0.0%) | 0 (0.0%) |
| Construction & Extraction | 48 (100.0%) | 0 (0.0%) |
| Installation, Maintenance & Repair | 12 (52.2%) | 11 (47.8%) |
| Total (Category) | 60 (84.5%) | 11 (15.5%) |
| Total (Overall) | 647 (44.4%) | 812 (55.6%) |
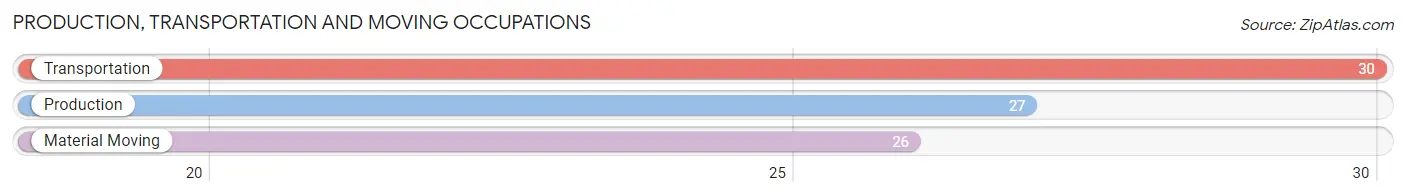
Production, Transportation and Moving Occupations
The most common Production, Transportation and Moving occupations in Paw Paw Lake are Transportation (30 | 2.1%), Production (27 | 1.8%), and Material Moving (26 | 1.8%).
Production, Transportation and Moving Occupations by Sex
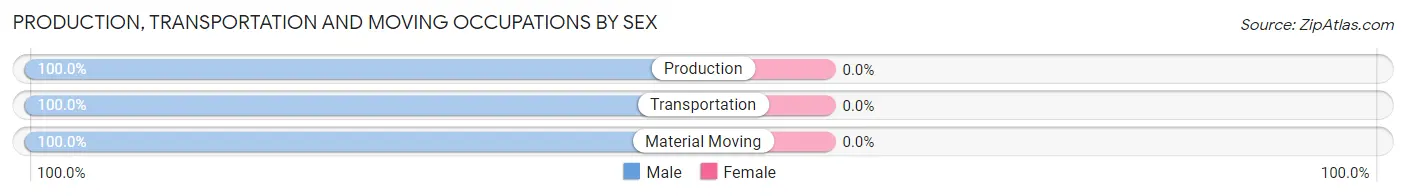
| Occupation | Male | Female |
| Production | 27 (100.0%) | 0 (0.0%) |
| Transportation | 30 (100.0%) | 0 (0.0%) |
| Material Moving | 26 (100.0%) | 0 (0.0%) |
| Total (Category) | 83 (100.0%) | 0 (0.0%) |
| Total (Overall) | 647 (44.4%) | 812 (55.6%) |
Employment Industries by Sex in Paw Paw Lake
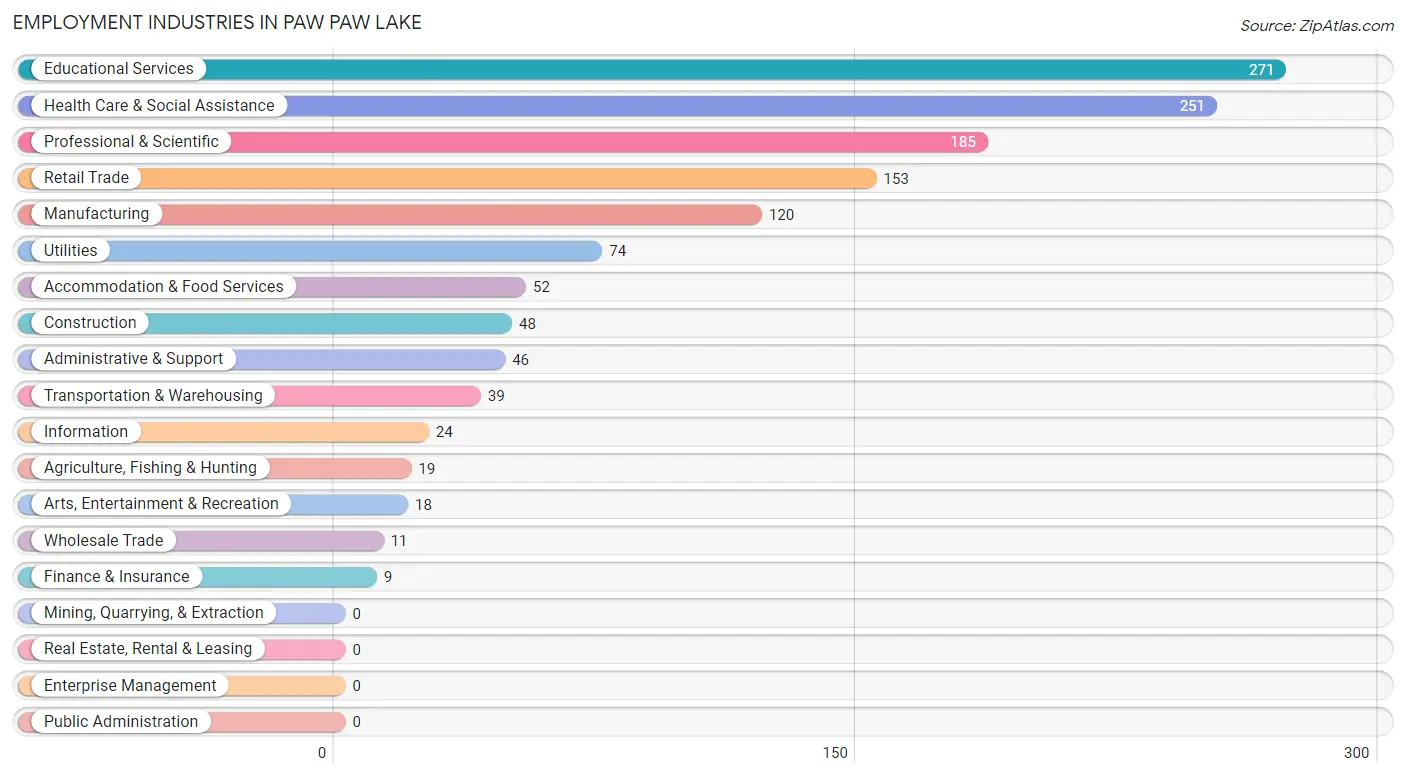
Employment Industries in Paw Paw Lake
The major employment industries in Paw Paw Lake include Educational Services (271 | 18.6%), Health Care & Social Assistance (251 | 17.2%), Professional & Scientific (185 | 12.7%), Retail Trade (153 | 10.5%), and Manufacturing (120 | 8.2%).
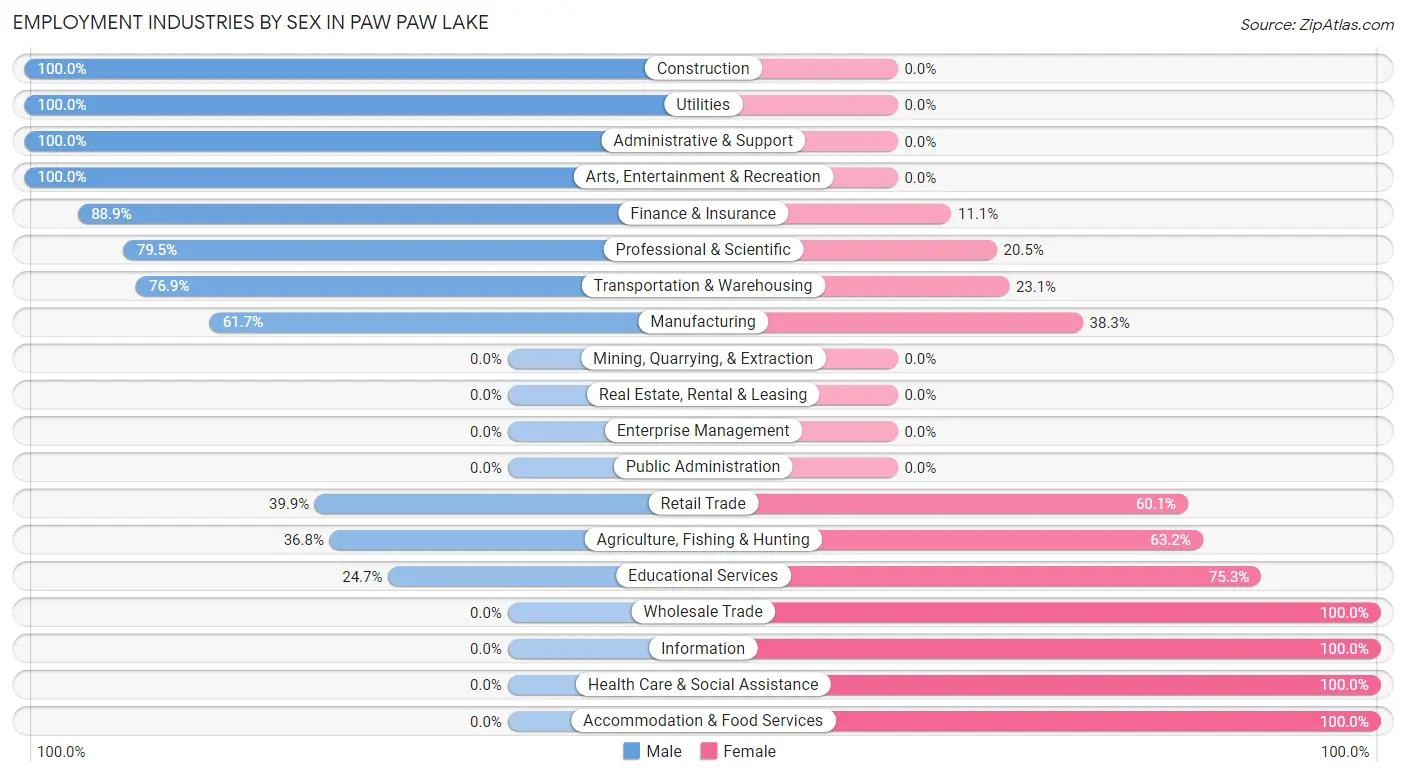
Employment Industries by Sex in Paw Paw Lake
The Paw Paw Lake industries that see more men than women are Construction (100.0%), Utilities (100.0%), and Administrative & Support (100.0%), whereas the industries that tend to have a higher number of women are Wholesale Trade (100.0%), Information (100.0%), and Health Care & Social Assistance (100.0%).
| Industry | Male | Female |
| Agriculture, Fishing & Hunting | 7 (36.8%) | 12 (63.2%) |
| Mining, Quarrying, & Extraction | 0 (0.0%) | 0 (0.0%) |
| Construction | 48 (100.0%) | 0 (0.0%) |
| Manufacturing | 74 (61.7%) | 46 (38.3%) |
| Wholesale Trade | 0 (0.0%) | 11 (100.0%) |
| Retail Trade | 61 (39.9%) | 92 (60.1%) |
| Transportation & Warehousing | 30 (76.9%) | 9 (23.1%) |
| Utilities | 74 (100.0%) | 0 (0.0%) |
| Information | 0 (0.0%) | 24 (100.0%) |
| Finance & Insurance | 8 (88.9%) | 1 (11.1%) |
| Real Estate, Rental & Leasing | 0 (0.0%) | 0 (0.0%) |
| Professional & Scientific | 147 (79.5%) | 38 (20.5%) |
| Enterprise Management | 0 (0.0%) | 0 (0.0%) |
| Administrative & Support | 46 (100.0%) | 0 (0.0%) |
| Educational Services | 67 (24.7%) | 204 (75.3%) |
| Health Care & Social Assistance | 0 (0.0%) | 251 (100.0%) |
| Arts, Entertainment & Recreation | 18 (100.0%) | 0 (0.0%) |
| Accommodation & Food Services | 0 (0.0%) | 52 (100.0%) |
| Public Administration | 0 (0.0%) | 0 (0.0%) |
| Total | 647 (44.4%) | 812 (55.6%) |
Education in Paw Paw Lake
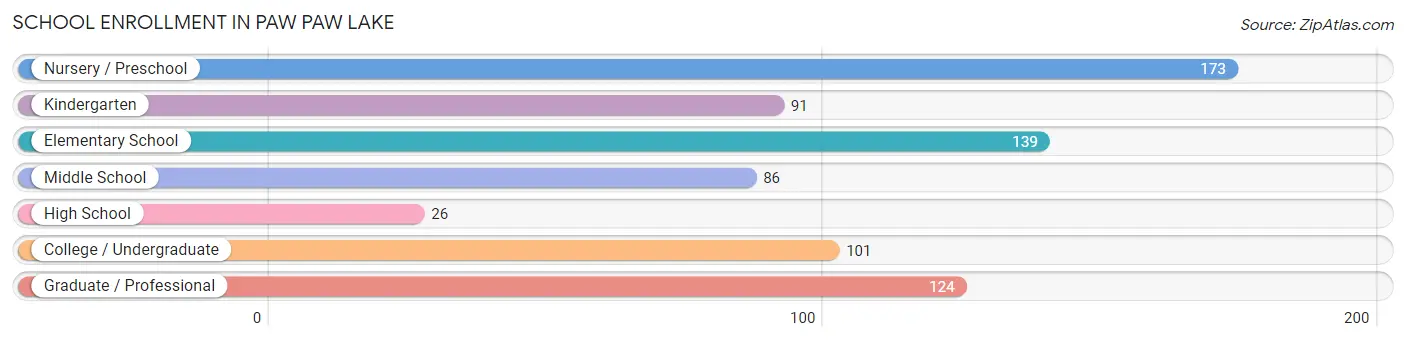
School Enrollment in Paw Paw Lake
The most common levels of schooling among the 740 students in Paw Paw Lake are nursery / preschool (173 | 23.4%), elementary school (139 | 18.8%), and graduate / professional (124 | 16.8%).
| School Level | # Students | % Students |
| Nursery / Preschool | 173 | 23.4% |
| Kindergarten | 91 | 12.3% |
| Elementary School | 139 | 18.8% |
| Middle School | 86 | 11.6% |
| High School | 26 | 3.5% |
| College / Undergraduate | 101 | 13.7% |
| Graduate / Professional | 124 | 16.8% |
| Total | 740 | 100.0% |
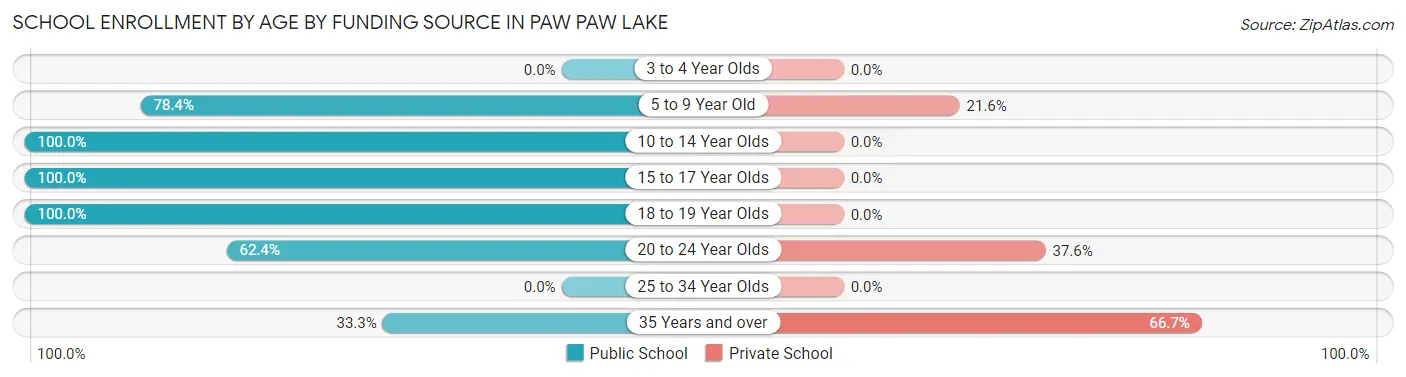
School Enrollment by Age by Funding Source in Paw Paw Lake
Out of a total of 740 students who are enrolled in schools in Paw Paw Lake, 175 (23.6%) attend a private institution, while the remaining 565 (76.4%) are enrolled in public schools. The age group of 35 years and over has the highest likelihood of being enrolled in private schools, with 12 (66.7% in the age bracket) enrolled. Conversely, the age group of 10 to 14 year olds has the lowest likelihood of being enrolled in a private school, with 86 (100.0% in the age bracket) attending a public institution.
| Age Bracket | Public School | Private School |
| 3 to 4 Year Olds | 0 (0.0%) | 0 (0.0%) |
| 5 to 9 Year Old | 316 (78.4%) | 87 (21.6%) |
| 10 to 14 Year Olds | 86 (100.0%) | 0 (0.0%) |
| 15 to 17 Year Olds | 26 (100.0%) | 0 (0.0%) |
| 18 to 19 Year Olds | 5 (100.0%) | 0 (0.0%) |
| 20 to 24 Year Olds | 126 (62.4%) | 76 (37.6%) |
| 25 to 34 Year Olds | 0 (0.0%) | 0 (0.0%) |
| 35 Years and over | 6 (33.3%) | 12 (66.7%) |
| Total | 565 (76.4%) | 175 (23.6%) |
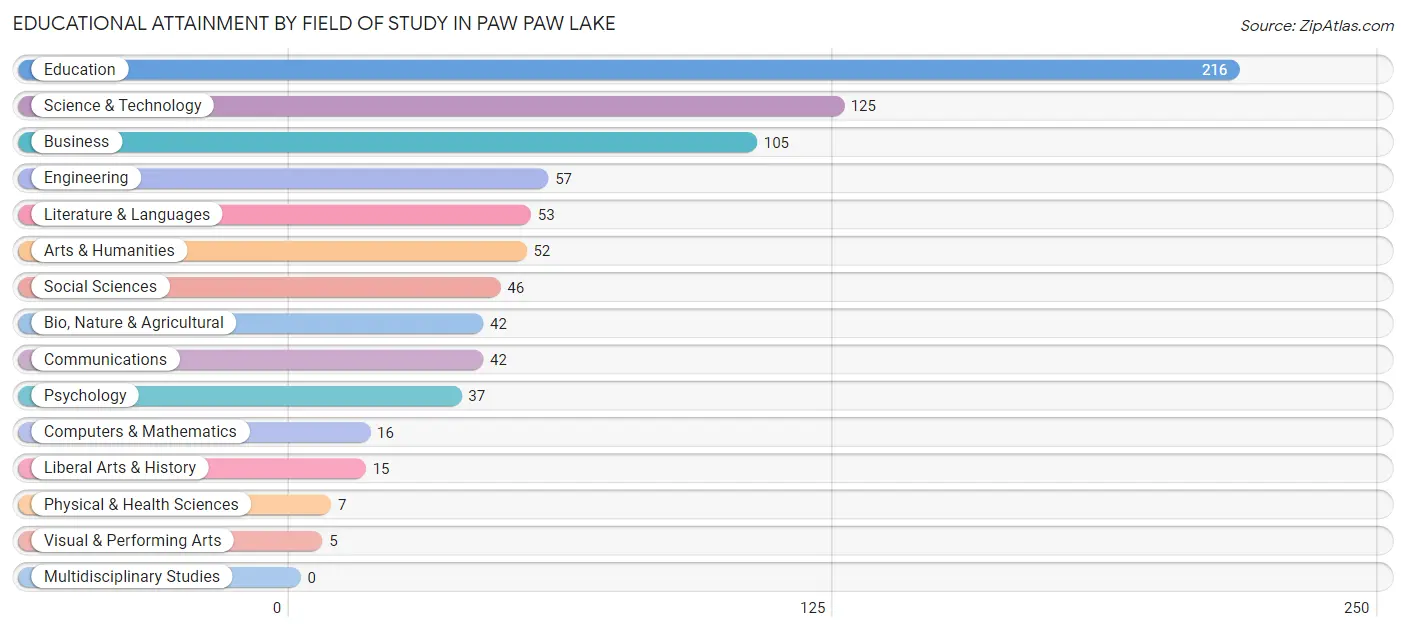
Educational Attainment by Field of Study in Paw Paw Lake
Education (216 | 26.4%), science & technology (125 | 15.3%), business (105 | 12.8%), engineering (57 | 7.0%), and literature & languages (53 | 6.5%) are the most common fields of study among 818 individuals in Paw Paw Lake who have obtained a bachelor's degree or higher.
| Field of Study | # Graduates | % Graduates |
| Computers & Mathematics | 16 | 2.0% |
| Bio, Nature & Agricultural | 42 | 5.1% |
| Physical & Health Sciences | 7 | 0.9% |
| Psychology | 37 | 4.5% |
| Social Sciences | 46 | 5.6% |
| Engineering | 57 | 7.0% |
| Multidisciplinary Studies | 0 | 0.0% |
| Science & Technology | 125 | 15.3% |
| Business | 105 | 12.8% |
| Education | 216 | 26.4% |
| Literature & Languages | 53 | 6.5% |
| Liberal Arts & History | 15 | 1.8% |
| Visual & Performing Arts | 5 | 0.6% |
| Communications | 42 | 5.1% |
| Arts & Humanities | 52 | 6.4% |
| Total | 818 | 100.0% |
Transportation & Commute in Paw Paw Lake
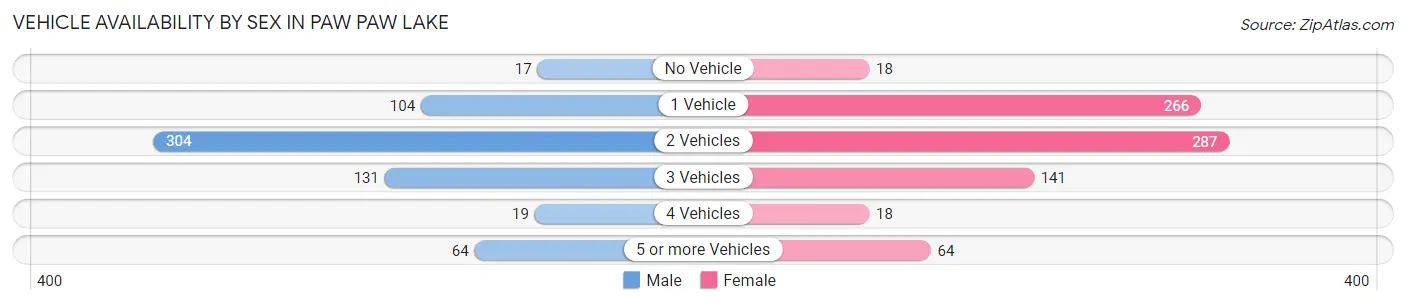
Vehicle Availability by Sex in Paw Paw Lake
The most prevalent vehicle ownership categories in Paw Paw Lake are males with 2 vehicles (304, accounting for 47.6%) and females with 2 vehicles (287, making up 38.3%).
| Vehicles Available | Male | Female |
| No Vehicle | 17 (2.7%) | 18 (2.3%) |
| 1 Vehicle | 104 (16.3%) | 266 (33.5%) |
| 2 Vehicles | 304 (47.6%) | 287 (36.1%) |
| 3 Vehicles | 131 (20.5%) | 141 (17.8%) |
| 4 Vehicles | 19 (3.0%) | 18 (2.3%) |
| 5 or more Vehicles | 64 (10.0%) | 64 (8.1%) |
| Total | 639 (100.0%) | 794 (100.0%) |
Commute Time in Paw Paw Lake
The most frequently occuring commute durations in Paw Paw Lake are 20 to 24 minutes (235 commuters, 17.4%), 5 to 9 minutes (206 commuters, 15.2%), and 25 to 29 minutes (197 commuters, 14.5%).
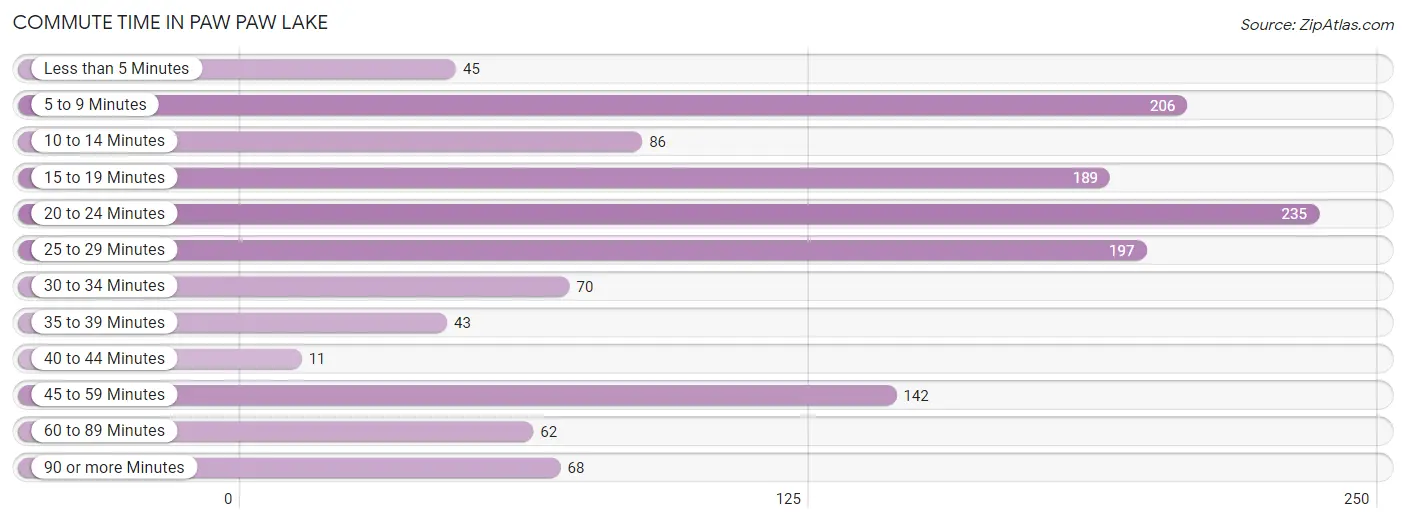
| Commute Time | # Commuters | % Commuters |
| Less than 5 Minutes | 45 | 3.3% |
| 5 to 9 Minutes | 206 | 15.2% |
| 10 to 14 Minutes | 86 | 6.4% |
| 15 to 19 Minutes | 189 | 14.0% |
| 20 to 24 Minutes | 235 | 17.4% |
| 25 to 29 Minutes | 197 | 14.5% |
| 30 to 34 Minutes | 70 | 5.2% |
| 35 to 39 Minutes | 43 | 3.2% |
| 40 to 44 Minutes | 11 | 0.8% |
| 45 to 59 Minutes | 142 | 10.5% |
| 60 to 89 Minutes | 62 | 4.6% |
| 90 or more Minutes | 68 | 5.0% |
Commute Time by Sex in Paw Paw Lake
The most common commute times in Paw Paw Lake are 20 to 24 minutes (135 commuters, 22.6%) for males and 5 to 9 minutes (182 commuters, 24.1%) for females.
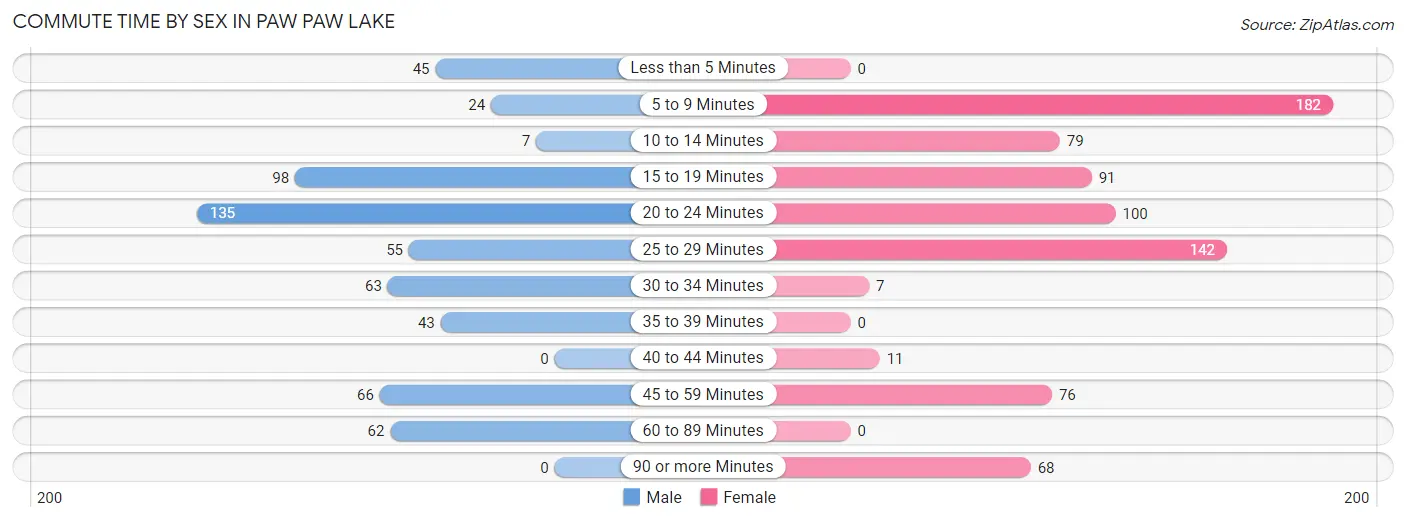
| Commute Time | Male | Female |
| Less than 5 Minutes | 45 (7.5%) | 0 (0.0%) |
| 5 to 9 Minutes | 24 (4.0%) | 182 (24.1%) |
| 10 to 14 Minutes | 7 (1.2%) | 79 (10.4%) |
| 15 to 19 Minutes | 98 (16.4%) | 91 (12.0%) |
| 20 to 24 Minutes | 135 (22.6%) | 100 (13.2%) |
| 25 to 29 Minutes | 55 (9.2%) | 142 (18.8%) |
| 30 to 34 Minutes | 63 (10.5%) | 7 (0.9%) |
| 35 to 39 Minutes | 43 (7.2%) | 0 (0.0%) |
| 40 to 44 Minutes | 0 (0.0%) | 11 (1.5%) |
| 45 to 59 Minutes | 66 (11.0%) | 76 (10.1%) |
| 60 to 89 Minutes | 62 (10.4%) | 0 (0.0%) |
| 90 or more Minutes | 0 (0.0%) | 68 (9.0%) |
Time of Departure to Work by Sex in Paw Paw Lake
The most frequent times of departure to work in Paw Paw Lake are 7:30 AM to 7:59 AM (173, 28.9%) for males and 4:00 PM to 11:59 PM (146, 19.3%) for females.
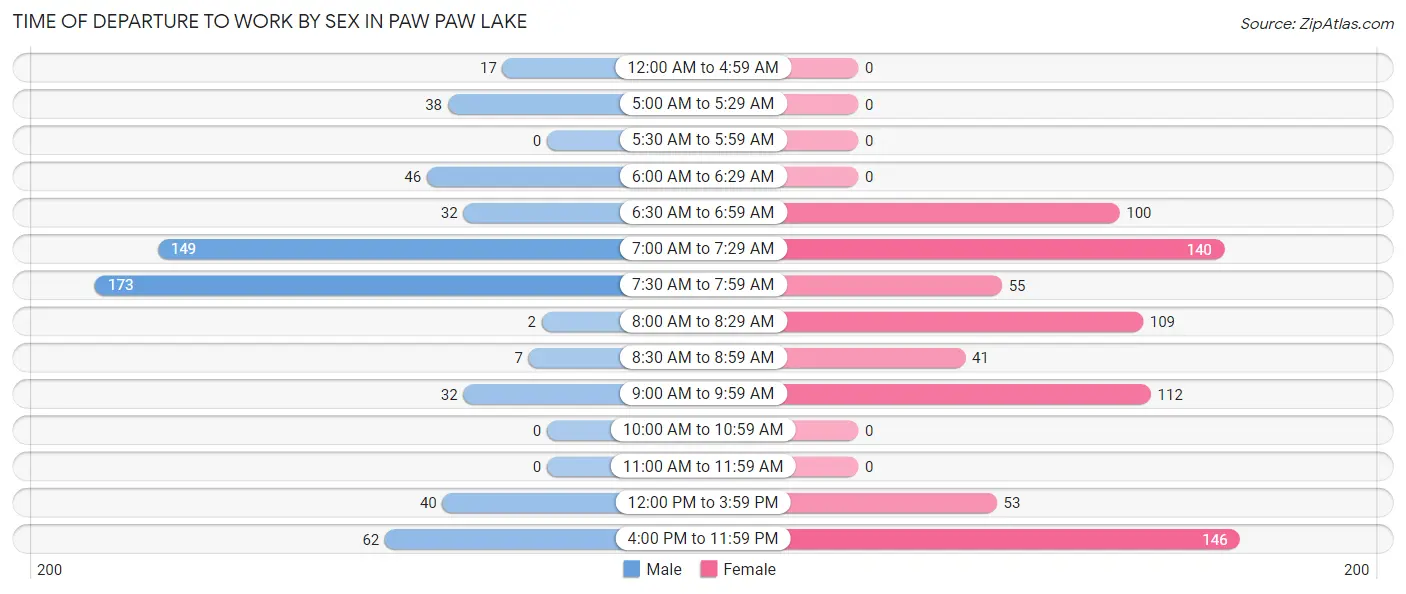
| Time of Departure | Male | Female |
| 12:00 AM to 4:59 AM | 17 (2.8%) | 0 (0.0%) |
| 5:00 AM to 5:29 AM | 38 (6.4%) | 0 (0.0%) |
| 5:30 AM to 5:59 AM | 0 (0.0%) | 0 (0.0%) |
| 6:00 AM to 6:29 AM | 46 (7.7%) | 0 (0.0%) |
| 6:30 AM to 6:59 AM | 32 (5.3%) | 100 (13.2%) |
| 7:00 AM to 7:29 AM | 149 (24.9%) | 140 (18.5%) |
| 7:30 AM to 7:59 AM | 173 (28.9%) | 55 (7.3%) |
| 8:00 AM to 8:29 AM | 2 (0.3%) | 109 (14.4%) |
| 8:30 AM to 8:59 AM | 7 (1.2%) | 41 (5.4%) |
| 9:00 AM to 9:59 AM | 32 (5.3%) | 112 (14.8%) |
| 10:00 AM to 10:59 AM | 0 (0.0%) | 0 (0.0%) |
| 11:00 AM to 11:59 AM | 0 (0.0%) | 0 (0.0%) |
| 12:00 PM to 3:59 PM | 40 (6.7%) | 53 (7.0%) |
| 4:00 PM to 11:59 PM | 62 (10.4%) | 146 (19.3%) |
| Total | 598 (100.0%) | 756 (100.0%) |
Housing Occupancy in Paw Paw Lake
Occupancy by Ownership in Paw Paw Lake
Of the total 1,580 dwellings in Paw Paw Lake, owner-occupied units account for 1,235 (78.2%), while renter-occupied units make up 345 (21.8%).
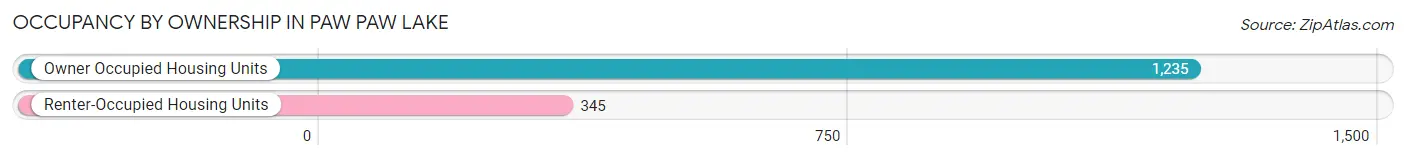
| Occupancy | # Housing Units | % Housing Units |
| Owner Occupied Housing Units | 1,235 | 78.2% |
| Renter-Occupied Housing Units | 345 | 21.8% |
| Total Occupied Housing Units | 1,580 | 100.0% |
Occupancy by Household Size in Paw Paw Lake
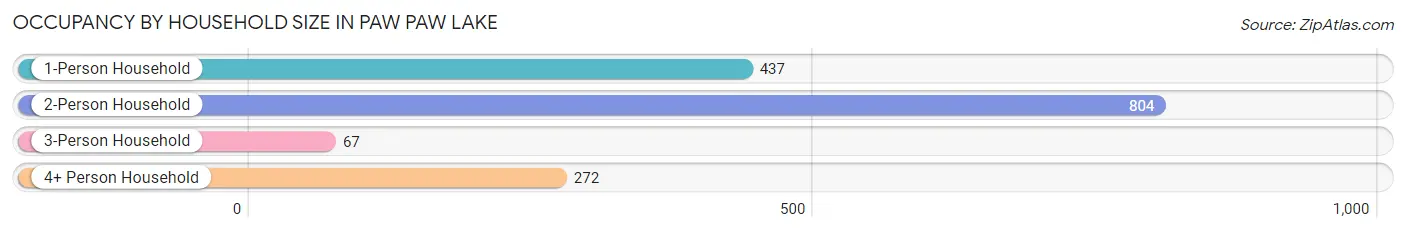
| Household Size | # Housing Units | % Housing Units |
| 1-Person Household | 437 | 27.7% |
| 2-Person Household | 804 | 50.9% |
| 3-Person Household | 67 | 4.2% |
| 4+ Person Household | 272 | 17.2% |
| Total Housing Units | 1,580 | 100.0% |
Occupancy by Ownership by Household Size in Paw Paw Lake
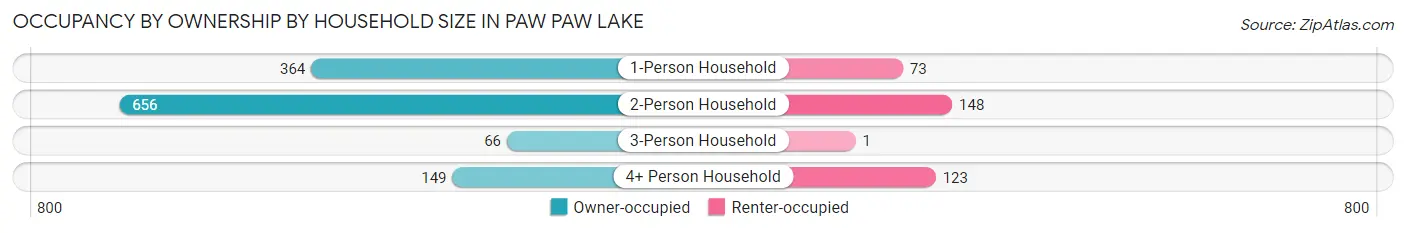
| Household Size | Owner-occupied | Renter-occupied |
| 1-Person Household | 364 (83.3%) | 73 (16.7%) |
| 2-Person Household | 656 (81.6%) | 148 (18.4%) |
| 3-Person Household | 66 (98.5%) | 1 (1.5%) |
| 4+ Person Household | 149 (54.8%) | 123 (45.2%) |
| Total Housing Units | 1,235 (78.2%) | 345 (21.8%) |
Occupancy by Educational Attainment in Paw Paw Lake
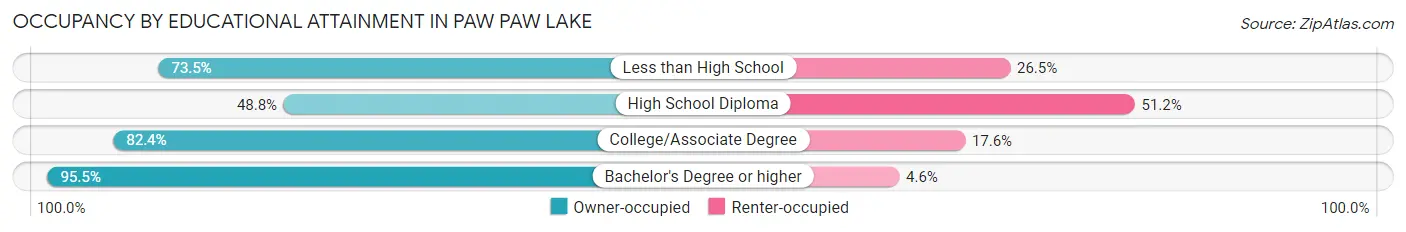
| Household Size | Owner-occupied | Renter-occupied |
| Less than High School | 119 (73.5%) | 43 (26.5%) |
| High School Diploma | 180 (48.8%) | 189 (51.2%) |
| College/Associate Degree | 412 (82.4%) | 88 (17.6%) |
| Bachelor's Degree or higher | 524 (95.5%) | 25 (4.5%) |
Occupancy by Age of Householder in Paw Paw Lake
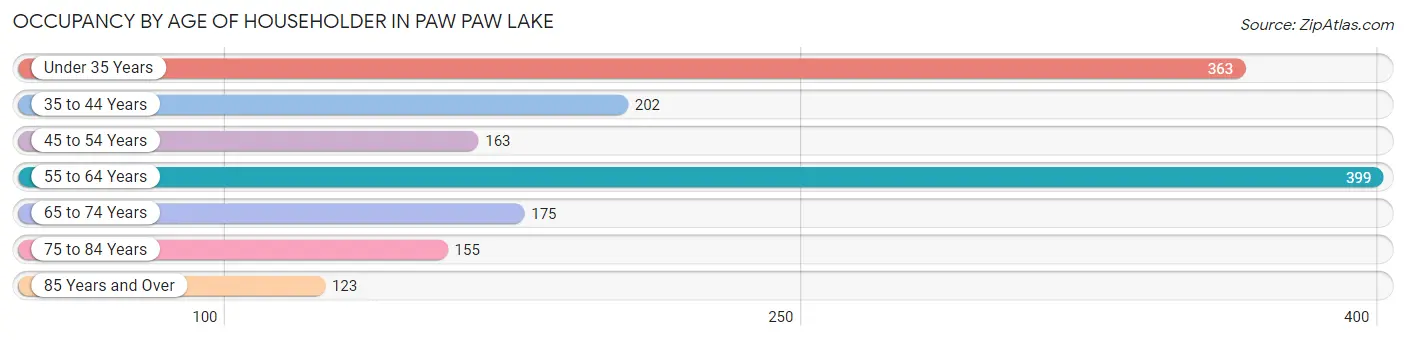
| Age Bracket | # Households | % Households |
| Under 35 Years | 363 | 23.0% |
| 35 to 44 Years | 202 | 12.8% |
| 45 to 54 Years | 163 | 10.3% |
| 55 to 64 Years | 399 | 25.3% |
| 65 to 74 Years | 175 | 11.1% |
| 75 to 84 Years | 155 | 9.8% |
| 85 Years and Over | 123 | 7.8% |
| Total | 1,580 | 100.0% |
Housing Finances in Paw Paw Lake
Median Income by Occupancy in Paw Paw Lake
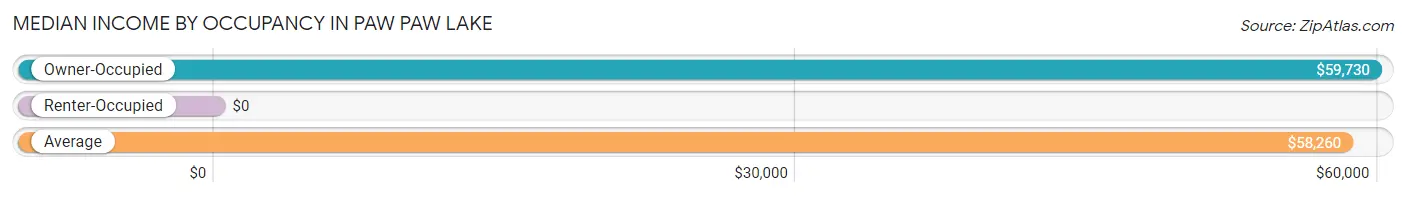
| Occupancy Type | # Households | Median Income |
| Owner-Occupied | 1,235 (78.2%) | $59,730 |
| Renter-Occupied | 345 (21.8%) | $0 |
| Average | 1,580 (100.0%) | $58,260 |
Occupancy by Householder Income Bracket in Paw Paw Lake
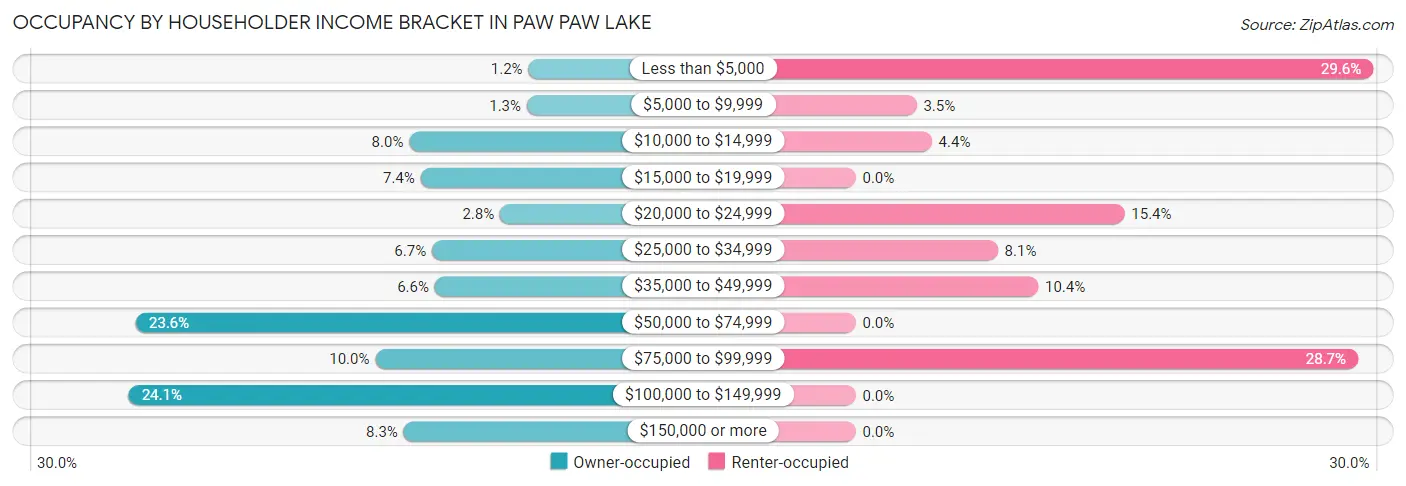
| Income Bracket | Owner-occupied | Renter-occupied |
| Less than $5,000 | 15 (1.2%) | 102 (29.6%) |
| $5,000 to $9,999 | 16 (1.3%) | 12 (3.5%) |
| $10,000 to $14,999 | 99 (8.0%) | 15 (4.3%) |
| $15,000 to $19,999 | 91 (7.4%) | 0 (0.0%) |
| $20,000 to $24,999 | 35 (2.8%) | 53 (15.4%) |
| $25,000 to $34,999 | 83 (6.7%) | 28 (8.1%) |
| $35,000 to $49,999 | 81 (6.6%) | 36 (10.4%) |
| $50,000 to $74,999 | 292 (23.6%) | 0 (0.0%) |
| $75,000 to $99,999 | 123 (10.0%) | 99 (28.7%) |
| $100,000 to $149,999 | 297 (24.0%) | 0 (0.0%) |
| $150,000 or more | 103 (8.3%) | 0 (0.0%) |
| Total | 1,235 (100.0%) | 345 (100.0%) |
Monthly Housing Cost Tiers in Paw Paw Lake
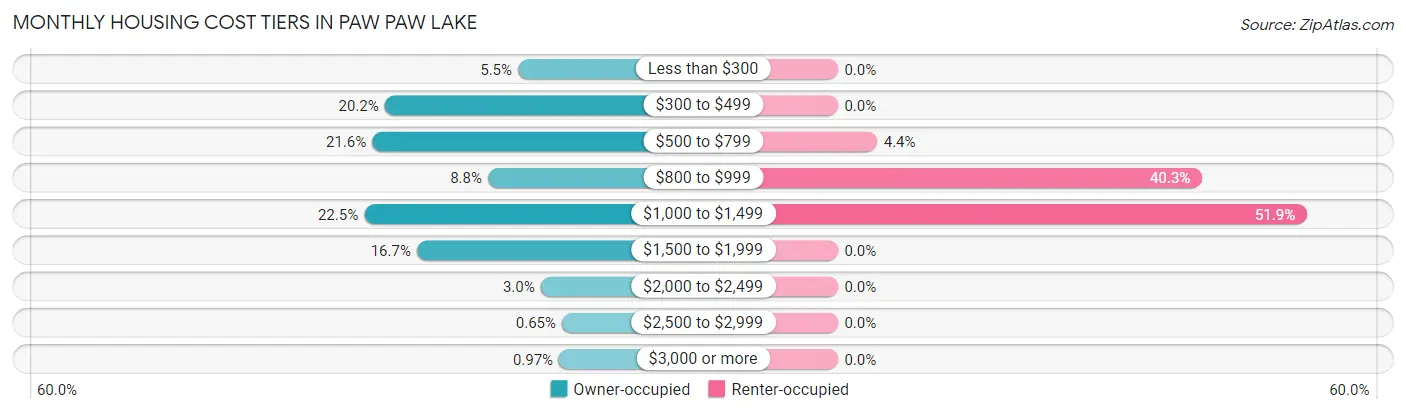
| Monthly Cost | Owner-occupied | Renter-occupied |
| Less than $300 | 68 (5.5%) | 0 (0.0%) |
| $300 to $499 | 250 (20.2%) | 0 (0.0%) |
| $500 to $799 | 267 (21.6%) | 15 (4.3%) |
| $800 to $999 | 109 (8.8%) | 139 (40.3%) |
| $1,000 to $1,499 | 278 (22.5%) | 179 (51.9%) |
| $1,500 to $1,999 | 206 (16.7%) | 0 (0.0%) |
| $2,000 to $2,499 | 37 (3.0%) | 0 (0.0%) |
| $2,500 to $2,999 | 8 (0.6%) | 0 (0.0%) |
| $3,000 or more | 12 (1.0%) | 0 (0.0%) |
| Total | 1,235 (100.0%) | 345 (100.0%) |
Physical Housing Characteristics in Paw Paw Lake
Housing Structures in Paw Paw Lake
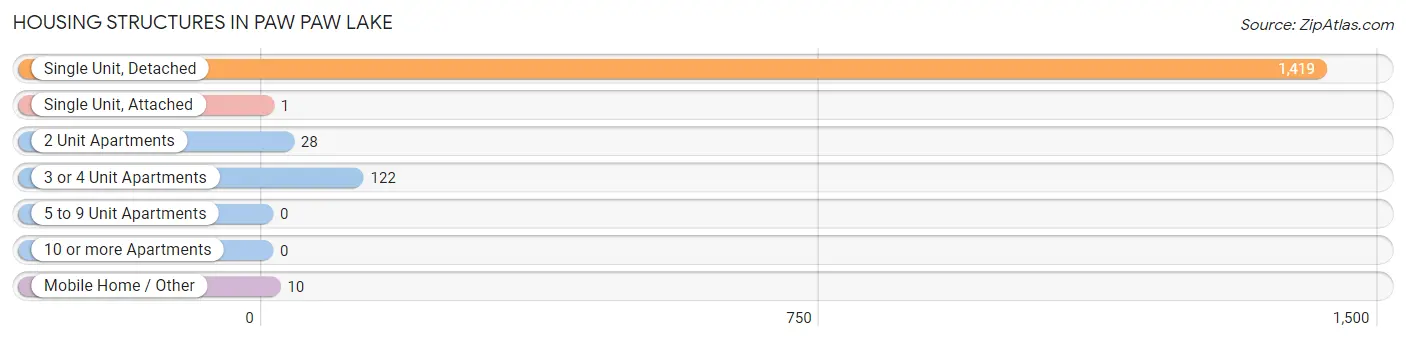
| Structure Type | # Housing Units | % Housing Units |
| Single Unit, Detached | 1,419 | 89.8% |
| Single Unit, Attached | 1 | 0.1% |
| 2 Unit Apartments | 28 | 1.8% |
| 3 or 4 Unit Apartments | 122 | 7.7% |
| 5 to 9 Unit Apartments | 0 | 0.0% |
| 10 or more Apartments | 0 | 0.0% |
| Mobile Home / Other | 10 | 0.6% |
| Total | 1,580 | 100.0% |
Housing Structures by Occupancy in Paw Paw Lake
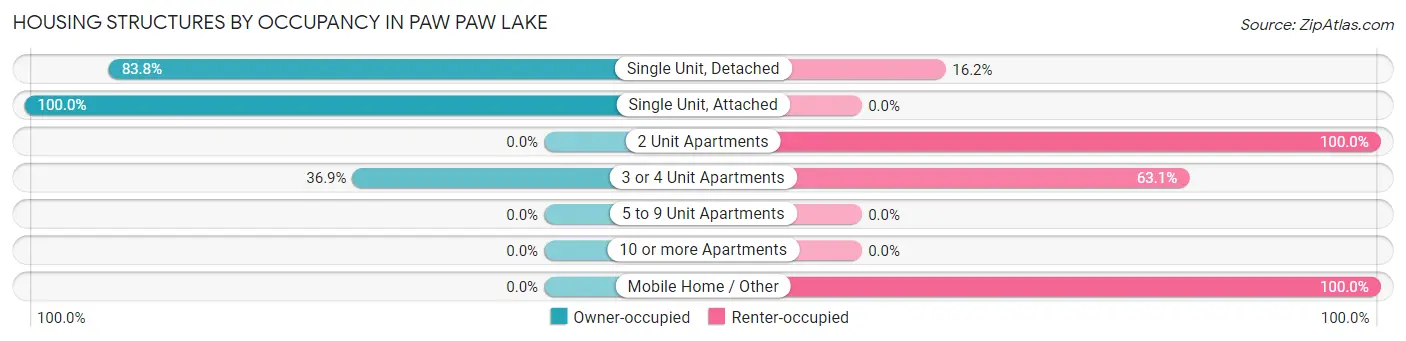
| Structure Type | Owner-occupied | Renter-occupied |
| Single Unit, Detached | 1,189 (83.8%) | 230 (16.2%) |
| Single Unit, Attached | 1 (100.0%) | 0 (0.0%) |
| 2 Unit Apartments | 0 (0.0%) | 28 (100.0%) |
| 3 or 4 Unit Apartments | 45 (36.9%) | 77 (63.1%) |
| 5 to 9 Unit Apartments | 0 (0.0%) | 0 (0.0%) |
| 10 or more Apartments | 0 (0.0%) | 0 (0.0%) |
| Mobile Home / Other | 0 (0.0%) | 10 (100.0%) |
| Total | 1,235 (78.2%) | 345 (21.8%) |
Housing Structures by Number of Rooms in Paw Paw Lake
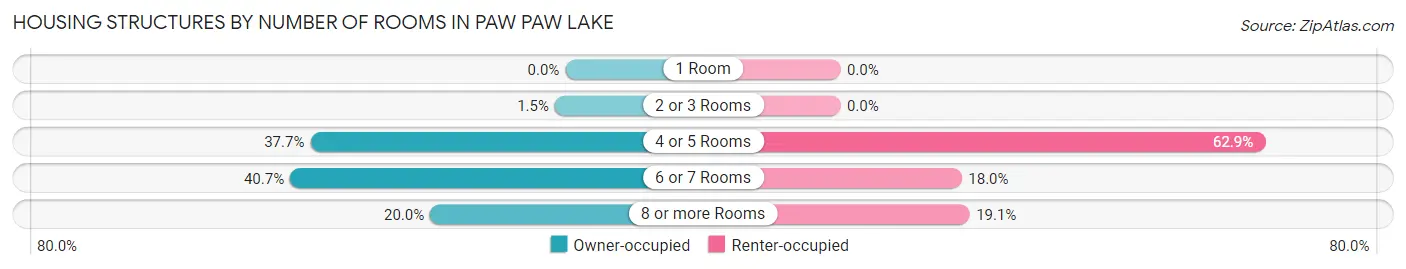
| Number of Rooms | Owner-occupied | Renter-occupied |
| 1 Room | 0 (0.0%) | 0 (0.0%) |
| 2 or 3 Rooms | 19 (1.5%) | 0 (0.0%) |
| 4 or 5 Rooms | 466 (37.7%) | 217 (62.9%) |
| 6 or 7 Rooms | 503 (40.7%) | 62 (18.0%) |
| 8 or more Rooms | 247 (20.0%) | 66 (19.1%) |
| Total | 1,235 (100.0%) | 345 (100.0%) |
Housing Structure by Heating Type in Paw Paw Lake
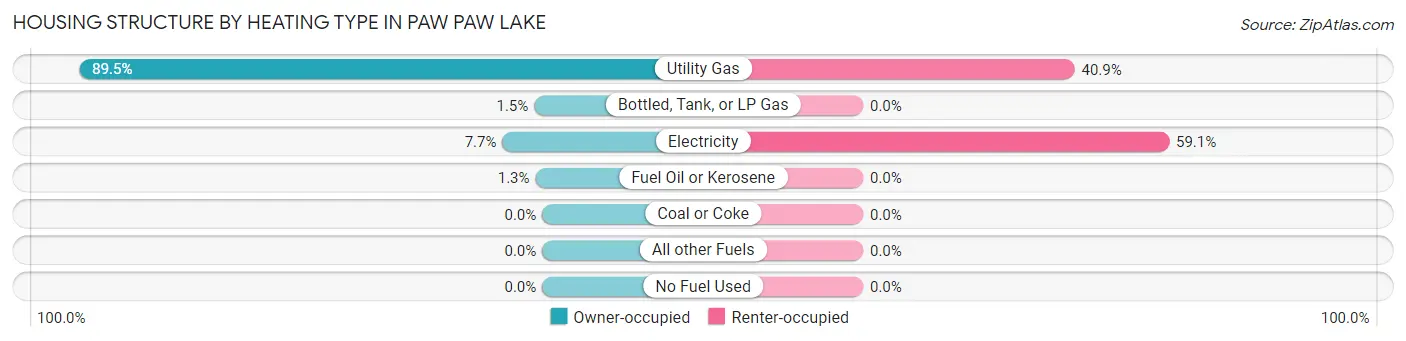
| Heating Type | Owner-occupied | Renter-occupied |
| Utility Gas | 1,105 (89.5%) | 141 (40.9%) |
| Bottled, Tank, or LP Gas | 19 (1.5%) | 0 (0.0%) |
| Electricity | 95 (7.7%) | 204 (59.1%) |
| Fuel Oil or Kerosene | 16 (1.3%) | 0 (0.0%) |
| Coal or Coke | 0 (0.0%) | 0 (0.0%) |
| All other Fuels | 0 (0.0%) | 0 (0.0%) |
| No Fuel Used | 0 (0.0%) | 0 (0.0%) |
| Total | 1,235 (100.0%) | 345 (100.0%) |
Household Vehicle Usage in Paw Paw Lake
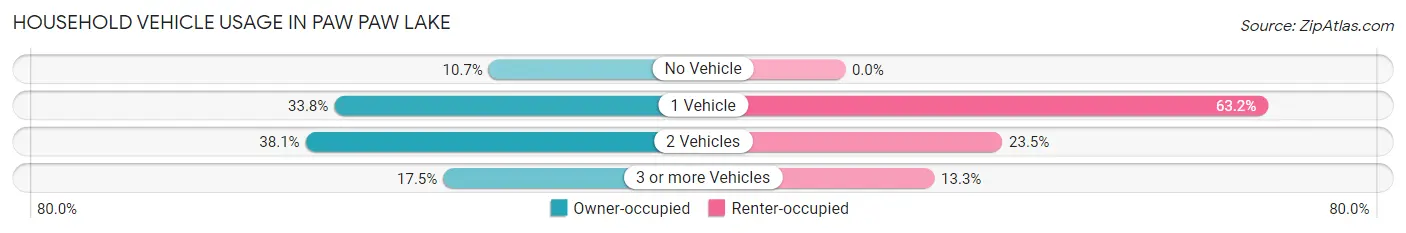
| Vehicles per Household | Owner-occupied | Renter-occupied |
| No Vehicle | 132 (10.7%) | 0 (0.0%) |
| 1 Vehicle | 417 (33.8%) | 218 (63.2%) |
| 2 Vehicles | 470 (38.1%) | 81 (23.5%) |
| 3 or more Vehicles | 216 (17.5%) | 46 (13.3%) |
| Total | 1,235 (100.0%) | 345 (100.0%) |
Real Estate & Mortgages in Paw Paw Lake
Real Estate and Mortgage Overview in Paw Paw Lake
| Characteristic | Without Mortgage | With Mortgage |
| Housing Units | 549 | 686 |
| Median Property Value | $198,800 | $166,400 |
| Median Household Income | $55,344 | $84 |
| Monthly Housing Costs | $473 | $12 |
| Real Estate Taxes | $2,398 | $24 |
Property Value by Mortgage Status in Paw Paw Lake
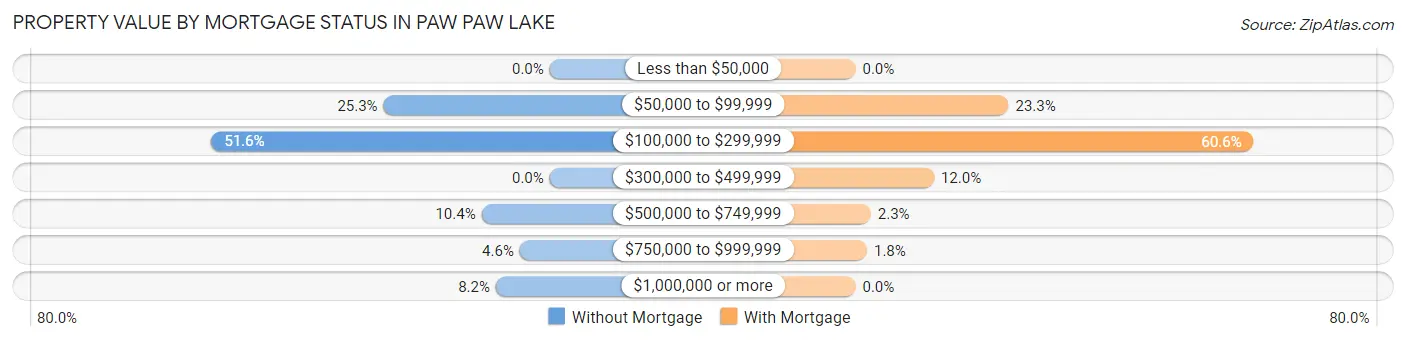
| Property Value | Without Mortgage | With Mortgage |
| Less than $50,000 | 0 (0.0%) | 0 (0.0%) |
| $50,000 to $99,999 | 139 (25.3%) | 160 (23.3%) |
| $100,000 to $299,999 | 283 (51.5%) | 416 (60.6%) |
| $300,000 to $499,999 | 0 (0.0%) | 82 (11.9%) |
| $500,000 to $749,999 | 57 (10.4%) | 16 (2.3%) |
| $750,000 to $999,999 | 25 (4.5%) | 12 (1.8%) |
| $1,000,000 or more | 45 (8.2%) | 0 (0.0%) |
| Total | 549 (100.0%) | 686 (100.0%) |
Household Income by Mortgage Status in Paw Paw Lake
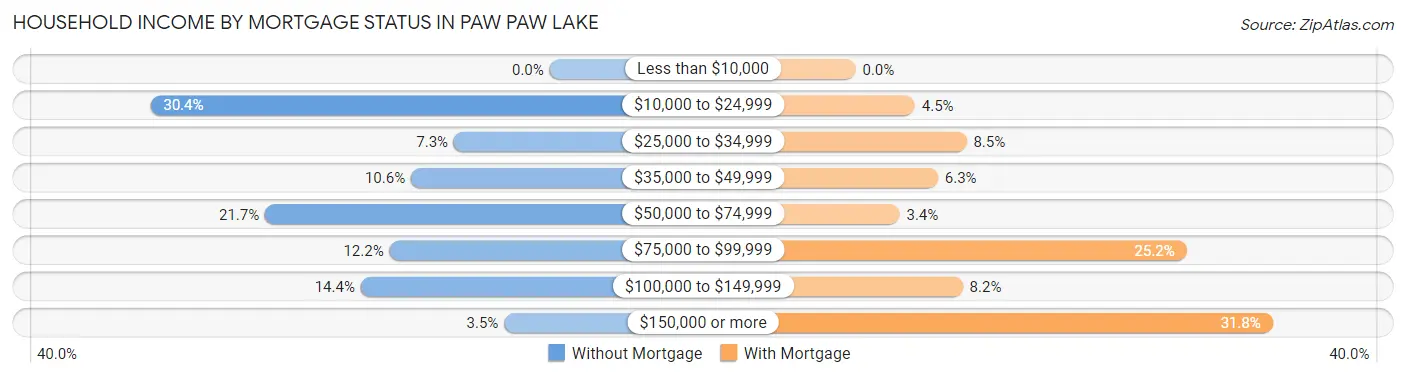
| Household Income | Without Mortgage | With Mortgage |
| Less than $10,000 | 0 (0.0%) | 0 (0.0%) |
| $10,000 to $24,999 | 167 (30.4%) | 31 (4.5%) |
| $25,000 to $34,999 | 40 (7.3%) | 58 (8.5%) |
| $35,000 to $49,999 | 58 (10.6%) | 43 (6.3%) |
| $50,000 to $74,999 | 119 (21.7%) | 23 (3.4%) |
| $75,000 to $99,999 | 67 (12.2%) | 173 (25.2%) |
| $100,000 to $149,999 | 79 (14.4%) | 56 (8.2%) |
| $150,000 or more | 19 (3.5%) | 218 (31.8%) |
| Total | 549 (100.0%) | 686 (100.0%) |
Property Value to Household Income Ratio in Paw Paw Lake
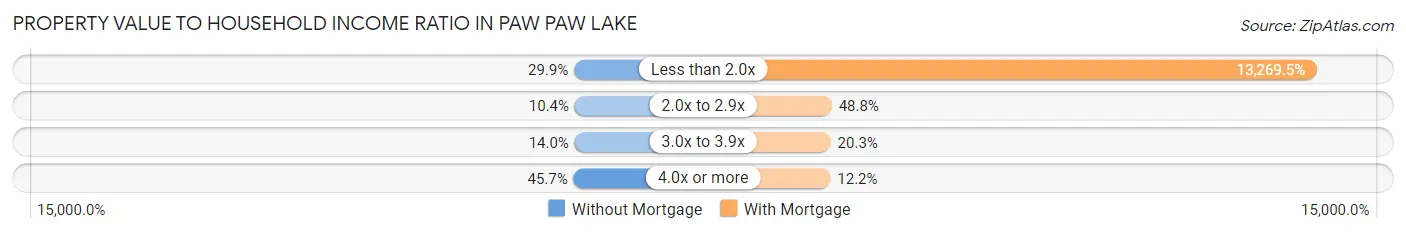
| Value-to-Income Ratio | Without Mortgage | With Mortgage |
| Less than 2.0x | 164 (29.9%) | 91,029 (13,269.5%) |
| 2.0x to 2.9x | 57 (10.4%) | 335 (48.8%) |
| 3.0x to 3.9x | 77 (14.0%) | 139 (20.3%) |
| 4.0x or more | 251 (45.7%) | 84 (12.2%) |
| Total | 549 (100.0%) | 686 (100.0%) |
Real Estate Taxes by Mortgage Status in Paw Paw Lake
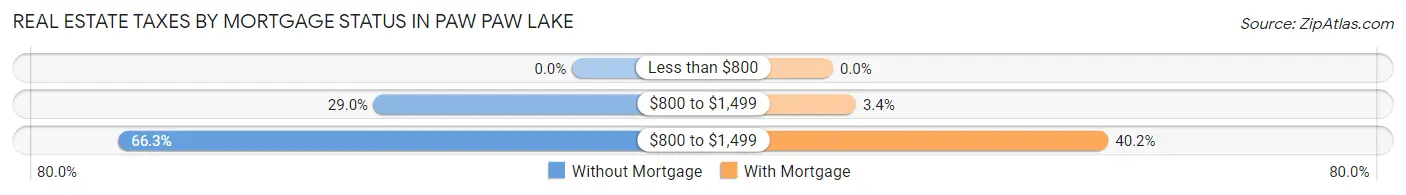
| Property Taxes | Without Mortgage | With Mortgage |
| Less than $800 | 0 (0.0%) | 0 (0.0%) |
| $800 to $1,499 | 159 (29.0%) | 23 (3.4%) |
| $800 to $1,499 | 364 (66.3%) | 276 (40.2%) |
| Total | 549 (100.0%) | 686 (100.0%) |
Health & Disability in Paw Paw Lake
Health Insurance Coverage by Age in Paw Paw Lake
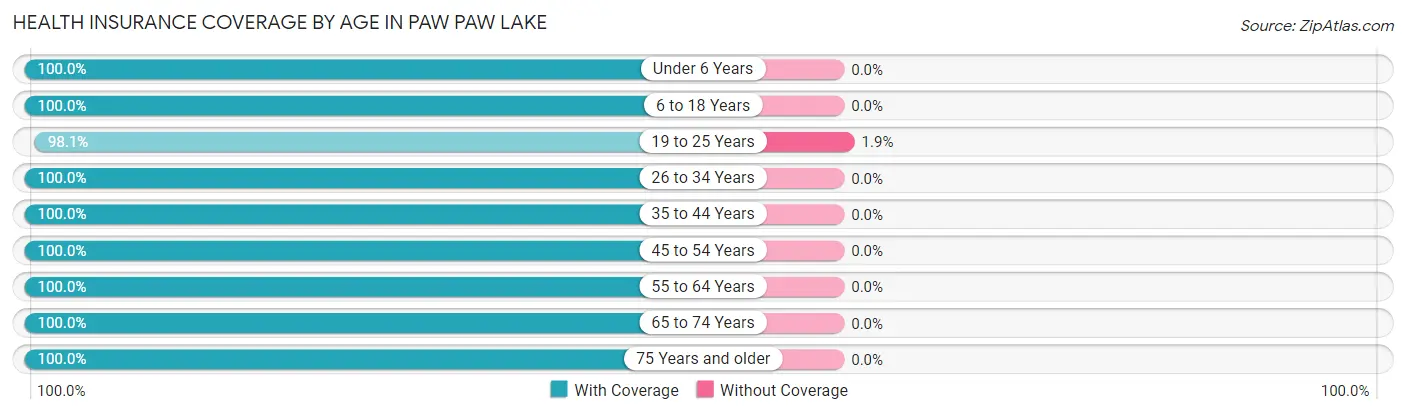
| Age Bracket | With Coverage | Without Coverage |
| Under 6 Years | 447 (100.0%) | 0 (0.0%) |
| 6 to 18 Years | 299 (100.0%) | 0 (0.0%) |
| 19 to 25 Years | 457 (98.1%) | 9 (1.9%) |
| 26 to 34 Years | 254 (100.0%) | 0 (0.0%) |
| 35 to 44 Years | 402 (100.0%) | 0 (0.0%) |
| 45 to 54 Years | 297 (100.0%) | 0 (0.0%) |
| 55 to 64 Years | 612 (100.0%) | 0 (0.0%) |
| 65 to 74 Years | 358 (100.0%) | 0 (0.0%) |
| 75 Years and older | 508 (100.0%) | 0 (0.0%) |
| Total | 3,634 (99.8%) | 9 (0.3%) |
Health Insurance Coverage by Citizenship Status in Paw Paw Lake
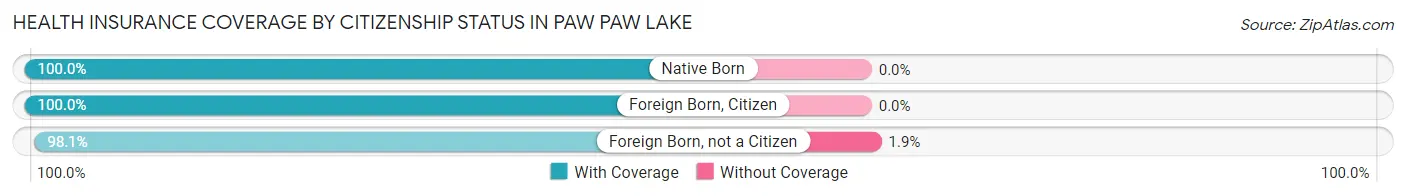
| Citizenship Status | With Coverage | Without Coverage |
| Native Born | 447 (100.0%) | 0 (0.0%) |
| Foreign Born, Citizen | 299 (100.0%) | 0 (0.0%) |
| Foreign Born, not a Citizen | 457 (98.1%) | 9 (1.9%) |
Health Insurance Coverage by Household Income in Paw Paw Lake
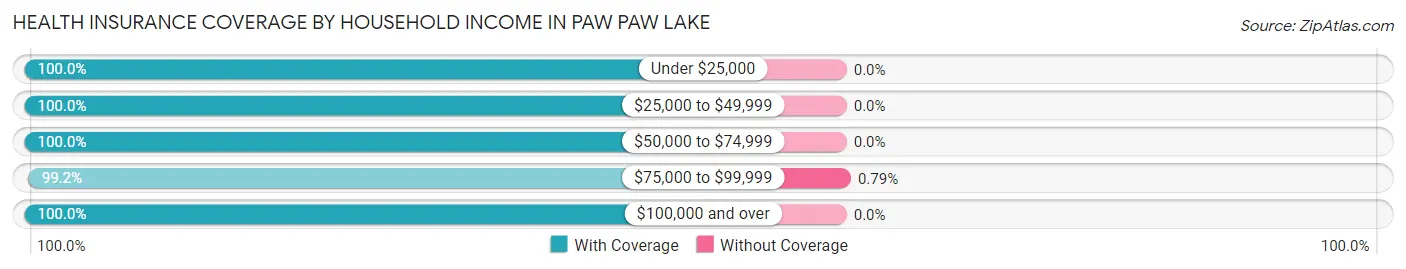
| Household Income | With Coverage | Without Coverage |
| Under $25,000 | 816 (100.0%) | 0 (0.0%) |
| $25,000 to $49,999 | 579 (100.0%) | 0 (0.0%) |
| $50,000 to $74,999 | 597 (100.0%) | 0 (0.0%) |
| $75,000 to $99,999 | 627 (99.2%) | 5 (0.8%) |
| $100,000 and over | 1,003 (100.0%) | 0 (0.0%) |
Public vs Private Health Insurance Coverage by Age in Paw Paw Lake
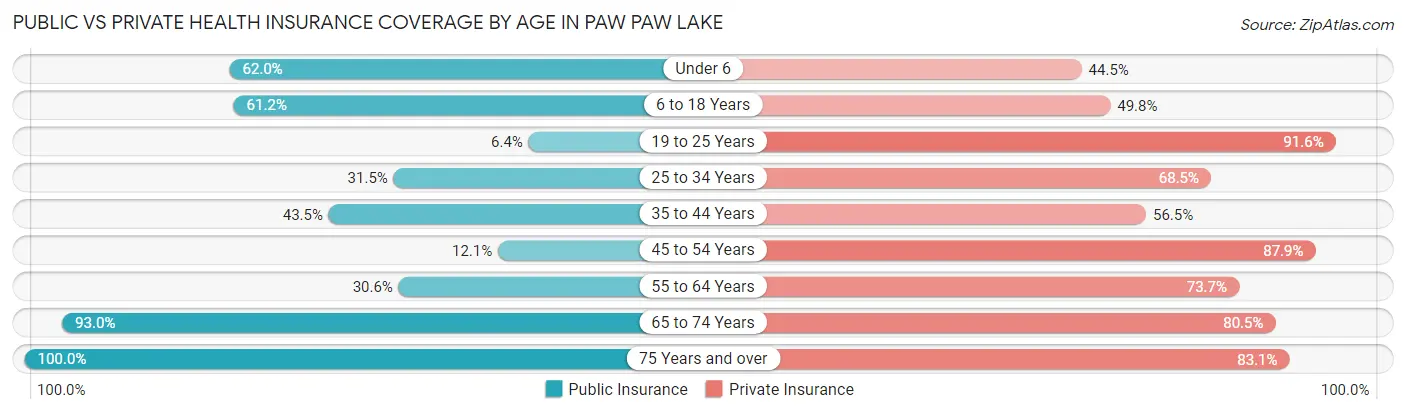
| Age Bracket | Public Insurance | Private Insurance |
| Under 6 | 277 (62.0%) | 199 (44.5%) |
| 6 to 18 Years | 183 (61.2%) | 149 (49.8%) |
| 19 to 25 Years | 30 (6.4%) | 427 (91.6%) |
| 25 to 34 Years | 80 (31.5%) | 174 (68.5%) |
| 35 to 44 Years | 175 (43.5%) | 227 (56.5%) |
| 45 to 54 Years | 36 (12.1%) | 261 (87.9%) |
| 55 to 64 Years | 187 (30.6%) | 451 (73.7%) |
| 65 to 74 Years | 333 (93.0%) | 288 (80.4%) |
| 75 Years and over | 508 (100.0%) | 422 (83.1%) |
| Total | 1,809 (49.7%) | 2,598 (71.3%) |
Disability Status by Sex by Age in Paw Paw Lake
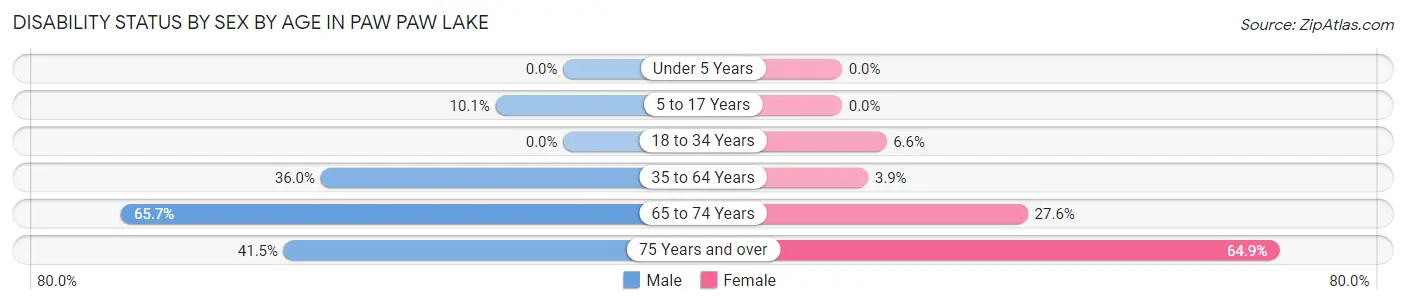
| Age Bracket | Male | Female |
| Under 5 Years | 0 (0.0%) | 0 (0.0%) |
| 5 to 17 Years | 32 (10.1%) | 0 (0.0%) |
| 18 to 34 Years | 0 (0.0%) | 25 (6.6%) |
| 35 to 64 Years | 202 (36.0%) | 29 (3.9%) |
| 65 to 74 Years | 90 (65.7%) | 61 (27.6%) |
| 75 Years and over | 83 (41.5%) | 200 (64.9%) |
Disability Class by Sex by Age in Paw Paw Lake
Disability Class: Hearing Difficulty
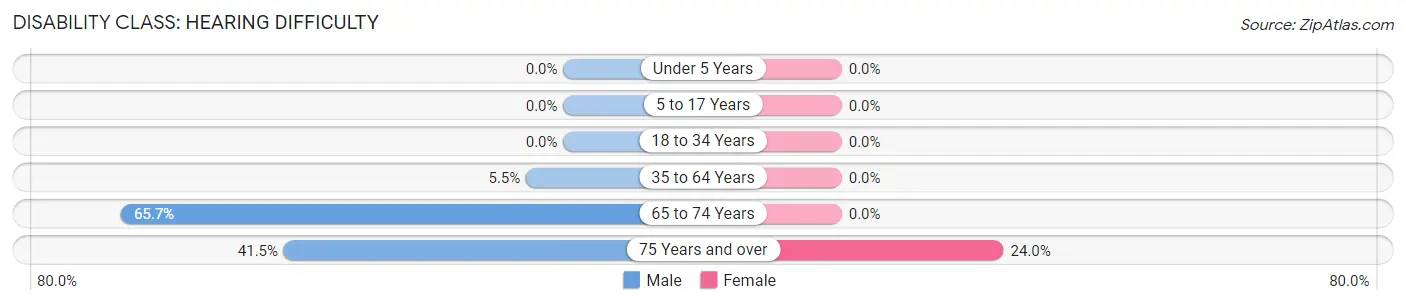
| Age Bracket | Male | Female |
| Under 5 Years | 0 (0.0%) | 0 (0.0%) |
| 5 to 17 Years | 0 (0.0%) | 0 (0.0%) |
| 18 to 34 Years | 0 (0.0%) | 0 (0.0%) |
| 35 to 64 Years | 31 (5.5%) | 0 (0.0%) |
| 65 to 74 Years | 90 (65.7%) | 0 (0.0%) |
| 75 Years and over | 83 (41.5%) | 74 (24.0%) |
Disability Class: Vision Difficulty
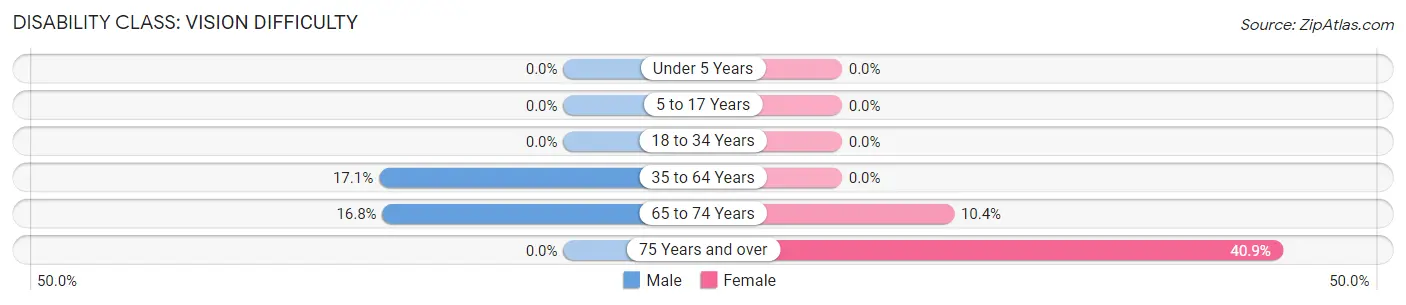
| Age Bracket | Male | Female |
| Under 5 Years | 0 (0.0%) | 0 (0.0%) |
| 5 to 17 Years | 0 (0.0%) | 0 (0.0%) |
| 18 to 34 Years | 0 (0.0%) | 0 (0.0%) |
| 35 to 64 Years | 96 (17.1%) | 0 (0.0%) |
| 65 to 74 Years | 23 (16.8%) | 23 (10.4%) |
| 75 Years and over | 0 (0.0%) | 126 (40.9%) |
Disability Class: Cognitive Difficulty
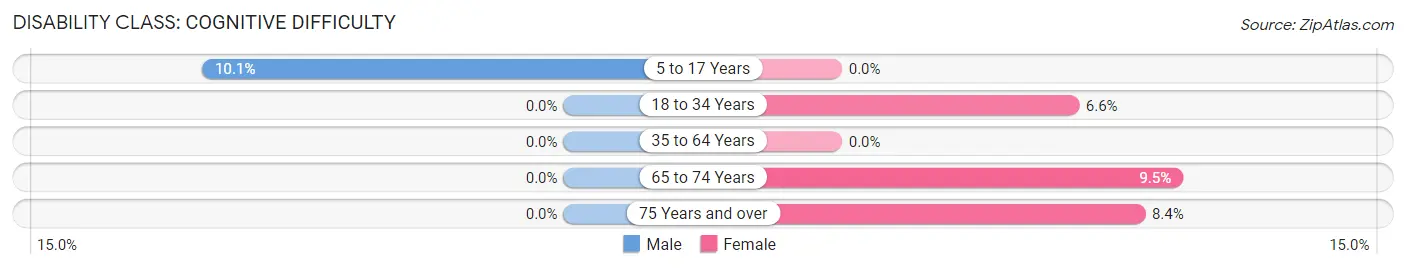
| Age Bracket | Male | Female |
| 5 to 17 Years | 32 (10.1%) | 0 (0.0%) |
| 18 to 34 Years | 0 (0.0%) | 25 (6.6%) |
| 35 to 64 Years | 0 (0.0%) | 0 (0.0%) |
| 65 to 74 Years | 0 (0.0%) | 21 (9.5%) |
| 75 Years and over | 0 (0.0%) | 26 (8.4%) |
Disability Class: Ambulatory Difficulty
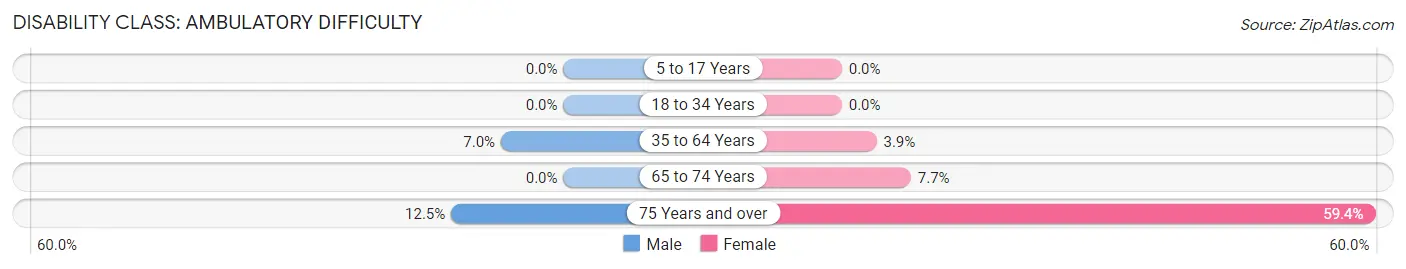
| Age Bracket | Male | Female |
| 5 to 17 Years | 0 (0.0%) | 0 (0.0%) |
| 18 to 34 Years | 0 (0.0%) | 0 (0.0%) |
| 35 to 64 Years | 39 (7.0%) | 29 (3.9%) |
| 65 to 74 Years | 0 (0.0%) | 17 (7.7%) |
| 75 Years and over | 25 (12.5%) | 183 (59.4%) |
Disability Class: Self-Care Difficulty
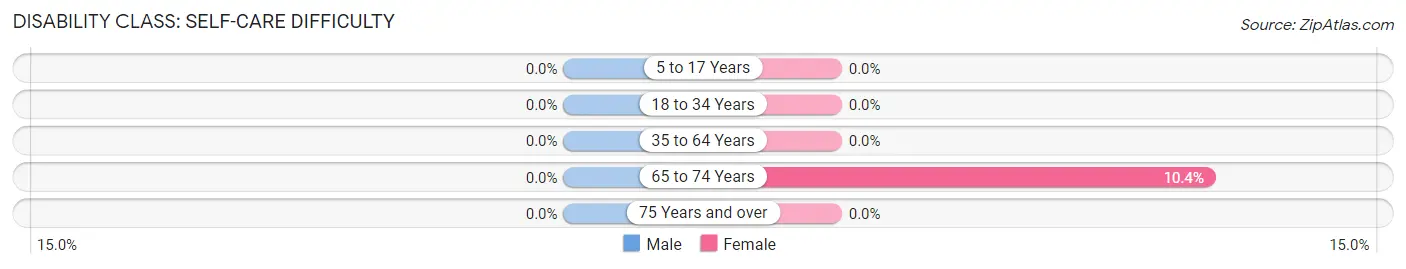
| Age Bracket | Male | Female |
| 5 to 17 Years | 0 (0.0%) | 0 (0.0%) |
| 18 to 34 Years | 0 (0.0%) | 0 (0.0%) |
| 35 to 64 Years | 0 (0.0%) | 0 (0.0%) |
| 65 to 74 Years | 0 (0.0%) | 23 (10.4%) |
| 75 Years and over | 0 (0.0%) | 0 (0.0%) |
Technology Access in Paw Paw Lake
Computing Device Access in Paw Paw Lake
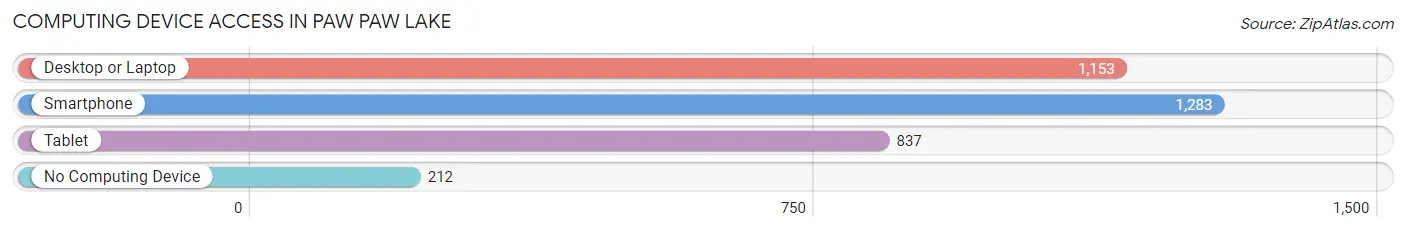
| Device Type | # Households | % Households |
| Desktop or Laptop | 1,153 | 73.0% |
| Smartphone | 1,283 | 81.2% |
| Tablet | 837 | 53.0% |
| No Computing Device | 212 | 13.4% |
| Total | 1,580 | 100.0% |
Internet Access in Paw Paw Lake
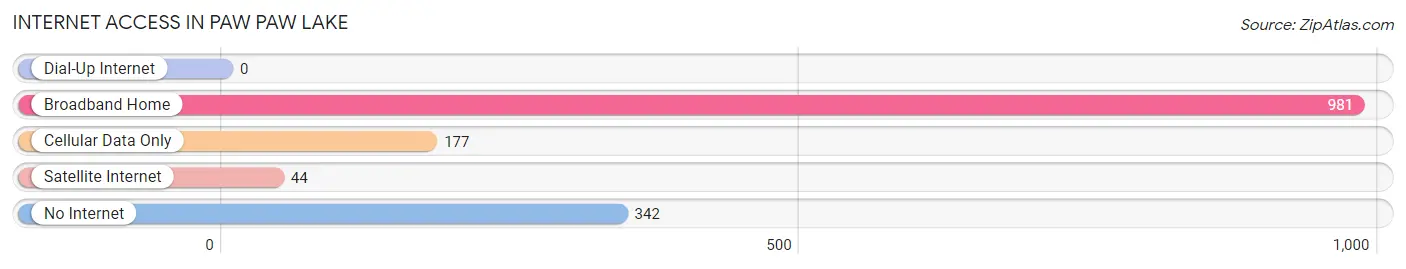
| Internet Type | # Households | % Households |
| Dial-Up Internet | 0 | 0.0% |
| Broadband Home | 981 | 62.1% |
| Cellular Data Only | 177 | 11.2% |
| Satellite Internet | 44 | 2.8% |
| No Internet | 342 | 21.6% |
| Total | 1,580 | 100.0% |
Paw Paw Lake Summary
Paw Paw Lake is a small lake located in Berrien County, Michigan. It is located in the southwestern corner of the state, near the Indiana border. The lake is approximately 1,000 acres in size and is the largest natural lake in the county. It is a popular destination for fishing, swimming, boating, and other recreational activities.
Geography
Paw Paw Lake is located in the southwestern corner of Berrien County, Michigan. It is approximately 1,000 acres in size and is the largest natural lake in the county. The lake is surrounded by the towns of Watervliet, Coloma, and Hartford. The lake is fed by the Paw Paw River, which flows from the north and empties into the lake. The lake is also connected to the St. Joseph River, which flows from the south and empties into Lake Michigan.
The lake is relatively shallow, with an average depth of only 10 feet. The lake is surrounded by a variety of habitats, including wetlands, woodlands, and grasslands. The lake is home to a variety of fish species, including largemouth bass, bluegill, crappie, and northern pike.
Economy
Paw Paw Lake is a popular destination for fishing, swimming, boating, and other recreational activities. The lake is home to several marinas, which offer boat rentals, fishing supplies, and other services. The lake is also home to several resorts, which offer lodging, dining, and other amenities.
The lake is also home to several businesses, including restaurants, convenience stores, and gas stations. The lake is also home to several wineries, which offer tastings and tours.
Demographics
The population of Paw Paw Lake is approximately 2,000 people. The majority of the population is white (90%), followed by African American (4%), Hispanic (2%), and Asian (1%). The median household income is $45,000, and the median home value is $150,000.
The majority of the population is employed in the service industry (30%), followed by manufacturing (20%), retail (15%), and healthcare (10%). The unemployment rate is 4%, which is lower than the national average.
Conclusion
Paw Paw Lake is a small lake located in Berrien County, Michigan. It is a popular destination for fishing, swimming, boating, and other recreational activities. The lake is home to several businesses, including restaurants, convenience stores, and gas stations. The population of Paw Paw Lake is approximately 2,000 people, and the majority of the population is employed in the service industry. The lake is also home to several wineries, which offer tastings and tours.
Common Questions
What is Per Capita Income in Paw Paw Lake?
Per Capita income in Paw Paw Lake is $33,776.
What is the Median Family Income in Paw Paw Lake?
Median Family Income in Paw Paw Lake is $74,053.
What is the Median Household income in Paw Paw Lake?
Median Household Income in Paw Paw Lake is $58,260.
What is Income or Wage Gap in Paw Paw Lake?
Income or Wage Gap in Paw Paw Lake is 40.8%.
Women in Paw Paw Lake earn 59.2 cents for every dollar earned by a man.
What is Inequality or Gini Index in Paw Paw Lake?
Inequality or Gini Index in Paw Paw Lake is 0.48.
What is the Total Population of Paw Paw Lake?
Total Population of Paw Paw Lake is 3,643.
What is the Total Male Population of Paw Paw Lake?
Total Male Population of Paw Paw Lake is 1,735.
What is the Total Female Population of Paw Paw Lake?
Total Female Population of Paw Paw Lake is 1,908.
What is the Ratio of Males per 100 Females in Paw Paw Lake?
There are 90.93 Males per 100 Females in Paw Paw Lake.
What is the Ratio of Females per 100 Males in Paw Paw Lake?
There are 109.97 Females per 100 Males in Paw Paw Lake.
What is the Median Population Age in Paw Paw Lake?
Median Population Age in Paw Paw Lake is 43.4 Years.
What is the Average Family Size in Paw Paw Lake
Average Family Size in Paw Paw Lake is 2.8 People.
What is the Average Household Size in Paw Paw Lake
Average Household Size in Paw Paw Lake is 2.3 People.
How Large is the Labor Force in Paw Paw Lake?
There are 1,555 People in the Labor Forcein in Paw Paw Lake.
What is the Percentage of People in the Labor Force in Paw Paw Lake?
53.2% of People are in the Labor Force in Paw Paw Lake.
What is the Unemployment Rate in Paw Paw Lake?
Unemployment Rate in Paw Paw Lake is 6.2%.